opportunity day h1/2016 ichitan group pcl. thursday
TRANSCRIPT

Opportunity Day
Q1/2020 Performance
ICHITAN GROUP PLC. 19th May, 2020
@ 11:20 hrs. @ Live via Electronic Device through SET Channel
1

The following presentation may contain forward looking statements by executive of Ichitan Group Public Company Limited (the Company), related to financial or other tendency for future periods, compared with the results for previous periods. Some of the statements contained in this presentation that are not historical facts but these are statements of future estimations with respect to the financial conditions, results of operations and businesses, and related plans and objectives. Disclaimer information is based on management’s current views and assumptions including, but not limited to, prevailing economic and market conditions. These statements involve known and unknown risks and uncertainties that could cause actual results, performance or events to differ materially from those in the statements as originally made. Such statements are not, and should not be constructed as a representation as to future performance of the Company. In addition, such statements should not be regarded as a forecast or projection of future performance of the Company. It should be noted that the actual performance of the Company may vary significantly from such statements in this presentation.
DISCLAIMER
2

Contents
Overview & Financial Information CORPORATE OVERVIEW & FINANCIAL HIGHLIGHT
BUSINESS INFORMATION
ICHITAN STRATEGY : 3N
(NEW Product/Market/Business)
INDONESIA
3

Corporate Overview Stock symbol ICHI The Company’s name
“EXCELLENT” CG Corporate Governance
Ichitan Group PLC.
LISTED IN THSI Index
Certified CAC
Registered capital (Fully Paid) 1,300 million Baht
Market/Index Industry/ Sector
SET / SET CLMV/SET THSI Agro & Food Industry /Food & Beverage
SCAN more about ICHITAN
Dividend Policy No less than 40% of net profits after taxes and legal reserve considering from consolidated financial statements (with additional conditions)
4
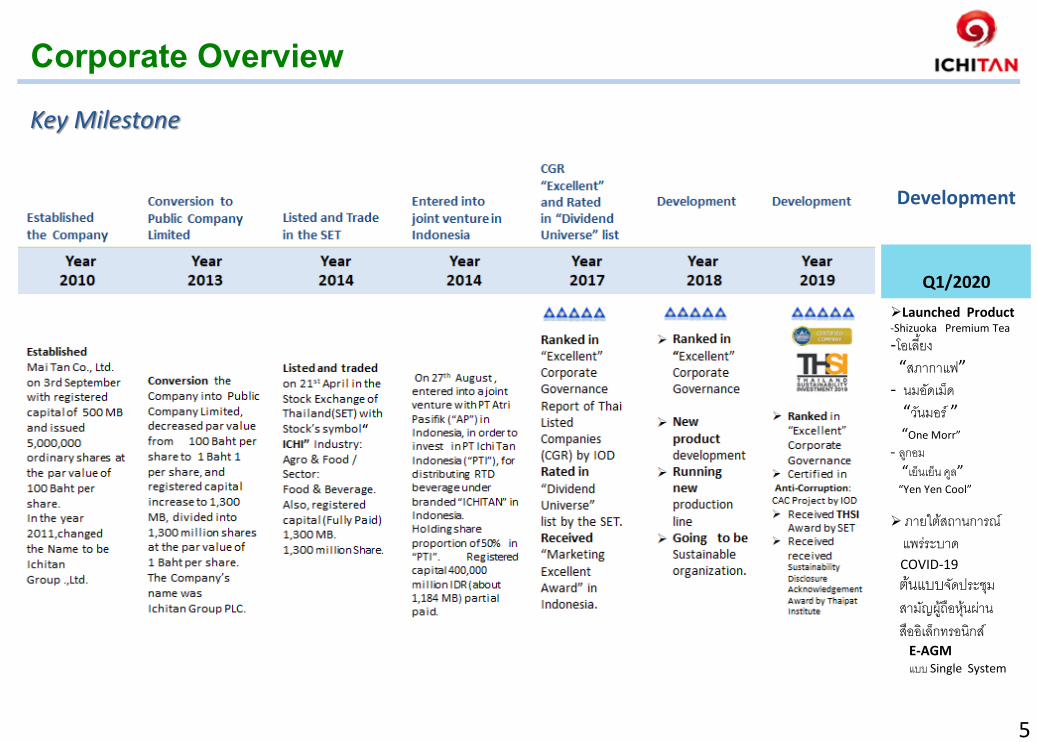
Corporate Overview Key Milestone
Development
Q1/2020
Launched Product -Shizuoka Premium Tea
-โอเลยง “สภากาแฟ” - นมอดเมด “วนมอร ” “One Morr”
- ลกอม “เยนเยน คล” “Yen Yen Cool”
ภายใตสถานการณ แพรระบาด COVID-19
ตนแบบจดประชม สามญผถอหนผาน สออเลกทรอนกส
E-AGM แบบ Single System
5
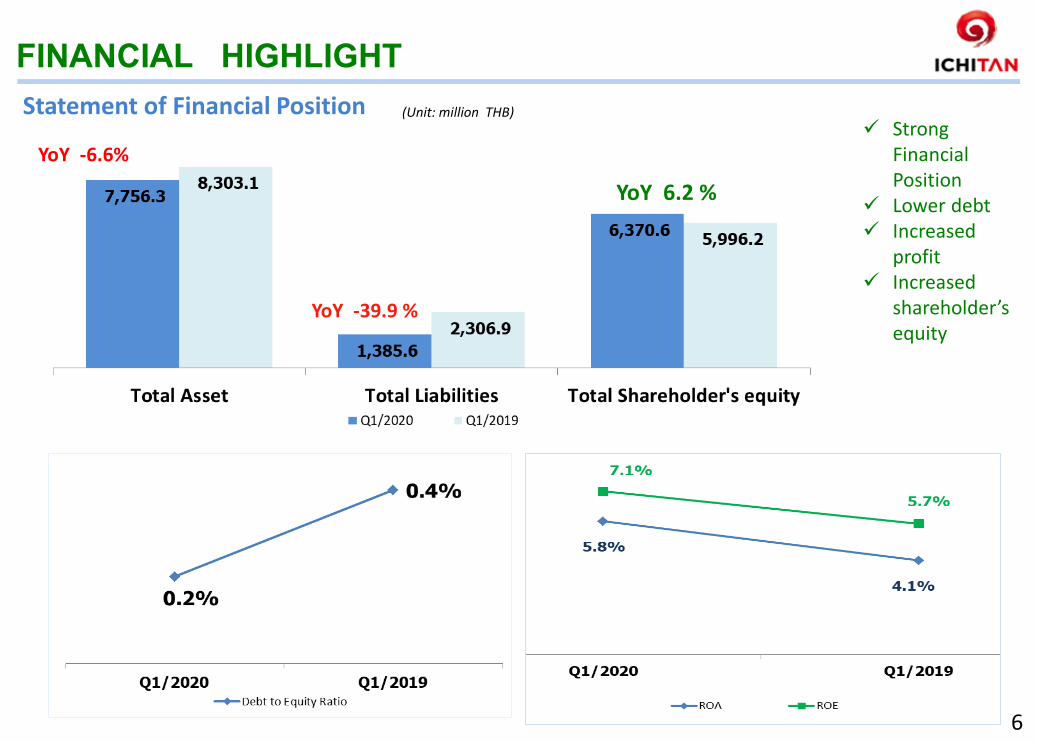
FINANCIAL HIGHLIGHT Statement of Financial Position (Unit: million THB)
YoY -6.6%
YoY -39.9 %
YoY 6.2 %
Strong
Financial Position
Lower debt Increased
profit Increased
shareholder’s equity
6

FINANCIAL HIGHLIGHT (Unit: million THB)
International: YoY -18.4% Domestic: YoY + 5.0%
Q1/2020 Q4/2019 Q3/2019 Q2/2019 Q1/2019
DOMESTIC 936.5 938.1 825.4 1,200.2 891.6
INTERNATIONAL 348.9 296.3 309.9 444.9 427.7
7

FINANCIAL HIGHLIGHT (UNIT: million THB) EXPENSES
- 54.7%
17.8%
- 34.7%
8

FINANCIAL HIGHLIGHT Share of profit (loss) of Investment in Joint Venture
Increased in Share of JV Investment
YoY +229.7%
Q1/2020 Q4/2019 Q3/2019 Q2/2019 Q1/2019 YoY%
Share of loss of investment
in Joint venture 8.3 -19.8 1.3 -4.8 -6.4 229.7%
(Unit : million Baht)
Consolidated Financial Statement
(Unit: million THB)
9

159.2
114.2
12.4%
8.7%
-
20.0
40.0
60.0
80.0
100.0
120.0
140.0
160.0
180.0
0.0%
2.0%
4.0%
6.0%
8.0%
10.0%
12.0%
14.0%
Q1/2020 Q1/2019
Net Profit NPM (%)
NET PROFIT
YoY +39.4%
FINANCIAL HIGHLIGHT (UNIT: million THB)
10

FINANCIAL HIGHLIGHT
Q1/2020 Q4/2019 Q3/2019 Q2/2019 Q1/2019 YoY%
Revenues from sale of Goods 1,285.4 1,234.4 1,135.4 1,645.1 1,319.4 -2.6%
Total Revenues 1,288.0 1,238.4 1,138.1 1,648.3 1,322.9 -2.6%
Cost of Sell of Goods 1,033.1 1,024.3 931.4 1,326.8 1,060.4 -2.6%Distribution Expenses (incl. Marketing&Promotion cost) 62.4 75.7 91.2 144.8 95.5 -34.7%
Administrative Expenses 43.0 54.1 38.2 40.6 36.5 17.8%
Finance Costs 5.3 6.9 8.1 -10.2 11.7 -54.7%
Total Expenses 1,143.8 1,161.0 1,068.9 1,522.3 1,204.1 -5.0%
Share of profit (loss) of investment
in Joint venture 8.3 -19.8 1.3 -4.8 -6.4 229.7%
EBITDA 305.2 210.3 224.1 273.6 264.6 15.3%
Gross Profit 252.3 210.1 204.0 318.3 259.0 -2.6%
Net Profit (Loss) 159.2 83.8 72.6 136.8 114.2 39.4%
Profitability Ratio
Selling (%) 4.9% 6.1% 8.0% 8.8% 7.2%
Admin (%) 3.3% 4.4% 3.4% 2.5% 2.8%
Gross Profit Margin (%) 19.6% 17.0% 18.0% 19.3% 19.6%
Net Profit Margin (%) 12.4% 6.8% 6.4% 8.3% 8.7%
EBITDA (%) 23.7% 17.0% 19.7% 16.6% 20.1%
(Unit : million Baht)
Consolidated Financial Statement
11

Contents
Overview & Financial Information CORPORATE OVERVIEW & FINANCIAL HIGHLIGHT
BUSINESS INFORMATION
ICHITAN STRATEGY : 3N
(NEW Product/Market/Business)
INDONESIA
12
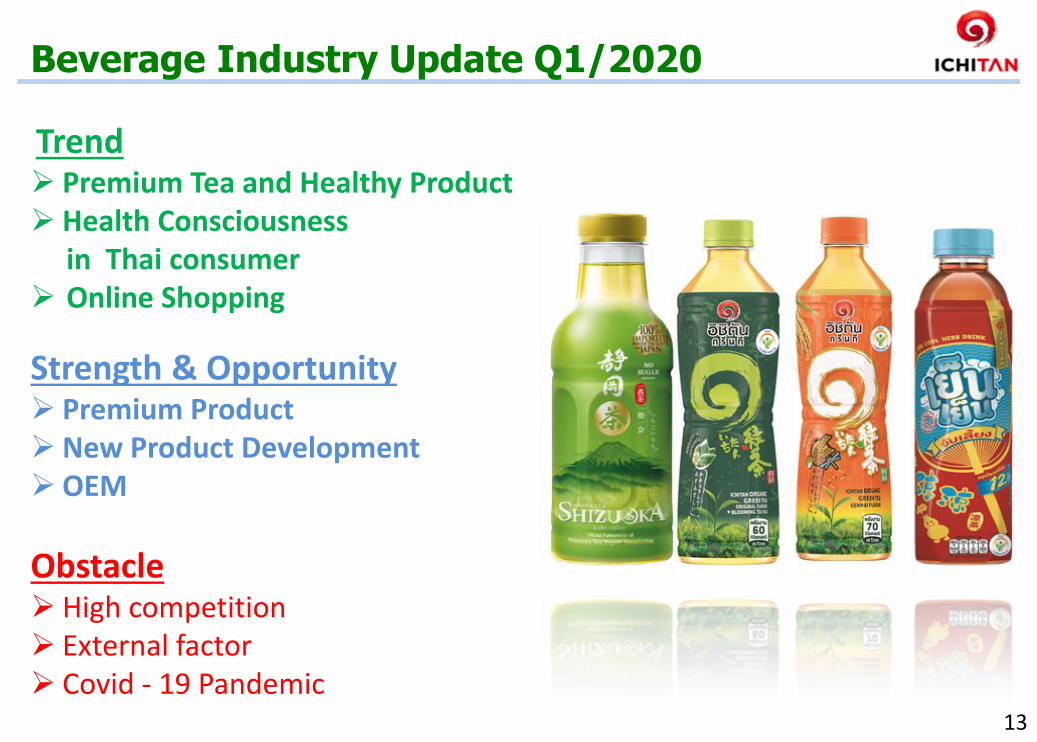
Beverage Industry Update Q1/2020
Trend Premium Tea and Healthy Product Health Consciousness in Thai consumer Online Shopping
Strength & Opportunity Premium Product New Product Development OEM
Obstacle High competition External factor Covid - 19 Pandemic
13

Summer Summer
33.0 31.8
24.9 24.6 23.0 22.4
28.4 28.5 28.5
24.9 24.7 23.0 22.2
24.7 23.1 24.1 22.9 22.3
28.2 30.7 31.7
26.3 27.0 24.1
21.6
24.6 23.4 23.1 22.9
21.1
24.4
1,121 1,106
987 970 918
881
1,109 1,116 1,099
983 986 960
911
1,006 950 973
923 894
1,132
1,229 1,236
1,047 1,065
998
899
1,036
961 919 941
860
982
0.0
5.0
10.0
15.0
20.0
25.0
30.0
35.0
0.0
200.0
400.0
600.0
800.0
1,000.0
1,200.0
1,400.0
SEP17
OCT17
NO
V17
DEC17
JAN
18
FEB18
MAR
18
APR18
MAY18
JUN
18
JUL18
AU
G18
SEP18
OCT18
NO
V18
DEC18
JAN
19
FEB19
MAR19
APR19
MAY19
JUN
19
JUL19
AU
G19
SEP19
OCT19
NO
V19
DEC19
JAN
20
FEB20
MAR
20
Total Thailand : RTD Tea
Volume Sales (MM) Value Sales (MM)
73.4
68.5
2,949 2,782
66.0
67.0
68.0
69.0
70.0
71.0
72.0
73.0
74.0
0.0
500.0
1,000.0
1,500.0
2,000.0
2,500.0
3,000.0
3,500.0
YTD 2019 YTD 2020
Total Thailand : RTD Tea
Volume Sales (MM) Value Sales (MM)
-5.6% Value
-6.7% Volume
RTD Tea Market size & % Growth in Q1/2020
14
15,968 15,574 15,000
13,237 11,951
12,320
0
2,000
4,000
6,000
8,000
10,000
12,000
14,000
16,000
18,000
Yr2014 Yr2015 Yr2016 Yr2017 Yr2018 Yr2019
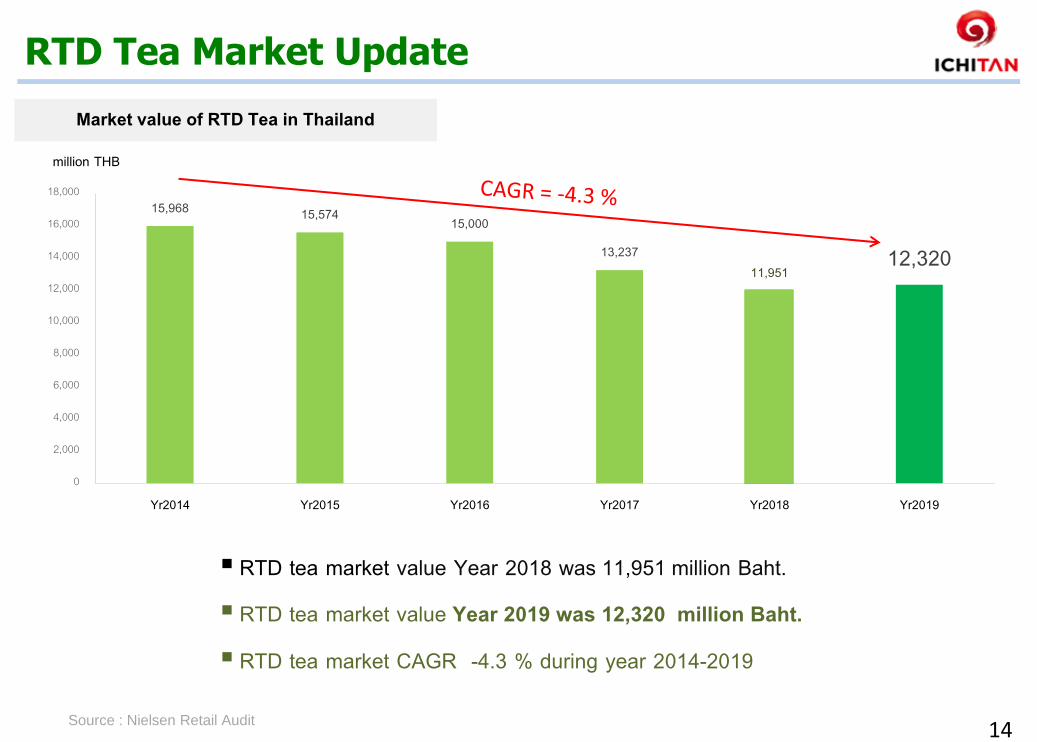
RTD Tea Market Update
RTD tea market value Year 2018 was 11,951 million Baht.
RTD tea market value Year 2019 was 12,320 million Baht.
RTD tea market CAGR -4.3 % during year 2014-2019
Market value of RTD Tea in Thailand
million THB
Source : Nielsen Retail Audit 14

Source : Nielsen Retail Audit
RTD Tea Market by Segment in Q1/2020
67%
11%
9%
12%
ICHITAN GT 280 ml
ICHITAN GT 420 ml
Growth +70.73%
Growth -6.23%
140
82
241
257
105
111
90
124
YenYen 400 ml Growth -27.42%
YenYen 315 ml Growth -5.41%
45
38
87
90
Shizuoka Growth -3.33%
ChewChew Growth +18.42%
2,782 MB
Market Growth -5.6%
Growth -3.5%
Growth -28.1%
Growth +6.5%
Growth -1.5%
15
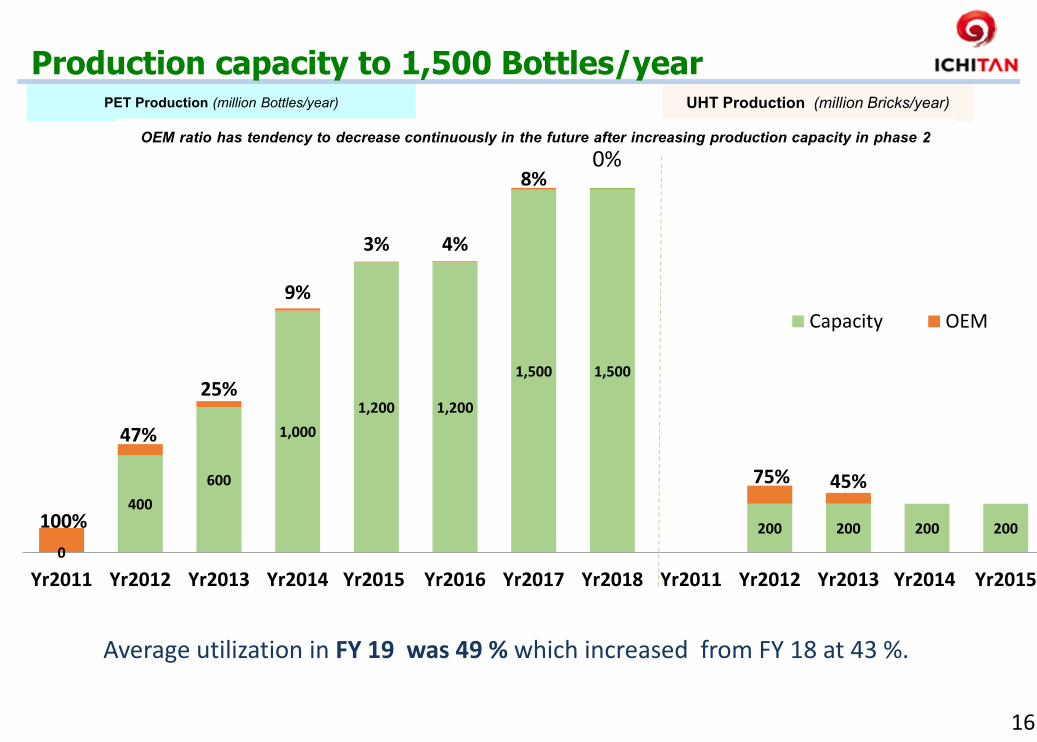
Production capacity to 1,500 Bottles/year PET Production (million Bottles/year) UHT Production (million Bricks/year)
OEM ratio has tendency to decrease continuously in the future after increasing production capacity in phase 2
0
400
600
1,000
1,200 1,200
1,500 1,500
200 200 200 200 100%
47%
25%
9%
3% 4%
8%
75% 45%
Yr2011 Yr2012 Yr2013 Yr2014 Yr2015 Yr2016 Yr2017 Yr2018 Yr2011 Yr2012 Yr2013 Yr2014 Yr2015
Capacity OEM
0%
Average utilization in FY 19 was 49 % which increased from FY 18 at 43 %.
16

ICHITAN Sales by Brand / International
Q1/2019 Q1/2020
41.5%
24.3% 1.7%
32.4%
51.9%
19.4%
1.5%
27.1%
1,319.4 mill THB
1,285.4 mill THB
17

Numeric Distribution: TT
6 9
13 16
18 18 18 21
24 25 26 30 31
33 36 37 37 37
35 37 36 36 36 36
38
0
10
22
28
33 36 37 38 38 39
41 40 43
45 44 43 44 46 47 47 48
46 48 47 48
0
10
20
30
40
50
60
MA
R1
8
AP
R1
8
MA
Y18
JUN
18
JUL1
8
AU
G1
8
SEP
18
OC
T18
NO
V1
8
DEC
18
JAN
19
FEB
19
MA
R1
9
AP
R1
9
MA
Y19
JUN
19
JUL1
9
AU
G1
9
SEP
19
OC
T19
NO
V1
9
DEC
19
JAN
20
FEB
20
MA
R2
0
Numberic Distribution Open Trade
280 Ml Ichitan Honey Lemon 350 Ml Main Competitor Honey Lemon
13 13 15
13 14 14 16 15 15
17 16 15
21
25 26
22 24 23
21 23 22 21
24 21
26
13 13 12 12 12 12
14 12
14 14 12
15 15 17 16 15 14
13 14 13
15 15 13
15
-
5
10
15
20
25
30
MA
R1
8
AP
R1
8
MA
Y18
JUN
18
JUL1
8
AU
G1
8
SEP
18
OC
T18
NO
V1
8
DEC
18
JAN
19
FEB
19
MA
R1
9
AP
R1
9
MA
Y19
JUN
19
JUL1
9
AU
G1
9
SEP
19
OC
T19
NO
V1
9
DEC
19
JAN
20
FEB
20
MA
R2
0Volume per Outlet (Unit)
280 Ml Ichitan Honey Lemon 350 Ml Main Competitor Honey Lemon
35 36 38 38 39 39 39 40 40 40
42 44 45 45 46 47
45 43 43 43
45 45 46 44 43
29
37
41 42 45 45 45 44 44
42 43 44 44 43 44 43 44 42 42 42 41
38 38 39
35
0
5
10
15
20
25
30
35
40
45
50
MA
R1
8
AP
R1
8
MA
Y18
JUN
18
JUL1
8
AU
G1
8
SEP
18
OC
T18
NO
V1
8
DEC
18
JAN
19
FEB
19
MA
R1
9
AP
R1
9
MA
Y19
JUN
19
JUL1
9
AU
G1
9
SEP
19
OC
T19
NO
V1
9
DEC
19
JAN
20
FEB
20
MA
R2
0
Numberic Distribution Open Trade
315 Ml Yen Yen 350 Ml Main Competitor Herbal
21 22 24
22 22 19 20
23 21 22
18 17
21 23 24
21 22 20
18 19
18 18 16 16
18 19 21 21
19 18 18 17 17 17 17 15
13
17 16 20
17 16 16 14
16 14 14 14
12 15
-
5
10
15
20
25
30
MA
R1
8
AP
R1
8
MA
Y18
JUN
18
JUL1
8
AU
G1
8
SEP
18
OC
T18
NO
V1
8
DEC
18
JAN
19
FEB
19
MA
R1
9
AP
R1
9
MA
Y19
JUN
19
JUL1
9
AU
G1
9
SEP
19
OC
T19
NO
V1
9
DEC
19
JAN
20
FEB
20
MA
R2
0
Volume per Outlet (Unit)
315 Ml Yen Yen 350 Ml Main Competitor Herbal 18

43.0%
29.9%
Distribution Channel : Q1/2020
1) Modern Trade
2) Traditional Trade
o Main International Market: Cambodia , Lao PDR, Myanmar, Vietnam,etcs Take note: % from total sales of beverage
72.9%
27.1%
Domestic
International
Domestic Growth
YoY +5.0%
Proportion of Distribution Channel
62.2%
3.9% 6.8%
DKSH SINGH IGT
Domestic
19

Strategy in FY 2020
20

FY 2020 : Expanding Portfolio to Stimulate Sales
GREEN TEA SEGMENT
ICHITAN Green Tea Berry Lemon Size: 280 ml Price: 10 THB/Bottle
Launch : Jan Channel : TT
ICHITAN Green Tea Kyoho Grape Size: 280 ml Price: 10 THB/Bottle
Launch : Feb Channel : TT 21

FY 2020 : Expanding Portfolio to Stimulate Sales
GREEN TEA SEGMENT
ICHITAN Green Tea Honey Lemon Icy Mint Size: 420 ml Price: 20 THB/Bottle
Launch : Mar Channel : Nationwide
22

FY 2020 : Expanding Portfolio to Stimulate Sales
GREEN TEA SEGMENT
Shizuoka Tencha Matcha Honey Size: 440 ml Price: 30 THB/Bottle
Launch : Apr Channel : 7 Eleven
Shizuoka Gyokuro No Sugar Size: 440 ml Price: 30 THB/Bottle
Launch : Apr Channel : Nationwide
23

HERBAL SEGMENT : รอนรอน เผดเผด สดวย “เยนเยน”
Yen Yen Sala and Red Date Size: 315 ml Price: 10 THB/Bottle
Launch : Jan Channel : TT
Yen Yen Sala and Red Date Size: 400 ml Price: 15 THB/Bottle
Launch : Feb Channel : Nationwide
FY 2020 : Expanding Portfolio to Stimulate Sales
24

HERBAL SEGMENT : รอนรอน เผดเผด สดวย “เยนเยน”
Yen Yen Super Cooling Size: 400 ml Price: 15 THB/Bottle
Launch : Mar Channel : Nationwide
FY 2020 : Expanding Portfolio to Stimulate Sales
25

ICHITAN x FreeFire
The Return Of
ICHITAN x FREEFIRE
“อชตน รหสลา คาเพลลา ลนซงมอเตอรไซด FREE FIRE” 10 APR - 24 JUN , 2020
FY 2020 :Collaboration with Strategic Partners
26

Contents
Overview & Financial Information CORPORATE OVERVIEW & FINANCIAL HIGHLIGHT
BUSINESS INFORMATION
ICHITAN STRATEGY : 3N
(NEW Product/Market/Business)
INDONESIA
27

รหรอไม น าทด ทเราดมควรจะมลกษณะอยางไร?
28
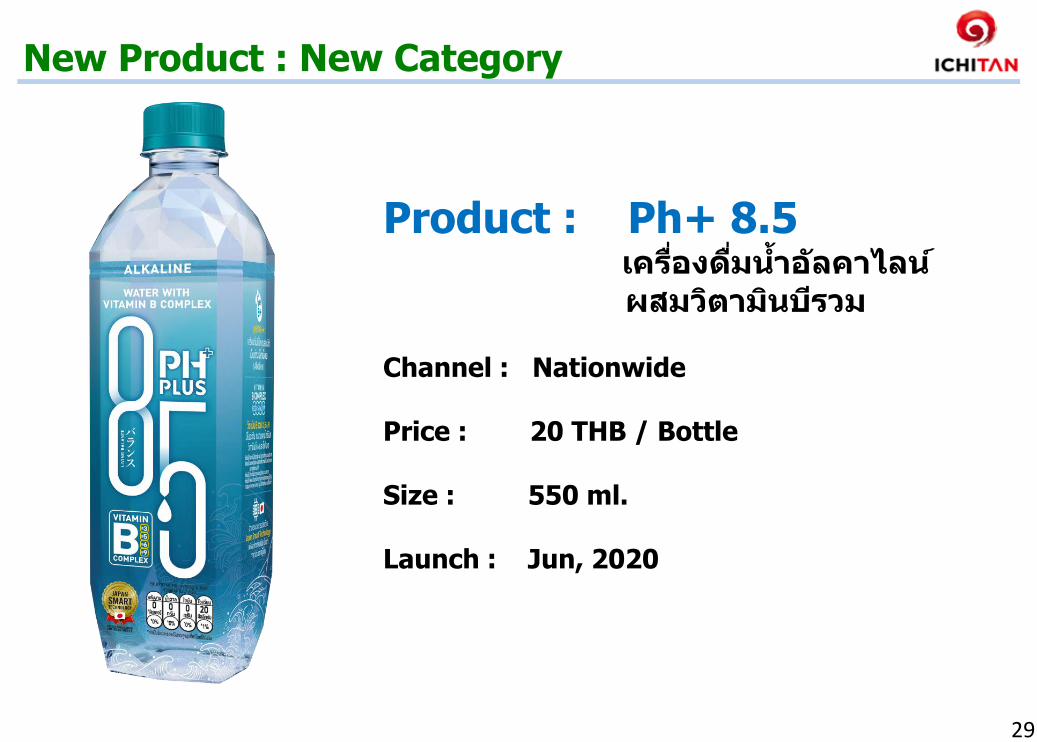
New Product : New Category
Product : Ph+ 8.5 เครองดมน าอลคาไลน ผสมวตามนบรวม Channel : Nationwide Price : 20 THB / Bottle Size : 550 ml. Launch : Jun, 2020
29

น าอลคาไลน ผสมวตามนบรวม ตรา PH+ 8.5
คนความสมดล และ เสรมสรางภมคมกน ใหรางกาย แขงแรง พรอมสโรค
30

เคร องดมทเสรมสรางภมคมกนส าหรบชวงน Online Shopping Channel :
https://www.facebook.com/phplusdrink
New Product : New Category
31

New Market : CLMV Economic situation
Decreasing of
Export
Supply Chain Disruption
Decreasing
of Tourist Sector
Slowdown of
Foreign Direct Investment
(FDI)
Decline of Private Sector
Demand
Higher Unemployment
Rate CLMV Economic in year 2020, there is potential to growth but some factors need to be concerned.
32

Cambodia • EU will withdraw part of tariff preferences to
Cambodia under EBA. • Cambodia's economy may slow down to 2.5 %
due to COVID-19 pandemic.
Myanmar • Myanmar remains a country in transition and
a perceived deterioration in the political situation could lead to decrease in the amount of foreign direct investment,
hindering growth.
Laos • Laos's economy may slow down due to COVID-19 pandemic and FDI. • Major export market and source of investment, have to depend on China.
Vietnam • Covid-19 pandemic has highly impact on
Vietnam as main source of income come from tourism and retail industry.
• GDP in Q1/ 2020 slowed down to 3.82% (YoY).
New Market : Export, Economic Outlook Q1/2020
33
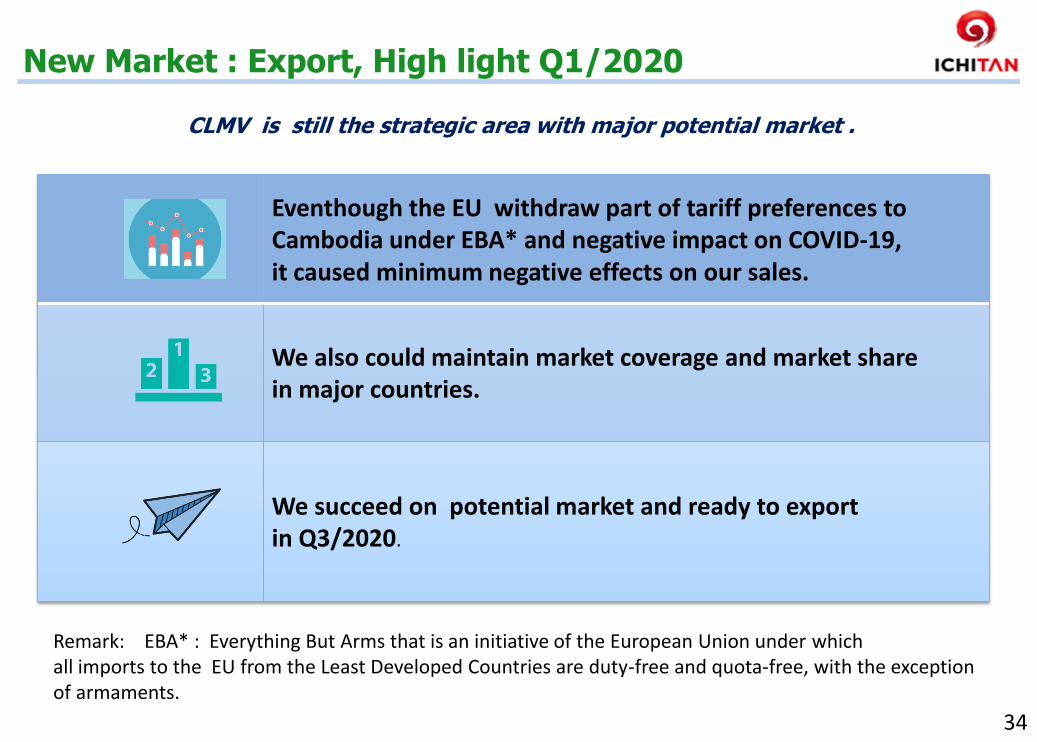
New Market : Export, High light Q1/2020
Eventhough the EU withdraw part of tariff preferences to Cambodia under EBA* and negative impact on COVID-19, it caused minimum negative effects on our sales.
We also could maintain market coverage and market share in major countries.
We succeed on potential market and ready to export in Q3/2020.
Remark: EBA* : Everything But Arms that is an initiative of the European Union under which all imports to the EU from the Least Developed Countries are duty-free and quota-free, with the exception of armaments.
CLMV is still the strategic area with major potential market .
34
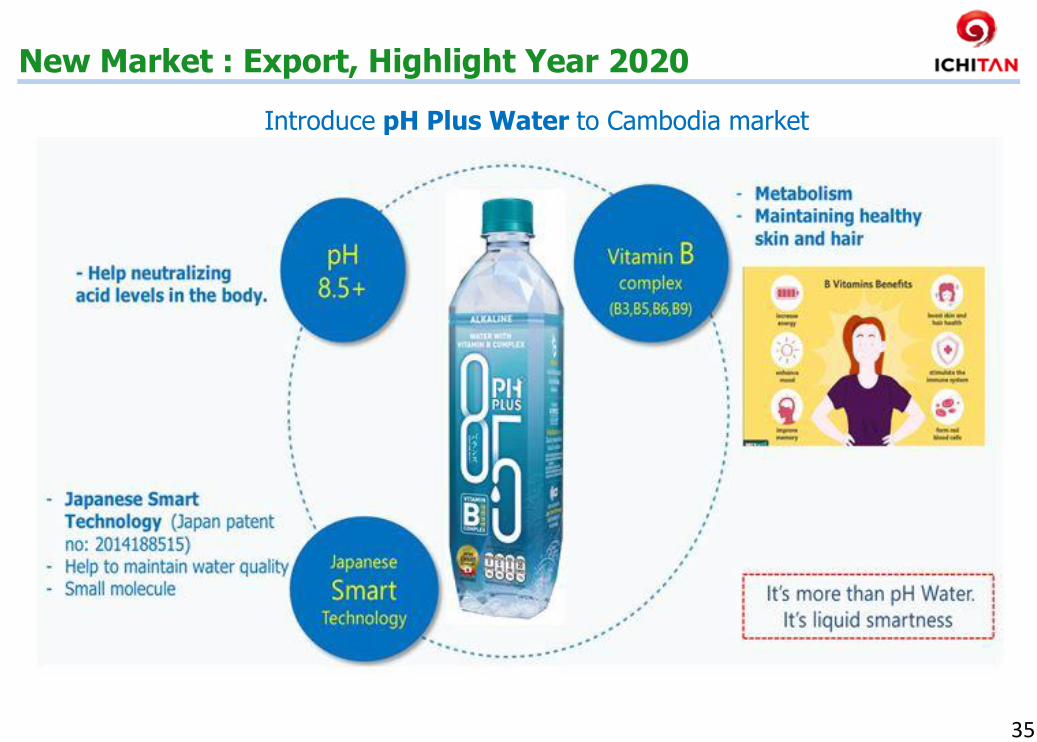
New Market : Export, Highlight Year 2020
Introduce pH Plus Water to Cambodia market
35

New Market : OEM
COCOBURI Target Market & Distribution Channel
Domestic : Convenience Store and Modern Trade Price : 25 Baht / Bottle Size : 350 ml. Launch Period : February 2020
Now available at
36

COCOBURI Target Market & Distribution Channel
Export : China Market Price : 10 RMB / bottle Size : 350 ml. Launch Period : March, 2020
New Market in Q2 - Vietnam - Korea
New Market : OEM
37
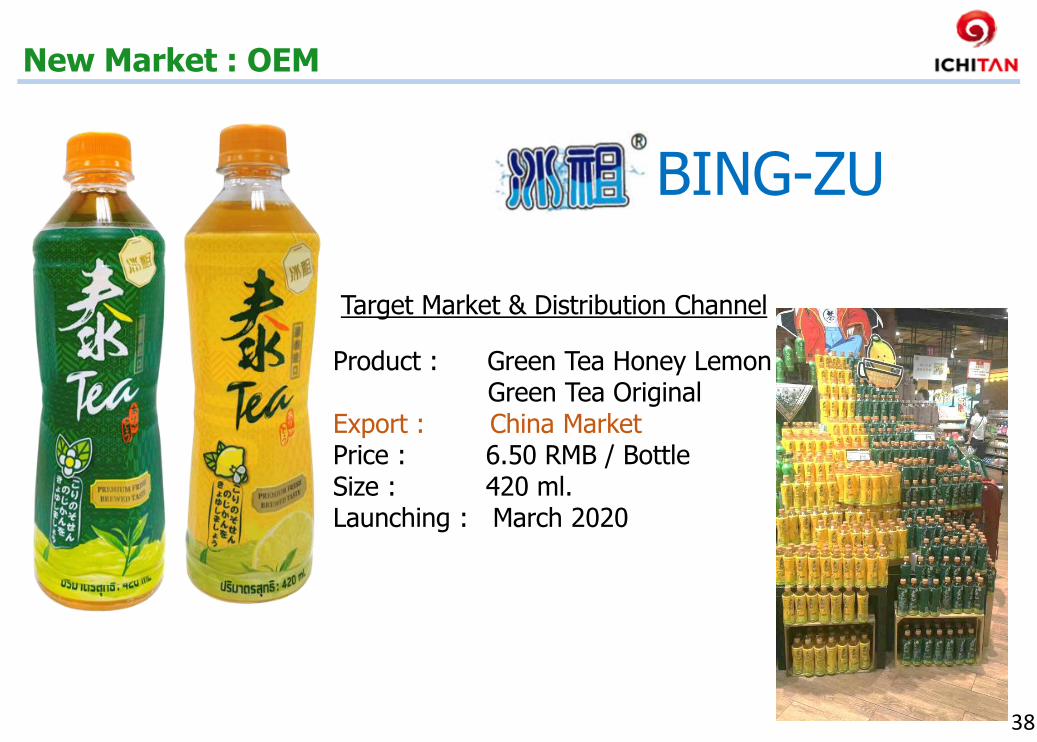
New Market : OEM
BING-ZU
Target Market & Distribution Channel
Product : Green Tea Honey Lemon Green Tea Original Export : China Market Price : 6.50 RMB / Bottle Size : 420 ml. Launching : March 2020
38
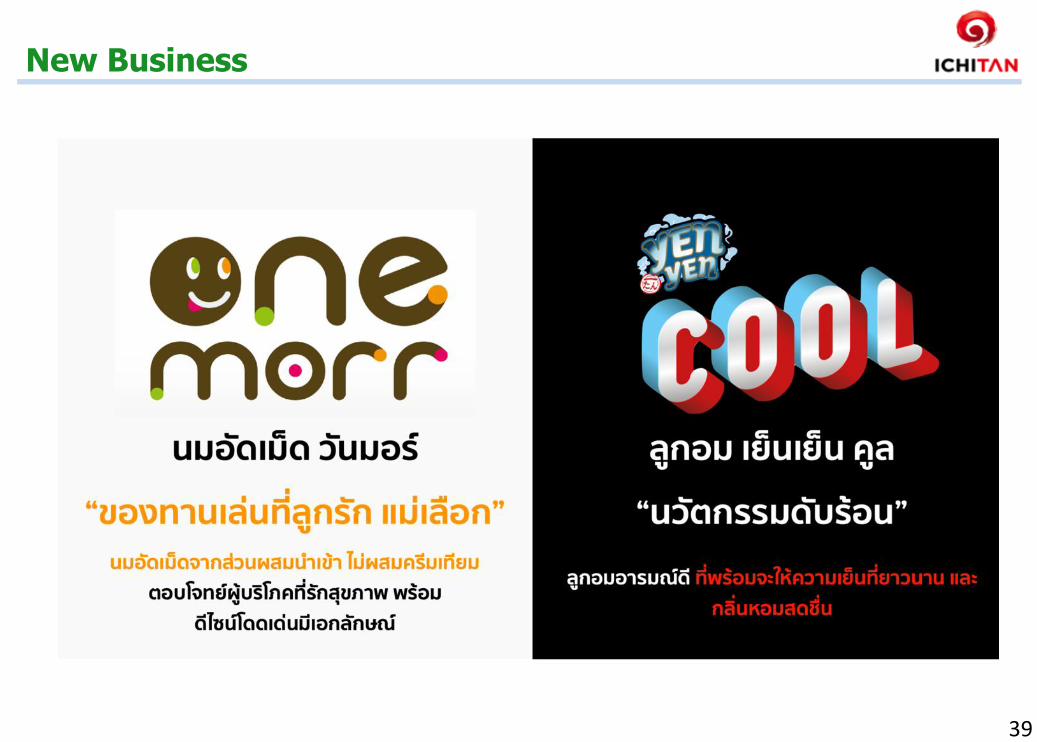
New Business
39

“ของทานเลนทลกรก แมเลอก”
รสหวาน + DHA 20g.
(Original)
รสตนต ารบ 10g.
(Original)
รสชอกโกแลต 10g.
(Chocolate)
สนคาพรเมยม จากวตถดบน าเขา
พรอมแตกตางดวย DHA ไมผสมครมเทยม
15 บาท
จ าหนายในชองทาง: 7-Eleven
พรอมจ าหนาย: กรกฎาคม 2020
สนคาพรเมยม จากวตถดบน าเขา ไมผสมครมเทยม
10 บาท
จ าหนายในชองทาง: TT และ Makro
พรอมจ าหนาย: เมษายน ในชองทาง TT
พฤษภาคม ในชองทาง Makro
New Business : Milk Tablets “ One Morr”
40

Online Shopping Channel :
onemorrofficial
New Business : One Morr
41
42
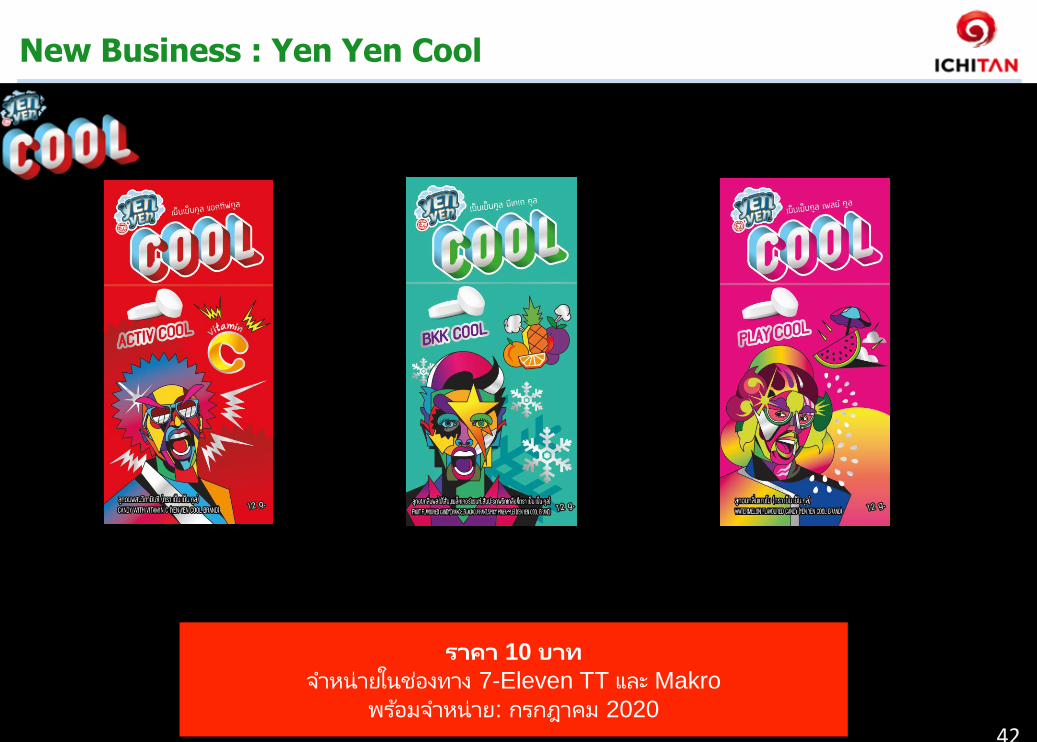
ACTIVV COOL 12G BKK COOL 12G PLAY COOL 12G
เยน สดชน หอม เพลน เยน สดชน ซซา เยน สดชน ตนมชวตชวา
ราคา 10 บาท
จ าหนายในชองทาง 7-Eleven TT และ Makro
พรอมจ าหนาย: กรกฎาคม 2020
New Business : Yen Yen Cool
43
42
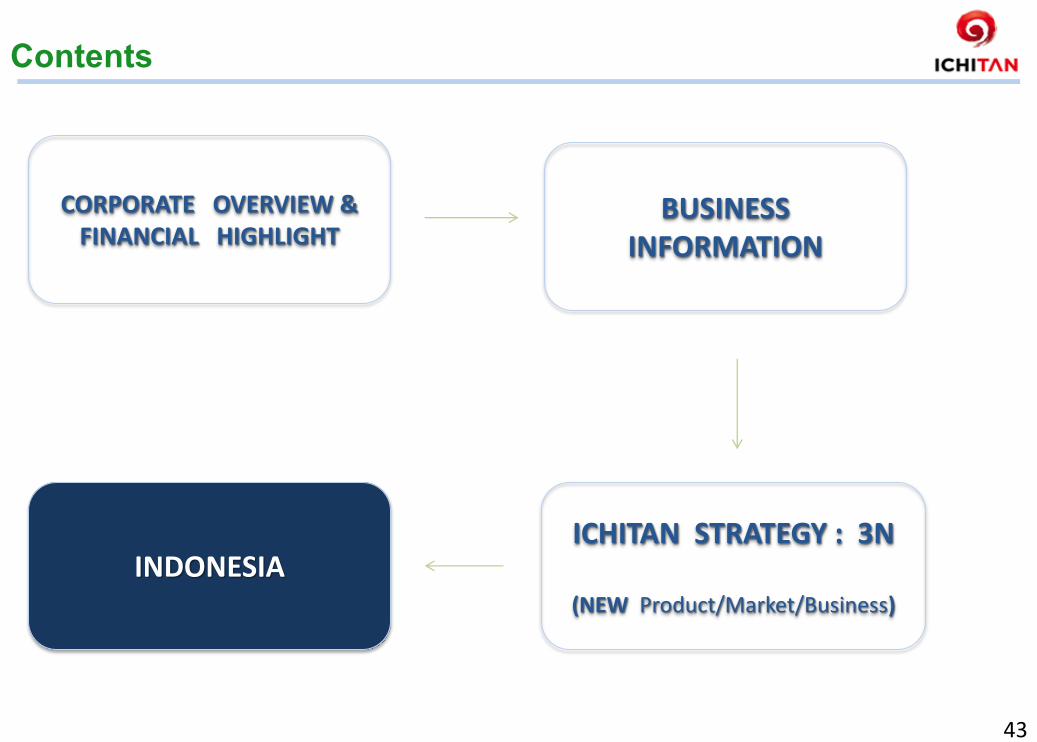
Contents
Overview & Financial Information CORPORATE OVERVIEW & FINANCIAL HIGHLIGHT
BUSINESS INFORMATION
ICHITAN STRATEGY : 3N
(NEW Product/Market/Business)
INDONESIA
43

SALES Total Growth SALES GROWTH BY CHANNEL
SALES GROWTH BY SKU
21%
8%
83% • Total sales is projected to increase by 21%
• GT is very potential and projected to
increase by 37%
• Even though the performance of TMT is
stable, with new products we are able to increase the total sales volume
ICHITAN INDONESIA
44

NPD
MASS
INNOVATIVE
ON TREND
Product that is more
acceptable and
reachable for the mass Indonesian consumers
Product that continue
to be the pioneer in Indonesian RTD market
Product that always
relevant with the latest trend
45

NEW Channel
*Philippines : Our partner Alfamart has >1000 stores
• GT (TT) Positioning is growing toward 2019,
as expand coverage cities from 31 cities to
68 cities and our core products are
accepted by TT market
2018 2019 2020
City Coverage
25 Cities 31 Cities 68 Cities
Country Coverage
Indonesia Indonesia
Indonesia
Malaysia
Philippines
Brunei
46

ATL & BTL 2020
ATL
Heavy TV Ads on top national
TV Station in the high rating
program
Heavy Digital Ads on all social media platform
BTL Sampling, branding and
local events covering 68 cities
IN STORE
Heavy display and POSM
in modern trade, also in local MTI and OMT
47

ITI SALES PERFORMANCE Q1 / 2020
591,968 766,136 801,887
922,627
101,227
146,161
265,100
369,173
-
200,000
400,000
600,000
800,000
1,000,000
1,200,000
1,400,000
Target Q1-19 Q1 2019 Target Q1-20 Q1 20202
Sales By Channel
MT GT
464,392
641,210 695,875 689,819
-
102,522
351,782
63,417
187,194
212,287
223,925
-
50,478
27,415
58,061
20,604
200,000
400,000
600,000
800,000
1,000,000
1,200,000
1,400,000
Target Q1-19
Q1 2019 Target Q1-20
Q1 2020
Sales By SKU
TMT TGT TMC TMG TT
• Sales is increase 42% compare to Q1-19.
• GT market 2020 is growth around 153% & MT market growth 20% compare to Q1-19.
• New product Ichitan Thai Green Tea (TGT) contributed to increasing sales by 27%. • Existing products such as TMT also increased by 8% compared to the same period last year.
53% Con
912,297
1,291,800
912,297
1,291,800
693,195
1,066,987
693,195
1,066,987
42%
27 % Con
13 % Con
48
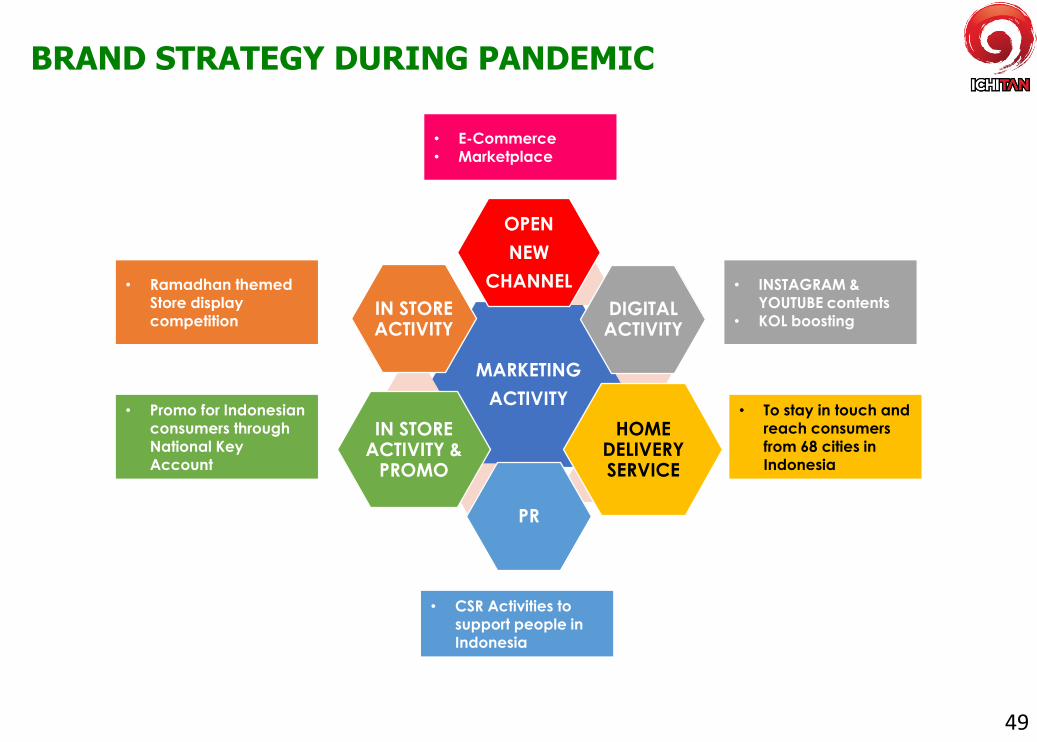
• Promo for Indonesian
consumers through
National Key
Account
• Ramadhan themed
Store display
competition
• To stay in touch and
reach consumers
from 68 cities in
Indonesia
• CSR Activities to
support people in
Indonesia
• E-Commerce • Marketplace
• INSTAGRAM &
YOUTUBE contents
• KOL boosting
MARKETING
ACTIVITY
OPEN
NEW
CHANNEL
DIGITAL ACTIVITY
HOME DELIVERY SERVICE
PR
IN STORE ACTIVITY &
PROMO
IN STORE ACTIVITY
BRAND STRATEGY DURING PANDEMIC
49

BRAND STRATEGY DURING PANDEMIC
RAMADHAN DISPLAY COMPETITION
CSR ACTIVITY E-COMMERCE ACTIVATION
HOME DELIVERY
50

THAI SIGNATURE on TVC Indonesia
51
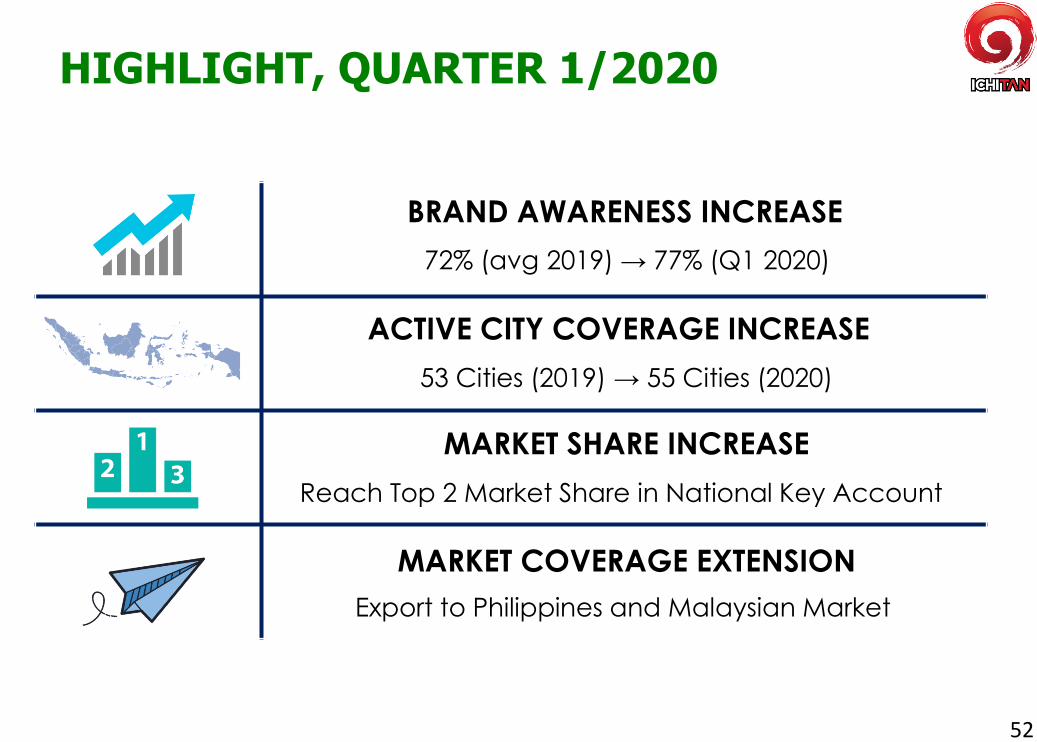
HIGHLIGHT, QUARTER 1/2020
BRAND AWARENESS INCREASE
ACTIVE CITY COVERAGE INCREASE
MARKET SHARE INCREASE
MARKET COVERAGE EXTENSION
72% (avg 2019) → 77% (Q1 2020)
53 Cities (2019) → 55 Cities (2020)
Reach Top 2 Market Share in National Key Account
Export to Philippines and Malaysian Market
52

Q & A
Contact: website : www.ichitangroup.com Email: [email protected] FB: https://www.facebook.com/ir.ichitan