opportunities to improve healthy food access
TRANSCRIPT

Opportunities to improve healthy food access
NOVEMBER 2015

2
Table of Contents EXECUTIVE SUMMARY ............................................................................................................................ 3
PURPOSE ................................................................................................................................................. 3 METHODS ................................................................................................................................................ 3 RESULTS .................................................................................................................................................. 4 CONCLUSIONS AND RECOMMENDATIONS ................................................................................................... 5
INTRODUCTION ........................................................................................................................................ 7 LITERATURE REVIEW ................................................................................................................................ 7
METHODOLOGY ....................................................................................................................................... 9 I. SECONDARY DATA COMPILATION .................................................................................................... 11 II. CATEGORIZATION OF STORE TYPE .................................................................................................. 11 III. MAPPING ....................................................................................................................................... 11 IV. RURAL RETAIL FOOD ENVIRONMENT OBSERVATIONAL SCAN ........................................................... 11 V. TELEPHONE INTERVIEWS ................................................................................................................ 12
RESULTS AND DISCUSSION ................................................................................................................. 13 I. SECONDARY DATA COMPILATION .................................................................................................... 13 II. CATEGORIZATION OF STORE TYPES ................................................................................................ 13
Process for Determining a Business’s Category .............................................................................. 15 Challenges in Categorizing ............................................................................................................... 16 Geographical Distribution ................................................................................................................. 17
III. MAPPING ....................................................................................................................................... 18 IV. RURAL RETAIL FOOD ENVIRONMENT OBSERVATIONAL SCAN ........................................................... 20
Characteristics of the Stores Assessed ............................................................................................ 20 Food Environment ............................................................................................................................ 22
V. INTERVIEW FINDINGS ...................................................................................................................... 30 CONCLUSIONS AND RECOMMENDATIONS ........................................................................................ 34 REFERENCES ......................................................................................................................................... 36 APPENDIX A. RURAL RETAIL FOOD ENVIRONMENT OBSERVATIONAL SCAN TOOL .................. 40 APPENDIX B. RETAILER TYPE BY COUNTY ....................................................................................... 45 APPENDIX C. FOOD ENVIRONMENT DATA BY COUNTY .................................................................. 53

3
EXECUTIVE SUMMARY
Purpose The Michigan Good Food Fund (www.migoodfoodfund.org) aims to expand access to healthy food for
Michigan residents in underserved areas by providing loans and business assistance to food businesses
to increase their capacity to supply “good food.” The Michigan Good Food Charter characterizes “good
food” as food that is healthy, affordable, fair, and green for all Michiganders. Unlike healthy food
financing initiatives in other states, the Michigan Good Food Fund will provide assistance to food
businesses across the supply chain; production, processing, aggregation/distribution, and retail
businesses are all eligible. The Fund is supported with a federal grant from the Healthy Food Financing
Initiative (HFFI) and a growing number of foundations, including the W.K. Kellogg Foundation, the
Fischer Foundation, and the Kresge Foundation. The core partners to implement the Michigan Good
Food Fund include the Fair Food Network, the W.K. Kellogg Foundation, Michigan State University’s
Center for Regional Food Systems (CRFS), and Capital Impact Partners. This assessment was a
collaborative project between the Gretchen Swanson Center for Nutrition (GSCN) and the CRFS. The
purpose of this work is to characterize the food retail environment in a 15-county region of northeast
Michigan to inform business assistance and loan pipeline strategies through the Michigan Good Food
Fund in this part of the state. This 15-county region included Cheboygan, Presque Isle, Otsego,
Montmorency, Alpena, Crawford, Oscoda, Alcona, Roscommon, Ogemaw, Iosco, Clare, Gladwin,
Arenac, and Huron counties.
Methods Several phases of this assessment were conducted in order to maximize the use of existing resources
and secondary data and to complete the project in a timely manner. A few secondary datasets were
reviewed and complementary data points combined into a single dataset. Datasets combined included
the USDA SNAP Retailer Locator, Reference USA’s U.S. Business Database, and the list of licensed
retail food establishments (RFEs) from the Michigan Department of Agriculture and Rural Development.
A store type categorization system was then developed based on existing literature and preliminary
exploration of the local environment in rural northeast Michigan. The stores in the defined 15-county
region were then mapped using the store type categories. To complement this secondary data, a rural
retail food environment observational scan tool was developed based on existing validated measures.
Twenty stores in the region were assessed using the observational scan tool. Finally, interviews were
conducted with store owners, local government, food bank staff, and other stakeholders to gather more
in-depth information on the current food environment and to identify areas of opportunity for the Michigan
Good Food Fund.
4
Results The final secondary dataset identified 814 unique food retail outlets across the 15-county region. Store
type categories that were identified as meaningful for this rural area included (1) Chain Supermarkets, (2)
Independent Supermarkets, (3) Mid-Sized Independent Grocers, (4) Small Grocers/Convenience Stores
Without Gas, (5) Natural/Produce Markets/Specialized Grocers, (6) Convenience Store Chains, (7)
Limited Assortment Food Marts/Gas Stations, (8) Limited Assortment Dollar Stores, (9) Limited
Assortment Drug Stores, (10) Small or Mid-Sized Grocers with Gas, (11) Farms with Retail, (12) Other
Retail Food Establishments, (13) Food Pantries and Food Banks, (14) Farmers Markets, and (15)
Campgrounds. Stores from the dataset were mapped according to the store type category. (The final
map is available online.)
Data were collected from across the 15-county region using the observational scan tool. Four
store types were included in the observational sample, as these stores were identified as most
appropriate for potential Good Food Fund assistance and financial investments: Mid-Sized Independent
Grocers (n = 5), Small Grocers/Convenience Stores Without Gas (n = 7), Small or Mid-Sized Grocers
with Gas (n = 6), and Limited Assortment Food Marts/Gas Stations (n = 2). Over all store types, most
sold beer (n = 19; 95%) and tobacco (n = 19; 95%), many sold wine (n = 17; 85%) and liquor (n = 15;
75%), and many promoted tobacco in the store (n = 15; 75%); few had signage promoting healthy eating
(n = 2; 10%). More than half the stores (60%) accepted Supplemental Nutrition Assistance Program
(SNAP) benefits only, with fewer stores (20%) accepting SNAP and benefits from the Special
Supplemental Nutrition Program for Women, Infants, and Children (WIC). Some stores (20%) did not
accept SNAP or WIC at all.
The food environment in these stores varied across several categories. Sandwiches were the
most common ready-to-eat item across all store types (90%). When compared by store type, it appears
that Small Grocers/Convenience Stores Without Gas and Small or Mid-Sized Grocers with Gas tended to
carry more ready-to-eat items. Across store types, whole milk (95%) and 2% milk (95%) were more
common than 1% or skim (65%). Similarly, regular fat ground beef was more common (65%) than extra-
lean ground beef (5%). Snack and junk foods1 were common across all store types (100% of stores
stocked chocolate bars, candy, cookies, crackers, and potato chips; 90% of stores had ice cream; 85%
of stores had snack cakes or doughnuts; and 65% of stores had lowfat chips). When snack and junk food
availability was compared by store type, Small or Mid-Sized Grocers with Gas tended to have a full
selection of these less-healthy and processed items. In terms of fruits and vegetables, canned
vegetables (100%) and canned fruits (90%) were more common than fresh vegetables (80%) and fresh
fruits (85%) or frozen fruits (20%). When fruit and vegetable availability was compared by store type,
1 foods with little or no nutritional value

5
Mid-Sized Independent Grocers tended to have a greater selection of types of fruits and vegetables. Mid-
Sized Independent Grocers also tended to have a greater variety and more types of whole grains and
beans.
Stores were also rated on the variety and freshness/quality of fruits and vegetables. Overall, fresh
fruit and vegetables were present in a moderate variety (4–6 types each). Both fresh fruit and vegetables
were rated as mixed quality, more good than poor. When compared by store type, Mid-Sized
Independent Grocers had a higher variety (M = 3.2) and quality rating (M = 3.5) than Small or Mid-Sized
Grocers with Gas (variety, M = 2.7; quality, M = 3.4) or Small Grocers/Convenience Stores Without Gas
(variety, M = 1.9; quality, M = 2.6).
Conclusions and Recommendations This information can be used to inform future food access work in northeast Michigan by describing
current challenges and practices and highlighting areas of opportunity. This report can be used as a
starting point to help brainstorm future work to address food access in northeast Michigan. The
developed map highlights areas that are low–food access and low-income and in which the availability of
food retail outlets is limited. Small stores in these rural areas may be prime businesses for investment,
allowing the stores to expand their ability to offer more healthful products. In particular, small
independent grocers and corner stores in small towns across the 15-county region studied may benefit
from investments that expand the store owners’ ability to source, store, and sell more local and fresh
products. In addition, Double Up Food Bucks, a healthy food incentive program coordinated by the Fair
Food Network, has a role to play in incentivizing both store owners and consumers.
In addition to infrastructure at the store level, distribution systems for these rural areas should be
addressed. The food environment observational scan revealed that more healthful whole-food products
(fruits, vegetables, whole grains, lowfat meat and dairy) are more readily available and of higher quality
in the larger grocery stores (Mid-Sized Independent Grocers) than in smaller grocery stores and
convenience stores. We believe these smaller stores could expand their healthful food offerings and may
be good candidates for business and/or loan assistance from the Michigan Good Food Fund, perhaps
coupled with nutrition education in the community. It may be possible to partner with one of the
distributors that currently deliver to these rural stores in order to create a program aimed at expanding
stores’ offerings of fresh produce and other healthy items, possibly through the design and use of
innovative displays and coolers. Such a program could get a significant boost by working with the Double
Up Food Bucks program, which would stimulate purchases and sales of healthy items through the use of
matching dollars, benefiting both the store owner via increased sales and the customer through direct
savings on purchases. The information obtained from the current study can be used to identify the stores
that would be good candidates for such a program in the areas of highest need.
6
Given an increased reliance on ready-to-eat items, the healthfulness of these foods could be
enhanced to “meet people where they are.” This type of targeted intervention could have a large impact
on the dietary patterns in these rural communities, where convenience options are not as plentiful as in
more densely populated areas. Store owners are catering to customer demand, which tends to be largely
for convenience items in the smaller stores. In addition, more revenue comes from tourists in the
summer, with limited sales volume in the winter; therefore, store owners tend to stick to items that will
sell and tend not to take many risks. However, store owners who have been in business for a while and
are part of the local community do tend to provide more locally sourced options and fresh items. This
shows a level of autonomy and agency that store owners can take—and if they have the resources and
education to provide specific items and customers will buy those items, it can be done. The Michigan
Good Food Fund and Double Up Food Bucks can help facilitate more stores sourcing and selling local
and fresh foods through infrastructure improvements, product placement, and promotion.
Simply increasing options for healthy foods may not be sufficient to change consumers’ dietary
habits to be more healthful. There is a need to develop a demand for healthier products among rural
northeast Michigan consumers through nutrition education opportunities. Perhaps efforts from the
Michigan Good Food Fund can be paired with enhanced local existing programming (including more
locally-based nutrition, public health, and food access expertise) and provide further opportunities to
change knowledge and behaviors among this often-overlooked region of Michigan.

7
INTRODUCTION
Poor health outcomes associated with abundant access to energy-dense, nutrient-poor foods (i.e. junk
foods) have been well documented among urban populations, but documentation is lacking among rural
populations (1–3). Emerging research has demonstrated some of the unique issues that rural areas face
in terms of providing access to healthy food, such as a declining customer base, aging ownership, and a
lack of available small business capital (4–7). Many rural residents are located relatively far from any
corner store or full-service grocery store (8), and this is compounded by a lack of public and/or individual
transportation (8), spurring reliance on prepackaged foods at the nearest food outlet (which commonly
sells more foods that are nonperishable and higher in fat and/or sugar; 9). This may be particularly true in
northeast Michigan, a predominantly rural area with limited food access and poor health outcomes, as
described in the following sections. There currently are limited efforts to improve healthy food access in
the northeastern part of Michigan.
For the purpose of this exploratory assessment, we will consider rural retail to include a wide
range of outlets in rural areas where individuals and families potentially obtain food. These food outlets
may include small or medium-sized grocery stores, corner stores or gas stations, food pantries, dollar
stores, and drug stores. In addition, we will consider the role that distributors, processors, and other
potential distribution channels may play in influencing the food environment in northeast Michigan. We
intend to complement existing work being conducted in the state and across the region (e.g., a regional
food hub feasibility study). The overarching strategy for this evaluation is to use a combination of data
sources to help determine the characteristics of the rural food retail environment in northeast Michigan
using a healthy food access lens, which can inform future work for practitioners as well as inform loan
and business assistance strategies for the Michigan Good Food Fund in this part of the state. This
completed study is an important step in informing the best use of Michigan Good Food Fund resources to
improve rural healthy food access using innovative strategies.
Literature Review An initial research scan of existing studies and knowledge of rural retailers was conducted by MSU
graduate student Chris Bardenhagen for the Center for Regional Food Systems. In addition to searching
library and journal databases, inquiries were made to relevant academic departments at Michigan State
University and to MSU Extension and state economic development agencies to see if there was any
work currently being conducted in this study’s geographic area. This initial search revealed that there has
been very little research conducted in the specific area of rural retail and rural grocery in northeast
Michigan. The exception to this dearth of information was the Rural Grocery Initiative (RGI) website. The
RGI provides resources to rural grocers and serves as a de facto clearinghouse for information relating
to rural grocery. Preliminary research done by research partner GSCN for the current evaluation (10–12)

8
includes analysis of various factors affecting these retailers, including issues related to distribution and to
consolidation in the food industry.
As a result of the lack of a larger body of work on the subject, the literature review focused on
information related to rural grocery and food access. There is some research that describes methods for
improving rural grocery sales through the use of signage or improved customer service, for example
(e.g., 13–15). Also available are guides for rural business development and publications describing
financial resources for healthy food or food access–related projects (e.g., 7, 16). There are reports
documenting food insecurity and related health issues generally, some of which include maps that detail
where these areas lie geographically (e.g., 17, 18). Some work has been done on food insecurity
specifically in rural areas (e.g., 19, 20). Literature and guides on assessing the healthiness of offerings at
grocery stores is available (e.g., 21, 22). After this assessment began, an interesting piece of salient
literature was published that assesses the cost of a healthy diet based on residents’ locale and type of
transportation available; this work adds a higher degree of sophistication to the “food desert” metric that
is often used to measure food insecurity data (23).
9
METHODOLOGY
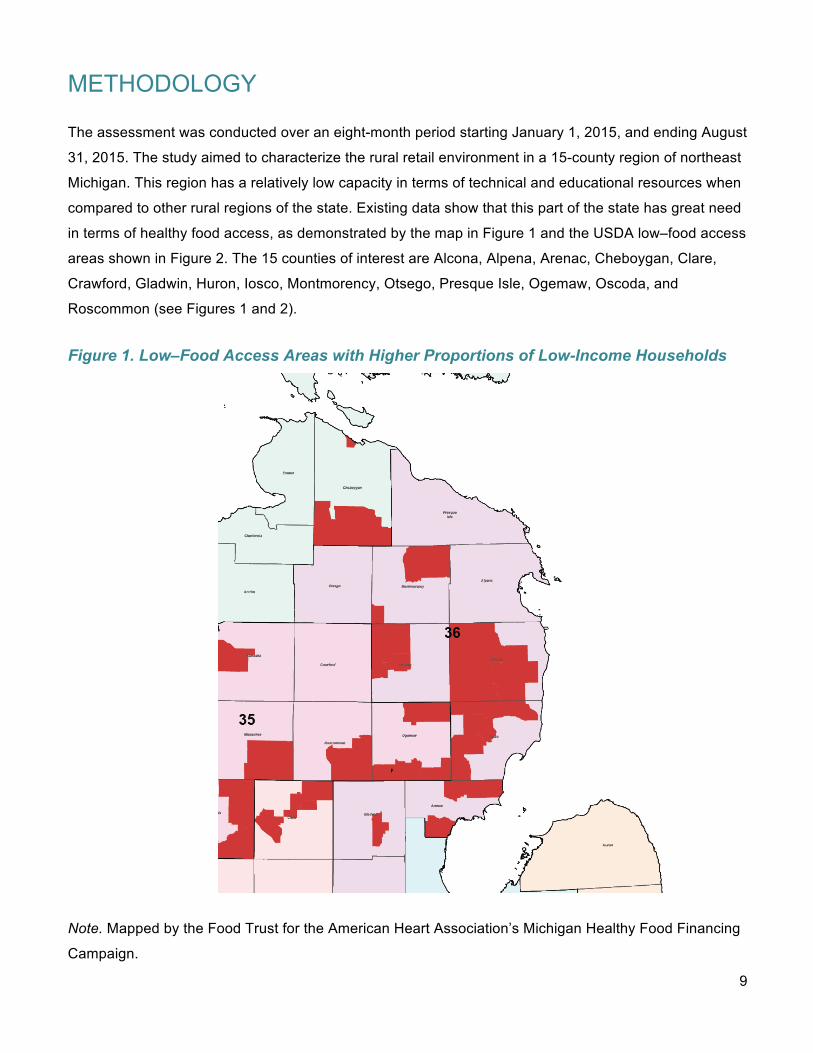
The assessment was conducted over an eight-month period starting January 1, 2015, and ending August
31, 2015. The study aimed to characterize the rural retail environment in a 15-county region of northeast
Michigan. This region has a relatively low capacity in terms of technical and educational resources when
compared to other rural regions of the state. Existing data show that this part of the state has great need
in terms of healthy food access, as demonstrated by the map in Figure 1 and the USDA low–food access
areas shown in Figure 2. The 15 counties of interest are Alcona, Alpena, Arenac, Cheboygan, Clare,
Crawford, Gladwin, Huron, Iosco, Montmorency, Otsego, Presque Isle, Ogemaw, Oscoda, and
Roscommon (see Figures 1 and 2).
Figure 1. Low–Food Access Areas with Higher Proportions of Low-Income Households
Note. Mapped by the Food Trust for the American Heart Association’s Michigan Healthy Food Financing
Campaign.

10
Figure 2. 15-County Area of Interest
Note. Counties of interest and low–food access areas are shown in green (USDA)

11
Components of the assessment include the following:
I. Secondary Data Compilation Databases included the USDA SNAP Retailer Locator, Reference USA’s U.S. Business Database, and
the list of RFEs from the Michigan Department of Agriculture and Rural Development (MDARD). These
databases were combined in order to have a more comprehensive list of potential stores and
complementary variables. For example, the SNAP Retailer Locator included latitudinal and longitudinal
information that was necessary for mapping, while the RFE list included store revenue information that
was important for categorization of store types.
II. Categorization of Store Type Previous research on healthy food retail store types have followed several different criteria that consider
number of annual employees (24), approximate square footage (25), annual sales volume (26, 27), and
floor size and product lines (27), often in combination with North American Industry Classification System
(NAICS) codes (26, 28, 29). Given the variety in classification systems, it was necessary to combine
several of the previously utilized methods and align with the food environment in rural northeast
Michigan. The categories and definitions of store types in the current study were based on a combination
of sources; key definitions and categories were grounded in information from the Rudd Center (30) with
modifications and additions described by others (24–29). The resultant classification system for store
type considered the types of food stores most commonly found in the target area, revenue cutoff values
that were meaningful, and other unique aspects of the stores and the communities they serve.
III. Mapping Once the store type classification system was finalized and stores were coded appropriately in the
database, data were uploaded into a mapping system using ArcGIS mapping tools. The merged dataset
was used to map the stores by type.
IV. Rural Retail Food Environment Observational Scan A review of existing observational tools was conducted and a modified environment assessment tool was
created. Items from two existing observational tools were utilized: The Bridging the Gap Food Store
Observation Form (31) and The Food Retail Outlet Survey Tool (FROST) Version 1.2 (32). The resulting
tool combined items and approaches from each of these existing tools, with consideration for specific
areas of interest (e.g., signage, ready-to-eat items, and availability of staple items for making meals)
while balancing feasibility and ease of administration for the current evaluation (see Appendix A).
Based upon the categories defined for store type and the map showing the location of these
stores, a sampling plan was derived for in-person visits to conduct the observational assessment. The
sampling plan balanced store type and location, attempting to have at least one in-person visit in each of

12
the 15 counties, selected for ease of sampling (e.g., near main highways). Chris Bardenhagen
conducted in-person store observations for CRFS during the summer of 2015. During these site visits,
the observational tool was completed and pictures were taken. Most visits to the stores were “cold calls”
(i.e., the store owner was not made aware prior to the visit). Upon entering the store, Bardenhagen told
the first employee he encountered (usually a cashier) about the study and asked if he could walk around
to see what items the store had or didn’t have. He was sometimes referred to an owner or manager, to
whom he would then talk more about the project. Bardenhagen would then complete the items from the
observational scan tool. Since every store was set up differently, a second walkthrough was necessary to
check off the various items on the list (including bread, chips, vegetables, pasta, fruit, the quality of any
fresh produce, etc.). Bardenhagen asked an employee about some items, such as whether the store sold
certain hot foods during lunch and whether the store accepted SNAP or WIC.
V. Telephone Interviews Telephone interviews were conducted by Courtney Pinard with Gretchen Swanson Center for Nutrition in
order to elaborate on findings from the in-person observations, to describe the community and role of the
store, and to understand food access issues. In addition to store owners, food bank representatives and
other stakeholders were targeted for interviews. Several factors made it difficult to reach store owners
and set up interviews: schedules that fluctuated depending on customers; busy schedules; limited time
“at a desk”; a lack of understanding about the purpose of the interviews and the Good Food Fund (which
might be better addressed in person); and an unwillingness to discuss their business, potentially to
protect any competitive edge.
13
RESULTS AND DISCUSSION
I. Secondary Data Compilation As described in the Methodology section, a few data sources were used as a basis for this study.
• Retail Food Establishments and Extended Retail Food Establishments. A list of RFEs was
obtained from MDARD for the counties in the study area. This list includes all businesses that
have obtained a license to sell food, but it does not generally include restaurants, which are
considered food service establishments. These licenses must be updated annually by April 30, so
the data was recently updated. Each business’s address and phone number was included in the
list.
• Supplemental Nutrition Assistance Program. A list of all of the businesses that accept SNAP
in the study area was obtained from the USDA. A few establishments were on the SNAP list but
not on the RFE list.
• Revenue Information. Revenue information was obtained for most, but not all, of the retailers.
The information was gathered using Reference USA’s U.S. Business Database. The search was
conducted using geography (by county), NAICS code 445110 (“Supermarkets and Other Grocery,
Except Convenience”), NAICS code 445120 (“Convenience Stores”), and SICS code 5411
(“Grocery Stores”). Several businesses were on the revenue list but not on the RFE list.
In addition to the main datasets listed, a few supplementary sources were reviewed:
• Food Pantries and Food Banks. The Food Bank of Eastern Michigan Agency Locator
database/search engine was used to search for the majority of the food banks in the study area.
Additionally, the Greater Lansing Food Bank was contacted in order to find the food banks in
Clare County.
• Farmers Markets. Information on farmers markets was obtained using the Michigan Farmers
Market Association’s database/search engine.
• Local Project Partners. Information obtained from interviewing local project partners was cross-
referenced with the sources described. These people from the study area identified numerous
food pantries, farmers markets, and food retailers on the ground.
II. Categorization of Store Types The categories and definitions of store types were based on a combination of sources; key definitions
and categories were grounded in information from the Rudd Center (30) with modifications and additions
described by others (24–29). These were adapted to match this specific project. The category Small or
Mid-Sized Grocers with Gas was added to describe a type of grocery store that carries gas but also

14
carries a wider line of grocery and produce than the usual gas station food mart. (Presumably, this type
of business has evolved due to the rural nature of these stores and/or in an attempt to provide a one-
stop shopping experience for customers.) The revenue (sales) categories were chosen to correspond
with the categories used by Reference USA:
• A: Less than $500,000 • B: $500,000 to $1 million • C: $1 million to $2.5 million • D: $2.5 million to $5 million • E: $5 million to $10 million • F: $10 million to $20 million • G: $20 million to $50 million • H: $50 million to $100 million
The Retail Food Establishment Categories used are as follows:
1) Chain Supermarkets: Walmart, Meijer, Family Fare (Spartan Nash), Glen’s, and Save-a-lot.
2) Independent Supermarkets: More than $5 million in sales. Fewer than 10 stores. Includes
Nieman’s and larger IGAs.
3) Mid-Sized Independent Grocers: Less than $5 million in sales. Includes smaller IGAs and
others.
4) Small Grocers/Convenience Stores Without Gas: Non-chain stores that sell food. These
stores are often “mom and pop” grocery stores, bodegas, and older markets; they typically have
a supply of convenience foods, shelf-stable grocery items, and alcohol but offer less availability
of foods compared to supermarkets and chain grocery stores (includes small, ethnic, corner, and
convenience stores).
5) Natural/Produce Markets/Specialized Grocers: Includes meat markets, natural food stores,
seasonal farm markets (but not farmers markets), and fish markets.
6) Convenience Store Chains: Corporate. Includes the national chain 7-Eleven.
7) Limited Assortment Food Marts/Gas Stations: Includes stores similar to Category 4, with the
addition of gas.
8) Limited Assortment Dollar Stores: Includes Family Dollar and others.
9) Limited Assortment Drug Stores: Includes Rite Aid, GNC, and K-Mart.
10) Small or Mid-Sized Grocers with Gas: Independent stores selling a broader line of grocery
than stores in Category 7.
11) Farms with Retail: Selling produce, frozen meat, and so on.
12) Other Retail Food Establishments: Includes places selling candy, chocolatiers, pizza places,
marinas, wineries, and Schwan’s delivery.

15
13) Food Pantries and Food Banks: Often run through churches or other civic organizations,
serving people in need.
14) Farmers Markets: Weekly seasonal markets where local farmers sell their produce to the public.
15) Campgrounds: Convenience stores at campgrounds.
Process for Determining a Business’s Category Overview Businesses with a well-known corporate name, such as Dollar General, Walmart, and Meijer, were put
into their categories without further inquiry. For example, Walmart would automatically be placed in
Category 1 as a chain supermarket, Dollar General would automatically be put in Category 8 as a limited
assortment dollar store, and Rite Aid would be automatically put into Category 9 as a limited assortment
drug store.
For all other businesses on the RFE list, an initial Internet search was carried out. Initial Internet
searches were also conducted for businesses that were not on the RFE list but showed up on the SNAP
list or the Reference USA lists. If enough information was found, such as a current Facebook page or a
significant amount of recent reviews on websites such as Google+, a business’s category was able to be
determined from this initial search.
While some (mostly larger) businesses had websites, a significant number of long-standing
community businesses in the study area did not have websites, and many had very few reviews on
websites such as Yelp and Google+. Where this was the case, Google Earth was used to help determine
if there was a brick-and-mortar building at the address, and further Web searches were conducted.
However, many of the photographs used on Google Earth’s street view date back to 2008, so this type of
search did not add confidence in categorizing large numbers of businesses. However, the street view
would sometimes reveal enough other information (such as the business operating under a different
name) to enable the business to be categorized through further Internet research.
In cases where very little or no information about a business was found using the methods
described or by using assumptions outlined in the next section, calls were made to help determine the
category of the business. The call list included about 120 out of more than 800 total businesses, and a
number of the businesses that made it onto this call list had closed shop or had changed hands since the
RFE license had been issued. However, the majority of these businesses turned out to be open,
functioning businesses.
Assumptions Generally, if a store had party or liquor in the name, it was put in Category 4 (Small
Grocers/Convenience Stores Without Gas). All of these stores were confirmed to actually be open by
either a significant amount of recent reviews, a recently updated Facebook page, or a telephone
confirmation. A store that had IGA (Independent Grocers Association) in its name was assumed to

16
provide a more full line of grocery than a convenience store, and the store was put into either Category 2
(Independent Supermarkets) or Category 3 (Mid-Sized Independent Grocers) depending on its revenue
category.
There were several stores that showed up in the revenue list that were not on the RFE list. Many
of these were assumed to be gas stations selling snacks under a food establishment licensing exemption
that allows for sale of “only pre-packaged, non-potentially hazardous foods in incidental amounts.”
Accordingly, these stores were put into Category 7 (Limited Assortment Food Marts/Gas Stations). If
revenue information was found for a business at the same address that was on the RFE list but under a
different name than the RFE list, the name on the RFE list was used because it is the most frequently
updated list. These name discrepancies could have been the result of doing business under a different
name or of ownership changes that occurred after the revenue data was collected. Additionally, after
contacting stores on the phone call list mentioned in the Overview section, some names were updated
from those on the RFE list due to very recent ownership changes.
A store on the call list would be assumed to be out of business under any of the following
circumstances:
• No answer during midday, generally after several tries at various times of day
• Disconnected phone (the number was generally cross-referenced and tried more than once to
ensure accuracy)
• A home phone’s answering machine answered the call
• Facebook, Yelp, or another website noted that the business was “Permanently Closed” or
“Closed” on its page and any of the above occurred
Challenges in Categorizing Categories 3 and 4 While revenue was the clarifying factor between Category 2 (Independent Supermarkets) and Category 3
(Mid-Sized Independent Grocers), distinguishing between Categories 3 and 4 (Small
Grocers/Convenience Stores Without Gas) was difficult in absence of the ability to visit each individual
store. Generally, if a store seemed to have a focus on providing a full line of grocery, it was put into
Category 3 even if it was in a low revenue category. This was the case with several of the IGA stores, as
stated in the Assumptions section.
One way to deal with this would be to create another category, Small Grocery/Produce (Full Line
Focus), to distinguish it from Category 4 (Small Grocers/Convenience Stores Without Gas); however, in
order to effectively categorize between these, nearly every store would need to be visited. Because most
of the businesses placed in Category 4 seem to have a convenience food focus, similar to a gas
station/food mart, another way to deal with this issue could be to change Category 3 to “Mid-Sized and
Small Independent Grocers” and Category 4 to “Convenience Stores Without Gas.” However, the issue

17
of needing to visit each store in order to clearly distinguish between the categories would still persist.
Future studies could address these particular categorization challenges.
Categories 5 and 12 There was some challenge in determining whether some businesses should fit into Category 5
(Natural/Produce Markets/Specialized Grocers) or Category 12 (Other Retail Food Establishments).
Essentially, if the store’s focus was on food that one might bring home to prepare as a meal, it was put
into Category 5, but stores selling food such as candies, wine, and specialty oils were put into Category
12 because the focus of these stores was on providing delicacies versus meals.
Categories 7 and 10 Another challenging distinction to make was between Category 7 (Limited Assortment Food Marts/Gas
Stations) and Category 10 (Small Grocers/Convenience Stores with Gas). Without visiting each
business, it was hard to tell whether the store sells simply convenience foods, such as chips and pop, or
a significant amount of grocery. Some stores that have gas are clearly grocery stores and are used by
people in the community for grocery shopping, including purchasing produce. Those stores that
appeared to focus on grocery, or appeared to potentially offer a more full line of grocery, were put into
Category 10. Those that appeared to be standard gas station convenience food marts were put into
Category 7.
Category 15 There were three campground-based convenience stores that appeared to be open year-round. While
they otherwise fit into Category 4 (Small Grocers/Convenience Stores Without Gas), these three were
left in Category 15 (Campgrounds) because of their association with camping facilities and recreation.
Geographical Distribution The number of food retailers overall was highest in Cheboygan, Clare, Huron, and Iosco Counties.
Figure 3 shows the number of retailers in each county.
Figure 3. Number of Retailers by County

18
The most popular types of food retailers were convenience stores, other food retailers (e.g., specialty
item stores), and small grocery stores. A breakdown of the different types of food retailers across the 15
counties is shown in Figure 4.
Figure 4. Percentage of Food Retailers by Category
III. Mapping On the final version of the map, layers of store types can be added and subtracted, and information
about specific stores and their categorization can be pulled up. Figure 5 shows the map, with low–food
access/low-income areas highlighted in green. Online, users can explore specific store types, adding and
removing particular types from the map, for more detailed information on specific areas.
Chain Supermarkets (1) 4%
Independent Supermarkets (2)
2% Mid-sized Independent
Grocers (3) 3%
Small Grocer/Convenience Stores
Without Gas (4) 15% Natural/ Produce
Markets/ Specialized Grocers (5)
6%
Convenience Store Chains (6)
0% Limited Assortment Food
Mart/Gas Stations (7) 22%
Limited Assortment Dollar Stores (8)
7%
Limited Assortment Drug Stores (9)
5%
Small or Mid-Sized Grocers with Gas (10)
6%
Farm with Retail (11) 2%
Other Retail Food Establishment (12)
14%
Food Pantries
and Food Banks (13)
8%
Farmers Market (14) 3%
Campgrounds (15) 3%
Counties: Alcona Alpena Arenac Cheboygan Clare Crawford Gladwin Huron Iosco Montmorency Otsego Presque Isle Ogemaw Oscoda Roscommon

19
Figure 5. Map of Food Stores in Northeast Michigan

20
IV. Rural Retail Food Environment Observational Scan The observational scan tool can be found in Appendix A. As previously stated, Chris Bardenhagen
conducted in-person store observations for CRFS in the summer of 2015. During these site visits, the
observational tool was completed and photos were taken.
Characteristics of the Stores Assessed Overall, Mid-Sized Independent Grocers can be characterized as small-town, Main Street grocery
stores. They tend to have a nice selection of fruits, vegetables, and meat but can be limited in particular
categories (e.g., low-sugar cereal, whole grains). Some of the stores visited in this category have unique
features, such as sourcing local meat from a nearby ranch or focusing on bulk items. In order to stay
competitive, one store owner implemented “dollar store” aisles, focusing on processed and snack food
items.
The Small Grocers/Convenience Stores Without Gas category seems to be more focused on
catering to tourists during the summer months, and these stores have limited fresh food options. Several
do sell local produce in the summer months. They tend to have more ready-made items and junk food
items that tourists may be seeking. Shelf-stable items are more available in these locations, given the
limited volume and low risk to stock these items. One store had the unique feature of selling a selection
of frozen fish (some which was local).
Small or Mid-Sized Grocers with Gas tend to be either (a) mid-sized grocers with a
considerable volume of grocery sales, including some fresh produce, (b) similar to Small
Grocers/Convenience Stores Without Gas but have a greater selection of fresh produce and/or meats
(“convenience plus,” as one owner called it) and tend to be located in a very rural area without other
groceries around, or (c) tend to be closer to a typical gas station convenience store (i.e., mainly junk food
and alcohol sales), in which case the store would ideally be re-categorized as a Limited Assortment Food
Mart/Gas Station (this category is discussed next). Having gasoline for sale presumably brings
customers into the store, and stores see better profits from grocery sales than from gas sales. A unique
feature of one store was selling local eggs, bacon, sausage, and jerky.
Limited Assortment Food Marts/Gas Stations are essentially gas station convenience stores,
as can be found nearly everywhere else in the continental United States. They usually sell snack foods,
alcohol, and convenience grocery items and generally do not engage in the sale of fresh produce, except
for quick-grab bananas in some stores.
The stores selected for in-person assessment fell into the categories of Small
Grocers/Convenience Stores Without Gas, Small or Mid-Sized Grocers with Gas, Mid-Sized Independent
Grocers, or Limited Assortment Food Marts/Gas Stations. Figure 6 describes the breakdown of each of
these four store type categories across the 20 stores assessed. For the remainder of the report, the

21
Limited Assortment Food Marts/Gas Stations category has been collapsed into the Small or Mid-Sized
Grocers with Gas category for ease of interpretation due to the small sample in this category.
Figure 6. Store Type Assessed with Food Environment Observations
The store environments varied. Most sold beer (n = 19; 95%) and tobacco (n = 19; 95%), many
sold wine (n = 17; 85%) and liquor (n = 15; 75%), and many promoted tobacco in the store (n = 15;
75%); few had signage promoting healthy eating (n = 2; 10%). In North Carolina, rural food stores with
higher amounts of tobacco marketing on the exterior had lower healthy food availability (33). In Michigan,
more than half the stores assessed accepted SNAP only (60%), with fewer stores accepting SNAP and
WIC (20%) or no SNAP or WIC (20%), as shown in Figure 7. Since 2010, the revised WIC-approved
food items have improved access to healthy foods for WIC participants and others shopping in these
stores (34).
Figure 7. Food Assistance Program Participation at Store Level
20%
20%
60%
75%
0 2 4 6 8 10 12 14 16 18
No SNAP or WIC
SNAP and WIC
SNAP only
Is there an EBT terminal on-‐site?
Number of Stores
10%
25%
30%
35%
0 1 2 3 4 5 6 7 8
Limted Assortment -‐ Food Marts/Gas StaJons
Mid-‐sized independent
Small or Mid-‐sized Grocers with Gas
Small Grocers/Convenience (w/out gas)
Number of Stores

22
Food Environment The food environment observational scan included several categories, each represented with a figure in
this section, beginning with Figure 8. It is important to note that all of the stores assessed had both
sugar-sweetened beverages and bottled water.
Figure 8. Ready-to-Eat Item Availability
The most common ready-to-eat food item found across all assessed stores was cold sandwiches
(see Figure 8). When compared by store type, it appears that Small Grocers/Convenience Stores
Without Gas and Small or Mid-Sized Grocers with Gas tend to carry more ready-to-eat items (see Figure
9). A recent national study that assessed availability of prepared, ready-to-eat foods found that rural
stores were 26% less likely to carry prepared salads and 14% more likely to carry at least one less-
healthy prepared food item (35). Given the increasing consumption of convenient ready-to-eat foods and
the reliance on small stores in rural communities as sources of these foods, a focus on improving the
healthfulness of these items could be a win-win strategy for public health and profitability for the store
owners (and ultimately rural economic development). If small stores could provide more healthful ready-
to-eat-food options, consumers may be more likely to take this as a first step in eating more healthfully,
making this choice easier.
Figure 9. Ready-to-eat items availability, by store-type
10%
15%
35%
35%
40%
90%
0 2 4 6 8 10 12 14 16 18 20
French fries
Salad/salad bar
Mexican
Pizza
Hot dogs/corn dogs/hamburgers
Sandwiches (cold)
Number of Stores
20%
20%
20%
40%
20%
80%
17%
0%
33%
50%
50%
100%
0%
22%
44%
22%
44%
89%
0% 10% 20% 30% 40% 50% 60% 70% 80% 90% 100%
French fries
Salad/salad bar
Mexican
Pizza
Hot dogs/corn dogs/hamburgers
Sandwiches (cold)
Small Grocers/Convenience (w/out gas)
Small Grocers/Convenience (w/gas)
Mid-Sized Independent

23
Figure 10. Lowfat Milk and Ground Beef Availability
Overall, full-fat milk and meat were more common than lowfat versions (see Figure 10). When
meat and milk availability was compared by store type, no consistent differences or trends were
revealed, although extra-lean ground beef was only available in some of the Mid-Sized Independent
Grocery Stores (see Figure 11). This is in line with previous findings from rural communities that suggest
lowfat and healthier options tend to be more available at larger grocery stores than convenience stores
(4). An additional finding, which was not explored in the current evaluation, is that the more healthful
versions of food items tended to be more expensive at convenience stores than at larger grocery stores
(4).
95%
95%
65%
65%
5%
0 5 10 15 20 25
Milk, whole (Vitamin D), unflavored
Milk, 2% fat, unflavored
Milk, 1% fat or skim, unflavored
Ground beef, regular (>10%)
Ground beef, extra lean (<10% fat)
Number of Stores
The meat selection at a store that was assessed.

24
Figure 11. Lowfat Milk and Ground Beef Availability by Store Type
Many snack foods, in particular shelf-stable items like chips and chocolate bars, were common in the
stores assessed (see Figure 12). When snack and junk food availability was compared by store type,
Small Grocers/Convenience Stores Without Gas tended to have a full selection of these less-healthy and
processed items (see Figure 13). This is in line with many previous studies, which have identified a lack
of healthful options in convenience stores when compared to full-service grocery stores (27, 36), found
that neighborhood residents who have better access to supermarkets and limited access to convenience
stores tend to have healthier diets and lower levels of obesity (28, 37), and found that chain
supermarkets are less available in low-income and minority neighborhoods (29).
Figure 12. Snack and Junk Foods Availability
80%
80%
80%
80%
20%
100%
100%
83%
83%
0%
100%
100%
44%
44%
0%
0% 20% 40% 60% 80% 100%
Milk, whole (Vitamin D), unflavored
Milk, 2% fat, unflavored
Milk, 1% fat or skim, unflavored
Ground beef, regular (>10%)
Ground beef, extra lean (<10% fat)
Small Grocers/Convenience (w/out gas)
Small Grocers/Convenience (w/gas)
Mid-‐Sized Independent
100%
100%
100%
100%
100%
90%
85%
65%
0 5 10 15 20 25
Potato chips, regular (not lowfat)
Crackers
Cookies
Candy
Chocolate bars
Ice cream
Snack cakes or doughnuts
Baked or lowfat potato chips
Number of Stores

25
Figure 13. Snack and Junk Foods Availability by Store Type
100%
100%
100%
100%
100%
80%
80%
60%
100%
100%
100%
100%
100%
100%
100%
83%
100%
100%
100%
100%
100%
89%
78%
56%
0% 20% 40% 60% 80% 100%
Potato chips, regular (not lowfat)
Crackers
Cookies
Candy
Chocolate bars
Ice cream
Snack cakes or doughnuts
Baked or lowfat potato chips
Small Grocers/Convenience (w/out gas)
Small Grocers/Convenience (w/gas)
Mid-‐Sized Independent
The snack foods from a store that was assessed.
26
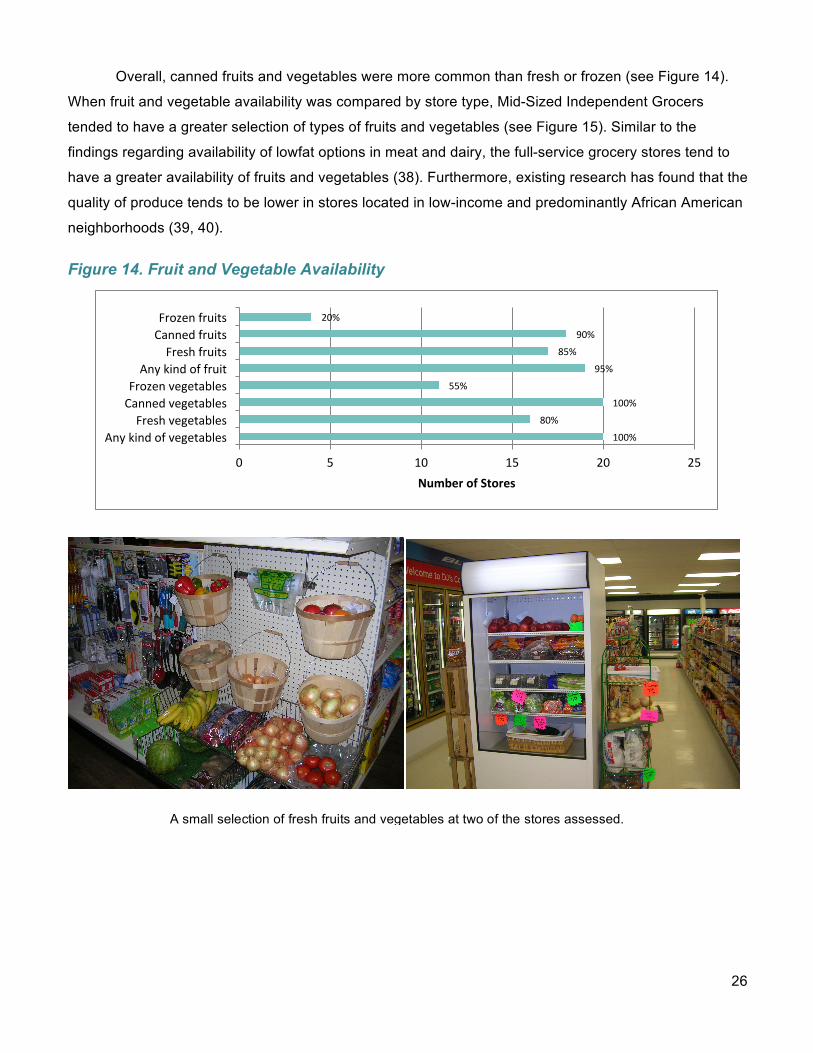
Overall, canned fruits and vegetables were more common than fresh or frozen (see Figure 14).
When fruit and vegetable availability was compared by store type, Mid-Sized Independent Grocers
tended to have a greater selection of types of fruits and vegetables (see Figure 15). Similar to the
findings regarding availability of lowfat options in meat and dairy, the full-service grocery stores tend to
have a greater availability of fruits and vegetables (38). Furthermore, existing research has found that the
quality of produce tends to be lower in stores located in low-income and predominantly African American
neighborhoods (39, 40).
Figure 14. Fruit and Vegetable Availability
100%
80%
100%
55%
95%
85%
90%
20%
0 5 10 15 20 25
Any kind of vegetables Fresh vegetables
Canned vegetables Frozen vegetables Any kind of fruit
Fresh fruits Canned fruits Frozen fruits
Number of Stores
A small selection of fresh fruits and vegetables at two of the stores assessed.

27
Figure 15. Fruit and Vegetable Availability by Store Type
Overall, grains, beans, and cereal were more widely available in the sugared, less whole-grain
versions (see Figure 16). Similar to findings regarding fruits, vegetables, and lowfat dairy and meats,
when whole grain and bean availability was compared by store type, Mid-Sized Independent Grocers
tended to have a greater variety and more types of whole grains and beans (see Figure 17).
100%
80%
100%
80%
100%
100%
100%
40%
100%
83%
100%
67%
100%
100%
83%
17%
100%
78%
100%
33%
89%
67%
89%
11%
0% 20% 40% 60% 80% 100%
Any kind
Fresh vegetables
Canned vegetables
Frozen vegetables
Any kind
Fresh fruits
Canned fruits
Frozen fruits
Small Grocers/Convenience (w/out gas)
Small Grocers/Convenience (w/gas)
Mid-‐Sized Independent

28
Figure 16. Whole Grain, Bean, and Cereal Availability
In addition to indicating whether a food item was present, the observational scan tool also
asks for a score on variety and freshness/quality of fruits and vegetables. Mean responses on
the variety of fruits and vegetables are indicated in Figure 18. Quality of fruits and vegetables
was determined visually by the observer according to the scale in Figure 19, which also shows
mean responses.
95%
60%
90%
30%
100%
15%
95%
60%
95%
100%
70%
60%
100%
0 5 10 15 20 25
Sugary cereal
Low-‐sugar cereal
Oatmeal (plain)
Any kind of oatmeal
Canned beans (in water)
Dried beans
Any kind of beans
High-‐fiber pasta
Any kind of pasta
Brown rice (plain)
Any kind of rice
High-‐fiber bread
Any kind of bread
Number of Stores

29
Figure 17. Whole Grain, Bean, and Cereal Availability by Store Type
Figure 18. Fruit and Vegetable Variety, Mean Responses 0 1 2 3
None Limited variety (1-3 types)
Moderate variety (4-6 types)
Wide variety (7 or more types)
Fresh fruit
Fresh vegetables
100%
80%
80%
100%
100%
100%
100%
40%
100%
60%
100%
80%
80%
100%
50%
67%
100%
83%
67%
83%
0%
100%
33%
83%
67%
100%
100%
44%
89%
11%
100%
11%
100%
33%
100%
100%
67%
56%
100%
0% 20% 40% 60% 80% 100%
Sugary cereal
Low-‐sugar cereal
Oatmeal (plain)
Any kind of oatmeal
Canned beans (in water)
Dried beans
Any kind of beans
High-‐fiber pasta
Any kind of pasta
Brown rice (plain)
Any kind of rice
High-‐fiber bread
Any kind of bread
Small Grocers/Convenience (w/out gas)
Small Grocers/Convenience (w/gas)
Mid-‐Sized Independent
2.3
2.6
30
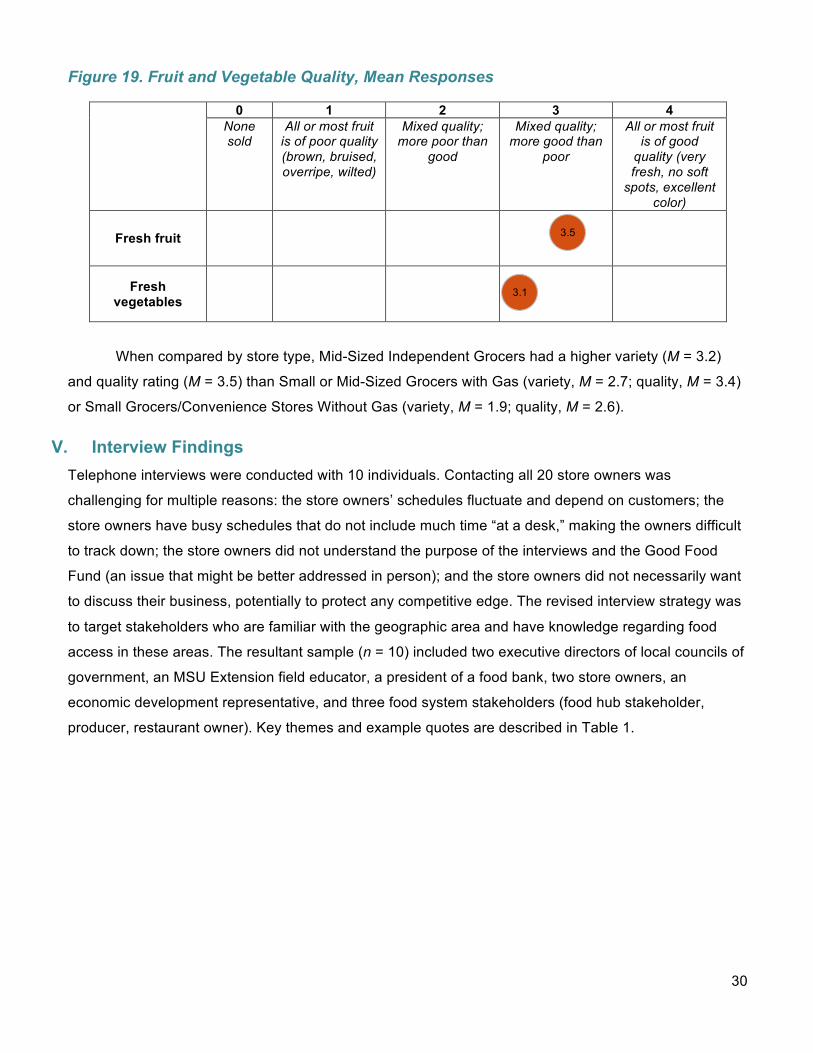
Figure 19. Fruit and Vegetable Quality, Mean Responses
0 1 2 3 4 None sold
All or most fruit is of poor quality (brown, bruised, overripe, wilted)
Mixed quality; more poor than
good
Mixed quality; more good than
poor
All or most fruit is of good
quality (very fresh, no soft
spots, excellent color)
Fresh fruit
Fresh vegetables
When compared by store type, Mid-Sized Independent Grocers had a higher variety (M = 3.2)
and quality rating (M = 3.5) than Small or Mid-Sized Grocers with Gas (variety, M = 2.7; quality, M = 3.4)
or Small Grocers/Convenience Stores Without Gas (variety, M = 1.9; quality, M = 2.6).
V. Interview Findings Telephone interviews were conducted with 10 individuals. Contacting all 20 store owners was
challenging for multiple reasons: the store owners’ schedules fluctuate and depend on customers; the
store owners have busy schedules that do not include much time “at a desk,” making the owners difficult
to track down; the store owners did not understand the purpose of the interviews and the Good Food
Fund (an issue that might be better addressed in person); and the store owners did not necessarily want
to discuss their business, potentially to protect any competitive edge. The revised interview strategy was
to target stakeholders who are familiar with the geographic area and have knowledge regarding food
access in these areas. The resultant sample (n = 10) included two executive directors of local councils of
government, an MSU Extension field educator, a president of a food bank, two store owners, an
economic development representative, and three food system stakeholders (food hub stakeholder,
producer, restaurant owner). Key themes and example quotes are described in Table 1.
3.5
3.1

31
Table 1. Themes and Example Quotes from Key Informant Interviews
Theme Description Example Quote Drain of the supercenter
• Rural consumers in northeast MI are driving long distances to shop at supercenters (e.g., Walmart)
“People will drive to shop at Walmart thinking they are saving money. You know, they will save a dollar on a product, but it will cost them $15.00 in gas to get there and back.”
Limited availability of small, local stores and pantries
• Locally owned stores are closing
“A lot of the problem is because the big grocery chains have gone away and some of the locally owned grocers that have a history of being in a community have ... been bought out by national chains and then later closed. We have lost a lot of our family-owned grocers that used to do a really good job at having variety and consistency in a neighborhood.”
Demand for convenience items
• People want fast and cheap “It’s going to cost you $10 for a pound of hamburger, and it’s going to cost you $1 to go to McDonald’s. Where are you going to go? Then it becomes an accelerated pattern, because you have the health problems associated with that.” “People come in often for our ready-made items. It’s been going well since we started our new sandwiches that are made here with our homemade buns.”
Transportation challenges
• Distance and cost is a large barrier to accessing healthy foods
• Transportation is one of the largest barriers to accessing healthy foods
• Areas in northeast MI experience greater difficulties with food access and people have to drive to get to grocery stores
“One of the biggest challenges is transportation. You can have everything, 20 miles away, but people can’t get to it.”
Economic challenges
• Economically deprived area; residents are underemployed and struggling to make ends meet
• People are not getting the jobs to sustain themselves, improve their living situation
“There isn’t a single person that I know that doesn’t know someone or have had themselves completely lose their jobs, lose their home, lose everything. Live with four kids in a one-bedroom apartment, to try to get by. It’s happened here repeatedly.” “In some of the really rural areas where a lot of jobs don’t get replaced, it becomes a little more chronic. That families aren’t able to get employment, or they are disabled and cannot work.”
Cost of healthy eating
• Most important factor driving food purchasing among rural northeast MI consumers is price
• Higher cost of healthy foods, and all foods overall, in rural MI
• SNAP is less available in stores in small communities
• Stores have to keep their prices down in order to remain competitive
“Downtown, little IGA, that’s what you would probably find in little small communities. There’s no wiggle room for much extra, impacting cost.” “Everything is more expensive here. It’s very much a third-world mentality. Everybody is so desperate for jobs, for money, for food, they will sell their soul just for that little bit. So, there is not a lot of thought process that goes into anything. Everything comes down to survivalism.” “Even if there is fresh produce available, it’s so expensive or past its prime, that is not attractive to people walking into the shops.”

32
Theme Description Example Quote Aging and dwindling population
• Younger people moving away from smaller towns
• Transportation issues are heightened in the elderly population
• Small church pantries do not have the volunteers to maintain; aging volunteers
“A lot of our young people are moving away from the small towns to more urban areas. This leaves behind a lot of elderly folks who have trouble getting to the store.”
Interest in Michigan-grown foods
• Despite a lack of willingness to pay higher prices, rural northeast MI residents are interested in locally produced foods
• Farmers markets are popular (especially among seniors), but people are often unwilling to pay higher prices
• Supporting neighbors • Pride in the region
“More and more people in the region want to know where their food supply is coming from, but low-income people can’t always pay the price.”
Evolving agricultural system
• Mix of traditional/conventional farming (soybeans, corn, dairy, beef) and slowly increasing smaller, more diversified farms
• Not currently sufficient production in northeast Michigan to support a local food hub2
“It’s mostly traditional farming, 99% traditional farming—soybeans, corn, dairy, beef. We do have a couple of high-end commodity—kidney bean and potatoes. Farming is a big part of these communities. There are some counties like Montmorency and Alcona counties, just to the southeast of us here in the northeast, that have extensive federal and state lands that really suffer. Those are the communities that really suffer from food and everything because they don’t have the tax base because of the federal and state lands that are there.”
“I think it’s the problem we have here is we don’t have any more land. It’s prime now to get any type of agricultural farmland right now, at $10,000 an acre plus.”
Need for education
• Need for nutrition education for consumers, agricultural education for multiple sectors
• Need to build demand for healthier foods
• People no longer know how to cook • Low-income people using SNAP to
purchase unhealthy foods
“So many other things stacked against what would be healthier choices, it’s hard for the healthier choices to ever win. Even when they are there, I don’t think they get picked when you have pizzas and hot dogs and different things on service lines there. Low-cost produce in any kind of market is not going to help, either, if you still have all the other choices there. It’s really the education of what to do with fresh produce, why it’s a better option, getting it incorporated into the home and the family. Educating people on what to do with a zucchini is really more critical than putting more options everywhere, because people still aren’t going to choose it.”
“EBT—some use it for what it is meant, but others buy instead things like pop, chips, snacks, junk, non-nutritional foods. This stuff was taken out of school but they will come in after school and buy it with their EBT cards. Parents will bring them in and that’s all they will purchase.”
2 This was also a finding from a food systems assessment conducted by the interviewee and their partners.

33
Theme Description Example Quote Areas of opportunity
• Investing in existing stores • Nutrition education (cooking skills) • Innovative distribution • Expand utilization of Double Up Food
Bucks
“Starting a grocery store, you have to have a business plan, you have to know your commuting patterns and demand—it is a formidable task, even if you are a pretty decent businessman. It would be nice if some of the existing smaller grocery stores could access funding to expand, or something like that. But to start from scratch is a big, big job.” “We are talking semi loads of fresh produce. If you have six truckloads full of peppers, there are only so many agencies you can call in a day or two’s time and have them get the peppers out. But if we could drive up five counties, and have a super-agency or hub that actually has a cooler and has capacity to store a semi load of produce, then all the local agencies from that county could maybe come and pick it up from them.“ “Mobile food pantry, upwards of 630 of those a year, that go out to rural counties with food distribution as well. Sometimes the agency is further away than any one family might be able to travel. A lot of agencies partnered together to host mobile pantries in underserved areas of the county.”
Tourists vs. local population
• Need to differentiate between tourists visiting northeast MI and locals
• In many cases, the tourists are more open to locally sourced foods, higher prices
“We have less than 20% customer and support from local people; 80% of our business or more comes from outside, from people ... traveling through.”

34
CONCLUSIONS AND RECOMMENDATIONS
The information generated in this report can be used to inform future food access work in northeast
Michigan by describing current challenges and practices and highlighting areas of opportunity. This
report can be used as a starting point to help brainstorm future work to address food access in northeast
Michigan. The developed map highlights areas that are low–food access and low-income and in which
the availability of food retail outlets is limited. Small stores in these rural areas may be prime businesses
for investment, allowing the stores to expand their ability to offer more healthful products. In particular,
small independent grocers and corner stores in small towns across the 15-county region studied may
benefit from the types of investment that expand the store owners’ ability to source, store, and sell more
local and fresh products. In addition, Double-Up Food Bucks has a role to play in incentivizing both store
owners and consumers.
In addition to infrastructure at the store level, distribution systems for these rural areas should be
addressed. The food environment observational scan revealed that more healthful whole-food products
(fruits, vegetables, whole grains, lowfat meat and dairy) are more readily available and of higher quality
in the larger grocery stores (Mid-Sized Independent Grocers) than in smaller grocery stores and
convenience stores. We believe these smaller stores could expand their healthful food offerings and may
be good candidates for business and/or loan assistance from the Michigan Good Food Fund, perhaps
coupled with more in-depth nutrition education in the community. It may be possible to partner with one
of the distributors that currently deliver to these rural stores in order to create a program aimed at
expanding stores’ offerings of fresh produce and other healthy items, possibly through the design and
use of innovative displays and coolers. Such a program could get a significant boost by working with the
Double Up Food Bucks program, which would stimulate purchases and sales of healthy items through
the use of matching dollars, benefiting both the store owner via increased sales and the customer
through direct savings on purchases. The information obtained from the current study can be used to
identify the stores that would be good candidates for such a program in the areas of highest need.
Given the increased reliance on ready-to-eat items, the healthfulness of these foods could be
enhanced to “meet people where they are.” This type of targeted intervention could have a large impact
on the dietary patterns in these rural communities, where convenience options are not as plentiful as in
more densely populated areas. Store owners are catering to the customer demand, which tends to be
largely for convenience items in the smaller stores. In addition, more revenue comes from tourists in the
summer, with limited sales volume in the winter; therefore, store owners tend to stick to items that will
sell and tend not to take many risks. However, store owners who have been in business for a while and
are part of the local community do tend to provide more locally sourced options and fresh items. This
shows a level of autonomy and agency that store owners can take—and if they have the resources and

35
education to provide specific items, and customers will buy it, it can be done. The Michigan Good Food
Fund and Double Up Food Bucks can help facilitate more stores sourcing and selling local and fresh
foods through infrastructure improvements and promotion.
Simply increasing options for healthy foods may not be sufficient on its own to change
consumers’ dietary habits to be more healthful. There is a need to develop a demand for healthier
products among rural northeast MI consumers through nutrition education opportunities. Perhaps efforts
from the Michigan Good Food Fund can be paired with local existing programming (including but not
limited to MSU Extension and community health) and provide further opportunities to change knowledge
and behaviors among this often-overlooked region of Michigan.
36
REFERENCES
1. Kirkup M, Kervenoael RD, Hallsworth A, Clarke I, Jackson P, del Aguila RP. Inequalities in retail
choice: Exploring consumer experiences in suburban neighbourhoods. Int J Retail Distrib Manag. 2004 Jan 11; 32(11): 511–22.
2. Lake A, Townshend T. Obesogenic environments: Exploring the built and food environments. J R Soc Promot Health. 2006 Nov 1; 126(6): 262–7.
3. Laska MN, Borradaile KE, Tester J, Foster GD, Gittelsohn J. Healthy food availability in small urban food stores: A comparison of four U.S. cities. Public Health Nutr. 2010 Jul; 13(7): 1031–5.
4. Liese AD, Weis KE, Pluto D, Smith E, Lawson A. Food store types, availability, and cost of foods in a rural environment. J Am Diet Assoc. 2007 Nov; 107(11): 1916–23.
5. Kaufman PR, MacDonald JM, Lutz SM, Smallwood DM. Do the poor pay more for food? Item selection and price differences affect low-income household food costs [Internet]. United States Department of Agriculture, Economic Research Service; 1997 [cited 2011 Dec 23]. Report No.: 34065. Available from: http://econpapers.repec.org/paper/agsuerser/34065.htm
6. Bustillos B, Sharkey JR, Anding J, McIntosh A. Availability of more healthful food alternatives in traditional, convenience, and nontraditional types of food stores in two rural Texas counties. J Am Diet Assoc. 2009 May; 109(5): 883–9.
7. Bailey J. Rural grocery stores: Importance and challenges [Internet]. Lyons, NE: Center for Rural Affairs; 2010 Oct. Available from: http://files.cfra.org/pdf/rural-grocery-stores.pdf
8. Sharkey JR, Horel S. Neighborhood socioeconomic deprivation and minority composition are associated with better potential spatial access to the ground-truthed food environment in a large rural area. J Nutr. 2008 Mar 1; 138(3): 620–7.
9. Moore LV, Roux AVD, Franco M. Measuring availability of healthy foods: Agreement between directly measured and self-reported data. Am J Epidemiol [Internet]. 2012 Jan 24 [cited 2012 Jul 9]; Available from: http://aje.oxfordjournals.org/content/early/2012/01/24/aje.kwr445
10. Calancie L, Leeman J, Jilcott Pitts SB, et al. Nutrition-related policy and environmental strategies to prevent obesity in rural communities: A systematic review of the literature, 2002–2013. Prev Chronic Dis. 2015; 12: E57.
11. Johnson DB, Quinn E, Sitaker M, et al. Developing an agenda for research about policies to improve access to healthy foods in rural communities: A concept mapping study. BMC Public Health. 2014; 14(1): 592.
12. Slide 1 - Pinard - Small Food Stores in Rural Communities.pdf [Internet]. [cited 2015 Aug 25]. Available from: http://www.ruralgrocery.org/news-archive/Pinard%20-%20Small%20Food%20Stores%20in%20Rural%20Communities.pdf
13. Webber CB, Sobal J, Dollahite JS. Shopping for fruits and vegetables: Food and retail qualities of importance to low-income households at the grocery store. Appetite. 2010; 54(2): 297–303.
14. Lee S-E, Johnson KK, Gahring SA. Small-town consumers’ disconfirmation of expectations and satisfaction with local independent retailers. Int J Retail Distrib Manag. 2008; 36(2): 143–57.

37
15. Mullis K, Kim M. Factors determining inshopping in rural U.S. communities: Consumers’ and retailers’ perceptions. Int J Retail Distrib Manag. 2011; 39(5): 326–45.
16. The Food Trust | Home [Internet]. [cited 2015 Aug 25]. Available from: http://thefoodtrust.org/
17. michigan-mapping-final.original.pdf [Internet]. [cited 2015 Aug 25]. Available from: http://thefoodtrust.org/uploads/media_items/michigan-mapping-final.original.pdf
18. Feeding America West Michigan. Hunger rate rises in West Michigan, Upper Peninsula according to new report | Feeding America West Michigan Food Bank [Internet]. [cited 2015 Aug 25]. Available from: https://www.feedingamericawestmichigan.org/2015/04/hunger-rate-rises-in-west-michigan-upper-peninsula-according-to-new-report/
19. Morton LW, Bitto EA, Oakland MJ, Sand M. Solving the problems of Iowa food deserts: Food insecurity and civic structure. Rural Sociology. 2005; 70(1): 94–112.
20. Morton L, Blanchard T. Starved for access: Life in rural America’s food deserts. Rural Realities. 2007; 1(4): 1–10.
21. Healthier Food Retail: Beginning the Assessment Process in Your State or Community - hfrassessment.pdf [Internet]. [cited 2015 Aug 25]. Available from: http://www.cdc.gov/obesity/downloads/hfrassessment.pdf
22. 2.5.15 HCSM Toolkit with Intro.pdf - Food-Environment-Measures-Resource-Guide.pdf [Internet]. [cited 2015 Aug 25]. Available from: http://centerfornutrition.org/wp-content/uploads/2011/04/Food-Environment-Measures-Resource-Guide.pdf
23. Hilbert, N, Evans-Cowley J, Reece J, Rogers C, Ake W, Hoy C. Mapping the cost of a balanced diet, as a function of travel time and food price. J Agric Food Syst Community Dev. 2014 Dec 6; 105–27.
24. Hoehner CM, Schootman M. Concordance of commercial data sources for neighborhood-effects studies. J Urban Health. 2010 Jul 1; 87(4): 713–25.
25. Moore LV, Diez Roux AV. Associations of neighborhood characteristics with the location and type of food stores. Am J Public Health. 2006 Feb; 96(2): 325–31.
26. Wang MC, Gonzalez AA, Ritchie LD, Winkleby MA. The neighborhood food environment: Sources of historical data on retail food stores. Int J Behav Nutr Phys Act. 2006 Jul 17; 3(1): 15.
27. Block D, Kouba J. A comparison of the availability and affordability of a market basket in two communities in the Chicago area. Public Health Nutr. 2006 Oct; 9(7): 837–45.
28. Larson NI, Story MT, Nelson MC. Neighborhood environments: Disparities in access to healthy foods in the U.S. Am J Prev Med. 2009 Jan; 36(1): 74–81.
29. Powell LM, Slater S, Mirtcheva D, Bao Y, Chaloupka FJ. Food store availability and neighborhood characteristics in the United States. Prev Med. 2007 Mar; 44(3): 189–95.
30. Andreyeva T, Blumenthal DM, Schwartz MB, Long MW, Brownell KD. Availability and prices of foods across stores and neighborhoods: The case of New Haven, Connecticut. Health Aff (Millwood). 2008 Sep 1; 27(5): 1381–8.
38
31. Rimkus L, Powell LM, Zenk SN, et al. Development and reliability testing of a food store observation form. J Nutr Educ Behav. 2013 Dec; 45(6): 540–8.
32. Hosler AS, Dharssi A. Reliability of a survey tool for measuring consumer nutrition environment in urban food stores: J Public Health Manag Pract. 2011; 17(5): E1–8.
33. D’Angelo H, Evenson KR, Rose S, Fleischhacker S, Myers AE, Ribisl KM. Examination of community and consumer nutrition, tobacco and physical activity environments at food and tobacco retail stores in three diverse North Carolina communities. Prev Med Rep. 2015; 2: 730-736.
34. Andreyeva T, Luedicke J, Middleton AE, Long MW, Schwartz MB. Positive influence of the revised Special Supplemental Nutrition Program for Women, Infants, and Children food packages on access to healthy foods. J Acad Nutr Diet. 2012; 112(6): 850–8.
35. Zenk SN, Powell LM, Isgor Z, Rimkus L, Barker DC, Chaloupka FJ. Prepared food availability in U.S. food stores: A national study. Am J Prev Med. 2015; 49(4): 553-562.
36. Sharkey JR, Dean WR, Nalty CC, Xu J. Convenience stores are the key food environment influence on nutrients available from household food supplies in Texas Border Colonias. BMC Public Health. 2013; 13(1): 45.
37. Morland K, Diez Roux AV, Wing S. Supermarkets, other food stores, and obesity: The Atherosclerosis Risk in Communities Study. Am J Prev Med. 2006 Apr; 30(4): 333–9.
38. Timperio A, Ball K, Roberts R, Campbell K, Andrianopoulos N, Crawford D. Children’s fruit and vegetable intake: Associations with the neighbourhood food environment. Prev Med. 2008; 46(4): 331–5.
39. Zenk SN, Schulz AJ, Israel BA, James SA, Bao S, Wilson ML. Fruit and vegetable access differs by community racial composition and socioeconomic position in Detroit, Michigan. Ethn Dis. 2005; 16(1): 275–80.
40. Morland K, Wing S, Diez Roux A, Poole C. Neighborhood characteristics associated with the location of food stores and food service places. Am J Prev Med. 2002 Jan; 22(1): 23–9.

39
APPENDIX A. RURAL RETAIL FOOD ENVIRONMENT OBSERVATIONAL SCAN TOOL
Store Name: _________________________________ License Type: ________________________________
Type of Store (þ all that apply):
¨ Supermarket: Chain (e.g., Meijer, Family Fare)
¨ Supermarket: Independent ¨ Mid-Sized Independent ¨ Small Grocer (w/gas) ¨ Small Grocer (w/out gas) ¨ Natural/Gourmet/Specialized ¨ Limited: Food Mart/Gas Station/Drug and
Others/Convenience ¨ Limited: Dollar Store
Store Address: _______________________________ County: _____________________________________ Number of Cash Registers: ______________ Number of Aisles: ______________ Store Hours: M-F: __________ S/S: ____________
Sell alcohol (circle all that apply): Beer Wine Liquor None
Sell tobacco products: Yes No
In-store tobacco ad: Yes No
Healthy eating promotion: Yes No
To ask store manager:
1. What type of food store do you consider yourself? _________________________________________
2. Do you accept WIC and/or SNAP? _______________________________________________________
3. Is there an EBT Terminal on-site? Yes, working Yes, but not working No
Signage
1. List any general signage promoting healthy food items or healthy eating (outside of store,
other locations within the store).
2. Are there any items promoting locally grown produce? (Circle one.) Yes No

40
Instructions: Place a check mark (þ) next to all foods observed in the store across the five groups (prepared foods, fresh fruits and vegetables, dairy, beverages, whole grains,
and lean meats).
A. Fast Food or Other Individual Ready-to-Eat Items
B. Beverages
NO YES NO YES
Salad/salad bar ☐ ☐ Sugary drinks ☐ ☐
Sandwiches (cold) ☐ ☐ Bottled water (plain) ☐ ☐
Pizza ☐ ☐ Alcohol ☐ ☐
Hot dogs/corn dogs/hamburgers ☐ ☐
Mexican (tacos, burritos, taquitos, etc.) ☐ ☐
French fries ☐ ☐ Other: ___________________ ☐ ☐
C. Dairy and Eggs, and Meat D. Snacks
NO YES NO YES
Milk, whole (vitamin D), unflavored ☐ ☐ Potato chips, regular (not lowfat) ☐ ☐
Milk, 2% fat, unflavored ☐ ☐ Snack cakes (e.g., Ho-Hos, Cupcakes, Swiss Rolls) or Doughnuts
☐ ☐
Milk, 1% fat or skim, unflavored ☐ ☐ Cookies ☐ ☐
Any fresh meat (e.g., fresh beef, pork, chicken, turkey, lamb. Do not include fresh or frozen fish, frozen meats, or processed meats like hot dogs, bacon, ham, bologna, or other cold cuts.)
☐ ☐ Candy (e.g., gummies) ☐ ☐
Ground beef, regular (>10% fat) ☐ ☐ Chocolate bars ☐ ☐
Ground beef, extra lean (≤10% fat) ☐ ☐ Baked or lowfat potato chips ☐ ☐ Fresh eggs ☐ ☐ Crackers ☐ ☐ Canned tuna (in water) ☐ ☐ Ice cream ☐ ☐

41
Fresh or frozen fish fillet ☐ ☐ Circle the number that best describes the overall availability of fruits and vegetables inside and outside the store. None Limited variety
(1–3 types) Moderate variety
(4–6 types) Wide variety
(7 or more types) Fresh fruit 1 2 3 4
Fresh vegetables 1 2 3 4
Vegetables Fruits
NO YES
NO YES
Any kind ☐ ☐ Any kind ☐ ☐
Fresh vegetables ☐ ☐ Fresh fruits ☐ ☐
Canned vegetables ☐ ☐ Canned fruits ☐ ☐
Frozen vegetables ☐ ☐ Frozen fruits ☐ ☐
Bread Rice
Any kind ☐ ☐ Any kind ☐ ☐
High fiber bread (fiber ≥ 2g/slice) ☐ ☐ Brown rice (plain) ☐ ☐
Pasta Beans
Any kind ☐ ☐ Any kind ☐ ☐
High-fiber pasta (fiber ≥ 5g/2 oz.) ☐ ☐ Dried beans ☐ ☐
Canned beans (in water) ☐ ☐ Cereal
Any kind ☐ ☐ "Healthy" cereals (100% whole grain, sugar < 7g per serving) ☐ ☐
Oatmeal (plain) ☐ ☐ Sugary cereal (sugar ≥ 7 g per serving) ☐ ☐

42
Circle the number that best describes the overall quality of the fresh fruit.
0 1 2 3 4 None sold All or most fruit
is of poor quality (brown, bruised, overripe, wilted)
Mixed quality; more poor than
good
Mixed quality; more good than
poor
All or most fruit is of good quality
(very fresh, no soft spots, excellent
color) Circle the number that best describes the overall quality of the fresh vegetables.
0 1 2 3 4
None sold All or most vegetables are of poor quality
(brown, bruised, overripe, wilted)
Mixed quality; more poor than
good
Mixed quality; more good than
poor
All or most vegetables are of good quality (very
fresh, no soft spots, excellent
color) Notes:
End of Environmental Scan

43
APPENDIX B. RETAILER TYPE BY COUNTY

44
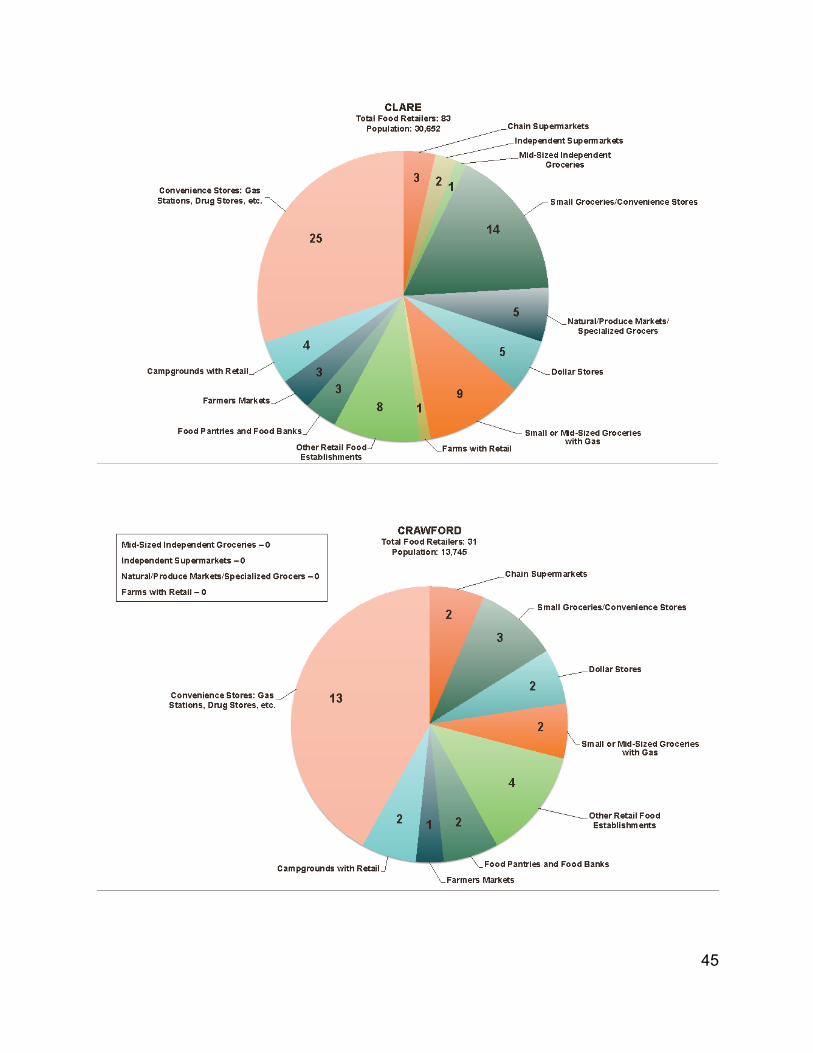
45

46

47

48

49

50

Michigan State University Center for Regional Food Systems 51
APPENDIX C. FOOD ENVIRONMENT DATA BY COUNTY
Data for the first four tables in this appendix were adapted from: Economic Research Service (ERS), U.S. Department of Agriculture (USDA). Food Environment Atlas. http://www.ers.usda.gov/data-products/food-environment-atlas.aspx. U.S. Census Bureau, 2010 Census & the 2010 American Community Survey, 1-Year Estimates.
County Sociodemographics
% White (2010) % Black (2010)
% 65+ (2010) % ≤19 (2010) Poverty rate
(2010) Alcona 97.9 0.1 32.5 16.1 15.1 Alpena 97.5 0.3 20.1 22.6 17.3 Arenac 96.8 0.2 20.9 21.6 18.1 Cheboygan 93.5 0.5 22.3 21.7 17.8 Clare 96.8 0.5 20.4 22.8 26.5 Crawford 97.5 0.4 21.6 21.4 16.8 Gladwin 97.7 0.2 23.3 21.8 21.4 Huron 97.5 0.4 22.2 22.3 15.8 Iosco 96.4 0.5 26.6 19.3 19.0 Montmorency 97.6 0.2 27.6 17.8 18.1 Ogemaw 97.1 0.2 22.6 22.2 21.5 Oscoda 97.7 0.2 24.4 21.5 20.2 Otsego 96.9 0.3 17.6 25.0 13.5 Presque Isle 97.6 0.4 27.1 18.8 12.9 Roscommon 97.3 0.4 28.5 17.7 22.2