opportunities, problems and solutions when … problems and solutions when instrumenting a machine...
TRANSCRIPT

Opportunities, problems and solutions when instrumenting a machine tool for monitoring of cutting forces and vibrations
P. Norman, D. Legge & M . Backstrom Division of Manufacturing Systems Engineering, Luleli: University of Technology, LuleiE, Sweden.
Abstract
The ability to monitor the behaviour of machine tools and cutting processes is important both from a research perspective as well as in industrial applications such as adaptive control, condition monitoring, process optimization and quality control. The division of Manufacturing Engineering at Lulei University of Technology has been carrying out research in the area of h g h speed and multi axis (5-axis) machming since the mid 1990s. Ths European and nationally funded research, much of it carried out with Nottingham University and Sandvlk Coromant, as well as in manufacturing companies in Sweden and the UK, has focused on understanding the possibilities offered by 5-axishgh-speed machining, as well as understanding the machining process. This initially empirical work has become more qualitative through the development of an instrumented machine tool test bed based on a 5-axis Leichti Turbomill equipped with a 24,000 rpm spindle and fast controller. The machine installation costs approximately 1.000.000 USD. The instrumentation that has been implemented includes piezo-electric force transducers in the machine table whilst ongoing work will move the research focus towards monitoring vibration in the workpiece for which accelerometers and acoustic emission sensors will be used. The work presented will highlight the problems and solutions involved in creating the present test bed as well as indicating future research directions and challenges.
Transactions on Engineering Sciences vol 44, © 2003 WIT Press, www.witpress.com, ISSN 1743-3533

558 Laser Metrology und Muchiize Performance VI
1 Introduction
1.1 Background
The division of Manufacturing Systems Engineering at LuleH University of Technology have been carrying out research in the area of high speed and 5-axis machining since the mid 1990's. T h s work, much of it empirical at the beginning , has become more qualitative through the development of an instrumented machine tool test bed based on a Liechti Turbomill equipped with a 24.000 rpm 30kW spindle and fast controller.
The Liechti Turbomill was originally made for the machning of turbine blades. Our machne has been modified by the addition of a machine table instead of the standard two chucks. The table can carry up to 500kg and it is 1000mm X
500mm. The division has long experience of metal cutting research, but 5-axis high-speed milling represents new territory for us.
The machne was bought with no sensors, apart from the axis and spindle motor power monitoring which are typically found on modern machines. Our aim was to gain practical knowledge of the machine and to incorporate the sensors necessary for the particular research done at any given point in time. The chosen sensors are integrated step wise. Ths approach enabled us to adopt the latest sensor technology and learn from our ongoing research. Backstrom [l] points out the possibilities, both pros and cons of such a platform.
The research area that we work in covers 5-axis and h g h speed milling applications, currently aimed at machining tool cavities in light alloys. Another important are is the understanding of how the tool, manufactured part and the whole machine are affected during milling and what happens when a tool wears.
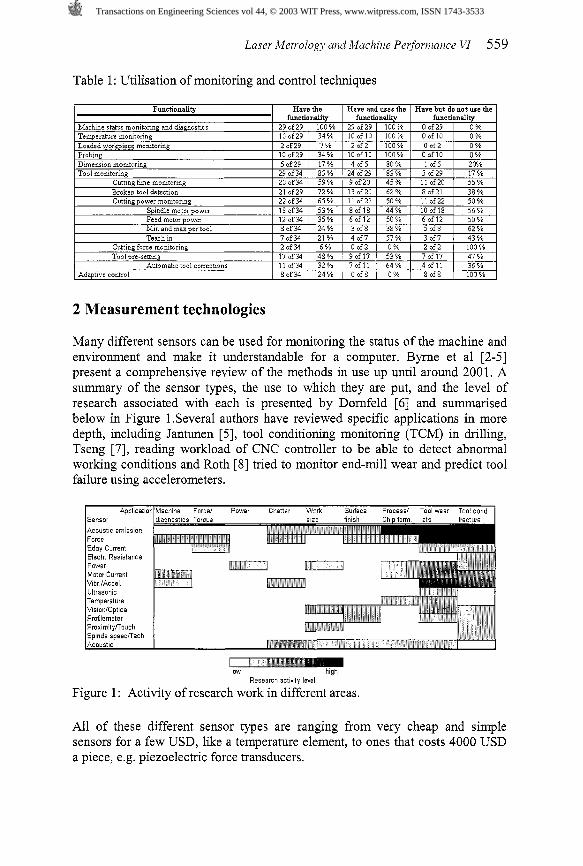
Advanced sensoring and monitoring capabilities are commonly built into new machines. Backstrom [l] presents a comprehensive survey that shows the utilization of different techniques in Swedish companies see Table 1. Of the 34 companies none used cutting force monitoring or adaptive control, even though they had the functionality in the machme On the other hand, there are almost 40% of those who have the functionality to detect a broken tool that uses it. According to Backstrom [ l ] the techniques aren't implemented because, amongst other things, that the system is hard to use, they have to small batch size and poor support from system vendor. The type of work a company is involved in, and factors like operator ambition, user confidence in support systems such as CAM also affects the utilization of these techniques.
Transactions on Engineering Sciences vol 44, © 2003 WIT Press, www.witpress.com, ISSN 1743-3533
Laser Metrology and Machine Performance VI 559
Table 1: Utilisation of monitoring and control techniques
Functionality H a v e the H a v e and user the H a v e but do not use the functionality functionality functionali(y
Machine status monltonng and diagnostics 29of29 100% 29of29 100% Oof29 0 % Temperature momtonng 10of29 34% lOeflO 100% Oof10 0 % Loaded ~o&pie.pje~~ monitoring 2 a f 2 9 7 % 2 o f 2 100% Oof2 0 % Prnhmo
2 Measurement technologies
Cutting force mamtering Toolprc-sctting
Automatx tool carrectmns A ~ ~ ~ V P rontrol
Many different sensors can be used for monitoring the status of the machine and environment and make it understandable for a computer. Byrne et a1 [2-51 present a comprehensive review of the methods in use up until around 2001. A summary of the sensor types, the use to which they are put, and the level of research associated with each is presented by Dornfeld [6] and summarised below in Figure 1.Several authors have reviewed specific applications in more depth, including Jantunen [ 5 ] , tool conditioning monitoring (TCM) in drilling, Tseng [7], reading workload of CNC controller to be able to detect abnormal working conditions and Roth [g] tried to monitor end-mill wear and predict tool failure using accelerometers.
I Auelicst~onlMach~ne Force1 Power Chatter Work Surface Process1 Tool wear Tool cond. l
2of34 17of34 11of34 R O ~ ? A
Sensor Acoustic emission Force Eddy Current Electr. Res~stance Power Motor Current Wbr.IAccei. Ultrasonc Temperature V~s~onIOpt~cal Profiometer Proximitynouch Sp~nde speednach Acoustic
Research activity level
Figure 1 : Activity of research work in different areas.
6 % 4 8 % 3 2 % 94%
All of these different sensor types are ranging from very cheap and simple sensors for a few USD, llke a temperature element, to ones that costs 4000 USD a piece, e.g. piezoelectric force transducers.
Oof2 9of17
7 o f l l 0 0 f 8
0 % 5 3 % 6 4 % 0 %
2 0 f 2 70117 40111 80fR
100% 4 7 % 36% 100%
Transactions on Engineering Sciences vol 44, © 2003 WIT Press, www.witpress.com, ISSN 1743-3533

560 Laser Metrology und Muchiize Performance VI
The characteristics of a sensor are usually related to the application it is being used for. The amount of data that a sensor outputs is an important factor to consider, both from the point of data logging, but also since this data must be subsequently processed and analysed. For the sensors that we consider this can range from one reading per second up to 1 million readings per second, so the amount of data that one sensor can generate is enormous, and place significant demands on the real time processing capabilities of the data logging equipment.
2.1 Different sensors and the applications
The sensors used in our platform and its applications shown in Figure 1 are described in this chapter. The applications are directed towards TCM.
2.1.1 Acoustic emission, AE The signal originates from several different phenomenon's, those are divided into two types, continuous signals and bursts. The continuous type signal is generated when there is plastic deformation of a ductile material. The bursts comes from a cracks that propagates through the material, when a chip breaks or when there is chip entanglement as shown by Inasaki [g]. The advantages of AE is that the signal measured, is a signal that originates from the zone of engagement where the chip is formed, shown in done by Matthews [10]. Another is that the sensor can be attached to almost any surface near the entry point. But it is difficult to measure the vibration pattern of the rotating tool, But Inasah [g] solved that by successfully measuring the AE signal of the tool through the cutting fluid supply system. The signal that is output by the piezoelectric sensor has low amplitude and a very hgh frequency, between 10- 1000 kHz, and therefore it has to be amplified with a low noise pre-amplifier with about 40-60 dB gain. Due to the h g h frequency spectrum of the signal it is simple to filter out the background noise often originating from lower frequencies.
P m n q d e f o m l m zone ' T a h q deformahoo zone
Figure 2: Deformation zones in the cutting process
Transactions on Engineering Sciences vol 44, © 2003 WIT Press, www.witpress.com, ISSN 1743-3533
Laser Metrology and Machine Performance VI 561
2.1.2 Force Force is one of the most important signals in milling or turning processes Larsson [ l l]. This is because of the direct effect the cutting force have on the machining accuracy and so if the forces can be controlled within certain predetermined limits it can, amongst other things, result in better surface of the workpiece and longer tool life. Ths type of sensor can be of two major types: piezoelectrical and resistance. Piezoelectric sensors are fast but cannot measure low frequency force fluctuations i.e. static force, they are also more expensive.
If we can gain an understanding of the cutting force an its implications we can optirnize the process and therefore decrease the cutting time. Due to the importance of monitoring cutting forces there are numerous papers written on this subject. Jun [l21 incorporated a spindle based force sensor to monitor the machining process, he found that after compensating for the spindle signature the signals was the same as from a table mounted dynamometer. Choudhury [l31 describes a method for estimating the tool flank wear by calculating the tangential cutting force coefficient from the average X and Y forces. Altintas [l41 developed a model that detects tool breakage withm one revolution of the tool by measuring the forces and using an adaptive filter, however the problem of setting the parameters of the filter remains. This is a problem because there are two type of residuals that occur while cutting, normal cutting transients are unwanted and has to be filtered out whilst the higher amplitude residuals produced by the breakage of a tool is the wanted element. The amplitude of these residuals are functions of runout of inserts, machining vibrations and insufficient filtering of transients, Altintas [14].
2.1.3 Vibration/accelerometer Accelerometers can be used to measure the frequency and amplitude of vibrations within the machme structure, spindle, tooling and workpiece.
The occurrence of vibrations during milling affects the surface finish and tool life. They occur because of wrongly chosen machning parameters such as depth of cut and feed per tooth. It is also imperative that the workpiece it self is rigidly mounted to the machine table, otherwise it will probably start to vibrate.
It can be manufactured in several different ways, but the majority uses the seismic principle as shown by Meydan [15]. A seismic type sensor uses a small mass that moves when the machineltool vibrates, this mass compresses or shears a element of different types depending on the wanted performance of the sensor. These types are, piezoelectric, piezoresistive, variable capacitance and servo accelerometers. The piezoelectric accelerometer can be used from 1Hz up to approximately 15 kHz, and they are mostly used for tool wear rate measurement and tool fracture detection, but also in chatter detection. Chen [l61 successfully detected tool failure with an accelerometer and showed that it can be implement and used for unattended milling an on line monitoring. The thresholds for tool failure was set up after a number of test runs. The drawback of this approach is
Transactions on Engineering Sciences vol 44, © 2003 WIT Press, www.witpress.com, ISSN 1743-3533

562 Laser Metrology und Muchiize Performance VI
that it is limited to just t h s setup of tool, machme and workpiece as Chen also remarks in the conclusion chapter. The simplicity of the sensor and its size, i.e. simple to attach to part or machine, is the biggest advantages of this sensor type.
2.1.4 Temperature The temperature sensor can be of many different types depending of what temperature range that is interesting and the resolution needed. There are those elements that can measure temperature of liquid iron and those who can measure down to zero degrees Kelvin. The mostly used sensor type for measurement of temperature in the macro environment, is the PTlOO element. It is simple and can be produced in many different forms. The temperature in the engagement point during milling is difficult to measure so PTlOO is almost always used for measuring the workpiece temperature and the room temperature. These measurements are then used to calculate an correction factor for the workpiece expansion. It can then be used for correcting the tool path so the tolerances are held within the limits. For measurement of the tool tip temperature several methods have been developed as presented by DimlaSnr [4]. Most of them consist of some type of thermal imaging system that looks at the chip temperature as 90% of the heat from the engagement point goes into the chip Boothroyd [17]. There are also methods where thermocouples have been put under the insert and compared to a infrared temperature measurement, Stephenson [18]. He found out that the better working method was to use a infrared camera due to the complexity of implementing the thermocouple near the engagement point, nevertheless the infrared method is a lot more expensive.
2.1.5 Visionloptical This method can be used in two different ways, either the camera looks at the tool tip or the camera is directed toward the surface. These methods can subsequently be divided into the methods shown by Kurada [19]. He uses both the image of the surface texture to determine a tool wear state and the image of the tool tip to do the same. The images are processed and a computer program decides whether it is a good or bad tool. These methods are shown to work satisfactory but further work has to be done within the area of grey level imaging processing. The difficult part is to classify the surface texture of the workpiece and connect it to the tool state, as the surface roughness can be influenced by other factors than the tool state, vibrations from spindle or workpiece movement.
3 Instrumented machine system
3.1 Liechti Turbomill machine test bed
The machine system consists of several parts, Liechti Turbomill, external sensors, signal conditioning and a computer for data logging, feature extraction and evaluation of data.
Transactions on Engineering Sciences vol 44, © 2003 WIT Press, www.witpress.com, ISSN 1743-3533

Laser Metrology and Machine Performance VI 563
The machining centre is a 5-axis Liechti Turbomill ST1200 with an Andron A400 control system. The drives are digital Indramat with SERCOS fibre-optic servo coupling. The machine spindle will run up to 24000rpm with 30kW constant power and offer a maximum of 61Nm torque at 5000rpm. This combination makes the machine capable of performing high speed motions with h g h geometric accuracy in almost any combination of material and tool.
3.2 Sensors
The first sensors to be implemented are the following: piezoelectric force, AE and accelerometers. These are to be mounted both in the machine table and spindle. And a torque sensor is also to be placed in the spindle. At a later date several temperature sensors and a CCD camera is to be included. The mounting of the sensors both in the machine table and spindle gives us the possibility to see the differences and interference patterns between the two locations. These sensors planned to be "of the shelve" products wherever possible. There is 17 sensors that are to be fitted to the machine. Some of the sensors are tri-axial and therefore it is 35 channels to monitor concurrently. National Instruments LabView is used for data logging and signal conditioning functions. Measurement of forces etc. is of little use for analytic work if the machme tool state is not known. Therefore we'll also take advantage of the possibility to read the PLC register, SERCOS-ring and Andron controller. The data that is possible to read here is consumed power, axis positions, torque, following error, axis speed and commanded position. It is also possible to write back data to the controller for adaptive control of the process.
The computer consist of a industrial PC with 12 PC1 and 8 ISA slots and is equipped with two 600MHz PentiumIII processors. It has the NT platform that can use the two processors simultaneously, the LabView software can also take advantage of the double processors. The CPU:s are thought to be fast enough initially, but if it shows that they are to slow they are simple to replace.
A schematic of the testbed is shown in Figure 3. At this point in time the machine bed force transducers (#l) have been installed. The machme bed AE (#4) and accelerometer (#6) are to be installed during Q1 2003. No date set for the rest of the sensors.
Transactions on Engineering Sciences vol 44, © 2003 WIT Press, www.witpress.com, ISSN 1743-3533

564 Laser Metrology und Muchiize Performance VI
External I \:3:1re 1:2ri i21: . L.c:I.I i? l: ' I sensors
Figure 3: External and internal sensors in the machine test bed
3.3 Physical installation of the external sensors
3.3.1 Machine table force transducers The sensors that have been implemented in the machine table are Artis AKS-33 force transducers. Some of the problems that we had during the installation of these sensors where related to the power supply. The high frequency ripple of the supply disturbed the charge amplifier inside the transducer so that the output signal was full of noise, this was solved by using a high quality, low noise, laboratory power supply. Another problem that arose was the setup of the table and how to rigidly mount it. The next problem was the calibration and validation. This was solved by using a combination of static and dynamic calibration, i.e. weights and a Kistler 9257 dynamometer.
3.3.2 Signal conditioning
The conditioning of the force transducer signal takes place in a National Instruments SCXI-1140 simultaneous sampling differential amplifier, the signal is then fed to a PCI-MIO-16E-4 multifunction DAQ board, using standard cabling. The conditioning and DAQ card are a translator between the analog world of the force transducer and the digital computer. These cards are part of the initial setup. When the machine is fully instrumented there will be several cards dedicated to its own sensor group, partly to gain speed and accuracy but also because the different sensors require different conditioning and voltages.
For logging and visualization of signals we use LabView. It is a program that are simple to use and makes it possible to use code from MatLab and other mathematical programs for signal interpretation and evaluation.
Transactions on Engineering Sciences vol 44, © 2003 WIT Press, www.witpress.com, ISSN 1743-3533

Laser Metrology and Machine Performance V1 565
The present setup makes it possible to log data at a rate of 20kHz concurrently on 12 channels.
4 Calibration and validation
The machining test bed sensors have to be calibrated and validated. This have to be done because most sensor output a voltage and that must be related to a, for example, a force.
4.1 Calibration
To get the right correlation between voltage and force we will use weights for the Z direction and a spring dynamometer for the X and Y. The weights ranged from 5 to 60kg in steps of 5kg and the spring dynamometer from 0 to 600N with a resolution of ION. Because the table have four tri-axial force transducer, one in each corner the process of calibration have to be repeated at several places to compensate for the differences in magnitude and linearity of the output signals.
4.2 Validation
To validate the system the program CutPro from Malinc is used to simulate and calculate the process and that data is then correlated to the real process and if the calibration is done correctly and the program for computing the forces also is right the two should match. In addition to t h s will a Kistler 9257 cutting force dynamometer, that are calibrated from the factory, be used to further validate the machine resident sensors.
5 Discussion
Implementation of the described sensors will be used in research aimed at developing better understanding of how the chip forming process work in multi axis and h g h speed machining.
The implementation of the sensors and all surrounding hardware and software that is needed gave us some problems. The first problem arose when trying to log data from the Kistler dynamometer at a hgher rate of 2000Hz. At first we thought that it was a hardware problem but is showed to be a programming fault in the LabView software. When this was solved we were able to log data at 250kHz. This speed makes it possible to log data from the cutting process, with spindle speeds of 24.000rpm, with 50 values per rotation on 12 channels concurrently. But there is a downside to this, the amount of data to be analyzed becomes enormous. The sensors used are of standard types and therefore it should be possible to implement them in an industry, however the biggest problem isn't the sensor implementation, it is the signal interpretation and how to regulate the process from the data that is collected. Although there have been
Transactions on Engineering Sciences vol 44, © 2003 WIT Press, www.witpress.com, ISSN 1743-3533

566 Laser Metrology und Muchine Performance VI
extensive work done about the different sensors, there are very few that have implemented several types of sensors in one platform. So we might be able to, if we use the sensors in the right way, discard some of them, because they solely will give us enough information about the process. The LabView software has shown to be a powerful software for data logging and evaluation of the gathered signals. It has a GUI that is easy to understand and use.
Acknowledgments
This work is part of the European funded AHEAD project. T h s financial help is gratefully acknowledged.
References
[ l ] Backstrom, M., On monitoring and control of machining processes, PhD Thesis, in Departmeat of Applied Physics and Mechanical Engineering. Lulei university of technology: Lulei. p. 148,1999
[2] Byrne, G.D., D.;Inasaki, I.;Ketteler, G.;Konig, W.;Teti, R., Tool condition monitoring (TCM) - the status of research and industrial application. CIRP Annals - Manufacturing Technology. 44(5): p. p 541-567, 1995
[3] Prickett, P.W. and C. Johns, An overview of approaches to end milling tool monitoring. International Journal of Machme Tools and Manufacture. 39(1): p. 105-122, 1999
[4] DlmlaSnr., D.E., Sensor signals for tool-wear monitoring in metal cutting operations--a review of methods. International Journal of Machine Tools and Manufacture. 40(8): p. 1073-1098,2000
[5] Jantunen, E., A summary of methods applied to tool condition monitoring in drilling. International Journal of Machine Tools and Manufacture. 42(9): p. 997-1010,2002
[6] Dornfeld, D.A. Monitoring of Machining processes - Literature Review. in STC "C" Meeting. Paris: CIRP. p. 51 1992.
[7] Tseng, P.C. and A. Chou, The intelligent on-line monitoring of end milling. International Journal of Machine Tools and Manufacture. 42(1): p. 89- 97,2002
[8] Roth, J.T. and S.M. Pandit, Monitoring end-mill wear and predicting tool failure using accelerometers. Journal of Manufacturing Science & Engineering. 121(4): p. 559, 1999
[g] Inasaki, I., Application of acoustic emission sensor for monitoring machining processes. Ultrasonics. 36(1-5): p. 273-281, 1998
[l01 Mathews, P.G. and M.S. Shunmugam, Condition monitoring in reaming through acoustic emission signals. Journal of Materials Processing Technology. 86(1-3): p. 81-86, 1998
[ l l ] Larsson, H., Sensor integration in the machining process. Manufacturing systems engineering: Lulei. p. 89,2002
Transactions on Engineering Sciences vol 44, © 2003 WIT Press, www.witpress.com, ISSN 1743-3533

Laser Metrology and Machine Performance VI 567
1121 Jun, M.B., et al., Evaluation of a spindle-based force sensor for monitoring and fault diagnosis of machining operations. International Journal of Machine Tools and Manufacture. 42(6): p. 741-751,2002
[l31 Choudhury, S.K. and S. Rath, In-process tool wear estimation in milling using cutting force model. Journal of Materials Processing Technology. 99(1-3): p. 113-1 19,2000
[l41 Altintas, Y., In-Process Detection of Tool Breakages Using Time Series Monitoring of Cutting Forces. International Journal of Machine Tools and Manufacture. 28(2): p. 157-172, 1988
[l51 Meydan, T., Recent trends in linear and angular accelerometers. Sensors and Actuators A: Physical. 59(1-3): p. 43-50, 1997
[l61 Chen, J.C.C., Wei-Liang;, Tool breakage detection system using an accelerometer sensor. Journal of Intelligent Manufacturing. lO(2): p. p 187- 197, 1999
[l71 Boothroyd, G., Fundamentals ofMetal Machining and Machine Tools. New York: McGraw-Hill. 1975
[ l 81 Stephenson, D.A. and A. Ali. Tool temperature in interrupted metal cutting. in Winter Annual Meeting of the ASME, PED 43. p. 261-281 1990.
[l91 Kurada, S. and C. Bradley, A review of machine vision sensors for tool condition monitoring. Computers in Industry. 34(1): p. 55-72, 1997
Transactions on Engineering Sciences vol 44, © 2003 WIT Press, www.witpress.com, ISSN 1743-3533

Transactions on Engineering Sciences vol 44, © 2003 WIT Press, www.witpress.com, ISSN 1743-3533