opportunities in lean & green - wsppnwsppn.org/pdf/webinars/2008/10-16_webinar_3_final.pdf ·...
TRANSCRIPT

Welcome to the Webinar brought to you by:
Pacific Northwest Pollution Prevention Resource Center
Opportunities in Lean & Green• Attendees will not be able to speak to the presenter or to other attendees;
• Questions should be submitted using the “question and answer” box located in your panel anytime during the course of the presentation. At the conclusion of the presentation the presenters will answer questions.
• When submitting your question, please include the name of your organization. [i.e., Arizona DEQ – Will this presentation be available online?] Your name will automatically appear on the organizer’s screen, but not your organization.
• Having technical difficulties? Call technical support at 1‐800‐263‐6317 and press 2.
Special Thanks To: The Air and Waste Management Association (A&WMA) for their assistance in advertising this event to its membership.

WELCOME
October 16, 2008

Agenda & Acknowledgments 10:05 Lean and Green Primer
Rhea Wallace, Washington Manufacturing Services
& Michelle Gaither, PPRC
10:25 What’s Happening in Lean & Green‐Washington Projects
Hugh O’Neill, Washington Department of Ecology ‐ EPA Lean & Environment Toolkits and Resources
Laura Pyzik, U.S. Environmental Protection Agency‐ Green Supplier’s Network (GSN) Program
Dan Herring, IMC Consulting ‐ Society of Manufacturing Engineers Lean to Green Technical Group
Kathleen Mennillo, SME‐ Lean and Energy‐ Lean/Green Developments in Oregon and Idaho Michelle Gaither, PPRC
10:55 Case Study Results: Grisham Farms and National Cart Company, MissouriJimmy Story, Missouri Enterprise
11:15 Identifying “Lean Pain” (For EH&S/Pollution Prevention (P2) Community)Rhea Wallace, Washington Manufacturing Services
11:30 Q & A

(Some of) What Lean Does
• Improves quality
• Reduces cycle and lead times
• Involves and empowers employees
• Reduces capital intensity
IN SUMMARY:
Eliminates “Waste” and Improves Productivity

Lean PhilosophyBusiness philosophy – shorten time line between customer order and product shipment by eliminating waste.
CustomerOrder
Waste ProductShipment
Time
CustomerOrder
ProductShipment
Time (Shorter)
Business as Usual
Waste
Lean Manufacturing

Lean = Eliminating WasteValue‐Added
Typically 95% of all lead time is non-value-added.
Typically 95% of all lead time is non-value-added.
Overproduction
Waiting
Transportation
Non‐value‐added processing
Excess inventory
Defects
Excess motion
Underutilized people
Non‐Value‐Added
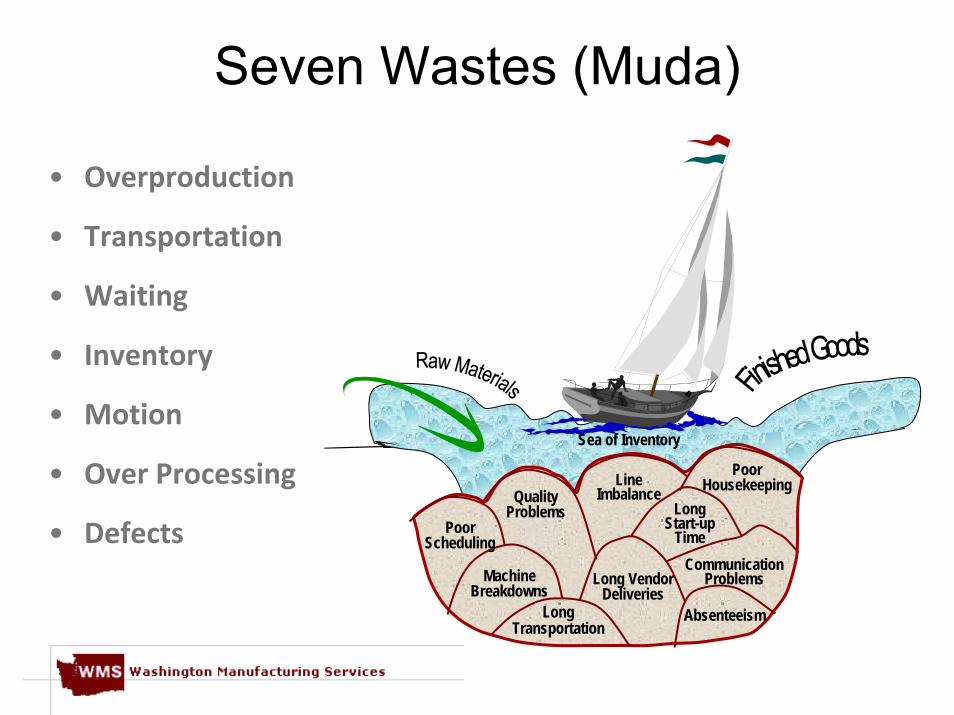
Seven Wastes (Muda)
• Overproduction
• Transportation
• Waiting
• Inventory
• Motion
• Over Processing
• Defects Poor Scheduling
Quality Problems
Line Imbalance
Long Vendor Deliveries
LongStart-up
Time
Poor Housekeeping
Communication ProblemsMachine
BreakdownsLong
TransportationAbsenteeism
Sea of Inventory

House of Lean Building Blocks
Quick Changeover
Standardized Work
Batch Reduction
Teams
Quality at Source
5S Visual Controls
Plant Layout
POUS
Cellular/FlowPull/Kanban
TPM
ValueStreamMapping
Continuous Improvement
5S = Sort, Set in Order, Shine, Standardize, Sustain

Why Are You Hearing About Lean? •Connected to competitive business drivers with substantial financial benefits
•At least 30-40% of U.S. manufacturing firms are engaged in lean; 5% are pursuing it aggressively
•Rapidly being adopted by sectors other than auto and aerospace
- shipbuilding, electronics, furniture, metal fabrication, etc.
- services (hospitals, banking, insurance)- tool for energy evaluation

Why Lean and Green Go TogetherLEAN GREEN
Lean can be leveraged to produce more environmental improvements and vice versa
Green fills key “blind spots” that can arise during Lean implementation
Oregon Manufacturing Extension Partnership

Two of the Important Lean Tools
• Value Stream Mapping– Current State– Future State
• Kaizen Events – Planning (pre- & during)– Kaizen Implementation– Sustaining

Value Stream Map (Drastically Simplified)
Analyze and document operations ‐ Collect Data
Days
Mins
Days
Mins
Days
Mins
Days Lead-time - WeeksValue Added (VA) time -
Minutes
PROCESS 1 PROCESS 3PROCESS 2

Looking at Material Use in a VSM
PROCESS 1 PROCESS 3PROCESS 2
10 lbs.
2 lbs.
8 lbs.
1 lb.
7 lbs.
3 lbs.
4 lbs. Initial Weight = 10 lbsFinal Weight = 4 lbs.
Days
Mins
Days
Mins
Days
Mins
Days Lead-time - WeeksVA time - Mins

Looking at Consumables in a VSMEnergy/Water
Natural Resources
Resource Waste
Pollutants
Energy/Water
Natural Resources
Resource Waste
Pollutants
Energy/Water
Natural Resources
Resource Waste
Pollutants
10 lbs.2 lbs.
8 lbs.1 lb.
7 lbs.3 lbs.
4 lbs. Initial Weight = 10 lbsFinal Weight = 4 lbs.
DaysMins
DaysMins
DaysMins
Days Lead-time - WeeksVA time - Mins
PROCESS 1 PROCESS 2 PROCESS 3

Identifying Priority Processes
Energy/Water
Natural Resources
Resource Waste
Pollutants
Energy/Water
Natural Resources
Resource Waste
Pollutants
Energy/Water
Natural Resources
Resource Waste
Pollutants
Days
Mins
Days
Mins
Days
Mins
Days Lead-time - WeeksVA time - Mins
PROCESS 1 PROCESS 2 PROCESS 3
KaizenKaizen
Kaizen

Woodfold Manufacturing (Oregon) Louver Paint Line – Current State

Louver Paint Line – Future State

Kaizen Event – Typical Steps
• Assemble cross-functional team• Revisit boundaries or area of focus• Review current state and future state• Assign roles to team members• Gather information / data• Generate solutions • Test/Refine solutions• Select solutions and Implement
Courtesy of Straus Forest LLC

Kaizen Event: Example Kaizen Event Meeting Room

Integrating Environment & Leanand
Green Moments – A la Lean
Michelle Gaither, PPRC

Ways to Integrate Environment & Lean
– Include environmental wastes in lean trainings – Include Environmental Health & Safety staff– Highlight environmental opportunities/items in
different colors than lean (during VSM, 5S, kaizen)
– Encourage companies to invite P2 or environmental perspective (s) from “outsider(s)”(not just within the company)
– Use comprehensive P2 or EH&S checklists– Use environmental cost accounting – Encourage P2/EH&S to Include
A L E t i G ?

Examples of “Slam Dunk” Green Discoveries During Lean Projects

What’s Happening in Lean and Green?
• Washington Manufacturing Services and Washington Department of Ecology Lean/Environment Projects (past & future) – Hugh O’Neill, Washington Department of Ecology
• EPA Lean & Environment Toolkits and Resources – Laura Pyzik, U.S. Environmental Protection Agency
• Green Supplier’s Network (GSN) Program – Dan Herring, IMC Consulting
• Society of Manufacturing Engineers (SME) Lean to Green Technical Group – Kathleen Mennillo, SME
• California Manufacturing Technology Center Lean/Energy (VeSM)
• Projects in Oregon with PPRC and Oregon MEP
• Developing work in Idaho, with Idaho DEQ, TechHelp, and PPRC

Washington Lean & Environment Project Objectives
• Develop a partnership between WA State Dept. of Ecology & Washington Manufacturing Services (WMS -Washington’s MEP)
• Evaluate the benefits of integrating environmental tools into lean practices
• Gain expertise to offer future lean and environment projects to manufacturers statewide.

Washington Project Scope• Pilot projects at three different companies
– Industry and geographic diversity– No major compliance problems
• Provide to clients:– Lean 101 Training (if necessary) – Value Stream Mapping– A minimum of three Kaizen events
• So that implementation and culture change takes firm root
• Grant (EPA & state) funds – Defrayed some of project costs for participating
manufacturers

Quality ControlBefore After
26

Stains … before

Stains … after

Washington Lean and Environment Pilot Projects
• Canyon Creek Cabinet Company (Monroe)• Lasco Bathware (Yelm)• Columbia Paint (Spokane)
Collective Annual Cost Savings in Productivity and Environmental Improvements:
~ $1.6 Million / ~ 1 million lbs pollution(~ $200K and ~ 200K lbs above estimates)
“I believe the collective experience has set the groundwork for future lean and environmental improvement efforts at our company.”
29

Environmental Protection Agency:Lean and Environment Initiatives
Laura Pyzik,
Environmental Scientist, EPA
• EPA Lean Initiative • www.epa.gov/lean• Lean and Environment Toolkit• Lean and Energy Toolkit• Lean in Government• Administrative Lean
Green Supplier’s Network (GSN)
Dan Herring, IMC Consulting
GSN Contractor
NIST MEP
What is the Green Suppliers Network?
• Lean & Clean Advantage on‐site reviews
• Focused on small & mid‐sized manufacturing suppliers
• Expands lean definition of waste to include environmental considerations
• Measurable business AND environmental impacts
NIST MEP

Why focus on suppliers?
• Concerns about supply chains: on‐time delivery, quality, cost
– “Supply chain inefficiencies can increase operating costs as much as 25%” BSR, 2000
• Large manufacturers facing increased liability and responsibility for full product life cycle
NIST MEP

Suppliers Need Help• Suppliers need help to meet your needs
• 2005 supplier survey conduct by The Manufacturer:– 63% of respondents report significant pressure from customers to reduce costs
– Only 2% report that customers are providing resources and technical assistance
NIST MEP

Program Roles
• U.S. Environmental Protection Agency
• Department of Commerce’s Manufacturing Extension Partnership (MEP)
• State Environmental Experts
• Large Manufacturers
• Suppliers
NIST MEP

How the Program Works• Corporate Champions join program
• Champions nominate suppliers
• Review team conducts assessment
• Supplier implements opportunities
• Champion and Green Suppliers Network get aggregated data
NIST MEP

Lean: Continuous Improvement
Understand the Current State
Analyze System
Conditions
Generate Options for
Improvement
Standardize Processes
ContinuousImprovement
Evaluate Performance
Implement
NIST MEP

Review Specifics• Reviews first come, first served
• Reviews focus on single process
• Reviews Cost supplier $6,500*
• On‐site reviews take 2‐3 days
• Supplier receives a confidential final report with review recommendations
• Conduct independent follow‐up survey to assess impacts one year after review
*A Supplier with 500 employees or less at the facility is eligible for an EPA cost‐buy down as funds remain available.
NIST MEP

Cost Savings IdentifiedResults for 60 completed reviews
Total Potential Savings $35,126,750/yr Lean Opportunities $23,682,524/yr
Clean Opportunities $10,945,033/yr
Other Opportunities $499,193/yr One-Time Lean Opportunities
$19,829,477
NIST MEP

Clean Opportunities Identified
*Results for 60 completed reviews
Energy Conservation 101,584,483 kWh
Water Conservation 35,320,965 gal
Water Pollution Reduction 19,477,288 lbs
Air Emissions Reduction 156,346 lbs
Solid Waste Reduction 3,471,901 lbs
NIST MEP

Society of Manufacturing Engineers (SME)
Lean to Green Sustainability Technical Group
Kathleen Mennillo New Product Development Leader Industry, Community, New Product Development

Lean Manufacturing & Energy• Evaluate energy during VSM
– Overall energy consumption/bills– Plant inspection
Air compressorsMeteringLightingHVAC Inventory of energy- and fuel-consuming devices
• VeSMTM (Value Energy Stream Mapping)California Manufacturing Technology Consulting (www.cmtc.com)
Trojan Battery Company (CA): (deep cycle batteries) used value and energy stream mapping (VeSM) with kaizen events to decrease energy intensity by 33%, saving $100k per year in energy.

Expanding L&G in the NW• Washington Department of Ecology and
Washington Manufacturing Services recently signed on as GSN service providers for Washington
• Oregon and PPRC recently conducted GSN project and plan to continue to work together in the future
• Forging an Idaho DEQ, TechHelp and PPRC partnership for work in Idaho

Missouri Enterprise
Briefing on Two Lean/Green Projects in Missouri
Jimmy Story
Business Program Manager

Grisham Farms
• Founded in 1992• currently has 34 employees that are processing over 57,000 tons of feed per year.
• Prime focus of Lean and environmental
45

Grisham Farms
• Feedstock investigation
• Business profile
• Biomass energy research
46

Grisham Farms • Create 8 new jobs
• Diverting 4,800 tons/mo
• New boiler system using wood waste as fuel
47

National Cart Company
• Established 1972
• Manufacturing and distribution space exceeds 300,000
• Focus on Lean and Environmental
48

National Cart Company
• Lean principles• Tools of lean
– VSM– 5S‐ Sort, Set in order, Shine, Standardize & Sustain
• Environmental – Large generator discharge
49

National Cart Company
• Environmental –– Caster Dispose of over 6,000 per month
– Paint waste ‐ chemical
50

What Lean and Green can do!
• Just looking at three companies in the St. Louis:
– Identified Energy savings of up to $70,000.00
– Identified Environmental waste that will be kept out of the landfill
• 30 Tons of Casters, 20K spray cans, 2000 yards of scrap pallets and 150 tons of saw dust
51

How to Identify “Lean Pain”
Presented by Rhea Wallace,Washington Manufacturing Services
(WMS)
Compiled with input from WMS, Department of Ecology, Oregon Manufacturing Extension Partnership and PPRC

How to Identify “Lean Pain”(For the Non-Lean Expert)
Initial Questions to Ask:
? Do you see a NEED to improve productivity?
? What’s getting in the way of you operating really well? - listen for accountability issues

Lean Flag Checklist(Compiled with Input from WMS, Ecology, PPRC)(Michelle Gaither can e-mail attendees a copy of this checklist)
Philosophy
□ Disposables: people, materials, product□ Short term results□ Specialists vs. staff trained in many areas□ Autocratic or hierarchical management (employees don’t seem empowered)
Housekeeping
□ Essential and non-essential items mixed□ Employees stopping work to find a tool, part, or other item they need
Quality
□ Product just meets specifications □ High defect rate and defect piles or bins

Lean Flag Checklist (Continued) Process Bottlenecks (Line Imbalance)
□ Process steps are not synchronized with each other□ Rate-limiting process step □ One process too fast, one too slow□ Ask: “What operations cause things to slow down? Where are the hang-ups?□ Scheduling problems
Process Flow
□ LONG LEAD TIMES (ask what their lead time is for given product) (if only asking a few questions, this might be one of the most important)
□ Large lot sizes□ Long start-ups/changeovers□ Machine breakdowns□ Long vendor deliveries□ Long transportation times

Lean Flag Checklist (Continued) Work-in-Progress/Inventory□ Accumulation of product elements between process steps□ Raw materials stored for a long time before use□ Excess accumulation of final product before shipment
Visual Controls□ Hard to see and understand what’s going on in plant□ Bins not marked, instructions not posted, tool storage not labeled
Operator Competence/Empowerment□ Operators seemingly not able to run the floor□ Operators not engaged /able to suggest improvements□ Narrow skill sets □ Work not standardized, people don’t know what to do, how to do it correctly
Technology □ Large machines □ Capacity driven

We Welcome Your Questions

Contacts from Webinar:• Green Supplier’s Network, Dan Herring, IMC Consultants, [email protected]
Additional Contacts: Heidi Karp, US EPA, [email protected] Folk, NIST MEP, [email protected]
• Missouri Enterprise, Jimmy Story, [email protected]
• PPRC, Michelle Gaither [email protected]/solutions/leangreen.cfm
• SME, Kathleen Mennillo, [email protected]/leantogreen
• US EPA Lean & Environment ‐ Laura Pyzik, [email protected]/lean
• Washington Department of Ecology, Hugh O’Neill, [email protected]/programs/hwtr/lean/index.html
• Washington Manufacturing Services, Rhea Wallace, [email protected]