opportunities for vietnamese fruits and vegetables …
TRANSCRIPT
OPPORTUNITIES FOR VIETNAMESE
FRUITS AND VEGETABLES EXPORTS TO EUROPE
ACTIVITY CODE: EU-34
Version: Final
November 2017
Prepared by: Mr. Warner Uiterwijk – international expert, Globally Cool, Leeuwarden, the Netherlands
Ms. Vu Thuc Linh – local expert
This report has been produced with the assistance of the European Union. The contents of this report are the sole responsibility of the author(s) and can in no way be taken to reflect the views of the European Union
Content
1 INTRODUCTION 5
1.1 OBJECTIVE AND METHODOLOGY 5 1.2 TARGET PRODUCTS OF RESEARCH 5
2 THE VIETNAMESE FRUITS AND VEGETABLES INDUSTRY 7
2.1 PRODUCTION 7 2.1.1 PRODUCTION OF VEGETABLES 7 2.1.2 PRODUCTION OF FRUIT 8 2.1.2.1 Dragon fruit 9 2.1.2.2 Mangoes 9 2.1.2.3 Litchi 10 2.1.2.4 Oranges and Mandarins 10 2.1.2.5 Rambutan 11 2.1.2.6 Pomelo 11 2.1.2.7 Mangosteen 12 2.1.2.8 Other fruit 12 2.1.2.9 MARD fruit production strategy 12 2.1.3 PRODUCTION OF PROCESSED FRUITS & VEGETABLES 12 2.2 CONSUMPTION 13 2.3 IMPORTS 14 2.4 EXPORTS 15 2.4.1 EXPORTS OF FRESH FRUIT & VEGETABLES 17 2.4.2 EXPORTS OF PROCESSED FRUIT & VEGETABLES 18 2.4.3 EXPORTS BY PRODUCTS 18 2.5 VIETNAMESE FRUIT & VEGETABLES EXPORTS TO THE EU 19 2.5.1 PRODUCTS WITH HIGH POTENTIAL IN EUROPE 21 2.5.1.1 Fresh dragon fruit 22 2.5.1.2 Canned pineapples 22 2.5.1.3 Ready-to-eat mangoes 22 2.5.1.4 Processed vegetables and fruit juices 23 2.5.2 VIETNAMESE CAPACITY TO MEET RELEVANT STANDARDS 23 2.5.3 ANALYSIS OF STRONG & WEAK POINTS OF VIETNAMESE FRUIT AND VEGETABLES EXPORTS 24 2.5.3.1 Strong points 24 2.5.3.2 Weak points 25 2.6 THE VIETNAMESE FRUIT AND VEGETABLES SECTOR – THE WAY FORWARD 26
3 THE EU FRUITS AND VEGETABLES MARKET 28
3.1 MARKET FEATURES AND TRENDS 28 3.1.1 MARKET FEATURES 28 3.1.1.1 Fresh fruit and vegetables 28 3.1.1.2 Processed fruit and vegetables 28 3.1.1.3 Requirements for food are very strict 28 3.1.2 TRENDS 28 3.1.2.1 Growing concern about health and well-being 28 3.1.2.2 Consumers want convenience 29 3.1.2.3 Diversification of products and flavours 29 3.1.2.4 Preference for sustainable supply chains 30 3.2 CONSUMPTION 30 3.2.1 FFV 30
3.2.2 PFV 30 3.2.2.1 Fruit juices and nectars 32 3.2.2.2 Canned fruit and vegetables 32 3.2.2.3 Nuts and dried fruits 32 3.2.2.4 Jams, jellies, purées and marmalades 32 3.3 PRICE 32 3.4 PRODUCTION 33 3.4.1 FFV 33 3.4.2 PFV 33 3.5 TRADE 33 3.5.1 TOTAL IMPORTS OF FRUITS AND VEGETABLES 33 3.5.1.1 Imports of FFV from outside Europe 34 3.5.1.2 Imports of PFV from outside Europe 34 3.5.2 LEADING IMPORTING COUNTRIES 35 3.5.3 LEADING SUPPLIERS 36 3.6 DISTRIBUTION CHANNELS 39 3.6.1 FFV (GREEN ARROWS) 39 3.6.2 PROCESSED FRUIT AND VEGETABLES (BLUE ARROWS) 40 3.7 EU MARKET COMPETITIVENESS ANALYSIS FOR FRUITS AND VEGETABLES 40 3.7.1 COMPETITIVE RIVALRY 40 3.7.2 VIETNAM’S COMPETITIVE POSSIBILITY 42
4 EU MARKET ACCESS REQUIREMENTS 43
4.1 IMPORT DUTIES 43 4.2 COMPULSORY REQUIREMENTS 43 4.2.1 SPS 43 4.2.2 MRLS FOR PESTICIDES 43 4.2.3 CONTROL ON THE IMPORTED FOOD AND FOODSTUFF IN THE EU MARKET 44 4.2.4 PLANT PROTECTION 44 4.2.5 PREVENTION OF CONTAMINATION WITH DISEASES 45 4.2.6 PRODUCT INGREDIENTS 46 4.2.7 LABELLING 47 4.2.7.1 Statement about nutrition and healthful substances 47 4.2.7.2 Allergens 47 4.2.8 PACKAGING 48 4.3 REQUIREMENT FOR CERTIFICATION AND QUALITY 48 4.3.1 CERTIFICATION 48 4.3.2 QUALITY STANDARDS 48 4.4 REQUIREMENTS OF SOME NICHE MARKETS 49 4.4.1 SOCIAL RESPONSIBILITY 49 4.4.2 ORGANIC CERTIFICATION 49 4.4.3 FAIRTRADE CERTIFICATION 50
5 CONCLUSIONS - OPPORTUNITIES FOR VIETNAMESE EXPORTERS IN THE EU 51
5.1 IDENTIFYING THE GAP WITH THE DEMANDS OF THE EU MARKET 51 5.1.1 CERTIFICATION 51 5.1.2 AWARENESS 51 5.1.3 SUSTAINABLE SUPPLY CHAIN 51 5.1.4 SUSTAINABLE TRANSPORT 51 5.1.5 EXPORT PACKAGING AND DESIGN 52 5.1.6 TIPS AND NOTES 52 5.2 ANALYZING OPPORTUNITIES FOR VIETNAMESE COMPANIES TO EXPORT FRUITS AND VEGETABLES

TO THE EU 53 5.2.1 VIETNAM’S COMPETITIVE POSSIBILITY 56
6 APPENDICES 57
6.1 BUSINESS SUPPORT ORGANIZATIONS AND LEADING EXPORTERS 57 6.1.1 VIETNAM FRUIT & VEGETABLES ASSOCIATION (VINAFRUIT) 57 6.1.2 VIETNAM FRUIT & VEGETABLE RESEARCH INSTITUTE (FAVRI) 57 6.1.3 SOUTHERN HORTICULTURAL RESEARCH INSTITUTE (SOFRI) 57 6.1.4 VIETNAM NATIONAL VEGETABLE, FRUIT AND AGRICULTURAL PRODUCT CORPORATION LIMITED
(VEGETEXCO VIETNAM) 57 6.1.5 VEGETABLE AND FRUIT EXPORT IMPORT JOINT COMPANY NO.1 (VEGETEXCO I – HANOI) 58 6.2 List of eu vegetable importer 53 6.3 Useful information sources 57 6.3.1 EU trade associations 57 6.3.2 EU network and database 57 6.4 List of specialized exhibitions and trade fairs 58

1 Introduction
1.1 Objective and Methodology
This report has been conducted by Vietrade (MOIT) and the European Trade Policy & Investment Project (EU-MUTRAP) with the view to provide necessary information to Vietnamese export companies who desire enhance their fruits and vegetables exports to the EU market.
The report contains a comprehensive analysis of:
- Production, import, consumption and exports of Vietnam to the world and to the EU (Chapter 2).
- EU market character & trends, consumption, price, distribution channels, competition & fruit & vegetable exports/ imports (Chapter 3).
- Competition in the EU market (Chapter 3); - EU Market requirements (Chapter 4). - The gap between Vietnamese supply and demands and requirements of the EU market
(Chapter 5); and - Opportunities for Vietnamese companies (Chapter 5).
In addition, the report provides useful information sources, list of EU fruit & vegetable importers and regular events of trade promotion in this sector organized in the EU for Vietnamese enterprises’ reference.
The report’s methodology is mainly to collect and treat the reliable sources of economic organizations, the international and Vietnamese trade promotion organizations like: International Trade Center (ITC), the Centre for the Promotion of Imports from developing countries (CBI), Vietnamese Trade Offices in EU member states, Trade Promotion Agency, Vietnam Customs, Vietnam Fruit & Vegetables Association (Vinafruit), Ministry of Agriculture and Rural Development etc.
Particularly, the results in the report are issued on the basis of using the market research software tools ot the ITC portal “Trade Map”, in combination with information and feedback collected from experts and enteprises through seminars and meetings on trade promotion.
1.2 Target products of research
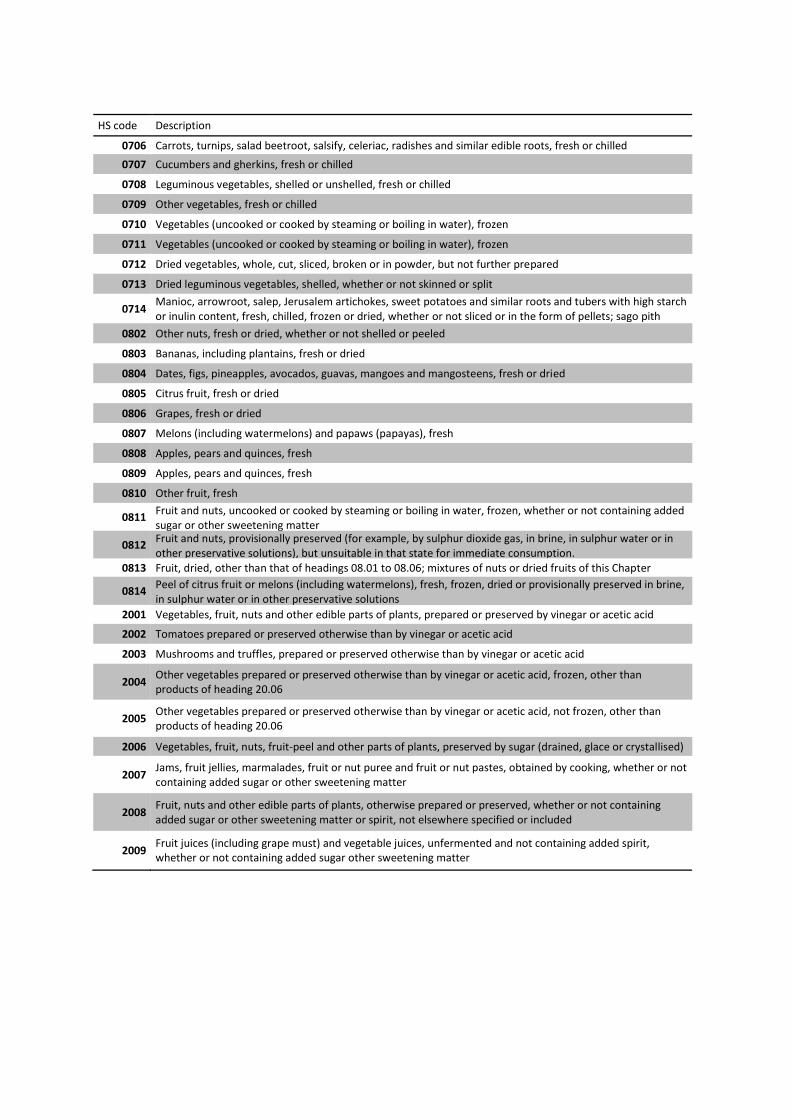
Categories of fruit & vegetables (both fresh and processed) include the products under Chapter 7, 8 & 20 of the HS Classification. The report won’t cover cashewnuts in the research scope. The catergories of target products are classsified by HS as follows:
Table 1.1: Fruit & Vegetable Products HS codes included in this survey
HS code Description
0701 Potatoes, fresh or chilled
0702 Tomatoes, fresh or chilled
0703 Onions, shallots, garlic, leeks and other alliaceous vegetables, fresh or chilled
0704 Cabbages, cauliflowers, kohlrabi, kale and similar edible brassicas, fresh or chilled
0705 Lettuce (Lactuca sativa) and chicory (Cichorium spp.), fresh or chilled
HS code Description
0706 Carrots, turnips, salad beetroot, salsify, celeriac, radishes and similar edible roots, fresh or chilled
0707 Cucumbers and gherkins, fresh or chilled
0708 Leguminous vegetables, shelled or unshelled, fresh or chilled
0709 Other vegetables, fresh or chilled
0710 Vegetables (uncooked or cooked by steaming or boiling in water), frozen
0711 Vegetables (uncooked or cooked by steaming or boiling in water), frozen
0712 Dried vegetables, whole, cut, sliced, broken or in powder, but not further prepared
0713 Dried leguminous vegetables, shelled, whether or not skinned or split
0714 Manioc, arrowroot, salep, Jerusalem artichokes, sweet potatoes and similar roots and tubers with high starch or inulin content, fresh, chilled, frozen or dried, whether or not sliced or in the form of pellets; sago pith
0802 Other nuts, fresh or dried, whether or not shelled or peeled
0803 Bananas, including plantains, fresh or dried
0804 Dates, figs, pineapples, avocados, guavas, mangoes and mangosteens, fresh or dried
0805 Citrus fruit, fresh or dried
0806 Grapes, fresh or dried
0807 Melons (including watermelons) and papaws (papayas), fresh
0808 Apples, pears and quinces, fresh
0809 Apples, pears and quinces, fresh
0810 Other fruit, fresh
0811 Fruit and nuts, uncooked or cooked by steaming or boiling in water, frozen, whether or not containing added sugar or other sweetening matter
0812 Fruit and nuts, provisionally preserved (for example, by sulphur dioxide gas, in brine, in sulphur water or in other preservative solutions), but unsuitable in that state for immediate consumption.
0813 Fruit, dried, other than that of headings 08.01 to 08.06; mixtures of nuts or dried fruits of this Chapter
0814 Peel of citrus fruit or melons (including watermelons), fresh, frozen, dried or provisionally preserved in brine, in sulphur water or in other preservative solutions
2001 Vegetables, fruit, nuts and other edible parts of plants, prepared or preserved by vinegar or acetic acid
2002 Tomatoes prepared or preserved otherwise than by vinegar or acetic acid
2003 Mushrooms and truffles, prepared or preserved otherwise than by vinegar or acetic acid
2004 Other vegetables prepared or preserved otherwise than by vinegar or acetic acid, frozen, other than products of heading 20.06
2005 Other vegetables prepared or preserved otherwise than by vinegar or acetic acid, not frozen, other than products of heading 20.06
2006 Vegetables, fruit, nuts, fruit-peel and other parts of plants, preserved by sugar (drained, glace or crystallised)
2007 Jams, fruit jellies, marmalades, fruit or nut puree and fruit or nut pastes, obtained by cooking, whether or not containing added sugar or other sweetening matter
2008 Fruit, nuts and other edible parts of plants, otherwise prepared or preserved, whether or not containing added sugar or other sweetening matter or spirit, not elsewhere specified or included
2009 Fruit juices (including grape must) and vegetable juices, unfermented and not containing added spirit, whether or not containing added sugar other sweetening matter
2 The Vietnamese fruits and vegetables industry
2.1 Production
Vietnam has the geographical location that stretches across many latitudes with monsoon climate and some climatic sub-regions like Sa Pa, Tam Dao & Da Lat that have very favourable conditions for vegetables production. The country can grow more than 120 kinds of vegetables that have tropical, subtropical and temperate origin. With the support of scientific and technological advance, off-season vegetables can be produced to meet the domestic demand and processing supply for exports. Vegetables production has been ever increasing in terms of area and productivity.
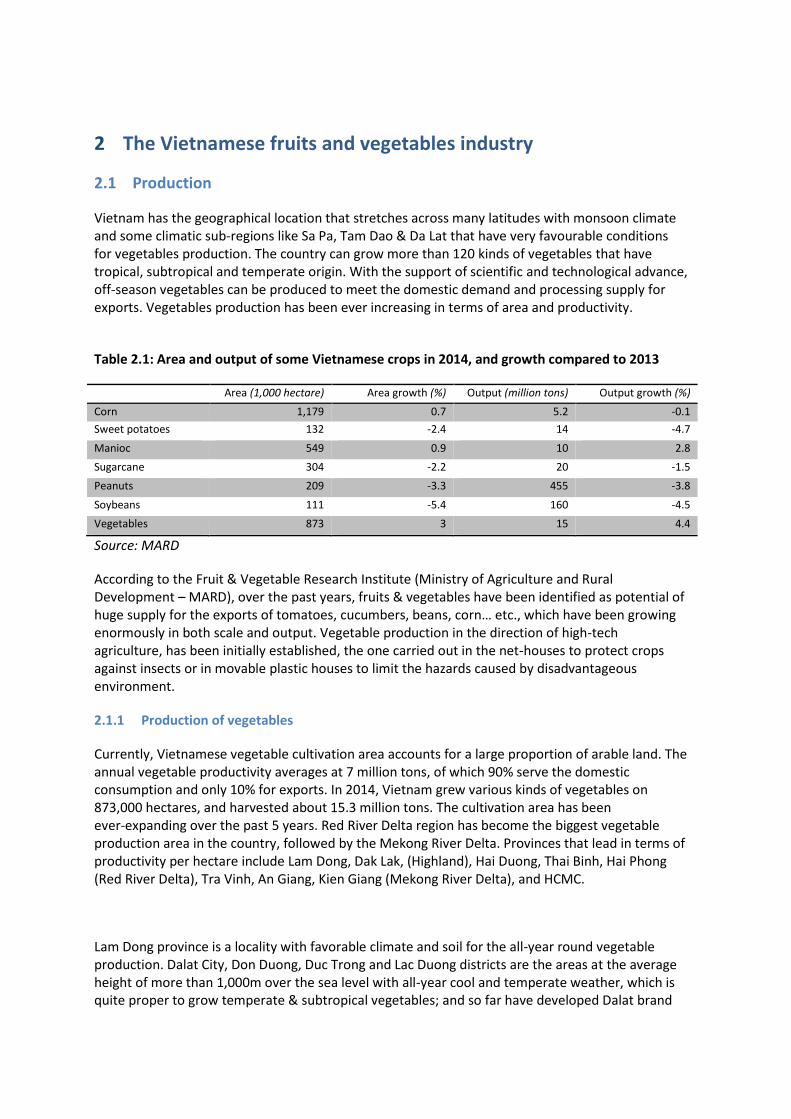
Table 2.1: Area and output of some Vietnamese crops in 2014, and growth compared to 2013
Area (1,000 hectare) Area growth (%) Output (million tons) Output growth (%)
Corn 1,179 0.7 5.2 -0.1
Sweet potatoes 132 -2.4 14 -4.7
Manioc 549 0.9 10 2.8
Sugarcane 304 -2.2 20 -1.5
Peanuts 209 -3.3 455 -3.8
Soybeans 111 -5.4 160 -4.5
Vegetables 873 3 15 4.4
Source: MARD
According to the Fruit & Vegetable Research Institute (Ministry of Agriculture and Rural Development – MARD), over the past years, fruits & vegetables have been identified as potential of huge supply for the exports of tomatoes, cucumbers, beans, corn… etc., which have been growing enormously in both scale and output. Vegetable production in the direction of high-tech agriculture, has been initially established, the one carried out in the net-houses to protect crops against insects or in movable plastic houses to limit the hazards caused by disadvantageous environment.
2.1.1 Production of vegetables
Currently, Vietnamese vegetable cultivation area accounts for a large proportion of arable land. The annual vegetable productivity averages at 7 million tons, of which 90% serve the domestic consumption and only 10% for exports. In 2014, Vietnam grew various kinds of vegetables on 873,000 hectares, and harvested about 15.3 million tons. The cultivation area has been ever-expanding over the past 5 years. Red River Delta region has become the biggest vegetable production area in the country, followed by the Mekong River Delta. Provinces that lead in terms of productivity per hectare include Lam Dong, Dak Lak, (Highland), Hai Duong, Thai Binh, Hai Phong (Red River Delta), Tra Vinh, An Giang, Kien Giang (Mekong River Delta), and HCMC.
Lam Dong province is a locality with favorable climate and soil for the all-year round vegetable production. Dalat City, Don Duong, Duc Trong and Lac Duong districts are the areas at the average height of more than 1,000m over the sea level with all-year cool and temperate weather, which is quite proper to grow temperate & subtropical vegetables; and so far have developed Dalat brand
for vegetables. GlobalGAP has certified some production establishments in Lam Dong province. Lam Dong vegetables have been exported to East & Southeast Asian markets, e.g. Taiwan, Japan, Korea, Singapore and supplied to the local market in East & Central Southern provinces and particularly HCM City and the off-season market in Hanoi. By 2016, the whole province has nearly 54,000 hectare of vegetable crop, harvesting 2.3 million tons of output.
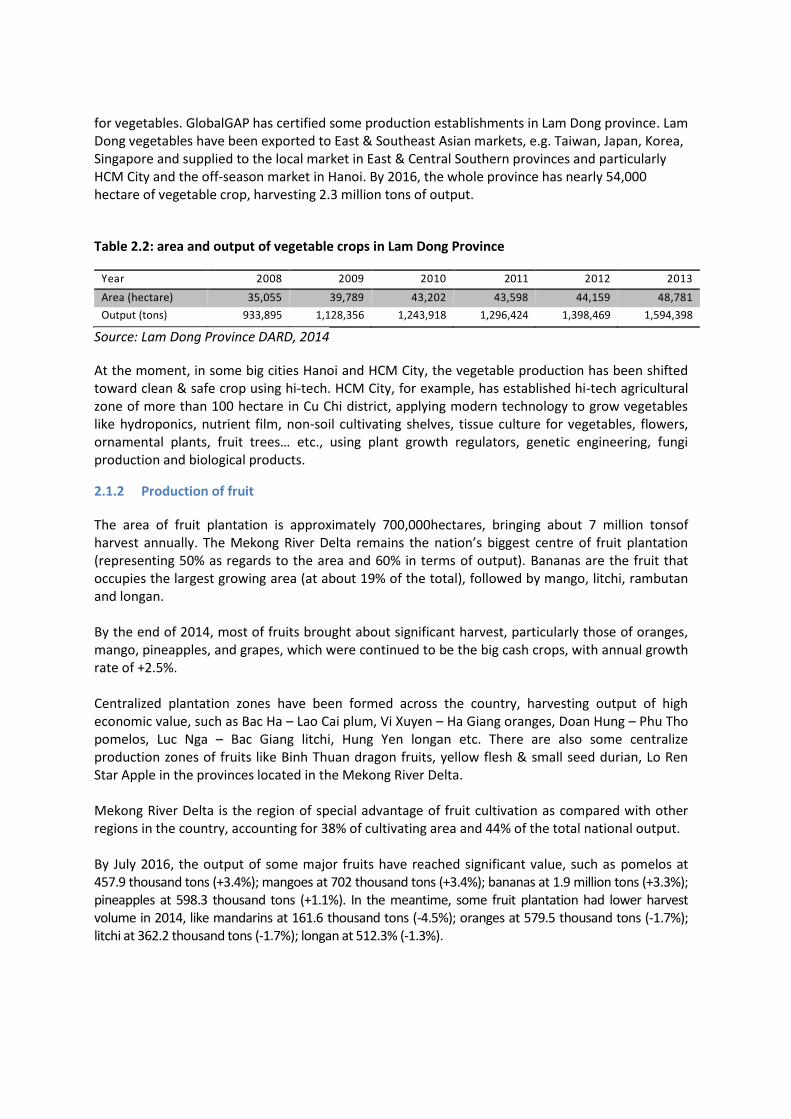
Table 2.2: area and output of vegetable crops in Lam Dong Province
Year 2008 2009 2010 2011 2012 2013
Area (hectare) 35,055 39,789 43,202 43,598 44,159 48,781
Output (tons) 933,895 1,128,356 1,243,918 1,296,424 1,398,469 1,594,398
Source: Lam Dong Province DARD, 2014
At the moment, in some big cities Hanoi and HCM City, the vegetable production has been shifted toward clean & safe crop using hi-tech. HCM City, for example, has established hi-tech agricultural zone of more than 100 hectare in Cu Chi district, applying modern technology to grow vegetables like hydroponics, nutrient film, non-soil cultivating shelves, tissue culture for vegetables, flowers, ornamental plants, fruit trees… etc., using plant growth regulators, genetic engineering, fungi production and biological products.
2.1.2 Production of fruit
The area of fruit plantation is approximately 700,000hectares, bringing about 7 million tonsof harvest annually. The Mekong River Delta remains the nation’s biggest centre of fruit plantation (representing 50% as regards to the area and 60% in terms of output). Bananas are the fruit that occupies the largest growing area (at about 19% of the total), followed by mango, litchi, rambutan and longan. By the end of 2014, most of fruits brought about significant harvest, particularly those of oranges, mango, pineapples, and grapes, which were continued to be the big cash crops, with annual growth rate of +2.5%. Centralized plantation zones have been formed across the country, harvesting output of high economic value, such as Bac Ha – Lao Cai plum, Vi Xuyen – Ha Giang oranges, Doan Hung – Phu Tho pomelos, Luc Nga – Bac Giang litchi, Hung Yen longan etc. There are also some centralize production zones of fruits like Binh Thuan dragon fruits, yellow flesh & small seed durian, Lo Ren Star Apple in the provinces located in the Mekong River Delta. Mekong River Delta is the region of special advantage of fruit cultivation as compared with other regions in the country, accounting for 38% of cultivating area and 44% of the total national output. By July 2016, the output of some major fruits have reached significant value, such as pomelos at 457.9 thousand tons (+3.4%); mangoes at 702 thousand tons (+3.4%); bananas at 1.9 million tons (+3.3%); pineapples at 598.3 thousand tons (+1.1%). In the meantime, some fruit plantation had lower harvest volume in 2014, like mandarins at 161.6 thousand tons (-4.5%); oranges at 579.5 thousand tons (-1.7%); litchi at 362.2 thousand tons (-1.7%); longan at 512.3% (-1.3%).

2.1.2.1 Dragon fruit
Vietnam has more than 35.7 thousand hectare of dragon fruit plantation with total harvest of more than 614 thousand tons. Table 2.3: Dragon fruits production area &output in 2014
Locality Area (hectare) Share of total (%) Output (tons) Share of total (%)
Vietnam 35,665 100 614,346 100
Binh Thuan 23,200 65 430,120 70
Long An 5,916 17 78,400 13
Tien Giang 4,052 11 75,109 12
Source: Vietnam Fruit & Vegetables Association (VINAFRUIT), 2014
Dragon fruits are grown in more than 32 provinces/ cities, but the tremendous development into centrally cultivation zones has only taken place in Binh Thuan, Tien Giang & Long An provinces. The rest is scattered in some Southern provinces such as Vinh Long, Tra Vinh, Tay Ninh, Ba Ria – Vung Tau provinces and some Northern provinces.
2.1.2.2 Mangoes
Vietnamese mango plantation area in 2014 reached about 84 thousand hectare, bringing about 969 thousand tons per year (source: MARD). Vietnam is the 13thlargest mango exporter in the world, but its export volume remains rather insignificant. Table 2.4: Mango production area(1,000 hectares) and output (1,000 tons), by region/ locality
Region/province 2011 2012 2013 2014
Area Output Area Output Area Output Area Output
Country 86.4 85.6 85.0 84.1 969
Red River Delta 1.9 13.7 1.9 14.5 2.0 16.6 1.6 16.4
Northern mountainous midland 8.7 28.4 8.5 31.2 8.4 31.2 8.1 28.2
Central North and Coastal Centre 14.1 82.2 13.6 79.0 13.9 82.5 14.0 81.1
Highland 2.2 14.7 2.3 15.5 2.6 18.1 2.4 15.7
Eastern South 18.4 127.5 18.3 130.8 18.3 133.9 18.2 136.7
Mekong River Delta 41.1 420.1 41.0 394.3 39.8 398.6 39.8 410.8
Long An Province 1.2 3.6 1.3 7.7 1.1 7.3 1.1 7.0
Tien Giang Province 5.5 93.5 4.6 107.0 5.0 106.6 4.8 105.2
Ben Tre Province 1.1 8.6 0.8 6.2 0.7 5.5 0.7 5.5
Tra Vinh Province 2.4 16.1 2.2 14.4 2.0 13.4 2.0 12.8
Vinh Long Province 4.7 51.1 4.8 52.6 4.9 54.2 4.9 55.1
Dong Thap Province 9.1 75.2 9.0 84.0 9.0 87.4 9.1 97.9
An Giang Province 4.6 50.2 4.6 61.7 4.7 64.3 5.0 62.9
Kien Giang Province 3.7 79.5 4.2 14.5 3.5 15.1 3.6 18.4
Can Tho Province 2.5 9.2 2.5 9.8 2.5 9.6 2.5 9.8
Hau Giang Province 4.0 17.4 3.9 17.9 3.4 16.3 3.1 15.6
Soc Trang Province 1.8 12.6 1.9 13.1 1.8 13.5 1.8 15.1
Source: Data collected by General Statistics Office (GSO), 2016
In Tien Giang province itself, there are about 5 thousand hectares planting various kinds of
mangoes like Hoa Loc mango, Chu mango, hybrid mango etc. However, mangoes grown in Tien Giang province are mainly supplied fresh to the domestic market as well as exports. The collection system relies much on traders through many intermediaries. The domestic consumption volume is about 48% while the rest aims at exports. The other 52% is for exports and is mostly Chu mango, only 1.3% of exports is from Hoa Loc Mango Cooperative. In Dong Thap province, 9.3 thousand hectares are designated for mango plantation, bringing almost 97 thousand tonsof harvest.
2.1.2.3 Litchi
The biggest litchi plantation region of the country is Bac Giang province with 35 thousand hectare area, achieving 120 thousand tons output. It is followed by Hai Duong province with 14 thousand hectare area, harvesting more than 36 thousand tons of output. In 2015, with the total area of 32 thousand hectare, Bac Giang fresh litchi output reached 195 thousand tons. Among which, the early harvest is grown in 6 thousand hectare are to earn 26.7 thousand ton output (accounting for 13.6% of the total), while right-season products are planted in 25.3 thousand hectare area, bringing about 168.3 thousand ton harvest (representing 86.4 % of the total). About one third of the total area covers certified production:
The cultivation area certified by VietGAP has expanded to over 12.3 thousand hectare (+2.8 thousand hectare against 2014), with the output of 80 thousand tons.
About 100 hectare of litchi plantation has been granted with GlobalGap certificate, producing 600 tons for the exports to new high-end markets.
The US Dept. of Agriculture has issued 6 plantation area codes (ranging from 6618-6623) to 109 households with the area of 60.4 hectares in Hong Giang commune, Luc Ngan district, Bac Giang province.
2.1.2.4 Oranges and Mandarins
Oranges are planted centrally in the Mekong River Delta in the area of 39.2 thousand hectare, producing 496 thousand ton output. In the Northern mountainous midland, oranges have been mainly grown centrally in Ha Giang province, but the output remains limited at 11 thousand tons per year.

Table 2.5: Area (1,000 hectares) and output (1,000 tons) of orange and mandarin plantation classified by locality
Source: GSO, 2016
2.1.2.5 Rambutan
Rambutan is mainly grown in the Eastern South with the area of 14.2 thousand hectare, bringing about nearly100 thousand tons.
2.1.2.6 Pomelo
The area of pomelo plantation in the Mekong River Delta has been expanding sharply, to 25.3 thousand hectare, producing about 300 thousand tons annually. Particularly, the green skin grapefruit breed, characterized with its mild sweet taste, dry citrus, lots of nutrients, stable market price… etc. has been planted in ever expanding area by farmers in several provinces (including Tien Giang province with 3.8 thousand hectare, Hau Giang province with 3 thousand hectare, Vinh Long with hundreds of hectares). The ready-to-harvest area has reached 4.2 thousand hectare, while the newly cultivated one is about 120 hectare and there are more than 46 hectare certified by GAP; with the average productivity of 11.4 tons per hectare, making the total output of 47.7 thousand tons. Nevertheless, Nam Roi pomelo is the one of big value output with the 9.2 thousand hectare area, mainly located in Vinh Long province which is followed by Hau Giang province.
Locality 2011 2012 2013 2014
Area Output Area Output Area Output Area Output
Total Vietnam 68.8 702.1 67.5 704.1 70.3 706.0 75.6 736.1
Red River Delta 6.0 63.8 5.9 62.9 5.6 61.0 5.4 59.8
Hung Yen province 1.9 31.5 2.0 31.4 2.0 31.8 1.9 32.7
Northern mountainous midland 11.7 52.4 12.4 68.4 14.1 72.3 15.7 75.3
Ha Giang province 1.7 9.1 1.6 9.5 2.7 9.7 3.6 11.0
Tuyen Quang province 2.8 15.1 3.0 22.1 3.2 22.2 4.2 27.6
Lang Son province 1.6 2.7 1.2 2.8 1.1 2.7 1.3 2.8
Central North and Coastal Centre 8.5 50.8 7.7 52.2 7.4 47.0 8.1 48.9
Nghe An province 2.9 24.0 3.0 27.4 2.9 23.7 3.4 25.6
Ha Tinh province 2.6 15.0 2.4 14.4 2.6 14.7 2.7 14.3
Highland 0.6 2.6 0.6 3.4 0.8 4.0 1.0 4.5
Eastern South 6.3 69.1 5.7 58.7 5.5 53.1 6.2 51.6
Dong Nai province 4.1 57.5 3.4 45.9 3.0 39.5 2.9 36.6
Mekong River Delta 35.8 463.5 35.2 458.5 36.9 468.6 39.2 496.0
Tien Giang province 7.1 152.5 6.0 135.7 5.5 118.9 5.0 118.9
Ben Tre province 3.1 22.9 2.7 20.3 2.0 14.9 2.0 15.5
Tra Vinh province 2.9 43.7 3.0 46.7 3.0 50.9 3.1 51.3
Vinh Long province 7.6 73.9 7.9 77.0 8.1 81.1 8.3 83.8
Dong Thap province 3.2 61.6 3.2 64.5 3.2 63.9 3.4 66.5
Can Tho province 1.5 13.3 1.3 10.4 1.1 10.5 1.0 9.8
Hau Giang province 6.5 59.4 7.1 68.8 9.4 84.4 11.3 103.2
Soc Trang province 3.5 26.7 3.0 25.3 3.7 31.5 4.3 34.3

2.1.2.7 Mangosteen
This tropical fruit has been grown mainly in the Mekong River Delta with total area of about 4.9 thousand hectare, producing 4.5 thousand tons, in which Ben Tre province has the largest area of 4.2 thousand hectare, accounting for 77% of the national total. Mangosteen has a very high commercial value.
2.1.2.8 Other fruit
There is some more fruit plantation that has great potential for fresh exports: yellow flesh & small seed durian, Lo Ren star apple, and yellow flesh longan. However, the area for cultivation and output remains insignificant, even not sufficient to supply the domestic market, making the local price higher than the export one.
2.1.2.9 MARD fruit production strategy
In the planning for the development of fruit plantation, MARD focuses on 12 kinds of major fruits, namely dragon fruit, mango, rambutan, durian, star apple, pomelo, longan, banana, pineapple, orange, custard-apple & mandarin. The total area of these major products centralized plantation is forecasted at 257 thousand hectare by 2020, occupying 52% of the total planned area for fruit plantation in the South, in which there are 185 thousand hectares located in the Mekong River Delta, 72 thousand hectare in the Eastern South. Mango is the crop plantation of biggest centralized area of 46 thousand hectare, next is longan at 30 thousand hectare, bananas at 29 thousand hectare, pomelos at 28 thousand hectare, oranges at 26 thousand hectare, dragon fruits at 25 thousand hectare, pineapples at 21 thousand hectare, Rambutan at 18 thousand hectare, durian at 15 thousand hectare, custard-apple at 8,300 hectare and star apples at 5,000 hectare.
2.1.3 Production of processed fruits & vegetables
Across Vietnam there are more than 100 processing establishments at industrial scale with total capacity of 300 thousand tons per year. Furthermore, thousands of small-scale establishments are specialized in litchi and longan dying, or cucumber pickling etc. However, most of these establishments are suffering from the shortage of inputs, which results in an actual average capacity usage of only 30%. Intensively processed fruits and vegetables only represent about 10%, majority of which comprise of canned, frozen, condensed, juiced, fried and dried, and pickled products. Among those, canned products account for 50%, next are condensed and frozen ones. In the past, the sector used to focus on developing the supply of raw materials to fruit and vegetable freezing and processing plants. Many plants have been equipped with modern facilities that are all certified of quality management standards such as ISO 9001 and HACCP. The applied raw materials also usually meet the common international maximum residue limits (MRL) of chemicals, and are produced following Good Agricultural Practices (GAP). Many small companies produce preliminarily processed and semi-products in various forms like dried, fried, or frozen fruit or vegetables. According to the statistics reported by 35 provinces, 25 state-owned enterprises, 7 joint-venture companies, 129 private companies and more than 10 thousand households are working in the processing sector. But many Vietnamese fruit & vegetable

processing plants are operating under their capacity due to the shortage of raw inputs. As indicated in the report by MARD Steering Committee for the Production Development Plan, most of processing plants are run at only 20-25% of their registered capacity, the highest rate ever they could obtain is about 40-50% (including Doveco, Kiveco, Dona New Tower etc.). In particular, some plants are working even at below 10% of their capacity like Vegetexco Hai Phong and Bac Giang. The main challenge faced by these processing plants is how to access the stable and sustainable sources of raw inputs. This is essential for the plants located in cities, far from production areas and mostly relied on the supplies from various sources such as farmers, agents/ middlemen or wholesalers. Inputs supplied to these plants have been collected from different sources, but the major ones are directly from farmers, wholesalers and self-production. Imported inputs are only used at large-scale plants. Table 2.6: Proportion of inputs for processing classified by different sources, in %
Scale, type of product/ region
Self-production
Farmers State-owned farms
Wholesalers Direct imported
Others
Small 10.11 63.75 0.59 25.56 0 0 Medium 1.23 63.88 0.27 34.63 0 0 Large 1.07 51.55 4.43 41.85 0.2 1.0 Vegetables 2.44 62.97 1.89 31.21 0 1.5 Fruits 4.76 58.94 1.92 34.38 0 0 Mixed 3.23 56.87 0.82 38.34 0.6 1.1 North 7.02 76.28 0.56 15.41 0.1 0.6 South 1.07 42.51 3.05 53.29 0 0.1
Source: Survey conducted by IFPRI (MARD) on fruit & vegetable processing
Common processing activities in Vietnam include sorting, classifying and packaging fresh products. Canning is among the major processing methods, with litchi the most important product, next is Rambutan, pineapple & mixed fruits. For canned vegetables, the most popular ones include mushrooms, baby corn, beans & sweet corn. Pickled vegetables are not very popular in Vietnam, but there are some kinds like bulb, cucumbers, radish… produced by some companies and farmers. Most of pickled vegetables are produced for the household’s consumption, but some pickled vegetables are destined for exports, also to Europe. Drying and freezing are also applied in Vietnam. Drying is the most common, while freezing is a relatively new process in the Vietnamese food processing industry.
2.2 Consumption
Fruit and vegetables reach the Vietnamese consumer through street markets mostly, followed at quite some distance by supermarkets, shops, and etcetera. The average domestic consumption is about 78kg per person annually, and this number is forecast to go up by 10% per year. The most consumed fruits and vegetables include water morning glory, tomatoes and bananas. On the average, Vietnamese consumers eat about 71kg of fruits & vegetables on an annual basis, of which ¾ are vegetables.

The composition of fruit and vegetable consumption depends on the region. Beans, kohlrabi, and cabbages are those consumed commonly in the North, while oranges, bananas, mangoes and other fruits are consumed more commonly in the South. The contrast by region can be seen most clearly in the case of kohlrabi; more than 90% of farmer households in the Northern mountainous areas and Red River Delta are consuming this product, but only less than 15% of households in the Eastern South and the Mekong River Delta consume it. In the urban areas, the consumption rate for all kinds of products is always high. According to the survey conducted by Department of Crop Production (MARD), domestically produced fruits are diversified in terms of quantity and quality. However, many imported fruits are also consumed strongly in Vietnam due to their better outlook and longer preservation time. Fruits imported from China and Thailand are even cheaper than the local ones, causing negative impact on domestically produced fruit consumption in the Southern region. In addition, Chinese fruits imported through private traders usually contain toxic substances. Some fruits originated from China are counterfeited with fake origin, deceiving consumers with brand names of those imported from the US, New Zealand, Australia, etcetera. According to the statistics by Southern Horticultural Research Institute (SOFRI), so far, most of fruits are consumed as fresh produce. The fruit used as input for processing, drying, canning, or juicing still represent a small proportion of total fruit production.
2.3 Imports
Between 2012 and 2014, China was the leading supplier of fruits and vegetables to Vietnam. In 2015 Thailand emerged as the biggest supplierto Vietnam, up by 45% against 2014. Table 2.7Vietnamese imports of fruits & vegetables, 2012-2015, USD million Suppliers 2012 2013 2014 2015
Total 335 406 522 622 China 163 158 154 187 Thailand 48 93 143 206 US 41 57 65 73 Australia 23 24 29 18 Korea 4.0 5.0 5.4 New Zealand 6.2 8.4 14 Malaysia 2.8 3.6 4.1 5.6 Myanmar 9.0 17 58 38
Source: Vietnam Customs, August 2016
According to the Vietnam Customs, by the end of June 2016, Vietnamese fruit and vegetable imports were estimated at USD 351 million, which was 40% up compared to the same period in 2015. Thailand continues to be Vietnam biggest supplier in 2016. In the first 6 months of 2016, Vietnam import value of these products from Thailand reached USD 143 million. The major imported products comprise:
Durians, rambutan, langsat, tamarins, mangosteens, and mangoes from Thailand,
Grapes, oranges, and apples from Australia, New Zealand and the US.
Vegetable products from China; fresh tomatoes, pumpkins, potatoes, cabbages. And also fruit: mangoes, apples, and grapes. They reach Vietnam mostly through the border gates in
Lao Cai, Huu Nghi, Tan Thanh, and Chua Ve harbour.
2.4 Exports
Vietnamese fruit & vegetable exports have been growing quicklyin the last years. If the 2012 export revenue of this sector was only USD 800 million, the 2015 figure peaked more than double at USD 1.8 billion. According to Vietnam Customs’ statistics, the first 6 months of 2016 turnover reached remarkable number of USD 1.15 billion, increasing by 36% in terms of export value as compared to the same period of the previous year, which forecasts formidable growth in Vietnamese fruit & vegetables exports in 2016.
Currently, Vietnamese fruit & vegetables have been exported to more 40 countries and territories, among which China, Japan, South Korea, the US, Netherlands, Taiwan, Malaysia, Thailand, Russia and Singapore are the main exporting markets.
As indicated by Vietnam Customs’ statistics, China remains Vietnamese leading fruit & vegetables importer, accounting for 1/3 of the total export turnover of this sector. Japan ranks the second, mainly importing variety of fruits like white flesh dragon fruit, mango, fresh litchi, and sweet corn. Besides, other export products such as condensed fruit juices, processed vegie like fried eggplants, steamed okra, chili are very popular in Japan.
The next biggest exporting markets are South Korea and America. While South Korea mainly imports fresh fruits like coconuts, dragon fruit, mango, mangosteens etc., and various processed vegetableslike carrots, garlic, broccoli, cabbage, canned cucumbers, the US major imports from Vietnam include pickled straw mushroom, canned straw mushroom, canned baby corn, various kinds of sweet potatoes, shallots, garlic, ginger, turmeric etc. Recently, America has permitted the importation of red and white flesh dragon fruit, rambutan, litchi and longan from Vietnam. In the coming time, the US will increase the import volume of fresh produce while reducing the canned products made in Vietnam.
Figure2.2: Vietnamese fruit & vegetables exports, 2012-2016, including first 6 months of 2016
Million USD
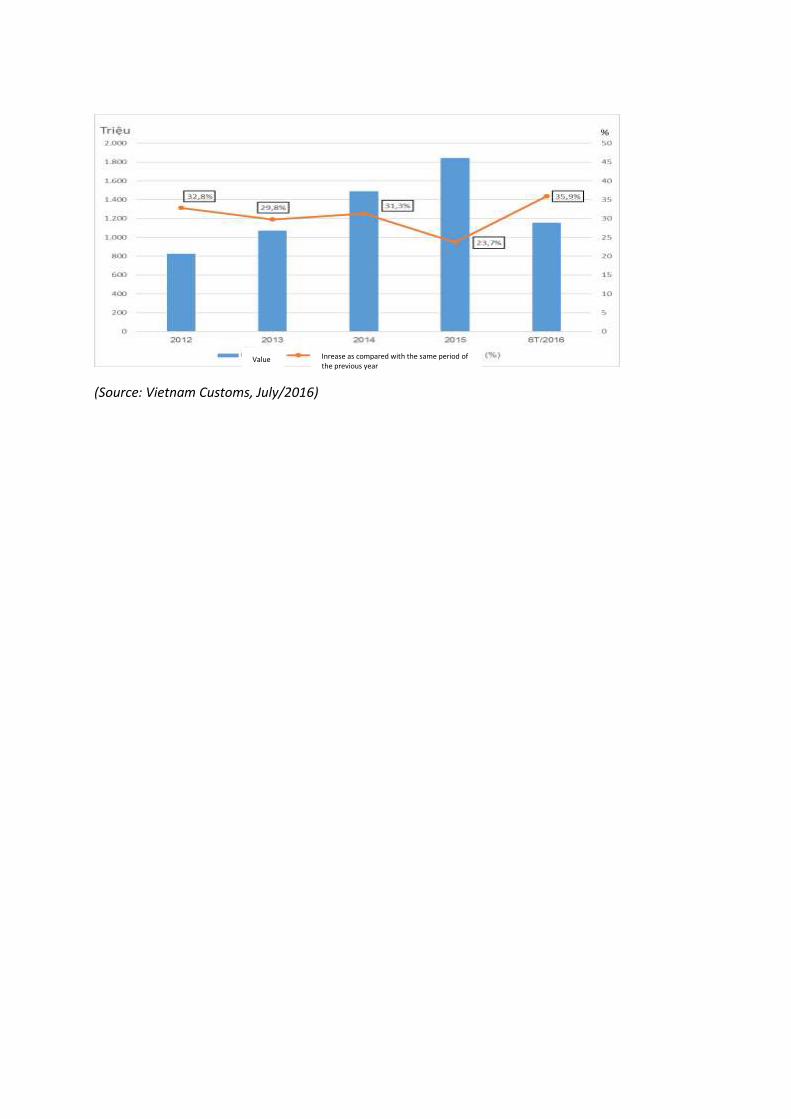
(Source: Vietnam Customs, July/2016)
Value Inrease as compared with the same period of the previous year

Table 2.8: Vietnamese fruit & vegetables exports by export markets 2012-2015, USD 1,000
No. Market 2012 2013 2014 2015 Share (%) Growth 2015/ 2014 (%)
Total 827,043 1,073,226 1,488,995 1,841,790 100 23.7
1 China 218,061 302,249 435,033 1,194,930 65 63.6
2 Japan 54,648 60,994 74,867 74,106 4.0 -1.0
3 South Korea 22,551 27,882 57,075 66,983 3.6 14.8
4 US 39,806 51,097 60,639 58,621 3.2 -3.4
5 Netherlands 21,604 25,331 39,399 42,284 2.3 6.8
6 Taiwan 25,654 25,757 35,076 40,355 2.2 13.1
7 Malaysia 17,024 29,108 30,495 37,068 2.0 17.7
8 Thailand 20,363 30,179 31,348 32,354 1.8 3.1
9 Russia 28,372 32,126 37,072 27,941 1.5 -32.7
10 Singapore 19,823 23,329 26,330 24,710 1.3 -6.6
11 Australia 14,307 15,993 17,470 19,678 1.1 11.2
12 Hong Kong 8,211 6,030 16,719 17,582 0.9 4.9
13 UAE 6,697 7,082 14,206 16,293 0.9 12.8
14 Canada 11,408 14,973 17,059 15,708 0.9 -8.6
15 Germany 8,830 9,801 10,361 12,345 0.7 16.1
16 France 7,943 7,865 11,177 10,820 0.6 -3.3
17 Cambodia 5,339 5,442 1,999 9,405 0.5 78.7
18 Indonesia 24,510 18,087 14,279 8,323 0.4 -71.6
19 Laos 3,887 8,443 9,373 7,075 0.4 -32.5
20 UK 3,825 3,578 5,049 6,415 0.3 21.3
21 Italia 5,167 5,849 5,670 4,545 0.3 -24.8
22 Kuwait 1,693 2,492 2,965 4,061 0.2 27.0
23 Ukraine 2,512 1,420 1,625 1,088 0.1 -49.3
Source: Vietnam Customs, July/2016
2.4.1 Exportsof fresh fruit & vegetables
Exported products comprise various tropical fruits like dragon fruit, pineapples, papayas, mangoes, avocados, papaya, and jackfruit. Among these, Vietnamese dragon fruit is the most popular and exported at the highest volume. Dragon fruit export alone accounted for almost 60% of the total export revenue to China in 2015.
According to the Ministry of Agriculture and Rural Development (MARD), many kinds of fruits such as longan, litchi, and mangoes have accessed successfully to demanding export markets e.g. America, Australia, the EU, Japan etc., significantly contributing to the continuous magnificent growth over the past years. The market access thanks to the fact that there have been more and more areas of crops and plantation in Vietnam coming closer the VietGAP quality. In particular, in September 2015, more than 20ha of Hung Yen longan plantation were certified by VietGAP and granted with region code for the exportation to the US.
In addition, dragon fruit has been welcome by Japanese market. According to Binh Thuan Province Depart of Agriculture and Rural Development, based on the number shown in contracts signed in 2015, there are about 3,000 tons of Binh Thuan dragon fruit exported to Japan annually. The

consignments are shipped to Japan in 7 days. If more and more new export markets emerged, Vietnamese dragon fruit will gradually reduce its dependence on the Chinese market with lots of hazards.
2.4.2 Exports of processed fruit & vegetables
Canned and frozen fruit & vegetables made in Vietnam are extremely rich and diverse in types. Exported frozen fruits include mangoes, pineapples, bananas, passion fruit, while frozen vegies are ginger, carrots, potatoes, chili, cucumbers etc. However, pineapples rank the champion as regards to the export growth rate.
Fruit juices: Although fruit juices are new product lines that have been newly marketed by the local business, some Vietnamese companies’ products have reached foreign markets with the ever-rising revenue, typically as Vinamilk, Nafoods Group… With the quality certifications by BRC, HALAL, KOSHER, IRMA, ISO 22000:2005, Vietnamese products have won the trust of demanding export markets like the EU, US, Japan, South Korea, Middle East, Australia and so far comprised of more than 30 types of different fruit & vegetables juices. Nowadays, Vietnam is focusing on the exportation of juices extracted from litchi, pineapples, lemon, passionfruit, momordica cochinchinensis (Gac fruit), mangoes etc.
Dried fruits: The main export markets of this product include China, Taiwan, Japan, Singapore, Indonesia, and Thailand. Approximately 80% of the total goes to China. In the future, the dried products will potentially become the major exports in Vietnamese fruit & vegetables product lines circulated in the international markets.
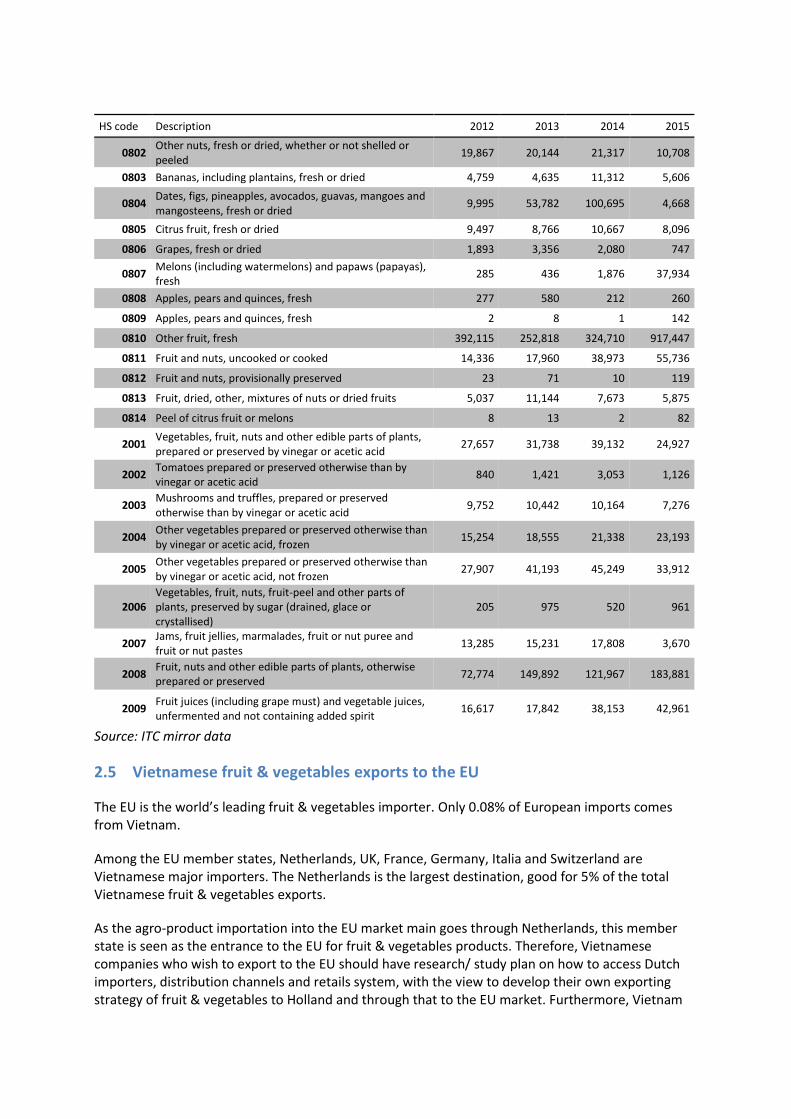
2.4.3 Exports by products
Below is an overview of Vietnamese fruit & vegetables exports by product lines:
Table2.9: Vietnamese fruit & vegetables exports, by HS codes (USD 1,000)
HS code Description 2012 2013 2014 2015
0701 Potatoes, fresh or chilled 217 93 60 619
0702 Tomatoes, fresh or chilled 411 1,368 1,209 1,000
0703 Onions, shallots, garlic, leeks and other alliaceous vegetables, fresh or chilled
25,448 25,226 10,555 5,565
0704 Cabbages, cauliflowers, kohlrabi, kale and similar edible brassicas, fresh or chilled
4,764 3,739 3,625 8,235
0705 Lettuce (Lactuca sativa) and chicory (Cichorium spp.), fresh or chilled
88 75 156 317
0706 Carrots, turnips, salad beetroot, salsify, celeriac, radishes and similar edible roots, fresh or chilled
1,479 1,389 5,973 5,192
0707 Cucumbers and gherkins, fresh or chilled 85 2 6 295
0708 Leguminous vegetables, shelled or unshelled, fresh or chilled
401 1,989 2,261 3,407
0709 Other vegetables, fresh or chilled 36,101 4,489 453,743 44,798
0710 Vegetables (uncooked or cooked by steaming or boiling in water), frozen
17,733 23,602 28,502 32,047
0711 Vegetables (uncooked or cooked by steaming or boiling in water), frozen
13,491 14,263 17,343 8,342
0712 Dried vegetables, whole, cut, sliced, broken or in powder, but not further prepared
7,352 8,553 18,547 10,590
0713 Dried leguminous vegetables, shelled, whether or not skinned or split
1,292 2,249 33,660 1,535
0714 Manioc, arrowroot, salep, Jerusalem artichokes, sweet potatoes and similar roots and tubers
585,511 408,190 417,905 434,949
HS code Description 2012 2013 2014 2015
0802 Other nuts, fresh or dried, whether or not shelled or peeled
19,867 20,144 21,317 10,708
0803 Bananas, including plantains, fresh or dried 4,759 4,635 11,312 5,606
0804 Dates, figs, pineapples, avocados, guavas, mangoes and mangosteens, fresh or dried
9,995 53,782 100,695 4,668
0805 Citrus fruit, fresh or dried 9,497 8,766 10,667 8,096
0806 Grapes, fresh or dried 1,893 3,356 2,080 747
0807 Melons (including watermelons) and papaws (papayas), fresh
285 436 1,876 37,934
0808 Apples, pears and quinces, fresh 277 580 212 260
0809 Apples, pears and quinces, fresh 2 8 1 142
0810 Other fruit, fresh 392,115 252,818 324,710 917,447
0811 Fruit and nuts, uncooked or cooked 14,336 17,960 38,973 55,736
0812 Fruit and nuts, provisionally preserved 23 71 10 119
0813 Fruit, dried, other, mixtures of nuts or dried fruits 5,037 11,144 7,673 5,875
0814 Peel of citrus fruit or melons 8 13 2 82
2001 Vegetables, fruit, nuts and other edible parts of plants, prepared or preserved by vinegar or acetic acid
27,657 31,738 39,132 24,927
2002 Tomatoes prepared or preserved otherwise than by vinegar or acetic acid
840 1,421 3,053 1,126
2003 Mushrooms and truffles, prepared or preserved otherwise than by vinegar or acetic acid
9,752 10,442 10,164 7,276
2004 Other vegetables prepared or preserved otherwise than by vinegar or acetic acid, frozen
15,254 18,555 21,338 23,193
2005 Other vegetables prepared or preserved otherwise than by vinegar or acetic acid, not frozen
27,907 41,193 45,249 33,912
2006 Vegetables, fruit, nuts, fruit-peel and other parts of plants, preserved by sugar (drained, glace or crystallised)
205 975 520 961
2007 Jams, fruit jellies, marmalades, fruit or nut puree and fruit or nut pastes
13,285 15,231 17,808 3,670
2008 Fruit, nuts and other edible parts of plants, otherwise prepared or preserved
72,774 149,892 121,967 183,881
2009 Fruit juices (including grape must) and vegetable juices, unfermented and not containing added spirit
16,617 17,842 38,153 42,961
Source: ITC mirror data
2.5 Vietnamese fruit & vegetables exports to the EU
The EU is the world’s leading fruit & vegetables importer. Only 0.08% of European imports comes from Vietnam.
Among the EU member states, Netherlands, UK, France, Germany, Italia and Switzerland are Vietnamese major importers. The Netherlands is the largest destination, good for 5% of the total Vietnamese fruit & vegetables exports.
As the agro-product importation into the EU market main goes through Netherlands, this member state is seen as the entrance to the EU for fruit & vegetables products. Therefore, Vietnamese companies who wish to export to the EU should have research/ study plan on how to access Dutch importers, distribution channels and retails system, with the view to develop their own exporting strategy of fruit & vegetables to Holland and through that to the EU market. Furthermore, Vietnam

could take advantages of many opportunities to export to North and Western Europe as well as new Eastern European members.
Following is the table of Vietnam fruit & vegetables products exported to the five leading EU importing countries in the period from 2013 to the first half of 2016.
Table 2.10: Top 5 Leading EU importing countries of Vietnamese fruit & vegetables (USD 1,000)
Importing countries 2012 2013 2014 2015 first 6 months/2016
Netherlands 21,604 25,331 39,399 42,284 28,051
Germany 8,830 9,801 10,361 12,345 5,585
France 7,943 7,865 11,177 10,820 6,466
Italia 5,167 5,849 5,670 4,545 2,031
UK 3,825 3,578 5,049 6,415 5,674
Source: Vietnam Customs, 2016
Table 2.11 Fruit & vegetables exports to the EU, by product, sorted by HS code (USD 1,000)
Vietnam -> EU Rest of World -> EU
Code Description 2013 2014 2013 2014 2015
0701 Potatoes, fresh or chilled 0 2 3,157,276 2,096,111 1,779,713
0703 Onions, shallots, garlic, leeks and other alliaceous vegetables, fresh or chilled
130 28 1,805,664 1,635,877 1,463,006
0704 Cabbages, cauliflowers, kohlrabi, kale and similar edible brassicas, fresh or chilled
5 0 1,235,498 1,170,533 1,134,727
0706 Carrots, turnips, salad beetroot, salsify, celeriac, radishes and similar edible roots, fresh or chilled
29 14 908,045 778,127 796,886
0708 Leguminous vegetables, fresh or chilled
85 37 1,015,400 1,070,129 938,036
0709 Other vegetables, fresh or chilled
690 386 6,972,577 6,819,407 6,471,164
0710 Vegetables (uncooked or cooked by steaming or boiling in water), frozen
5,640 5,288 3,552,365 3,474,995 3,017,491
0711 Vegetables (uncooked or cooked by steaming or boiling in water), frozen
5,674 5,478 320,367 345,487 300,449
0712 Dried vegetables, whole, cut, sliced, broken or in powder, but not further prepared
838 886 1,039,063 1,159,777 1,009,936
0713 Dried leguminous vegetables, shelled
163 161 1,580,966 1,626,415 1,356,441
0714 Manioc, arrowroot, salep, Jerusalem artichokes, sweet potatoes and similar roots and tubers
1,698 2,033 237,033 304,860 343,907

0802 Other nuts, fresh or dried,
whether or not shelled or peeled
879 1,846 6,337,993 7,433,454 8,210,369
0803 Bananas, including plantains
230 340 6,578,268 6,658,111 6,025,761
0804 Dates, figs, pineapples, avocados, guavas, mangoes and mangosteens, fresh or dried
226 244 3,462,656 3,914,431 3,848,986
0805 Citrus fruit, fresh or dried 4,511 3,788 7,172,725 6,839,990 6,473,370
0807 Melons (including watermelons) and papaws (papayas), fresh
114 40 1,824,909 1,896,282 1,737,569
0810 Other fruit, fresh 12,863 16,027 4,309,787 4,671,215 4,486,354 0811 Fruit and nuts, uncooked or
cooked by steaming or boiling in water, frozen
3,319 7,690 2,576,382 2,439,236 2,268,237
0813 Fruit, dried, and mixtures of nuts or dried fruits
119 137 973,629 1,191.36 1,163,819
0814 Peel of citrus fruit or melons
3 0 41,511 44,785 36,983
2001 Vegetables, fruit, nuts, other edible parts of plants, prepared or preserved by vinegar or acetic acid
2,329 4,524 905,938 994,226 874,317
2002 Tomatoes prepared or preserved otherwise than by vinegar or acetic acid
2 6 2,062,485 2,244,015 2,077,865
2003 Mushrooms and truffles, prepared or preserved
85 223 436,024 435,297 343,420
2004 Other vegetables prepared or preserved, frozen
1,637 2,100 3,274,859 3,432,785 3,064,760
2005 Other vegetables prepared or preserved, not frozen
3,427 1,461 4,660,503 4,892,294 4,238,843
2006 Vegetables, fruit, nuts, fruit-peel and other parts of plants, preserved by sugar
103 168 142,327 157,196 140,416
2007 Jams, fruit jellies, marmalades, fruit or nut puree and fruit or nut pastes
2,085 1,775 1,373,363 1,418,012 1,354,419
2008 Fruit, nuts and other edible parts of plants, otherwise prepared or preserved
17,360 8,521 5,536,057 5,927,046 5,972,257
2009 Fruit juices and vegetable juices
7,665 18,395 9,234,803 9,093,160 7,781,504
Source: ITC - June/2016
2.5.1 Products with high potential in Europe
At the EU market, tropical & off-season fruit & vegetables have great potential for market development, especially avocados and mangoes. Those products expose huge opportunity and advantage that should be grasped by Vietnamese exporters. With humid tropical climate in the south to temperate in the north, Vietnam could cultivate and supply great variety of plantation at the EU market’s demand. In the period of 2010-2016, Vietnamese tropical fruit & vegetables exports to the EU kept soaring up thanks to the ever-increasing demand.
However, Vietnam remains mostly exporting fresh and primarily process fruit & vegetables to the EU, but not the processed products, facing the challenges of long geographical distance and high

cost of transportation. This is mainly due to the fact that post-harvest technology remains low and poor while hi-tech has not been transferred to farmers. The collection and preservation are still conducted manually with little support of machinery.
Among the product lines exports to the EU, fruits always achieve the highest export revenue. The major exports include pineapples, dragon fruit, coconut meat, rambutan, and mangoes. Of those, pineapples win the leading revenue, next is dragon fruit. Moreover, the export revenues of mangoes, coconut meat and rambutan have been rising. Some major fresh and processed fruit & vegetables exports to the EU market are listed below.
2.5.1.1 Fresh dragon fruit
Dragon fruit have been cultivated in 32 provinces all over the country with the plantation area of about 25 thousand ha, harvest productivity of over 460 thousand tons per year, bringing about nearly USD 150 million of export turnover. Vietnamese dragon fruit can be classified into two types, namely white flesh that occupies majority of the production, and the rest is red flesh. Binh Thuan, Tien Giang and Long An provinces are homeland of the fruit.
These fruit are little known in most EU member states. For the time being, Vietnam is the major exporter of this product to EU. Nevertheless, Israel and South American countries are becoming the competitors due to their comparative advantage in terms of the cost of maritime transportation which is usually cheaper than the one of aviation applied to the products imported from Vietnam.
2.5.1.2 Canned pineapples
Pineapples are one of the fastest growing imports into the EU. The trading of imported pineapples in this market is also flourishing and nearly 40% of pineapples imported into the EU are re-exported.
Netherlands, Germany and UK are the main importing markets. However, the export turnover remains insignificant in the EU total import revenue of this product. Most Vietnamese companies could export their products to the EU without any difficulties. The stable supplies and fairly similar quality products guarantee the full capacity of processing plants in the harvest seasons. At the moment, Vietnam exports mostly canned pineapple slices to the EU. As demanded by the EU market, these products need to use the uniformly ripening technology to assure the fresh and delicious taste. The uniform ripeness that is extremely important for the good quality requires special treatment at planting stage and caring at the harvest time.
Although pineapples are quite common crops in Vietnam, the export volume is still small as compared with the local production. The main reason lies in companies’ lack of flexible policy of purchasing, collecting and processing pineapples for export, as well as lack of experience in searching for good trade partners for sustainable cooperation. EU market for pineapples proves promising one with great potential while Vietnam shows its huge capacity for much more development.
2.5.1.3 Ready-to-eat mangoes
Currently, mangoes are one of the imported exotic fruit with higher growth rate in the EU market. Thanks to the fact that Europe does not possess the soil for mangoes plantation, it has to import these products all year round from tropical countries to serve the domestic consumption demand. These are also Vietnamese major exports to some European nations, which will be then re-exported to other member states. Big importers include France, Portugal, UK and Netherlands. Holland is the one who re- exports mangoes to Germany and France, as well as to the UK, Belgium
and Norway. The re-export volume to Switzerland and Norway has been slightly increased over the past 10 years. Russia has also become important destination to re-export the products.
Ready-to-eat mangoes have emerged to be major imports following the retail demand in the European market over the last years. These products also help curb the throw-out of fruit & vegetables at supermarkets, as customers do not need to press and check the ripeness of the fruits. In addition, ready-to-eat mangoes are normally shipped through maritime, which would be helpful for scheduling the supply, distribution and marketing activities. Nevertheless, the products require strict control to the quality.
To promote the exportation to Europe, Vietnamese enterprises should be more proactive in searching for European importers who have credible ripening technology, network of big clients and good understanding of the market. It is advisable to find professional partners among trading centres specializing in the trade of mangoes to increase more opportunities to bring in high quality products to the European market.
2.5.1.4 Processed vegetables and fruit juices
In the past, Vietnam used to export dried fruit & vegetables, thus its exported processed vegetables (frozen or preserved in vinegar) obtain very limited market share. In 2014, Vietnam exported USD 7.4 million worth of processed vegetables and USD 18.3 million of fruit juices to the EU. Vietnam mainly sells condensed juice extracted from lemon, passion fruit, dragon fruit (red and white), mangoes, pineapples, guava, soursop, momordica cochinchinensis (Gac fruit) at the EU market. Processed vegetables and fruit juices will not only raise the export value but also contain the comparative advantage, which help Vietnamese products easily overcome technical barriers in the import market, because canned and frozen products are normally not put under strict surveillance of food safety like the fresh ones. Vietnam has been also applying modern technologies in its fruit & vegetables preservation techniques and investing to extend the scale of processed fruit & vegetables production, aiming at accelerating its export volume to the EU.
2.5.2 Vietnamese capacity to meet relevant standards
The EU is a huge exporting market of fruit & vegetables but has very strict requirements. Nowadays, EU consumers seem to pay more attention to health, hence the quality will be essentialin the EU market. Though there is a lot of potential, the Vietnamese fruit & vegetables sector is facing various challenges and difficulties. Therefore, the most important task for the sector is to create added value based on product quality and food safety.
For fresh fruit & vegetables, Global GAP certification is considered as an important prerequisite for access to the European market. Beside ensuring quality and food safety, GlobalGAP is also related to the guarantee of meeting environmental and social standards through reducing chemical use and caring of workers’ health and safety.However, this standard seems too difficult for Vietnamese companies to meet, as most of them are SME’s with limited production scale. At the moment, the area of centralized planned safe cultivation zones remains insignificant, only accounting for 8.0-8.5% of the total cultivation area in Vietnam. Furthermore, the validity extension of the initialGlobalGAP certificate granted to these zones has expired, which poses another burden to enterprises. There is still a lot of work to do in terms of cultivation planning and investment in equipment and facilities, technology, and training to raise the awareness and skills for workers to meet GlobalGAP standards.
The circumstances of violation of food safety, abuse of pesticides and growth on vegetables, fruit,

fruit flies pesticide residue, heavy metal content, and packaging quality… are also troublesome barriers for Vietnam when exporting to the EU. With the far geographical distance, Vietnamese fruit & vegetables encounter many challenges during transportation, preservation, which makes itdifficult to meet required technical standards. Moreover, a huge challenge is the local companies’ lack of pro-activeness and honesty. When exporting to the EU, the products must undergo costly radiation or sterilization stage, thus some companies try to omit this step and enter the EU market with the hope to dodge as many obligations as possible.
Some typical cases in which exported herbs were caught with violation and got alerted by the EU, leading to the increase of checking frequency in recent years, happened so rampant that public authority had to suspend the exportation for adjustment measures. For example, in 2014, from February 1st to early October 2014, Directorate General for Health and Consumers under the EC notified the detection of 3 consignments of Vietnam herbs contaminated by toxic insects, most were fruit flies. More specifically, 5 types of herbs including basil, peppers, celery, bitter melon and coriander were contaminated by insects. According to the EU rules, if there were 2 more consignments of these herbs from Vietnam are caught with insect contamination, all of these 5 would be suspended from importation into the EU market. In this case, the Plant Protection Dept (PPD) of MARD had to suspend the issuance of phytosanitary permit to these herbs for the exports to the EU till Feb 1st 2015. Before that, in mid-2012, PPD had to suspend the phytosanitary permit for these 5 herbs due to similar reason. According to the National Agro-Fishery, Forestry Quality Assurance Dept. (NAFIQAD), the checking frequency for Vietnamese dragon fruit has increased by 20%. This is even much higher up to by 50% for some herbs like coriander, cayenne peppers, basil, mint basil, celery, and okra. The suspect ion derived from the case where EU detects over MRL of pesticides on the products.
Furthermore, EU customers pay more attention to fruit & vegetables with clear origin, certified as organic or Fairtrade.
Abiding by the requirements on certifying organic products or Fairtrade is also an approach to supply fruit produced in an environmentally and socially responsible manner. In Vietnam, the PGS Coordination Board sets the PGS organic standards, with reference to basic standards of IFOAM and National Standards on production and processing of organic products developed by MARD. The PGS set applied to producers in cultivation/ plantation and husbandry. These standards pave the way for PGS Vietnam to provide certification services to organic products from cultivation/ plantation and husbandry industries, ranging from production to selling to the end consumer. The standards were officially accredited by IFOAM on Sept. 4th 2013.
To accelerate fruit & vegetables exports to the EU, as indicated by European economist, Vietnamese enterprises should apply measures to ensure the quality and food safety for fruit & vegetables, organize the production into closed chain “from farm to fork” or from “seed to chopstick”. In addition, the quality surveillance has to be conducted coherently, it is necessary to have coordination mechanism among farmers, enterprises and administrative authorities, as well as strong support from the government in terms of policy and fund.
2.5.3 Analysis of strong & weak points of Vietnamese fruit and vegetables exports
2.5.3.1 Strong points
Naturally favourable conditions: Vietnam has favorable climate (with tropical weather in the South and subtropical in the North). Besides, the large agro areas are quite suitable for the cultivation of fruit & vegetables. It results in great diversification;typical fruit &
vegetables characterize each season. This offers a comparative advantage against other countries in the region and all over the world.
High productivity:Various processed fruit & vegetables are produced on hi-tech production chains; the product quality and outlook hence have been ever improved. 90% of Vietnam total fruit & vegetables exports currently are fresh. In the nationwide, there are more than 100 establishments involved in processing fruit & vegetable in industrial scale, at the productivity of 300,000 tons per year with high quality and great diversification of tropical types. The growth rate of this sector is extremely high, especially in key areas: namely the Southeast region, Mekong River Delta and the Highland. Vietnamese farmers also have traditional experiences in cultivation and production of fruit & vegetables.
Redundant workforce at rather low labor cost:Vietnam inhabits more than 90 million people, 49% of which at the working age, 70% live in the rural area. Local farmers possess traditional experience of agriculture. Labor cost in agro sectors is comparatively low. The advantage of cheap labor helps cut down the production cost, as the result, lower the cost per unit, and raise the competitiveness as regards selling price. With the free trade policy and market opening, land has been assigned to local farmers to develop their agro production.
2.5.3.2 Weak points
Households’ production remains outdated, small and individualist, lack of centralized areas of cultivation: Households involved in procession fruit & vegetables are mostly small, individualist and scattered, unplanned, therefore jeopardizing the management and investment in infrastructural development. The lack of planning for crops has resulted in miserable circumstance when big harvest leads to price drop. Cultivation map for fruit & vegetables seems rather fragmented, challenging the application of Global Gap to the production process.
Low and uneven quality, lack of association among enterprises: Farmers have not been trained thoroughly on appropriate treatment in their fruit & vegetables cultivation. As the crops are grown rather scatteredly, it is rather difficult to have uniform measures for different stages from flowering to harvesting, assuring the similar quality inputs across the region for processing and exporting.
The association between farmers and companies seems quite loose and fragile. The linkage between farmers and enterprises remains fragile. There are about 60 processing plants across the country that have been equipped with modern machinery and facilities, producing variety of products with such quality satisfying the market requirements in Japan, America and the EU. However, the outputs of these plants only account for 20-30% of their full capacity. This is due to some plants after being built up are short of inputs for production or located too far from source zones, leading to high cost of transportation and low quality inputs for processing to export.
Poor condition of storing facilities and weak trading services: Technology for post-harvest treatment remains very low, outdated which farmers are slowly updated with modern techniques. Most of steps from collection, preliminary treatment to preservation are conducted manually in the lack of or poor condition of preservation technology and vehicles, which results in low quality products, high production cost, and soaring ratio of loss in the post-harvest up to 25-30%. At the moment, Vietnam still does not have long-time (from 1 to 2 months) preservation technology for fruit and vegetables in the post-harvest. Therefore, it can only export small volume of fresh fruit by waterway to some Asian neighbors and by aviation to European countries.

Regarding the transportation, Vietnam doesn’t have vehicles like big ships and containers equipped with refrigerators, which jeopardizes the shipment of exports in huge volume to far distance markets. Furthermore, the use of toxic and unknown origin chemicals in processing and preservation of fresh fruit & vegetables remains rampant.
No well-known brands: 90% of Vietnamese agro-products exported to international markets go through middle agents under other countries brand names, which misleads consumers’ understanding of the project origin. Therefore, the branding for Vietnamese fruit & vegetable emerges as one of the hot issues, in order to raise the profit for farmers and enterprises, as well as promote the prestige of Vietnam agro-products in the world market. Most of Vietnamese fruit & vegetables are exported raw or preliminarily processed, which does not create added value to raise more profit for farmers.
Lack of trading and commercial skills:The organization of production and processing, marketing for the exports prove fairly weak. Vietnam possesses great diversification of delicious fruit & vegetable types, which are quite well known domestically and unable to reach out internationally. External markets have not been researched comprehensively, including market types & tastes, appropriate times for supply, competitors etc., thus farmers totally have no idea of their markets and opportunities.
Expensive final price:The supply chain comprises many intermediaries, adding a lot of costs and making the final product rather expensive, while the margin for the farmer remains relatively small. Moreover, due to high transportation and shipping costs, airport fees, the final product price cannot compete with the ones from Thailand, China, and Malaysia.
2.6 The Vietnamese fruit and vegetables sector – the way forward
Below follows a list of reflections that can be taken as input for further development of a nationwide strategy to develop the fruit and vegetables sectors:
1. With the current small and fragmented production scale, it is rather difficult for Vietnamese products to win the competition with similar products from other nations. Therefore, the government should support restructuring and streamlining the production towards creating centralized areas of cultivation/ plantation and processing. All household producers should be associated into groups or kind of cooperatives.
2. To facilitate to formation of big areas of fruit & vegetable cultivation, Vietnam should develop flexible policies on land, formulate favorable legal corridor allowing farmers to change their crops easily, and gradually evolved into large areas of cultivation, particularly encouraging the development of fruit & vegetables farm model.
3. The sustainable development of key fruit centrally cultivated will contribute significantly to restructuring the cultivation sector and meeting the domestic consumption need as well as exportation, by that way increasing the added value per each unit of cultivating area, improving the income of producer and the business establishment involving in collecting, preserving and distributing fruit.
4. In addition, based on the orientation of general planning, each province and city authority should deploy their own planning of areas for key fruit cultivation, identifying specific zones with detailed area for each kind of fruit at commune and town level; establish the full chain from production – collection – preliminary processing – processing – preservation and distribution/ selling; develop supply network providing seeds, seedling, fertilizer, pesticides, irrigation services and post-harvest technologies; creating organizations who are capable of conducting evaluation, examination of product quality, as well as exchange centers to connect producers with exporters.
5. The branding for fruit & vegetable should be invested comprehensively with long-term development strategy and uniform consolidation of all stages in the production chain

ranging from seeds selection, cultivation, caring, harvest and post-harvest preservation. This requires close coordination among farmers, scientist, communicators, enterprises and government. Furthermore, Vietnam should define the advantage among its key agro-products in each region, each product sector to promote the strength and create its autonomy in the world market.
6. To develop the fruit & vegetable sector sustainably, Vietnam should keep increasing its export volumes, focus on ever-improving the quality, enhancing investment in preservation technology and vehicles of transportation, and stabilizing the price, with the view to further strengthen its stand in the traditional export markets while extending to new markets.

3 The EU fruits and vegetables market
3.1 Market features and trends
3.1.1 Market features
Overall there is some correlation between the fresh fruit and vegetables (FFV) and the processed fruit and vegetables (PFV) market. While in some cases they may influence each other positively, there is also competition between the two markets. For example, in 2014, European consumption of PFV declined slightly, due to increased consumption of fresh fruits and vegetables in that year, caused by the abundant availability that year, resulting in low prices of FFV. Overall, the FFV and PFV market are close to saturation. This goes especially for locally produced and in-season FFV.
3.1.1.1 Fresh fruit and vegetables
Over the last five years, European production and consumption of FFV have been relatively stable. Major future developments in market volumes are not anticipated. The Netherlands, the United Kingdom and Belgium are the leading direct importers of FFV from outside Europe. The Netherlands and Belgium are also major trade hubs, which means that their imports are not only sold in the local market but also re-exported to other (European) countries.
3.1.1.2 Processed fruit and vegetables
Germany, France, the United Kingdom, Belgium and the Netherlands are the biggest importers of PFV. Imports from Developing Countries amount to approximately 25% of the total European imports in 2014. Production of PFV in Europe remained relatively stable over recent years.
3.1.1.3 Requirements for food are very strict
Food safety continues to be very important. EU legislation has put highly demanding requirements to food products and production, and in the Northwestern part of Europe, requirements of buyers are even higher than the official EU requirements. Strict compliance with MRLs (maximum residue levels) and microbial contamination are a precondition when entering the EU market. Also tracking and tracing is becoming more important, as well as certification such as GLOBALGAP, BRC and/or IFS.
GLOBALGAP has already become a minimum standard for several European supermarkets, especially in the northwest European market. In practice it means that growers and exporters must pay specific attention to cleaning and decontaminating equipment, containers and transport vehicles.
3.1.2 Trends
3.1.2.1 Growing concern about health and well-being
People in Europe are increasingly concerned about their health and well-being and they realise that their food consumption has a large influence in that respect. This megatrend is reflected in the following trends across Europe:
Public Health Departments organising campaigns in collaboration with supermarkets and

the media to stimulate people to eat more fruit and vegetables.
Increasing demand for fruits and vegetables that are considered as healthy: o ‘Superfoods’, this terminology is used to describe and promote the sales and
consumption of fruit and vegetables with specific healthful characteristics (such as blueberries, pomegranates, kale and spinach).
o Organic fruit and vegetables. More and more people consider these products as better for health and well-being. As the availability of organic fruit has grown rapidly over the past five years, prices have come down and supported market growth.
o Products without artificial additives, made from whole fruits or with natural fermentation.
o ‘Not-from-concentrate’ (NFC) juices o Dried fruits and edible nuts, as they are considered healthy snacks. They find their
way to consumers packed as single or multiple blends, bars, and even powders. o Pickled vegetables. They are considered as healthy snacks because of relatively high
vitamin levels, enhanced digestibility and anti- bacterial properties. o Coconut products (especially the oil).
Reduced demand for fruit and vegetables that are considered as unhealthy: o PFV products with added sugar (although perceptions about sugar differ a lot
among consumers). o Traditional fruit juices due to their high sugar content.
3.1.2.2 Consumers want convenience
Consumers increasingly got used to convenience and appreciate products that offer less preparation or processing and ease of use. At the same time, convenience food offers clear benefits for certain target groups, such as for babies, children, and the elderly. In the fruit and vegetables market, the convenience megatrend is reflected by the growing availability of, and demand for…
Smaller portion-packs,
Pre-cut fresh fruit and vegetables,
Seedless grapes and other fruits,
Products with longer shelf life,
Frozen vegetable mixes with spices, herbs and sauce,
Ripened fruits such as avocados and mangoes,
Smoothies available through several channels (freshly made in smoothie bars, or from the cooled fruit juices range of food retailers).
3.1.2.3 Diversification of products and flavours
Nowadays, EU consumers are increasingly open towards new experiences. This can be explained by several developments, for example the fact that Europeans travel more and further away, and increasingly get aware of new tastes. The on-going spread of several ethnic cuisines throughout the foodservice industry in Europe has also driven growth. In addition, cooking programmes (24-hours kitchen, Master Chef, Diner Presque Parfait, Jamie Oliver) got popular and have stimulated consumers to cooking creatively, from scratch, using exotic fruits among other things.
This trend offers particular good opportunities for:
Exotic fruit and vegetables, such as rambutan, longan and dragon fruit. So far the market for such exotic fruit and vegetables is limited to a small range of countries and particularly
the ethnic food markets. For the exotic fruits commonly eaten in Asia, the main consumer group in Europe are the Asian diaspora. There are Asian food markets and websites that offer typical Asian produce, also including exotic fruit and vegetables.
New flavours in the fruit juices market, like rhubarb, quince, elderflower, and exotic fruit flavours such as mango, banana, passion fruit, acerola and acai.
Fresh and exotic herbs, such as Thai coriander.
3.1.2.4 Preference for sustainable supply chains
As consumers are becoming more concerned about transparency on how their fruit and vegetables are produced, sustainability in the fruit and vegetables supply chain is increasing. European importers are therefore facing growing pressure from retail chains, as they require only Corporate Social Responsibility (CSR) certified goods. This means that importers are obligated to look stricter at the implemented environmental efforts and social responsible practices of all companies in the supply chain.
Partly related to this trend is the growing market for locally grown fruits (e.g. apples, pears, grapes, peaches, berries), even if they are not perfect. To reduce the waste of fruit and vegetables across the supply chain, food retailers also relaxed their size and shape requirements for locally grown fruit. This has enabled the sales of fruit that was previously rejected as ‘ugly’ fruit.
3.2 Consumption
3.2.1 FFV
The total fruit consumption (including losses and processing) is between 70-80 million tons per year. The consumption of vegetables is between 115 and 130 million tons per year (without potatoes it is roughly half of that). The food retail channelaccount for over 50% of total sales (for fresh fruit this is even 75%), followed by industrial processing, food service, street markets, and specialized fruit and vegetables stores.
Italy and Spain are the largest consuming countries in Europe. But, this in mainly because Italy and Spain dominate production of grapes, oranges and tomatoes in Europe. A lot of their fresh produce is processed locally, meaning that the segment “industrial processing” has a relatively large share.
FFV consumption in the EU is relatively stable for several of the leading product categories (e.g. grapes, oranges, apples, bananas, tomatoes, potatoes). Growth in consumption particularly takes place in non-traditional product categories, like sweet potatoes, avocados, limes, and tropical fruit. But, as volumes for such niche categories are relatively small so far, this growth has limited influence on total consumption figures.
Although the FFV is a mature market, in the supermarket shelves there is a clear trend visible towards more added-value products. While the mainstream market is strongly driven by price, in supermarkets and the out-of home markets the range of high-end FFV including organic, fair-trade, convenience products (fresh cut, ready-to-eat) is increasing slowly but gradually.
3.2.2 PFV
In Europe the average per capita consumption of PFV is declining as a result of the rising consumption of fresh fruits and vegetables, and less consumption in some large segments such as fruit juice. But some segments within PFV shown year-on-year growth: fruit snacks, and frozen

processed vegetables (ready to use). A main characteristic of thePFV market, as compared to the FFV market, is less fluctuation in demand, sales, and prices.

3.2.2.1 Fruit juices and nectars
EU consumption of fruit juices and nectars in the EU is about 10 billion litres per year. This market is under pressure because people become more aware of the sugar content of fruit juices. As a result, the market has already declined for the 7th consecutive year in 2015. Although the total market has shown decline year-on-year, there is a general increase in demand for high-quality juices, including, not-from concentrate juices, exotic juices, chilled juices, juices with pulp and mixed fruits.
Germany is the largest market with also the highest per capita consumption. The country accounts for roughly 25% of total European consumption. France, the UK, Spain and Italy together represent another 45% of the market.
3.2.2.2 Canned fruit and vegetables
The total consumption of canned fruits and vegetables is about USD12-13 billion per year. Canned fruit takes about 30% of that total, while the lion share is for canned vegetables. On average, this market segment is declining every year, due to the poor image of canned products relative to fresh and frozen products.
3.2.2.3 Nuts and driedfruits
The highest consumption of nuts and dried fruits is in Germany, which can be explained by Germany’s leading position in the EU in terms of population and GDP. Although there is certainly a market for single blend nuts or dried fruits, most of the nuts and dried fruits in the EU are consumed in a mix or blend.
3.2.2.4 Jams, jellies, purées and marmalades
Jams, jellies, purées and marmalades are consumed all over Europe, but the largest markets are France, Germany and the UK.
3.3 Price
Prices of PFV are more stable than prices of FFV. There are several reasons for this difference; one of them being the fact that farmers that grow fruit or vegetables for the industrial sector, often work with annual contracts. This situation leads to a better balance between demand and supply.
Prices of FFV can fluctuate considerably, due to fluctuations in demand and supply, often influenced by seasonality. For certain fruits, like avocado and mango, such fluctuations can be relatively strong. Supplying regular volumes of such fruits should be the strategy of exporters to solve this problem (for papaya this worked out in the past).
Prices may also depend on the variety of a certain fruit or vegetable. In the case of tropical or exotic fruit, the post-harvest process of shipping and distribution can be complicated and may have an upward impact on prices. Food retailers work with a sales and marketing planning for fruit and vegetables of 2-3 weeks, which may offer challenges to fruit supply from distant locations. Another factor here can be shipment volumes, impacting freight rates to a large extent and also the final price in the market.
If the price of certain tropical and exotic fruit shows sharp increases in a short period of time, this quickly leads to a shift in consumer preferences for competitively priced fruit. This underlines that fruit producers and exporters, in order to gain a better income, should put efforts into:
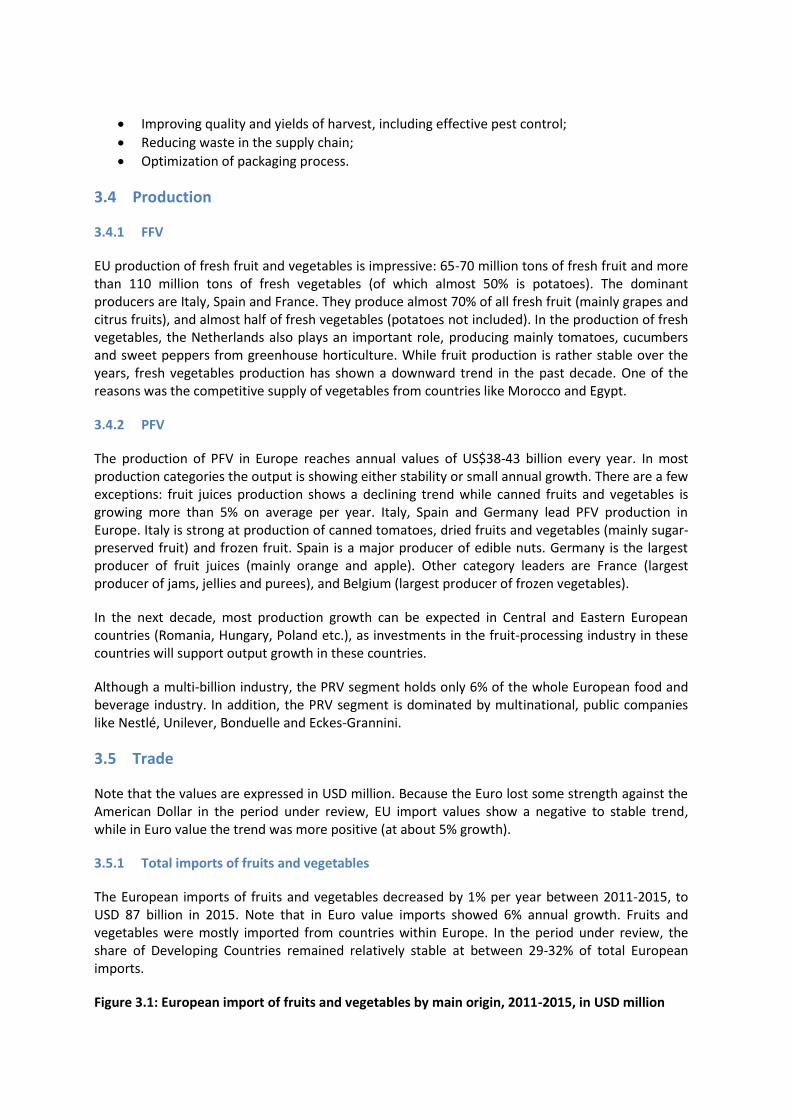
Improving quality and yields of harvest, including effective pest control;
Reducing waste in the supply chain;
Optimization of packaging process.
3.4 Production
3.4.1 FFV
EU production of fresh fruit and vegetables is impressive: 65-70 million tons of fresh fruit and more than 110 million tons of fresh vegetables (of which almost 50% is potatoes). The dominant producers are Italy, Spain and France. They produce almost 70% of all fresh fruit (mainly grapes and citrus fruits), and almost half of fresh vegetables (potatoes not included). In the production of fresh vegetables, the Netherlands also plays an important role, producing mainly tomatoes, cucumbers and sweet peppers from greenhouse horticulture. While fruit production is rather stable over the years, fresh vegetables production has shown a downward trend in the past decade. One of the reasons was the competitive supply of vegetables from countries like Morocco and Egypt.
3.4.2 PFV
The production of PFV in Europe reaches annual values of US$38-43 billion every year. In most production categories the output is showing either stability or small annual growth. There are a few exceptions: fruit juices production shows a declining trend while canned fruits and vegetables is growing more than 5% on average per year. Italy, Spain and Germany lead PFV production in Europe. Italy is strong at production of canned tomatoes, dried fruits and vegetables (mainly sugar-preserved fruit) and frozen fruit. Spain is a major producer of edible nuts. Germany is the largest producer of fruit juices (mainly orange and apple). Other category leaders are France (largest producer of jams, jellies and purees), and Belgium (largest producer of frozen vegetables).
In the next decade, most production growth can be expected in Central and Eastern European countries (Romania, Hungary, Poland etc.), as investments in the fruit-processing industry in these countries will support output growth in these countries.
Although a multi-billion industry, the PRV segment holds only 6% of the whole European food and beverage industry. In addition, the PRV segment is dominated by multinational, public companies like Nestlé, Unilever, Bonduelle and Eckes-Grannini.
3.5 Trade
Note that the values are expressed in USD million. Because the Euro lost some strength against the American Dollar in the period under review, EU import values show a negative to stable trend, while in Euro value the trend was more positive (at about 5% growth).
3.5.1 Total imports of fruits and vegetables
The European imports of fruits and vegetables decreased by 1% per year between 2011-2015, to USD 87 billion in 2015. Note that in Euro value imports showed 6% annual growth. Fruits and vegetables were mostly imported from countries within Europe. In the period under review, the share of Developing Countries remained relatively stable at between 29-32% of total European imports.
Figure 3.1: European import of fruits and vegetables by main origin, 2011-2015, in USD million

Data source: Trademap (2016)
Import growth over the past years was particularly the result of the increasing popularity of tropical products (e.g. avocados and mangoes), as well as of niche products (e.g. berries and exotic fruit and vegetables). On the other hand, imports have remained stable or even declined for some of the largest commodities (e.g. standard tomatoes and oranges).
40% of all fruit and vegetables imported from outside Europe are fresh, leaving the other 60% for processed fruit and vegetables.
3.5.1.1 Imports of FFV from outside Europe
While fresh vegetables mostly come from within Europe or countries relatively close to Europe, fresh fruit comes from a very wide range of countries. Although this also includes many Asian countries, so far the largest suppliers from outside Europe are South Africa, Turkey, and a range of South and Central American countries (Brazil, Costa Rica, Chile, Peru, Colombia and Ecuador). South Africa benefits from its opposite seasons in citrus fruit, grapes, apples, pears, and peaches, while Turkey mostly exports grapes and citrus fruits to Europe. Tropical/exotic fruit and out-of-season fruit dominate fresh fruit imports from outside Europe. The largest share of EU imports from outside Europe is for bananas (over 40% share), followed by pineapples, oranges, and grapes. Figure 3 shows more details of the main suppliers. For vegetables, the main imported products from outside the EU are tomatoes (20-25%), potatoes and onions (both 10-15%), sweet peppers (capsicum) and beans (both about 10%). Europe is self-sufficient for fresh vegetables to a large extent. Countries close to Europe with good climate and weather conditions are best positioned to supplement the supply of fresh vegetables. Morocco and Egypt are the best examples here, while Turkey could be also mentioned (but so far Turkey’s exports to Europe are mostly fruit, nuts, and processed fruit).
3.5.1.2 Imports of PFV from outside Europe
40%of processed fruit and vegetables come from outside Europe. Important suppliers are Turkey (mostly dried fruit, nuts and fruit preparations), Brazil (mainly orange juice), Costa Rica (fruit juice), China (mainly nuts and preserved vegetables), Chile (dried prunes) and Peru (preserved vegetables).
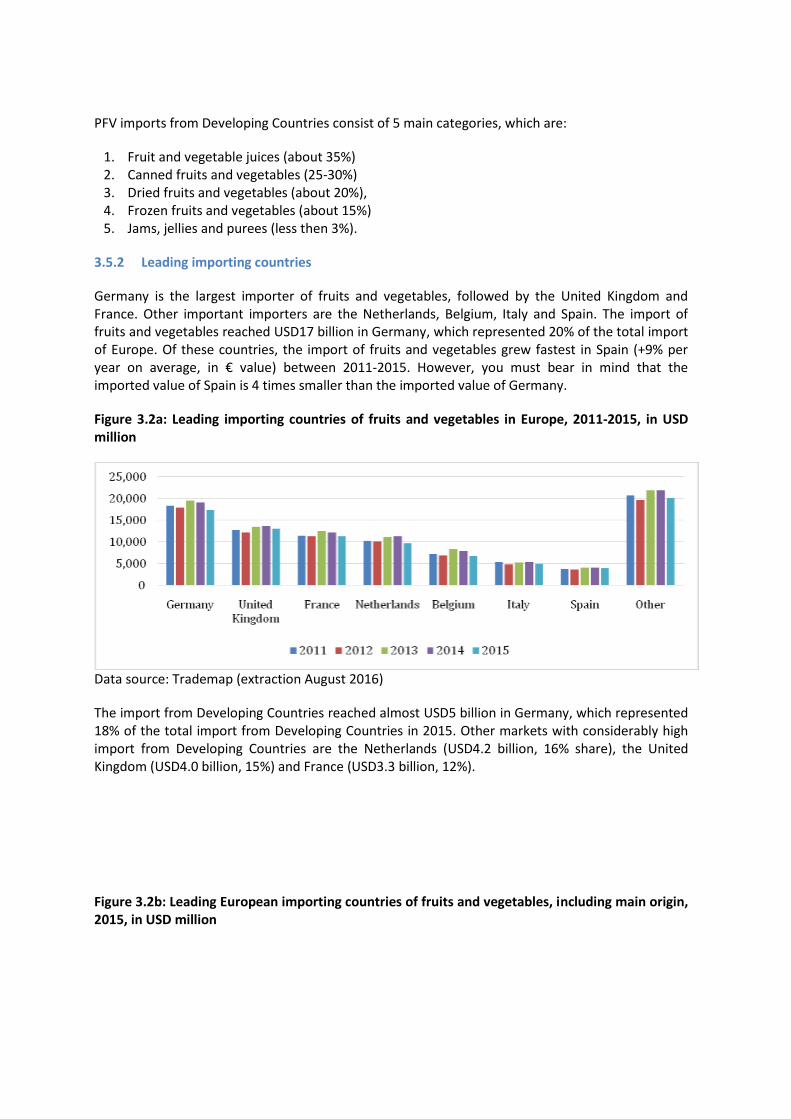
PFV imports from Developing Countries consist of 5 main categories, which are:
1. Fruit and vegetable juices (about 35%) 2. Canned fruits and vegetables (25-30%) 3. Dried fruits and vegetables (about 20%), 4. Frozen fruits and vegetables (about 15%) 5. Jams, jellies and purees (less then 3%).
3.5.2 Leading importing countries
Germany is the largest importer of fruits and vegetables, followed by the United Kingdom and France. Other important importers are the Netherlands, Belgium, Italy and Spain. The import of fruits and vegetables reached USD17 billion in Germany, which represented 20% of the total import of Europe. Of these countries, the import of fruits and vegetables grew fastest in Spain (+9% per year on average, in € value) between 2011-2015. However, you must bear in mind that the imported value of Spain is 4 times smaller than the imported value of Germany.
Figure 3.2a: Leading importing countries of fruits and vegetables in Europe, 2011-2015, in USD million
Data source: Trademap (extraction August 2016)
The import from Developing Countries reached almost USD5 billion in Germany, which represented 18% of the total import from Developing Countries in 2015. Other markets with considerably high import from Developing Countries are the Netherlands (USD4.2 billion, 16% share), the United Kingdom (USD4.0 billion, 15%) and France (USD3.3 billion, 12%).
Figure 3.2b: Leading European importing countries of fruits and vegetables, including main origin, 2015, in USD million

Data source: Trademap (extraction August 2016)
Figure 3.2b clearly shows that the Netherlands imports a lot from outside Europe and in particular from Developing Countries. To a lesser extent this also goes for Belgium. Both countries are important entry ports (especially through the harbors of Rotterdam and Antwerp) and trade hubs for fruit and vegetables from outside Europe.
3.5.3 Leading suppliers
Fruits and vegetables import originate mainly from other European countries. Spain is the leading supplier of fruits and vegetables in the European market. Spain represented 16% of the total European import value in 2015, followed by the Netherlands (11% share), Italy (7%), Germany (6%), and Belgium (5%). More details can be seen in Figure 3.3.
Figure 3.3: Leading suppliers of fruits and vegetables to Europe, 2015, in USD million, including trend 2011-2015 and 7 leading export products per supplier (including HS 4-digit code and share of suppliers exports)
Country 2015 Trend '11-'15 Product 1 Product 2 Product 3 Product 4 Product 5 Product 6 Product 7
Spain 14,823
Citrus fruits 0805 21% Sweet peppers and courgettes, 13%
Straw- and raspberries 0810 8%
Apricots, cherries and peaches 0809 8% Tomatoes 0702 8% Lettuce 0705 4% Melons 0807 4%
Netherlands 10,756
Tomatoes 0702 11% Sweet peppers and mushrooms 11%
Vegetables preserved 2004/2005 16% Fruit juices 2009 9%
Straw- and raspberries 0810 4%
Apples and pears 0808 4% Citrus fruits 0805 4%
Italy 5,955
Tomatoes preserved otherwise 2002 17% Apples and pears 0808 12% Vegetables 0709 7% Fruit juices 2009 6%
Vegetables preserved 2005 6%
Straw- and raspberries 0810 6%
Apricots, cherries and peaches 0809 5%
Germany 5,787
Fruit juices 2009 14% Fruits, nuts preserved 2008 13% Citrus fruits 0805 6% Vegetables 0709 5%
Vegetables preserved 2005 5% Potatoes 0701 5% Bananas 0803 4%
Belgium 5,246
Cooked, frozen and preserved potatoes 25% Vegetables frozen 18% Fruit juices 2009 11%
Straw- and raspberries 0810 6%
Apples and pears 0808 5% Bananas 0803 5% Tomatoes 0702 4%
France 4,279
Potatoes 0701 11% Sweet corn, and vegetables mix, preserved 2005 16%
Apples and pears 0808 10% Vegetables, frozen 6%
Fruits or nuts preserved 2008 5% Tomatoes 0702 5%
Jams, purees, marmalades 2007 4%
Turkey 3,403
Nuts and seeds 2008 38% Grapes 0806 13% Citrus fruits 0805 6% Dried apricots and prunes 0813 5% Dates and figs 0804 5%
Jams and fruit jellies 2007 4%
Apricots, cherries and peaches 0809 4%
Brazil 2,970
Fruit juices 2009 69% Melons 0807 11% Dates and figs 0804 10% Citrus fruits 0805 4% Grapes 0806 3% Apples and pears 0808 1%
Poland 2,454
Rasp- and straw-berries, frozen 18% Fruit juices 2009 16% Mushrooms 0709 14%
Vegetables frozen 0710 9%
Apples and pears 0808 6%
Strawberries and raspberries 0810 5%
Fruits or nuts, preserved 2008 4%
South Africa 2,032
Citrus fruits 0805 34% Grapes 0806 28% Apples and pears 0808 13% Dates and figs 0804 7%
Apricots, cherries and peaches 0809 5%
Straw- and raspberries 0810 3%
Fruits or nuts, preserved 2008 3%
Costa Rica 1,880
Bananas 0803 46% Dates and figs 0804 35% Fruit juices 2009 8% Melons 0807 5% Fruits or nuts, preserved 2008 3%
Roots and tubers of manioc 0714 2% Fruit, frozen 1%
Morocco 1,879
Tomatoes 0702 30% Beans 0708 15% Sweet peppers and courgettes 0709 12% Citrus fruits 0805 10%
Straw- and raspberries 0810 9% Melons 0807 5% Fruit, frozen 5%
China 1,555
Tomatoes pre-served/pared 13%
Asparagus pre-served/pared 13%
Kidney beans dried and shelled 13%
Dried vegetables, single or blend 11% Dried fruit 8% Garlic 8% Grapefruit 7%
Peru 1,466
Dates and figs 0804 32% Grapes 0806 15% Asparagus and artichokes, prepared 0709 13%
Vegetables preserved 2005 13% Bananas 0803 7%
Straw- and raspberries 0810 5% Citrus fruits 0805 5%
Colombia 1,434
Bananas 0803 91% Straw- and raspberries 0810 5% Dates and figs 0804 2%
Fruits or nuts, preserved 2008 1%
Chile 1,431
Grapes 0806 24% Straw- and raspberries 0810 18%
Apples and pears 0808 17% Dates and figs 0804 10%
Dried apricots and prunes 0813 9%
Apricots, cherries and peaches 0809 5% Fruit, frozen 0811 4%
Ecuador 1,357
Bananas 0803 86% Fruit juices 2009 4%
Palm hearts, and edible parts of plants prepared 2008 4%
Vegetables frozen 0710 2% Dates and figs 0804 2% Melons 0807 1%
Greece 1,271
Olives and vegetables prepared 2005 17%
Peaches and nectarines, prepared 16% Grapes 0806 13% Citrus fruits 0805 9%
Apricots, cherries and peaches 0809 7%
Other vegetables 0709 6%
Straw- and raspberries 0810 6%
United States of America
1,191
Cranberries, pre-served, and peanut butter 20%
Kidney beans and lentils 0713 16%
Roots and tubers of manioc 0714 10% Fruit juices 2009 10% Grapes 0806 9%
Dried apricots and prunes 0813 8%
Tomatoes preserved 2002 7%

Country 2015 Trend '11-'15 Product 1 Product 2 Product 3 Product 4 Product 5 Product 6 Product 7
United Kingdom
1,073
Potatoes in thin slices, cooked in fat and beans, prepared 13%
Nuts and seeds, prepared 2008 11% Fruit juices 2009 11% Potatoes 0701 8%
Vegetables preserved otherwise 2004 6%
Jams and fruit jellies 2007 5%
Vegetables frozen 0710 5%

Figure 3.3 shows that imports from outside Europe are dominated by Turkey, USA, Brazil, South Africa, Morocco, China and a range of South and Central American countries.
3.6 Distribution channels
Figure 3.4 shows the distribution chain of FFV and PFV. The green colored lines and boxes stand for the distribution of FFV, whilst the dark blue colored lines and boxes stand for the distribution of PFV. The light blue colored boxes indicate that the intermediate link is part in both the distribution of FFV and PVF.
Figure 3.4: Distribution chain of FFV and PFV
Data source: Globally Cool (2016)
3.6.1 FFV (green arrows)
There are two options to enter the European market for FFV. Vietnamese exporters can:
1. Export to an importer/wholesaler who will further distribute the products. This is the most common entry strategy for Vietnamese FFV. Generally, there are two categories, a) large importers dealing with commodities, and b) small importers that mostly focus on niche markets such as exotic fruit.
2. Trade directly with the food retail segment in Europe,particularly supermarkets but also specialised food retailers. The supermarkets dominate the FFV market in Europe, representing between 60-90% of the market (balance left for specialized stores, street markets and food service). Therefore this is an interesting channel to focus on, however, supermarkets have very strict quality requirements. Therefore, for many exporters the best option is to supplying to importerswhoin turn sell to supermarkets.

3.6.2 Processed fruit and vegetables (blue arrows)
There are several entry options for Vietnamese PFV in the European market. Vietnamese exporters can target:
1. Importers/wholesalers. See 3.6.1, but note that the EU companies dealing with PFV might be different from the EU companies dealing with FFV (sometimes they can be the same, like AsiaExpressFood from the Netherlands).
2. Food manufacturers who uses PFV as ingredients. This is a relatively large segment and mainly involves PFV in relatively large packages. Examples are frozen fruit, cooked fruit, fruit juice concentrates and fruit preparations.
3. Packing, canning and/or bottling companies. These companies prefer to buy PFV in bulk from exporters, for example IQF (individually quick frozen) PFV, or fruit paste in. They repack the PFV, with or without processing, and sell their products to the food retail and food service channel (but in several cases also to food manufacturers producing jam, fruit-juice and bakery products).
4. Direct sales to food retailers, which includes supermarkets, specialised food retailers and the food service channel. For food retailers, see 3.6.1. For the food service channel, the most commonly traded PFV are canned fruits (pineapple in particular, but also some others).
3.7 EU market competitiveness analysis for fruits and vegetables
3.7.1 Competitive rivalry
While Section 3.5.3 offers details of all suppliers that fight for a share of the EU market, Figure 3.5 shows an overview of the main supplying countries from Asia alone. It shows that the imports from Asia are dominated by China. Number two is Israel, followed by India, Thailand, Philippines and Vietnam.
Of these countries, Philippines and Vietnam showed the highest annual growth between 2011 and 2015 (6.2% and 5.7% per year respectively), while China and India showed declines (both -9%). While Chinese and Indian exports to Europe are quite diversified with several fruits and vegetables both prepared/preserved and fresh, Vietnamese exports cover basically exotic fruits in several forms (fresh, juice and frozen).
The export profiles of most other countries show a quite diversified range of export products:
Israel: several fruits and vegetables (fresh),
Thailand: Pineapple juice and preserved pineapples dominate exports, at large distance followed by preserved exotic fruits, and preserved sweetcorn.
Philippines: focus on pineapple preserved/juice.
Indonesia: mostly preserved pineapple and desiccated coconuts. Also some juice products.
Iran: focus on dried fruit (several types), and some fresh fruit.
Pakistan: Mostly mangoes (or guavas/mangosteen), dates, and few other PFV.
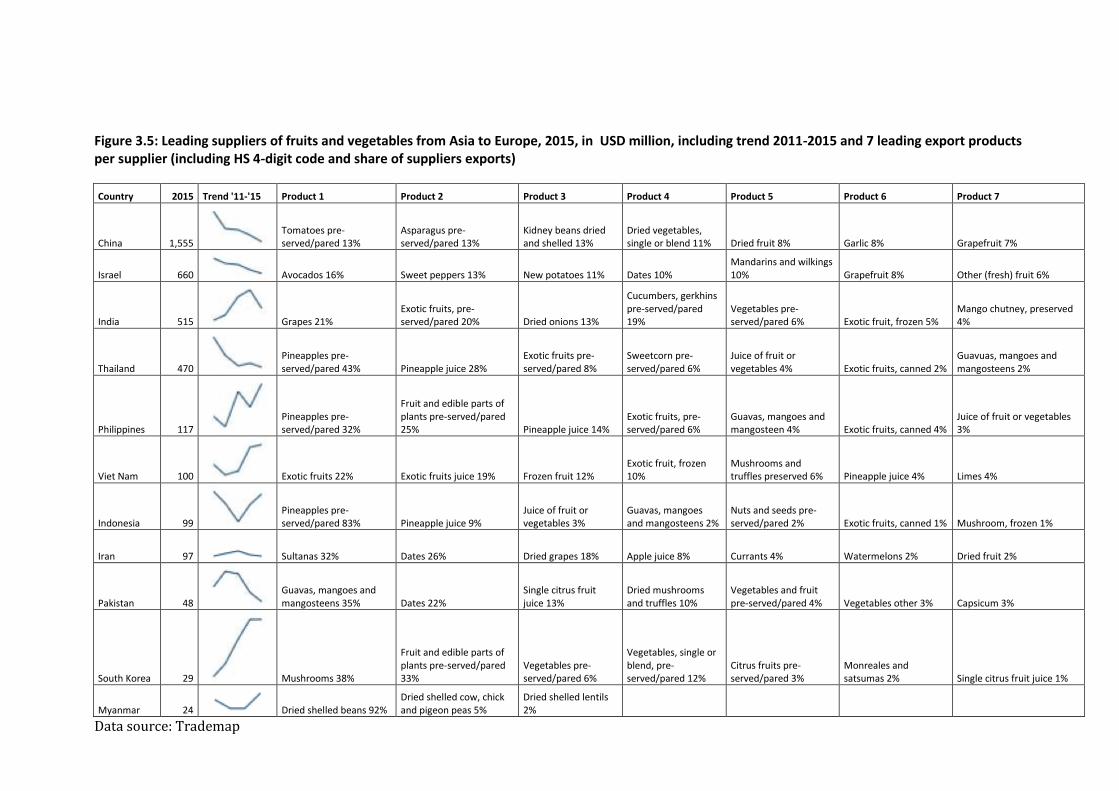
Figure 3.5: Leading suppliers of fruits and vegetables from Asia to Europe, 2015, in USD million, including trend 2011-2015 and 7 leading export products per supplier (including HS 4-digit code and share of suppliers exports)
Country 2015 Trend '11-'15 Product 1 Product 2 Product 3 Product 4 Product 5 Product 6 Product 7
China 1,555
Tomatoes pre-served/pared 13%
Asparagus pre-served/pared 13%
Kidney beans dried and shelled 13%
Dried vegetables, single or blend 11% Dried fruit 8% Garlic 8% Grapefruit 7%
Israel 660
Avocados 16% Sweet peppers 13% New potatoes 11% Dates 10% Mandarins and wilkings 10% Grapefruit 8% Other (fresh) fruit 6%
India 515
Grapes 21% Exotic fruits, pre-served/pared 20% Dried onions 13%
Cucumbers, gerkhins pre-served/pared 19%
Vegetables pre-served/pared 6% Exotic fruit, frozen 5%
Mango chutney, preserved 4%
Thailand 470
Pineapples pre-served/pared 43% Pineapple juice 28%
Exotic fruits pre-served/pared 8%
Sweetcorn pre-served/pared 6%
Juice of fruit or vegetables 4% Exotic fruits, canned 2%
Guavuas, mangoes and mangosteens 2%
Philippines 117
Pineapples pre-served/pared 32%
Fruit and edible parts of plants pre-served/pared 25% Pineapple juice 14%
Exotic fruits, pre-served/pared 6%
Guavas, mangoes and mangosteen 4% Exotic fruits, canned 4%
Juice of fruit or vegetables 3%
Viet Nam 100
Exotic fruits 22% Exotic fruits juice 19% Frozen fruit 12% Exotic fruit, frozen 10%
Mushrooms and truffles preserved 6% Pineapple juice 4% Limes 4%
Indonesia 99
Pineapples pre-served/pared 83% Pineapple juice 9%
Juice of fruit or vegetables 3%
Guavas, mangoes and mangosteens 2%
Nuts and seeds pre-served/pared 2% Exotic fruits, canned 1% Mushroom, frozen 1%
Iran 97
Sultanas 32% Dates 26% Dried grapes 18% Apple juice 8% Currants 4% Watermelons 2% Dried fruit 2%
Pakistan 48
Guavas, mangoes and mangosteens 35% Dates 22%
Single citrus fruit juice 13%
Dried mushrooms and truffles 10%
Vegetables and fruit pre-served/pared 4% Vegetables other 3% Capsicum 3%
South Korea 29
Mushrooms 38%
Fruit and edible parts of plants pre-served/pared 33%
Vegetables pre-served/pared 6%
Vegetables, single or blend, pre-served/pared 12%
Citrus fruits pre-served/pared 3%
Monreales and satsumas 2% Single citrus fruit juice 1%
Myanmar 24
Dried shelled beans 92% Dried shelled cow, chick and pigeon peas 5%
Dried shelled lentils 2%
Data source: Trademap

3.7.2 Vietnam’s competitive possibility
Vietnam’s competitive possibilities in Europe should be found in a combination of:
1. The current export product range of Vietnam, based on the range of Figure 5 but also based on Chapter II.3 on Vietnamese exports,
2. Abundantly available fruits and vegetables in Vietnam of relatively high quality (see “Production”).
3. Products that fit in the current European market trends, which are described in 3.1.2: a. Increasing demand for healthy fruits and vegetables b. Consumers want convenience c. Diversification of products and flavours d. Preference for sustainable supply chains
In theory, in the short to medium term these conditions offer good opportunities for the following fruits and vegetables from Vietnam:
1) Relatively unknown exotic fruits (in the EU) so far: dragon fruit, rambutan, longan. Selling these products to Europe is only possible with a buyer who is willing to spend time and energy in promoting these fruits among customers and, indirectly, consumers.
2) Relatively known exotic fruits: mango, lychee, papaya. Mango and lychee are already present in the European market for many years. For mango there are several suppliers to the European market, coming from West Africa, South America, and Asia. Competition can be strong, depending on the season, but also on the variety. In this respect, very sweet mangos from Asia could offer good opportunities. For lychee, there is one supplier dominating the European market: Madagascar. Papaya mainly comes from Brazil.
3) Processed fruit and vegetables, also including: fruit and vegetable chips, dried fruit, exotic fruit puree, IQF exotic fruit mixes etc.
4) Sustainably produced products, including organic and fair-trade produce.
In addition, there can be also small opportunities for supplying other fresh produce, such as exotic herbs, to Europe. Basically, Vietnam can develop in a competitive supplier to the European market, if Vietnamese suppliers manage to provide good quality fruit and vegetables at good prices, coupled with:
meeting the buyers’ basic product requirements.
on-time deliveries;
full traceability of the supply chain.
As sea transport is less expensive and more environmentally friendly, technological developments in sea transport (covering storage, conditioned containers and ripening) should be followed carefully by the Vietnamese FFV industry. If the commonly used airfreight of Vietnamese (and other Asian) fruit can be replaced by sea freight, freight costs can be reduced considerably, making Vietnamese fruit more competitive in the European market.
Last but not least: in the medium to long term, if Vietnamese PFV producers manage to reach strict compliance with the EU’s food safety regulations, there can be good opportunities for Vietnamese PFV in Europe.

4 EU Market access requirements
4.1 Import duties
The EU tax system applied on products circulated in the EU members is classified into 3 main dimensions: import duties, value added tax (VAT) and commodity tax.
VAT and commodity tax are applied following specific regulations of each member state. For commodity imported from the outside, import tariffs are applied similarly among all EU member markets. The tariffs are different among different product categories. Vietnamese fruit & vegetables exported to the EU benefit from the GSP treatment. Specific tariffs for products can be found in the EU Export Helpdesk.
4.2 Compulsory requirements
When exporting to the EU, exporters must comply with some compulsory requirements. EU compulsory requirements include and relate to SPS, contamination, food contents, packaging, labelling etc.
4.2.1 SPS
SPS is central in the European Food Law. This law is considered as the essential legal framework for the food safety issue in the market. To ensure SPS and allow the implementation of appropriate actions in cases of unsafe food incurred, all food products must be traceable along the supply chain and all risks of contamination have to be limited. An important aspect to control hazards to SPS is to define Hazard Analysis and Critical Control Points (HACCP) through realizing principles of food management. Another important dimension is that food & foodstuff must comply with regulations on official control. Any products considered unsafe shall be rejected from imported into the EU.
4.2.2 MRLs for pesticides
EU regulates the maximum residue limits (MRLs) for pesticides used in and on food and foodstuff products. For fruit & vegetables in particular, the strict compliance with the required MRLs and prevention of contamination are prerequisite conditions for the penetration into the market. Products containing prohibited or above-MRL pesticides will be rejected from importing in the EU. Vietnamese companies should be reminded that consumers in some EU member states require even stricter MRLs than the general regulations of the EU market. Most of supermarkets have their own standards of pesticide limits, which are normally stricter than the general legislation. Enterprises thus should check with their customers on their requirements applicable to the exported fresh fruit & vegetables. To get detailed information about MRLs applied to your products, you could search for the EU database on MRLs. When you could choose name of the product and pesticides permitted to use, the database will show a list of MRLs relating to such product and pesticides.
For further information, please to go to the Plant Health website of the EU.
To reduce the amount of pesticides, enterprises could apply the integrated pest management (IPM). IPM is the strategy to control pest hazards in agriculture by using natural control practices like the penetration of natural rival species against the harmful pest. As an additional method, enterprises should manage the chemical spray. The fewer chemicals you spray, the more prestige your products could obtain in the market. Enterprises could also cross check with their customers on any additional requirements on MRLs and use of pesticides.
4.2.3 Control on the imported food and foodstuff in the EU market
To ensure SPS and prevent hazards to the environment, EU restricts the use of certain chemicals (by MRLs), as stipulated in some Regulations and Guidance. Your products have to comply with the requirements on official control. Some of these control activities are conducted to assure that all food and foodstuff imported in the EU must be safe, that means they abide by all requirements on the products. The control will be implemented through 3 different categories:
1. Document examination 2. Label examination 3. Physical examination
In case the EU side detect continuously that specific products originated from a country do not observe the requirements, it will decide to conduct the control at more intense frequency or put these products under the application of emergency measures. The controls will be applied in all steps of importation and marketing in the EU market. However, most of the examination work will be carried out at the arrival point when the products are imported into the market. Besides, in this case, the product could only be imported under much tightened conditions for example it must be accompanied by a health safety certificate and a quality inspection report. The products originated from the countries that are continuously reported violating requirements will be named in the list of Annex I to Regulation (EC) 669/2009.
For importers of fresh fruit & vegetables, traceability is a must. To meet this requirement, EU importers shall request foreign exporters to submit evidence of the product origin.
Enterprises should understand clearly these requirements and procedures of the EU market. The lack of compliance will result in the delay or reduction of orders, causing more expenditure and even more strict control measures by the EU authorities. For fresh fruit & vegetables, enterprises must guarantee that all accompanying documents with the consignment (like bill of lading) must be corresponding to the food & foodstuff products in the consignment and indicate clearly the amount, category and size, number pallets or cases, name of the grower and volumes.
Enterprises can search for information in the database of the Rapid Alert System for Food and Foodstuff (RASFF) to know which products have been withdrawn from the market and why. EU customers usually request exporters to apply the food safety management system based on principles of HACCP. Therefore, all companies should consider applying HACCP system in their daily operation. Enterprises could also consult about control requirements on imported fruit & vegetables to identify the level of control currently enacted to your products. This list is regularly updated.
4.2.4 Plant protection
Various categories of fruit & vegetable exports to the EU must observe the market regulations on plant protection. The rules on phytosanitary aim to prevent the contamination and spread-out of harmful organisms to plants and plant products in the EU market. These regulations also indicate that certain organisms are listed as prohibited from import, except some exceptions and types of plants or plan products listed in Part B, Annex V to the Guidance No. 2000/29/EC, which are required to have phytosanitary certificate.
Enterprises should cross check with their National Plant Protection Office (NPPO) or EU importers on the applicable regulations on their products (see the list of NPPO). If the phytosanitary certificate is required for exports to the EU, enterprises should contact the Plant Protection Agency under MARD
and further consult with the EU importer on the detailed regulation. The form of phytosanitary certificate could be found in Annex VII (page 17) of the Plant Protection Guidance.
4.2.5 Prevention of contamination with diseases
Infected substances are substances that can appear in the different stages of the process of growing, processing, packaging, transport or storage of products. Regulation (EC) No. 1881/2006 defines the maximum limits of certain substances in the food & foodstuff. This regulation is regularly updated. Beside the general limits applicable to all kinds of food & foodstuff, the regulation also stipulates the limit for certain substances in certain products. The most common substances found in processed fruit & vegetables include: Mycotoxins - the transferred toxic derivatives are produced by fungi most commonly known as mold. Fungal infection which is most common in processed fruit and vegetable industry is aflatoxin and ocharatoxin A.
- Aflatoxin: is limited for aflatoxin types B1, B2, G1 and G2 in most of edible nuts and dried fruits and vegetables. Aflatoxinis is the most common infected substances found in edible nuts and dried fruits and vegetables. According to RASFF report, in 2014, there were more than 250 cases of infection detected in dried fruit & vegetables with high aflatoxin content. The number of cases detected and reported most include pistachio (mainly imported from Iran, and also from Turkey and the US), dried pigs (mainly from Turkey), peanuts (mainly from China, and also from Brazil, India and Egypt) and hazelnuts (mostly from Turkey).
- Ochratoxin type A: is usually found in dried vine fruits (Greek grapes, raisins and Sultana grapes) and grape juice (see part 2 of the Annex to Regulation (EC) No. 1881/2006). It is rather difficult to avoid OTA infection as it mostly depends on the weather condition. In 2014, there were 15 alerts relating to high Ochratoxin content detected in raisins and dried pigs.
- Patulin is usually found in fruit & vegetable mold, especially rot apples and pigs. For other fruit juices, the applicable limit ranges from 10 to 50μg/kg (see part 2 of the Annex to Regulation (EC) No. 1881/2006).
Heavy metals: Maximum levels of lead (for fruit, fruit juice and vegetables), cadmium (for fruit & vegetables), and tin (for canned food & foodstuff and beverage) (see Annex 3 to Regulation (EC) No. 1881/2006). For processed fruit & vegetables, high content of lead and cadmium is often found in frozen fruit & vegetables or in dyes used for packaging material made of glass. High content of tin is usually found in canned fruit & vegetables due to the decomposition of tin or tin coating. Viruses – the most common contamination for processed fruit & vegetables is salmonella and viruses (like norovirus and Hepatitis A). According to the EU legislation, salmonella species are the major source causing contamination for unsterilized fruit & vegetable juices. These viruses could be found in other types of processed fruit & vegetables. For examples, in 2014, there were 8 warnings of salmonella contamination for dried mushroom, raisins, algae powder, frozen banana leaves, pine nuts and desiccated coconut. Norovirus and virus Hepatitis A are also detected in frozen fruit & vegetables. In September 2012, norovirus strongly attacked as many as 11,000 people in Germany. The event was related to a consignment of frozen strawberries imported from China. As a result, Regulation (EC) No. 669/2009 was amended, covering frozen strawberries from China. Pesticides: EU has established MRLs of pesticides in and on plant products. Any products which are detected over MRLs of pesticides shall be withdrawn from the EU market. Foreign substances: Infection by foreign substances (e.g. from items in glass and plastic, and insects)
also poses a hazard that could incur without the abidance by safe process of food & foodstuff production. Nitrates: the specific maximum level of 2,000 mg NO-3/kg has been applied to frozen spinach (see part 1 of the Annex to Regulation (EC) No. 1881/2006). Enterprises should fully understand the right processes of growing, drying, processing and storing, and get agreement with their suppliers. For example, they could refer to Codex to have information to prevent and reduce toxic mold contaminant in types of nuts, peanuts and dried figs or search for FAO guidance to prevent mold development in pistachio. For information about safe storing and transport of fruit & vegetables, they could go to Transport Information Service. Irradiation is a useful method to deal with virus infection, but as provided by the EU legislation, it cannot be applied to edible processed fruit & vegetables and nuts. Enterprises could also request for the support of experts to have helpful advice on how to apply HACCP system in their daily practices. You have to strictly control the traceability of various kinds of raw materials and support the grower to implement good agricultural practices, with the view to prevent the virus contamination in the final products. Furthermore, enterprises should also observe new trends of SPS. Strengthened quarantine measures which could be conducted quickly, on-spot, automatically and computerized, would can provide invaluable support to the production process.
4.2.6 Product Ingredients
The product can be rejected by the buyer or EU customs authorities in case there is no declaration of foreign substances or declaration of prohibited foreign substances or their content exceeds permitted maximum limits. EU also promulgated detailed legislation on food additives (like coloring, thickener) and favor, which lists the electronic codes and additives to be used in food & foodstuff. In case you would like to add additional vitamin to your product ingredients, you should know what kind of vitamin it is (Annex I) and its sources, as well as permitted vitamin and minerals formulas (Annex II). Specific legal requirements on the product ingredients are applicable to fruit juice and fruit jams, marmalade, and sweet chestnut jam. The guidance indicates permitted types of materials and food additives. As concerned to processed fruit & vegetables, enterprises usually encounter trouble because they do not fulfil the customs declaration or preservative content exceeds the permitted level. The most rampant violating cases detected include the use of sulfur as a preservative in dried coconut and fruit, or use of axis benzoic in some pickled vegetables. Another problem in which there is no declaration of coloring or the content exceeds the permitted limits also happens quite often. Typical example is manifested by the use of E110 (Sunset yellow) in canned dried fruit and E102 (Yellow 5) in spices, spreadable jams, pickles and soft drinks. The electronic codes are recognized by the EU. To get the code, the food additive must be assessed to be safe by EU competent authorities of food safety (electronic code acknowledged by the EU. To apply for the electronic code, the food additives must be assessed as safe by competent authorities responsible for food safety in the EU (EFCH). See further information about electronic codes in the Annex to Regulation 1333/2008.
4.2.7 Labelling
EU legislation has identified standards for the common market and for all fresh fruit & vegetables at minimum level of quality and ripeness. There are no specific market standards (SMS) for fresh fruit & vegetable but general market standards (GMS) to be observed. There are EU specific standards of marketing for the following fresh fruit & vegetables: apples, citrus fruit, kiwi, lettuce, peaches & nectarine, pineapples, strawberries, bell pepper, grapes and tomatoes. These products must be imported with the certificate of conformity attached to each consignment. This requirement of marketing standards does not apply to the imported consignments of the products for the processing purpose. However, the phrase “intended for processing” should be printed on the packaging or any phrases with the similar meaning. Food and foodstuff penetrated the EU market must meet all legal requirements on labelling. Carton boxes to contain fresh fruit are required to have such following information printed on:
- Name and address of packaging and deliver agents - Nam of the product (if it is not visible from the outside of the product packaging) - Country of origin - Classification and sizes (in accordance with the marketing standards)
In case Vietnamese enterprises supply consumer products for labelling (like products to be packaged in containers, bottles or boxes), the company has to pay attention to the labelling regulations in Directive No.2000/13/EC. The labels must provide consumers information about the product components, producer and reservation and preliminary processing method. Besides, there are requirements on fruit juices and jams, extracts from fruit & sweet chestnut jam, to ensure the provision of full necessary information to consumers. For the quick-frozen foods, there are specific regulations in labelling and quality.
4.2.7.1 Statement about nutrition and healthful substances
The statements on the package is to affirm and show the health features of the food. The information provided must not be misleading. Therefore, only statements about nutrition and healthful substances recognized by the EU are permitted to be published on the food. In case of statements, they must be prior recognized by European Food Safety Authority (EFSA).
4.2.7.2 Allergens
The pre-packaged products containing allergens (for example nuts) must be labelledas to provide full and clear information to help consumers be aware that the product contains some allergens. In December 2014, Regulation (EU) No. 1169/2011 took effect. This new legislation on labelling has created significant changes as compared with the previous one. The most important change made is the presentation of food products, in which EU prohibits misleading the consumer which pertaining to any food that aims at disease prevention or cure for human. Another change relating to allergy labelling provides that all allergens must be highlighted in the list of food components. Relevant regulations on information provision of allergens are also applicable to non-pre-packaged food products, including those sold at restaurants and cafes. Information provision about the nutrition is compulsory as well to all food products. Enterprises could refer to the information of legal documents guiding the practical labeling for food & foodstuff newly issued by Food and Drink Industry Ireland (FDII).

Annex IIIa of Directive No. 2000/13/EC provides a full list of allergens. Enterprises should notice that the appearance of allergens has become more and more important, and the possibility of cross contamination (like when a product is processed at the plant that also produced peanuts) already an the farm should be taken into account seriously.
4.2.8 Packaging
Packaging material used for consumption of food (like plastic containers, bottles) shall comply with specific health control regulations control to the materials in contact with food. The packaging material must be produced to ensure that it cannot change substances in food composition at certain volume, which can be hazard to human health, or change the food composition in unacceptable manner or ruin the taste of food. EU legislation on materials in contact with foodstuffs is rather broad and not easy to prove to EU importers that your product complies with all the provisions. Therefore, EU food importers always request for documents about toxic substances and risk assessment of chemicals from materials in contact with food and / or regulatory compliance statement. Enterprises should also notice that there is no specific legislation on packaging applicable to all products circulated in the EU market.
4.3 Requirement for certification and quality
4.3.1 Certification
The need for certified products has been ever increasing, particularly in Northern Europe, as a way to uphold the requirement on the product quality. The most common certification for fresh fruit and vegetables is GlobalGAP. Most of EU buyers require products with GlobalGAP certification. GlobalGAPcovers assurance of product quality and safety, and also that the product meets environmental and social standards. For processed fruit and vegetables, products must be produced following HACCP food safety principles (Hazard analysis and critical control points). Moreover, many EU clients also require some management system standards, such as BRC (British Retail Consortium), IFS, SQF, or ISO22000. Global Food Safety Initiative (GFSI) has recognized all the above management systems. That means big retailers accept these certificates.
4.3.2 Quality standards
EU quality standards are developed based on the standards of the Economic Commission for Europe (UNECE) and Codex Alimentarius. Quality standards always pertain to 2 issues: food safety and food quality. Actually, food safety covers food quality. The latter, from the consumer’s perspective, usually includes the specific characteristics of the food, both inside and outside. Meanwhile, from importers’ view, they are technical specifications. In the EU, Regulation (EC) 2200/96 of the European Commission stipulates quality standards for fruit & vegetables. The legislation has set up general structure of fresh fruit & vegetable market. The requirement of these standards mainly focuses on quality classification and information labelling for products. The standards are not applied to processed fruit & vegetables. On January 6 20067, European Council promulgated Regulation (EC) 1182/2007, which provides specific requirements in the sector of fruit &vegetables, amending Directive 2001/112/EC on various kinds of fruit juices and some similar products for human consumption, Directive 2001/113/EC on
fruit jams for human consumption and Regulation (EC) 827/68 on general structure of certain markets, Reguation (EC) 2200/96 on general structure of fruit & vegetable market, Regulation (EC) 2201/96 on genera structure of processed fruit & vegetable market. Regulation (EC) 1182/2007 was put in effect since January 1 2008. Beside general standards, there are separate standards for specific fruit & vegetables. In case the product is not listed in the EU quality standards, UNECE standards will be applicable.
4.4 Requirements of some niche markets
4.4.1 Social responsibility
Corporate social responsibility (CSR) and sustainable development are of particular interest in the EU market, but so far most of brandnames encounter challenges in satisfying these requirements due to the complication in realization. Multi-national corporates are pioneers in complying CSR, which will hopefully be followed by smaller companies. Nevertheless, there are some exceptions in which some small companies belonging to the niche market of organic products require their suppliers to abide CSR requirements. In the coming years, CSR will become an prominent issue. EU importers (especially big companies in Westerns and Northern Europe) will be more and more interested in the responsibility of their partners in social an environmental issues. General requirement is the signing of code of conduct, in which enterprises commit to perform their business activities responsibly, observing the labor code, protect the natural environment, not perform the act of bribery etc. Furthermore, importers could join some organization like ETI (Ethical Trading Initiative) in the UK or Business Social Compliance Initiative. These organizations focus on promoting social conditions in their members’ supply chains. As a result, exporting companies, acting as the the supplier, are required to comply wth the principles of these organizations. There are also sub-sector specific initiatives. For example, the Fruit Juice CSR Platform was established in 2013 as an initiative of sustainable development for the fruit juice industry. The main objective is to assure that all fruit juice products meet the standards of social responsibility. This platform is now spreading its influence to the raw material sources in developing countries. The European Fruit Juice Association has started with orange juice from Brazil, as Brazil is the world’s leading supplier of orange juice. Experts hope that this initiative will be extended to apple juice products. For the enterprises that aim at the EU in the long run, CSR compliance is inevitable. You should negotiate with your partners on your roadmap to apply CSR. With the view to catch up with the new evolution, enterprises should begin to learn about CSR, basic standards and certification systems, such as ISO, Rainforest Alliance et cetera.
4.4.2 Organic certification
To be capable of supplying organic products to Europe, producers are required to use organic production methods in compliance with the EU legislation. Obtaining the organic certification means the products are not allowed to use agricultural chemicals (such as fertilizers and pesticides). Organic certificate is issued by an organization recognized by Regulation (EC) No. 834/2007. In addition, the methods have to be applied at least 2 years before the marketing. It is also necessary

to apply for import certification by EU control bodies of organic products. Upon the certification, exporters can use EU organic food label on their products, as well as other standards labels depending on specific importing countries. However, due to the fairly high cost, exporters should assess the potential of the target market carefully. Use, for example, Standardsmap.
4.4.3 Fairtrade certification
Fairtrade certificate is a system established to ensure that a fair price is paid to producers. The certificate is issued by FLOcert based on Fairtrade criteria. Upon the certification by an independent third party, enterprises can print the Fairtrade logo on their products.
5 Conclusions - opportunities for Vietnamese exporters in the EU
5.1 Identifying the gap with the demands of the EU market
5.1.1 Certification
Fruits and vegetables require certification in one form or another, whether it be GLOBALGAP, organic, fair trade, HACCP, or others such as BRC and IFS. The VIETGAP, although it is aiming to be benchmarked with GLOBALGAP, currently it is not equivalent to GLOBALGAP and therefore not meeting the requirements of many European buyers. This problem must be solved in the short term.
Meeting certification costs is one barrier but also building the technical know-how to pass certification is another. The Vietnamese government needs to invest heavily in improving production standards and processes. At the same time, initial funding for certification may be required, though in the medium to long term the producers should finance this in order to become sustainable industries.
Certification is particularly important for fresh products, but should not be underestimated for processed products as well.
5.1.2 Awareness
An important focus needs to be on improving awareness and disseminating knowledge of the EU-Vietnam Free Trade Agreement amongst the business community, since this is considered as relatively weak. It would also be important to inform the business community on the EU market, and provide market intelligence. This is the role of Vietrade and sector associations, like there is one sector association for cashew nuts.
5.1.3 Sustainable supply chain
As mentioned in 3.1.2.4, consumers are becoming more concerned about transparency on how their fruit and vegetables are produced. CSR is increasingly paid attention to in the EU and should be developed at a sector level and seen as a blueprint for enterprises to follow. It could also be the subject of accreditation rather than being loosely regulated. It means thatall companies in the supply chain will have to implement environmental efforts and social responsible practices.
Together with sector associations, Vietrade should work on a CSR strategy for the fruit and vegetables and processing sector. Probably in combination with other sectors that play a large role in the Vietnamese agricultural sector, such as coffee and tea production. A lot of efforts should be paid to develop organic methods to fight diseases and get rid of bugs. For example, some young Vietnamese entrepreneurs are experimenting with organic methods to get rid of bugs (use of garlic and pepper extract, developed by a Japanese professor), but this does not work as required yet. There are some small initiatives across the country in terms of organic farming, but relatively young, very small and in an early stage of development.
5.1.4 Sustainable transport
The EU is also moving towards lower carbon emission imports. This has especially implications for airfreight; while an attractive proposition in the medium term, is not likely to remain sustainable in
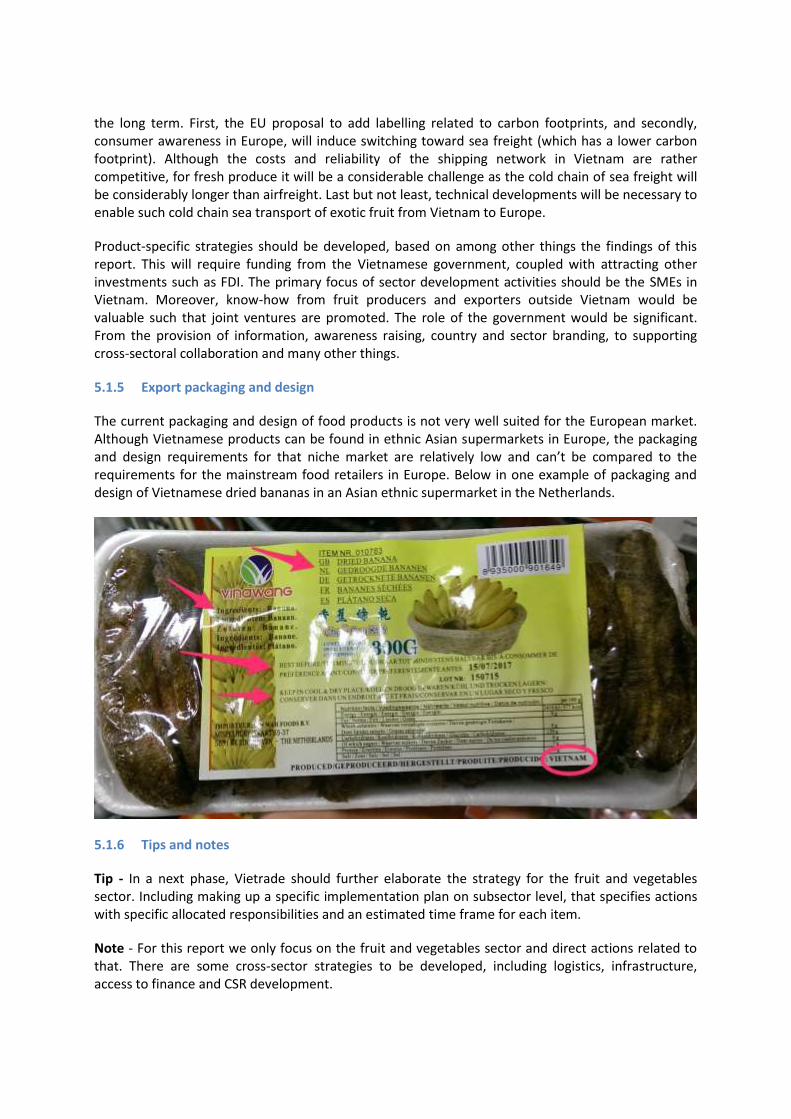
the long term. First, the EU proposal to add labelling related to carbon footprints, and secondly, consumer awareness in Europe, will induce switching toward sea freight (which has a lower carbon footprint). Although the costs and reliability of the shipping network in Vietnam are rather competitive, for fresh produce it will be a considerable challenge as the cold chain of sea freight will be considerably longer than airfreight. Last but not least, technical developments will be necessary to enable such cold chain sea transport of exotic fruit from Vietnam to Europe.
Product-specific strategies should be developed, based on among other things the findings of this report. This will require funding from the Vietnamese government, coupled with attracting other investments such as FDI. The primary focus of sector development activities should be the SMEs in Vietnam. Moreover, know-how from fruit producers and exporters outside Vietnam would be valuable such that joint ventures are promoted. The role of the government would be significant. From the provision of information, awareness raising, country and sector branding, to supporting cross-sectoral collaboration and many other things.
5.1.5 Export packaging and design
The current packaging and design of food products is not very well suited for the European market. Although Vietnamese products can be found in ethnic Asian supermarkets in Europe, the packaging and design requirements for that niche market are relatively low and can’t be compared to the requirements for the mainstream food retailers in Europe. Below in one example of packaging and design of Vietnamese dried bananas in an Asian ethnic supermarket in the Netherlands.
5.1.6 Tips and notes
Tip - In a next phase, Vietrade should further elaborate the strategy for the fruit and vegetables sector. Including making up a specific implementation plan on subsector level, that specifies actions with specific allocated responsibilities and an estimated time frame for each item.
Note - For this report we only focus on the fruit and vegetables sector and direct actions related to that. There are some cross-sector strategies to be developed, including logistics, infrastructure, access to finance and CSR development.
Note - Packed products require bar coding labelling in the European market. It embeds important information such as the product numbers, batch numbers or serial, which improve the efficiency throughout the supply chain. The GS1 is an organization that manages the digital data, which is encoded in the barcodes (also called the Universal Products Numbers). GS1 is available in Vietnam, so this should not be an obstacle to access the food retail channel in Europe.
5.2 Analyzing opportunities for Vietnamese companies to export fruits and vegetables to the EU
The following trends and developments offer opportunities to Vietnamese exports of fruit and vegetables:
Products that fit in the current European market trends, which are described in 3.1.2:
1. Increasing demand for healthy fruits and vegetables 2. Consumers want convenience 3. Diversification of products and flavours 4. Preference for sustainable supply chains
In theory, in the short to medium term these conditions offer opportunities for a wide range of Vietnamese fruits vegetables and processed products, as revealed in Figure 5.1.
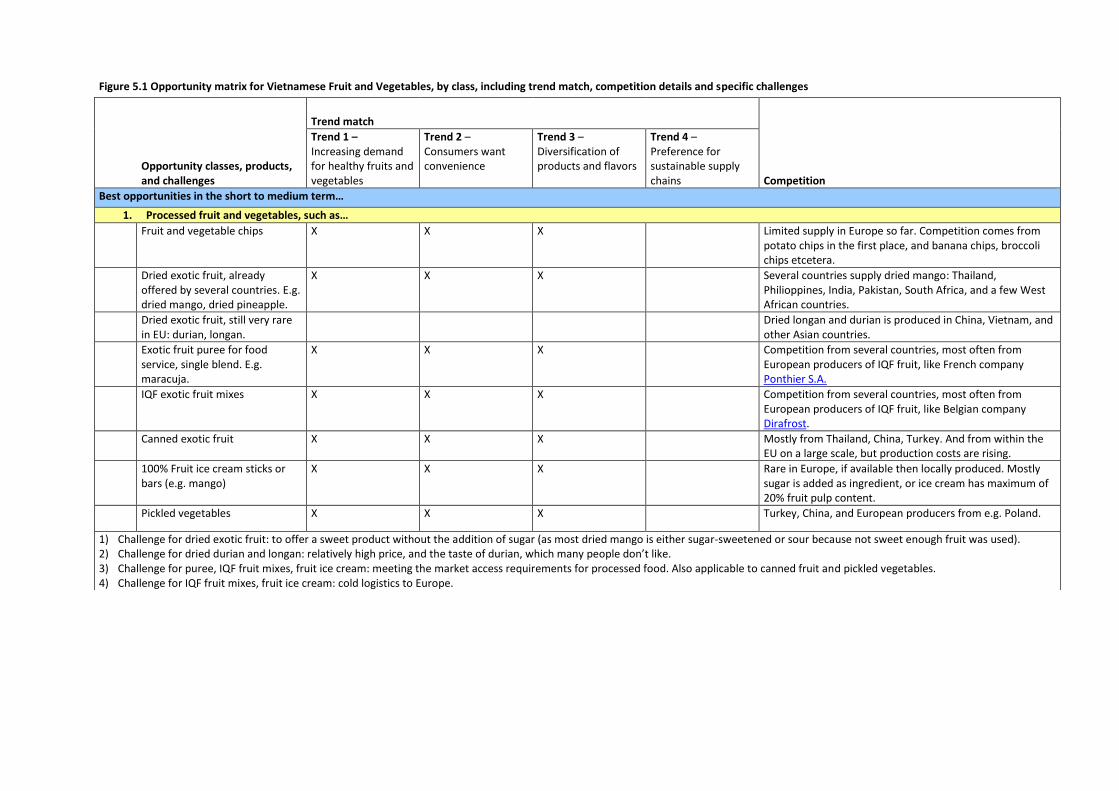
Figure 5.1 Opportunity matrix for Vietnamese Fruit and Vegetables, by class, including trend match, competition details and specific challenges
Trend match
Opportunity classes, products, and challenges
Trend 1 – Increasing demand for healthy fruits and vegetables
Trend 2 – Consumers want convenience
Trend 3 – Diversification of products and flavors
Trend 4 – Preference for sustainable supply chains Competition
Best opportunities in the short to medium term…
1. Processed fruit and vegetables, such as…
Fruit and vegetable chips X X X Limited supply in Europe so far. Competition comes from potato chips in the first place, and banana chips, broccoli chips etcetera.
Dried exotic fruit, already offered by several countries. E.g. dried mango, dried pineapple.
X X X Several countries supply dried mango: Thailand, Philioppines, India, Pakistan, South Africa, and a few West African countries.
Dried exotic fruit, still very rare in EU: durian, longan.
Dried longan and durian is produced in China, Vietnam, and other Asian countries.
Exotic fruit puree for food service, single blend. E.g. maracuja.
X X X Competition from several countries, most often from European producers of IQF fruit, like French company Ponthier S.A.
IQF exotic fruit mixes X X X Competition from several countries, most often from European producers of IQF fruit, like Belgian company Dirafrost.
Canned exotic fruit X X X Mostly from Thailand, China, Turkey. And from within the EU on a large scale, but production costs are rising.
100% Fruit ice cream sticks or bars (e.g. mango)
X X X Rare in Europe, if available then locally produced. Mostly sugar is added as ingredient, or ice cream has maximum of 20% fruit pulp content.
Pickled vegetables X X X Turkey, China, and European producers from e.g. Poland.
1) Challenge for dried exotic fruit: to offer a sweet product without the addition of sugar (as most dried mango is either sugar-sweetened or sour because not sweet enough fruit was used). 2) Challenge for dried durian and longan: relatively high price, and the taste of durian, which many people don’t like. 3) Challenge for puree, IQF fruit mixes, fruit ice cream: meeting the market access requirements for processed food. Also applicable to canned fruit and pickled vegetables. 4) Challenge for IQF fruit mixes, fruit ice cream: cold logistics to Europe.

Trend match
Opportunity classes, products, and challenges
Trend 1 – Increasing demand for healthy fruits and vegetables
Trend 2 – Consumers want convenience
Trend 3 – Diversification of products and flavors
Trend 4 – Preference for sustainable supply chains Competition
Average to good opportunities are for:
2. Relatively unknown exotic fruits (in the EU) so far.
Dragon fruit, fresh X X Limited supply in Europe. Colombia launched exports of dragon fruit to Europe in 2015.
Longan, fresh Limited, if available then from Vietnam mostly.
Rambutan, fresh X X Small volumes from Thailand, Indonesia en Malaysia. Price is relatively high (EUR 16/kg in 2016 in Netherlands)
1) Challenge: selling these products to Europe is only possible with a buyer who is willing to spend time and energy in promoting these fruits among customers and, indirectly, consumers. 2) Challenge for dragon fruit: consumer’ expectations are higher when they see the attractive fruit, colourful and red to purple and green appearance, and with the white flesh and black seeds.
The taste, when not very sweet, can be disappointing. As the taste is also not fresh and sour as compared to kiwi, for example. 3) Challenge for rambutan and longan: the vulnerability of the fruit, as it is more vulnerable than lychees.
3. Relatively known exotic fruits in Europe:
Mango Several suppliers, coming from West Africa, South America, and Asia
Lichee One supplier dominates the European market: Madagascar.
Papaya Mostly Brazil, small volumes from Ecuador and Ghana.
1) For mango: there are already several suppliers, coming from West Africa, South America, and Asia. Competition can be strong, depending on the season, but also on the variety. In this respect, very sweet mangos from Asia could offer good opportunities.
2) Lychee supply from Madagascar has been well developed. Competition can be expected to be strong. 3) For papayas, as they are delicate, they are difficult to handle and ship. New varieties and technical improvements to facilitate sea transport can lower the risks and further promote demand for
papayas in Europe.
Good opportunities
4. Sustainably produced products, including organic and fair-trade produce.
Organic and/or fair-trade exotic fruits and vegetables
X X Limited availability and competition in the EU market.
1) Making these products available will need a medium to long term planning. 2) All other challenges as mentioned above for conventional products, also apply here.
5.2.1 Vietnam’s competitive possibility
An important component in the development of a European market access strategy is the consideration of prospects for each product mentioned in Figure 5.1. Vietrade should develop this in the next phase.
Aspects that should be taken into account are, for example:
Assessment on the scalability,
Expected impact on national revenue and socio-economic impact.
Challenges on the way to certification for Globalgap
Available technology and facilities/companies to produce certain products (like dried fruits, or fruit and vegetables chips)
Possibility for counter-season supply to the European market.
Market competitiveness, market prices, long-term market forecasts, based on additional insights from sector associations, etc.
o For example, for avocado in the long run expanded global supply is expected to bring prices down, which will likely lead to the non-feasibility of airfreight transport.
o Another example is beans/snow peas/sugar snaps. Demand for these vegetables in Europe is limited to certain seasons where production in Europe and Egypt are less, so there is a limit to demand. In addition, also other (mainly Eastern) African countries are working on developing exports of such fresh vegetables to Europe.
Prospect assessment and comparison is a broader picture, but the strategy needs to go beyond this to analyze in detail the scenario of each product/sector.

6 Appendices
6.1 Business support organizations and leading exporters
6.1.1 Vietnam Fruit & Vegetables Association (VINAFRUIT)
The Association was established in 2001, working as an NGO of enterprises involving in the fruit and vegetable sector from different economic actors (state, share-holder, self-business, joint-venture, and 100% foreign funded etc.). The association combines the effective business operation and protection of legitimate interest of their members, contributing to the improvement of Vietnam socio-economic and environmental condition. The association also together with the Government conducts activities to develop Vietnam fruit & vegetable sector, particularly in the fields cultivation, preservation, processing, trade promotion and trading of products domestically and internationally. The association has some mandates to manage the fruit & vegetable sector like acting as the focal point for the national trade promotion program supported by the Government (e.g. organizing trade fairs & exhibitions, conducting market surveys and collecting information etc.); founding funds for sectoral association (like Reserve Fund for business risks); playing the active role in dissemination of policies and legislation; providing information about the fruit & vegetable sector, and at the same time, representing their members to regularly report to the Government and relevant authorities of the development status of the sector.
6.1.2 Vietnam Fruit & Vegetable Research Institute (FAVRI)
This is one of 18 institutes subsidiary to Vietnam Academy of Agricultural Sciences (VAAS) – under MARD, which is specialized in doing research on various fields of fruits & vegetables, flowers and ornamental plants within the northern and central provinces of Vietnam.
6.1.3 Southern Horticultural Research Institute (SOFRI)
SOFRI has 2 subsidiary centers, namely Southeast Fruit Research Center (SEFRC) based in Tan Thanh District, Ba Ria – Vung Tau Province with the total area of 436 hectare and Center of Technical Transfer based at the Institute headquarter. The Institute’s main mandate is to participate to researches on development of varieties of fruit trees, ornamental plans and vegetables, market information and technological transfer to interested target groups.
6.1.4 Vietnam National Vegetable, Fruit And Agricultural Product Corporation Limited (VEGETEXCO VIETNAM)
VEGETEXCO is the leading state-owned company, directly involved in production, processing, trading and ex-importing of fruits & vegetables and agro-products. Its’ annual export turnover accounts for a large share of Vietnam’s total fruit & vegetable export revenue. VEGETEXCO VIETNAM was established in 2003 on the merge of 2 big corporations, namely Vietnam Fruit & Vegetable Corporation (born in 1954) and Agricultural Products and Processed Foods Ex-Importing Corporation
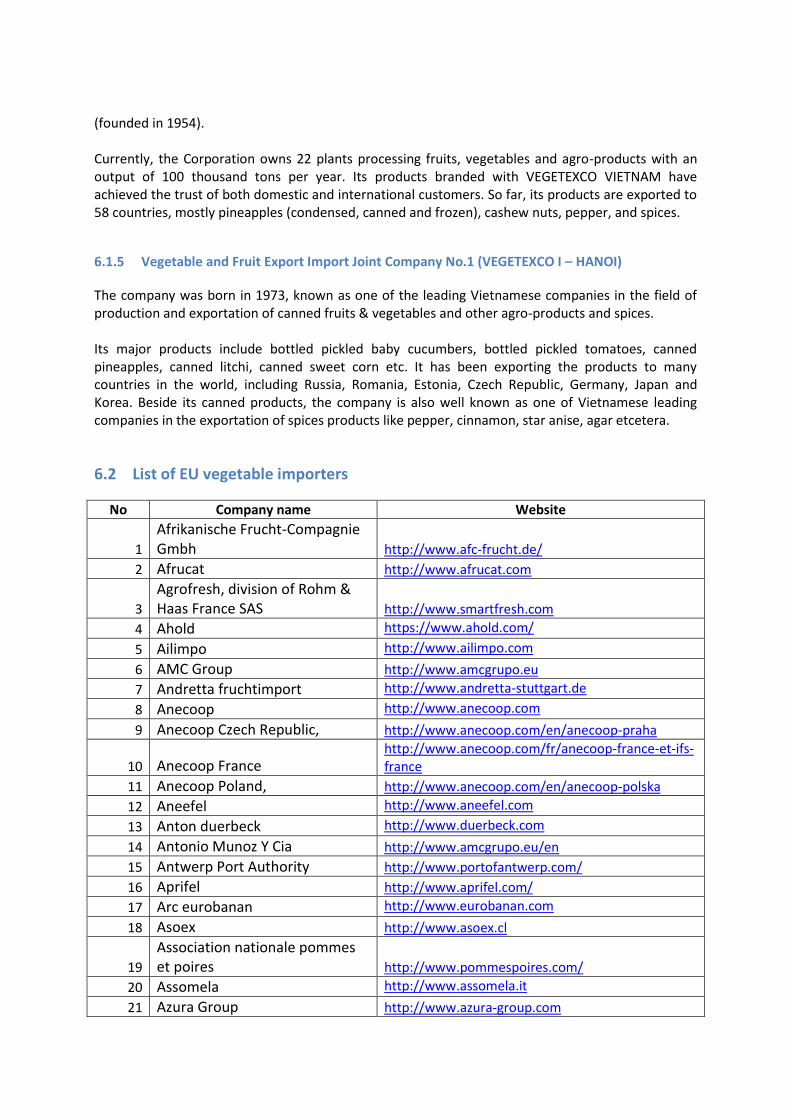
(founded in 1954). Currently, the Corporation owns 22 plants processing fruits, vegetables and agro-products with an output of 100 thousand tons per year. Its products branded with VEGETEXCO VIETNAM have achieved the trust of both domestic and international customers. So far, its products are exported to 58 countries, mostly pineapples (condensed, canned and frozen), cashew nuts, pepper, and spices.
6.1.5 Vegetable and Fruit Export Import Joint Company No.1 (VEGETEXCO I – HANOI)
The company was born in 1973, known as one of the leading Vietnamese companies in the field of production and exportation of canned fruits & vegetables and other agro-products and spices. Its major products include bottled pickled baby cucumbers, bottled pickled tomatoes, canned pineapples, canned litchi, canned sweet corn etc. It has been exporting the products to many countries in the world, including Russia, Romania, Estonia, Czech Republic, Germany, Japan and Korea. Beside its canned products, the company is also well known as one of Vietnamese leading companies in the exportation of spices products like pepper, cinnamon, star anise, agar etcetera.
6.2 List of EU vegetable importers
No Company name Website
1
Afrikanische Frucht-Compagnie Gmbh http://www.afc-frucht.de/
2 Afrucat http://www.afrucat.com
3
Agrofresh, division of Rohm & Haas France SAS http://www.smartfresh.com
4 Ahold https://www.ahold.com/
5 Ailimpo http://www.ailimpo.com
6 AMC Group http://www.amcgrupo.eu
7 Andretta fruchtimport http://www.andretta-stuttgart.de
8 Anecoop http://www.anecoop.com
9 Anecoop Czech Republic, http://www.anecoop.com/en/anecoop-praha
10 Anecoop France http://www.anecoop.com/fr/anecoop-france-et-ifs-france
11 Anecoop Poland, http://www.anecoop.com/en/anecoop-polska
12 Aneefel http://www.aneefel.com
13 Anton duerbeck http://www.duerbeck.com
14 Antonio Munoz Y Cia http://www.amcgrupo.eu/en
15 Antwerp Port Authority http://www.portofantwerp.com/
16 Aprifel http://www.aprifel.com/
17 Arc eurobanan http://www.eurobanan.com
18 Asoex http://www.asoex.cl
19
Association nationale pommes et poires http://www.pommespoires.com/
20 Assomela http://www.assomela.it
21 Azura Group http://www.azura-group.com
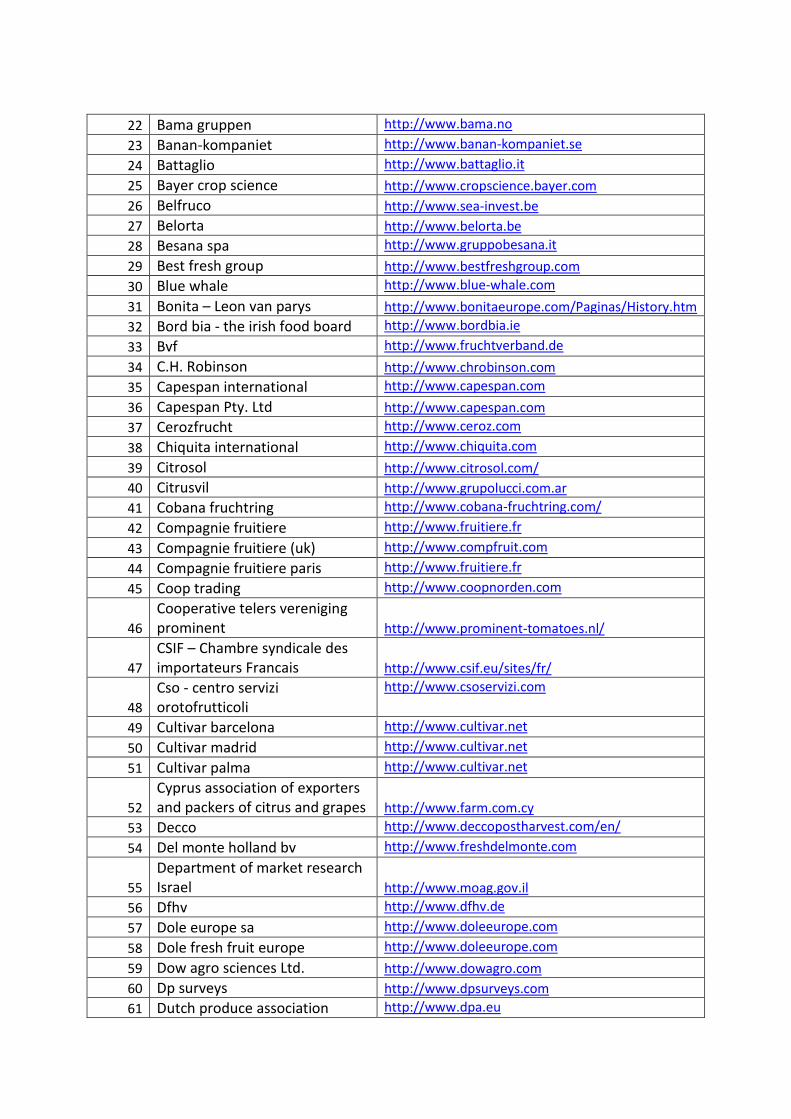
22 Bama gruppen http://www.bama.no
23 Banan-kompaniet http://www.banan-kompaniet.se
24 Battaglio http://www.battaglio.it
25 Bayer crop science http://www.cropscience.bayer.com
26 Belfruco http://www.sea-invest.be
27 Belorta http://www.belorta.be
28 Besana spa http://www.gruppobesana.it
29 Best fresh group http://www.bestfreshgroup.com
30 Blue whale http://www.blue-whale.com
31 Bonita – Leon van parys http://www.bonitaeurope.com/Paginas/History.htm
32 Bord bia - the irish food board http://www.bordbia.ie
33 Bvf http://www.fruchtverband.de
34 C.H. Robinson http://www.chrobinson.com
35 Capespan international http://www.capespan.com
36 Capespan Pty. Ltd http://www.capespan.com
37 Cerozfrucht http://www.ceroz.com
38 Chiquita international http://www.chiquita.com
39 Citrosol http://www.citrosol.com/
40 Citrusvil http://www.grupolucci.com.ar
41 Cobana fruchtring http://www.cobana-fruchtring.com/
42 Compagnie fruitiere http://www.fruitiere.fr
43 Compagnie fruitiere (uk) http://www.compfruit.com
44 Compagnie fruitiere paris http://www.fruitiere.fr
45 Coop trading http://www.coopnorden.com
46
Cooperative telers vereniging prominent http://www.prominent-tomatoes.nl/
47
CSIF – Chambre syndicale des importateurs Francais http://www.csif.eu/sites/fr/
48
Cso - centro servizi orotofrutticoli
http://www.csoservizi.com
49 Cultivar barcelona http://www.cultivar.net
50 Cultivar madrid http://www.cultivar.net
51 Cultivar palma http://www.cultivar.net
52
Cyprus association of exporters and packers of citrus and grapes http://www.farm.com.cy
53 Decco http://www.deccopostharvest.com/en/
54 Del monte holland bv http://www.freshdelmonte.com
55
Department of market research Israel http://www.moag.gov.il
56 Dfhv http://www.dfhv.de
57 Dole europe sa http://www.doleeurope.com
58 Dole fresh fruit europe http://www.doleeurope.com
59 Dow agro sciences Ltd. http://www.dowagro.com
60 Dp surveys http://www.dpsurveys.com
61 Dutch produce association http://www.dpa.eu

62 Eacce http://web2.eacce.org.ma/
63 Edeka http://www.edeka.de
64 Enzafruit (continent) http://www.enzafruit.be
65 Eosta http://www.eosta.com/
66 Eurofins http://www.eurofins.de
67 Eurofrutas http://www.eurofrutas.pt
68 Exofarm http://www.exofarm.com
69 Expofrut http://www.expofrut.com.ar
70 Federcitrus http://www.federcitrus.org.ar
71 Forumphyto http://www.forumphyto.fr
72 Fresca group ltd. http://www.frescagroup.co.uk
73 Fresh produce corsortium http://freshproduce.org.uk
74 Fresh produce exporters forum http://fpef.co.za/
75 Fresh trade belgium http://www.freshtradebelgium.be
76 Fruchthansa http://www.fruchthansa.de
77 Fruchthof meissen http://www.fruchthof.net
78 Frugi venta http://www.frugiventa.nl
79 Fruit south Africa http://www.fruitsa.co.za
80 Fruitimprese http://www.fruitimprese.it
81 Fyffes bv http://www.fyffes.com
82 Fyffes dublin http://www.fyffes.com
83 Fyffes dundalk http://www.fyffes.com
84 Fyffes group ltd http://www.fyffes.com
85 Fyffes usa http://www.fyffes.com
86 Green giant fresh Europe/ Bic http://www.greengiantfresh.com
87 Greencell dartford http://www.greencell.com
88 Greencell spalding http://www.greencell.com
89 Greenery international http://www.thegreenery.com
90 Greenyards Foods http://www.greenyardfoods.com
91 Groenten fruit huis http://www.groentenfruithuis.nl
92 Grupo yes http://www.grupoyes.org
93 Hermanos fernandez lopez http://www.grupofernandez.es
94 Hillfresh International http://www.hillfresh.eu
95
Hungarian fruit & vegetable board
http://www.fruitveb.hu
96 Interfel http://www.interfel.com
97
International distribution partners http://www.idpartners.eu/
98 It’s fresh http://www.itsfresh.com/
99 JBT FoodTech http://www.jbtfoodtech.com/
100 Kesko http://www.kesko.fi/
101
Koella, hamburg overseas import
http://www.koella.de
102 Koninklijke fruitmasters http://www.fruitmasters.nl
103 Koppert biological systems http://koppert.com/

104
Laboratorium zeeuws - vlaanderen http://www.labzvl.nl/
105 Landgard https://www.landgard.de/
106 Lembana http://www.fruit.dk
107 Leon van parys http://leonvanparys.com
108
Lithuanian vegetable producers association http://www.ldaa.lt
109 Maba http://maba-eg.com/
110 Macalea http://www.macalea.com
111 Mack international trading http://www.mwmack.co.uk
112 Mack multiples division http://www.mwmack.co.uk
113 Mario andretta http://www.andretta.de
114 Mattstedt
115 Mediterranean exportera union http://www.akib.org.tr
116 Norgesgruppen http://www.norgesgruppen.no/
117 Norma http://www.norma-online.de
118 Northwest horticultural council http://www.nwhort.org
119 Nufri sat 1596 http://www.nufri.com
120 Origin fruit direct http://www.originfruitdirect.nl/
121
Perishable products export control board http://www.ppecb.com
122 Peviani http://www.peviani.it
123
Pipfruit growers Newzealand http://www.pipfruitnz.co.nz/
124 Pma http://www.pma.com/
125 Pomona http://www.pomona.fr
126 Port international gmbh http://www.port-international.com
127 Port of koper http://www.luka-kp.si/eng
128 Primafruit ltd. http://www.primafruit.co.uk
129 Primland http://www.primland.fr/default.aspx
130 Primoris http://www.primoris-lab.com
131 Rewe group http://www.rewe-group.com
132 Rijk zwaan http://www.rijkzwaan.com
133 Roveg fruit http://www.roveg.nl
134 Saba trading http://www.sabatrading.se
135 San miguel http://www.sa-sanmiguel.com
136 Seabrex rotterdam http://www.seabrex.nl
137 Snifl http://www.saintcharlesinternational.fr
138 Special fruit http://www.specialfruit.com/en/home/
139 Sunfoods - lucic group http://www.lucic.rs/
140 Swisscofel http://www.swisscofel.ch
141 Swisscofel http://www.swisscofel.ch
142 Syngenta http://www.syngenta.com
143 Tập đoàn Carrefour - Bỉ http://www.carrefour.com/
144 Tập đoàn Metro http://www.metrogroup.de
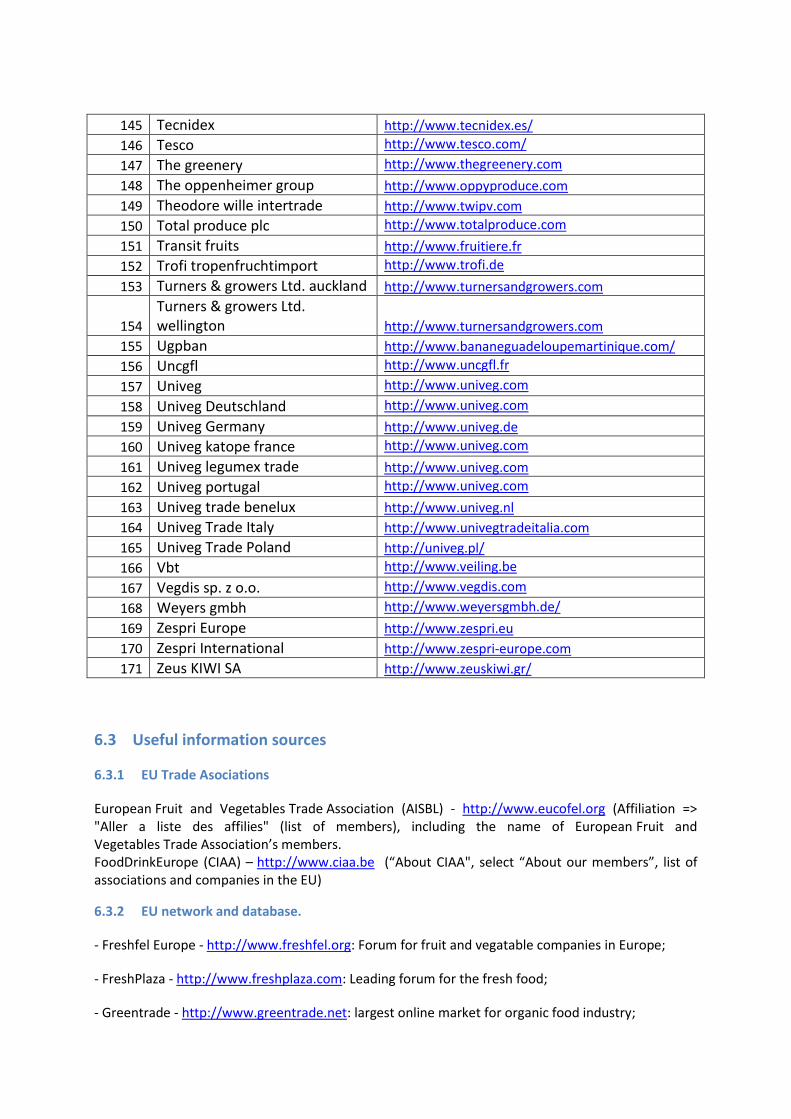
145 Tecnidex http://www.tecnidex.es/
146 Tesco http://www.tesco.com/
147 The greenery http://www.thegreenery.com
148 The oppenheimer group http://www.oppyproduce.com
149 Theodore wille intertrade http://www.twipv.com
150 Total produce plc http://www.totalproduce.com
151 Transit fruits http://www.fruitiere.fr
152 Trofi tropenfruchtimport http://www.trofi.de
153 Turners & growers Ltd. auckland http://www.turnersandgrowers.com
154
Turners & growers Ltd. wellington http://www.turnersandgrowers.com
155 Ugpban http://www.bananeguadeloupemartinique.com/
156 Uncgfl http://www.uncgfl.fr
157 Univeg http://www.univeg.com
158 Univeg Deutschland http://www.univeg.com
159 Univeg Germany http://www.univeg.de
160 Univeg katope france http://www.univeg.com
161 Univeg legumex trade http://www.univeg.com
162 Univeg portugal http://www.univeg.com
163 Univeg trade benelux http://www.univeg.nl
164 Univeg Trade Italy http://www.univegtradeitalia.com
165 Univeg Trade Poland http://univeg.pl/
166 Vbt http://www.veiling.be
167 Vegdis sp. z o.o. http://www.vegdis.com
168 Weyers gmbh http://www.weyersgmbh.de/
169 Zespri Europe http://www.zespri.eu
170 Zespri International http://www.zespri-europe.com
171 Zeus KIWI SA http://www.zeuskiwi.gr/
6.3 Useful information sources
6.3.1 EU Trade Asociations
European Fruit and Vegetables Trade Association (AISBL) - http://www.eucofel.org (Affiliation => "Aller a liste des affilies" (list of members), including the name of European Fruit and Vegetables Trade Association’s members. FoodDrinkEurope (CIAA) – http://www.ciaa.be (“About CIAA", select “About our members”, list of associations and companies in the EU)
6.3.2 EU network and database.
- Freshfel Europe - http://www.freshfel.org: Forum for fruit and vegatable companies in Europe;
- FreshPlaza - http://www.freshplaza.com: Leading forum for the fresh food;
- Greentrade - http://www.greentrade.net: largest online market for organic food industry;

- The Food World - http: //wwwh.thefoodworld.com: List of exporters and producers of food;
- Europages - http://www.europages.com: A multilingual B2B search engine includes an online communication portal Buy & Sell;
- Food for Trade - http://www.foodsfortrade.com : Leading B2B trade portal for food products;
- Agronetwork - http://www.agronetwork.com: page about agricultural products include online trading port;
- FLO-CERT - http://www.flo-cert.net: Provide certification services and information about partners who had fair -trade certification;
- Intracen - http://www.intrancen.org/Organics/importers.html: Provides information about organic food importers;
- CBI - http://www.cbi.eu/marketinfo/cbi/: Market information and export promotion into EU market;
- http://www.kwintessential.co.uk/etiquette/doing-business-in.html:Business culture Guideline;
- http://exporthelp.europa.eu: export promotion from developing countries to the EU market in 4 languages (English, French, Spanish and Portuguese);
- http://www.freshquality.org/english/home.asp .: Legislation of EU marketing standards;
- http://www.eubusiness.com: EU business, market;
-http: //eur-lex.europa.eu/JOIndex.do: Look up the legislation of the different areas of the EU;
-http://europa.eu/index_en.htm: Find out information about the EU market.
6.4 List of specialized exhibitions and trade fairs.
International Fruit and Vegetables Trade Show
Spain - Madrid, Organiser: Ifema (Feria de Madrid) Frequency: Annually Venue: Ifema - Parque Ferial Juan Carlos I Feria de Madrid, Madrid 28042, Spain For more information: http://www.fruitattractionnews.com
Fruit Logistica
Germany Venue: Messe Berlin Frequency of organization: Annually Organiser: Messe Berlin GmbH Messedamm 22 14055 Berlin, Germany
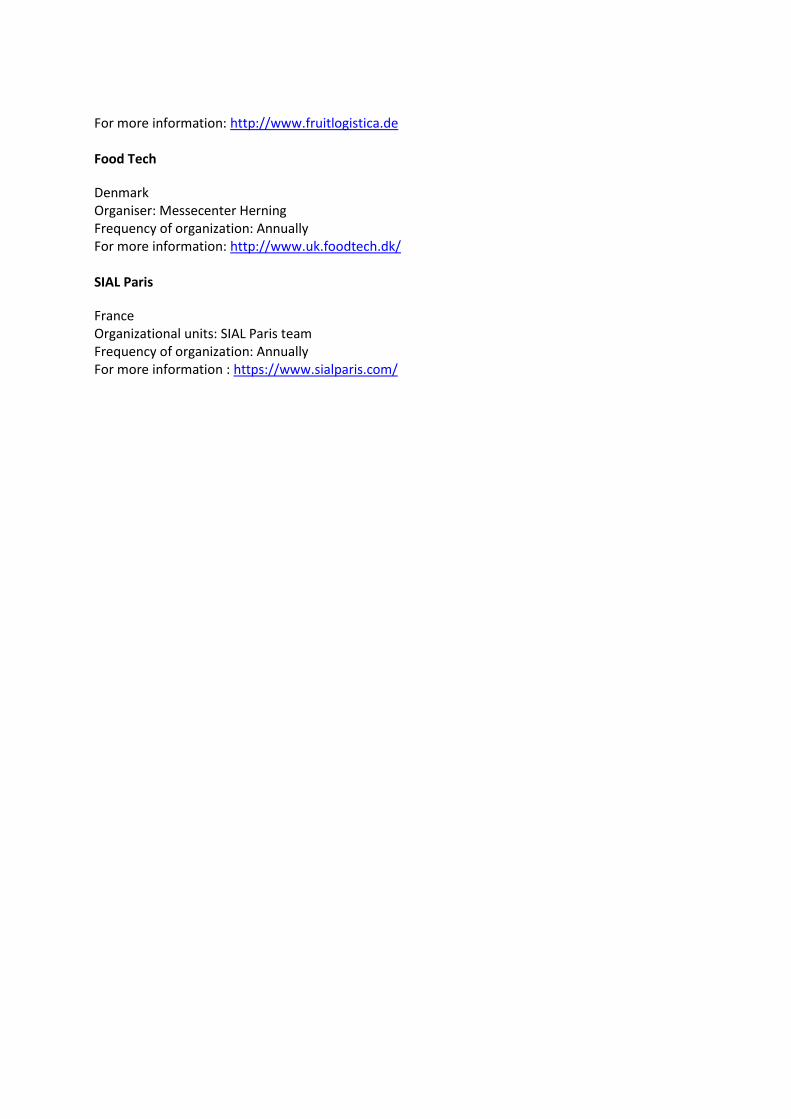
For more information: http://www.fruitlogistica.de Food Tech
Denmark Organiser: Messecenter Herning Frequency of organization: Annually For more information: http://www.uk.foodtech.dk/ SIAL Paris
France Organizational units: SIAL Paris team Frequency of organization: Annually For more information : https://www.sialparis.com/