opportunities for the fermentation-based chemical industry
TRANSCRIPT

Opportunities for the fermentation-based chemical industryAn analysis of the market potential and competitiveness of North-West Europe
September 2014

Preface – The biotechnology (r)evolution or the greening of the chemical value chain
Global competition in the chemical market is intensifying. The abundance of shale gas in the US, oil and gas in the Middle East and coal in China means the European chemical industry is under increasing pressure to find new ways to create a sustainable competitive advantage. The key lies in innovation and new strategic partnerships, as expressed in numerous publications and discussions.
A golden opportunity exists in the creation of new value chains with biobased feedstocks as the starting point and biorefineries at the core. The industrial application of biotechnology will not only broaden the range of raw materials used as the principal input for chemical production but also generate products and materials with new properties and applications. Further developments of processes and technologies are necessary and feasible since biobased feedstocks differ from fossil feedstocks. The required infrastructure to bridge the existing gaps between the agricultural and the chemical industry and business communities, while significant, is manageable. Given the rapid technological developments and the potential for growth, this study intends to show that biobased feedstocks can help Europe participate in this emerging segment and gain a competitive edge.
At the instigation of the Biorenewables Business Platform (BBP), several stakeholders teamed up to determine the market potential of one of the key processes that make biobased feedstocks ready for use in the chemical industry. That process is fermentation,
which converts carbohydrate raw materials into food, feed, fuel and a variety of functional molecules – the “4Fs”–, i.e. chemical building blocks.
While this study shows that biobased chemicals have considerable growth potential in the market, the use of biomass in the European chemical industry faces several real and perceived hurdles. These hurdles, recently documented by Cefic and investigated thoroughly by TNO17 and Nova Institute5, have meant that worldwide production capacity for fermentation-based chemicals shifted to regions outside Europe in the past decade despite the growth in worldwide demand and the wide availability of biotechnological knowhow in Europe. As an example, in 2006 a broad group of stakeholders led by Wageningen University and Research Centre (WUR) and Energy Research Centre for the Netherlands (ECN)2 documented the broad range of possibilities and a roadmap for industrial biorefineries. Several years later, the World Economic Forum also recognized the importance in a study on the future of biorefineries19. Prof. Johan Sanders captured it well in his recent farewell speech: “the biorefinery is the bridge between agriculture and chemistry.”15
Of course, biobased products compete in a world market against fossil-based alternatives produced using a well-established technology and asset base. European stakeholders and legislators therefore could help address these and level the playing field if they want to benefit from this trend and bring investments to Europe.
Crops – Beets, cane and corn
Feedstock – Sugars and
starches
Processing Industry –
Fermentation
End-markets and applications

What specifically are the hurdles that need overcoming if Europe is to gain an edge?First, the ‘preferential treatment’ of the use of biomass to produce fuel and/or energy, which is not limited to Europe, over the use for materials. This not only drives up biomass prices but also puts fossil-based alternatives at an artificial advantage since there are no taxes or duties on fossil-based carbon sources for chemicals. The heavy tax on conventional fuels increases the artificial pressure on the use of biomass for fuels even further. Second, the lack of industry knowledge, applicable policies, in particular the Common Agricultural Policy, insufficient political commitment and uncertainty about the long-term direction, which all affect the investment climate and investments in Europe. Third, the perception that European sugar prices are well above world market prices and that European production costs are not competitive.
While not addressing the policy and regulatory issues, this report does provide a comprehensive, fact-based perspective on fermentation-based chemicals and materials and the opportunities they create for the chemical industry. The report sizes the existing market for the global fermentation-based industry, zooms in on products with sufficient market potential for the chemical industry and provides an economic analysis. It also includes an assessment on the competitiveness of North-West Europe from a raw material perspective, as a place of business compared to the USA, Brazil and Thailand.
The report does seem to come at time of increasing momentum. See for example the recent announcement of the European Union and the Biobased Industries Consortium to launch a Biobased Industries Joint Undertaking, a new public-private partnership, with € 3.7 billion of funding to realize the potential of this industry in Europe to stimulate sustainable growth and create meaningful jobs.
This study leverages extensive desk research, Deloitte analysis and interviews with industry experts. The appendix lists all data sources used and the numerous contributors who have generously provided their expertise.
Together, the facts, the analysis and the contributors all speak for a take-off of the fermentation-based chemical industry in Europe and with that the continued greening of the chemical value chain.
A new paradigm shift: From feedstock to “beetstock”?
“An indigenous raw material source for the emerging European fermentation industry is a dream come true. Located in the same region as the ARRRA (Antwerp-Rotterdam-Rhine-Ruhr-Area) chemical cluster, it could be the catalyst for a paradigm shift and assure a solid foundation for evolutionary developments and synergies. It would be a source of inspiration and rejuvenation in the cluster and a timely shot in the arm. My gut feeling is that the up to 5 million tons of potential raw materials could attract investments for products and polymers in the order of 5 to 10 billion dollars. “Agri meets Chemicals” could be the start of a decades-long intensive collaboration between the two sectors, capturing the envisioned opportunities in which forward integration with the Agri sector may well play a crucial role.”
Ton Runneboom, Chairman of the Biorenewables Business Platform

Content
Executive summary 1
Opportunities for the fermentation-based chemical industry
1. Where Agri meets Chemicals: rationale, background and scope of the study 6
2. The global fermentation market is valued at 127 bn dollar and expected to grow above GDP 11
3. The attractiveness of the fermentation-based chemical industry depends on end-markets and alternative feedstocks price levels as well as product yields 14
4. Key feedstocks in the US, Brazil, South-East Asia and North-West Europe include sugars and starches from cane, beet, tapioca and corn 19
5. Food, Feed, Fuel and Functional Molecules – What crops are used for and the way they are processed varies tremendously 24
6. North-West Europe can be a competitive location for fermentation-based processes and business 28
7. In a nutshell: A surprisingly positive picture for North-West Europe and the sugar beet 36
Contacts 37
Appendices 38
A. Approach of the study 39
B. Key fermentation processes and theoretical yield 40
C. Definitions of mono- and polysaccharide carbohydrates 44
D. Interviewees 46
E. Steering committee 47
F. Reference material 48
G. Abbreviations 50


1
Executive summary
The European chemical industry is a strong, innovative and important sector in key countries like Germany, Belgium and the Netherlands (revenue in the Netherlands 51 billion euros excluding pharma, 8% of GDP in 2013)38. However, it has been losing competitive ground recently, mainly due to higher energy prices. Announcements of investment in new production facilities are comparatively rare. Clearly, the industry needs to explore new ways to create a sustainable competitive advantage.
Fortunately, a golden opportunity is to be found in increasing the applications of industrial biotechnology and biobased feedstock for the fermentation-based chemical industry. This opportunity spans the entire value chain, from seed to “drop-in” chemicals and new functional molecules with new properties. Current examples at opposite ends of this value chain include the potential of the ‘Energybeet’, developed by the seed producer KWS, and the additional properties of Avantium’s technology for producing PEF for Coca Cola’s PlantBottle™ replacing the conventional PET bottle.
In the broader economic context, a remarkable development that has almost escaped notice is the ratio between the prices for crude oil and white sugar. Before the turn of the millennium, the ratio between Brent Crude and London’s No 5 contract for white sugar, both in US$/GJ, hovered around 7. However, soaring oil prices and low sugar prices in 2000 led to the ratio plummeting to about 3. The ratio continues to decline gradually. Given the high correlation between raw and white sugar prices, the trend for the main feedstock for fermentation is identical.
Crops and arable land use for fermentation-based chemicals will remain insignificant compared to food, feed and fuel while the added value is high
10
33 1.5
0.1
0.1
0.3
0.4
Sources
Agricultural produce:
~11 bn ton dry matter biomass
equivalents
Fossil materials
(coal, oil & gas):~35 bn ton dry matter biomass
equivalents
Usage Food and Feed Fuel (Energy) Chemicals
Fermentation-based Products
• All figures are indicative; Biofuel excludes wood; See separate table with detailed figures covering added value, arable land use
Source: FAO, IEA, EIA, Sanders & Bos (2013), Deloitte Analysis
Figure 1 – Global fossil and agricultural inputs and usage in 2012 (bn ton dry matter biomass equivalents)
The fermentation-based chemical industry, while growing, is still small compared to petrochemicals. Oil and gas are mainly used for energy and only a small share for chemicals – ca. 4% and another 4% for the energy required to make the chemicals.
The concerns and uncertainties about climate change have produced another relevant development. All major global brand-owners of consumer products are pushing harder for sustainability in their product portfolio, end-to-end value chains and consumer brand marketing. Given the limited availability of arable and fertile land, the use of sugars for fuel and, to some extent, high value-added biobased chemicals and materials using first-generation fermentation technology raises additional questions. Figure 1 above and table 1 below attempt to put the debate in perspective.
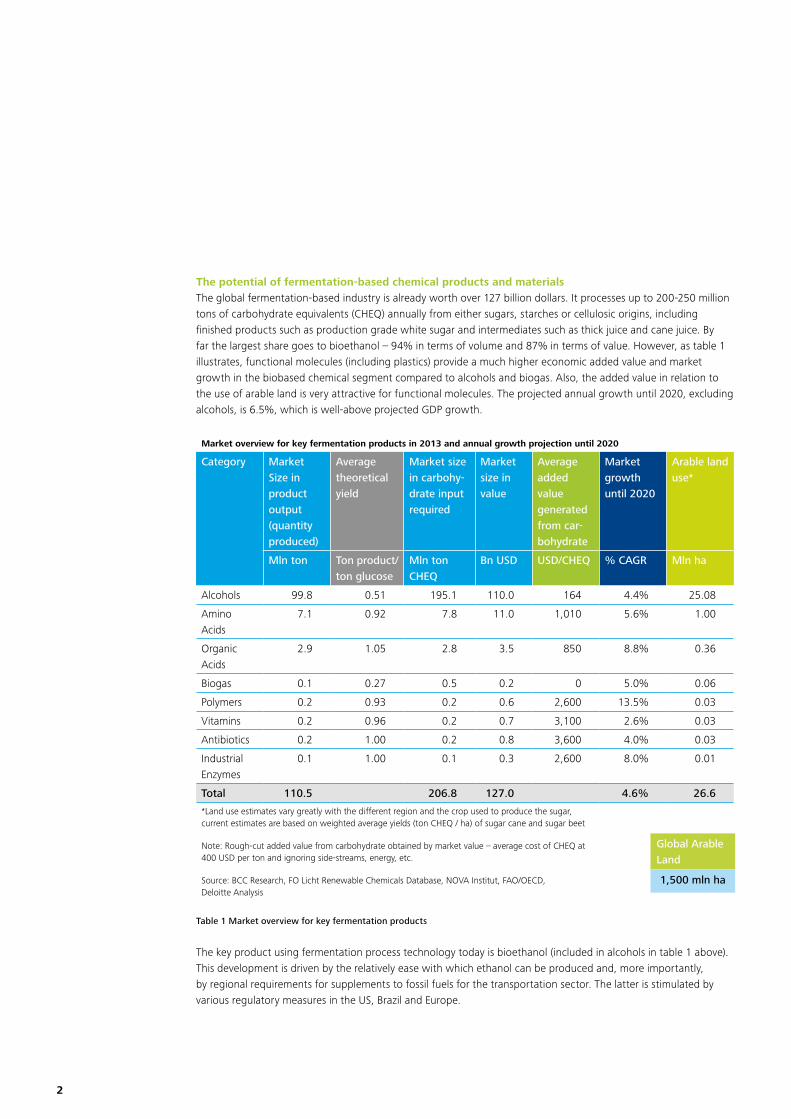
2
The potential of fermentation-based chemical products and materialsThe global fermentation-based industry is already worth over 127 billion dollars. It processes up to 200-250 million tons of carbohydrate equivalents (CHEQ) annually from either sugars, starches or cellulosic origins, including finished products such as production grade white sugar and intermediates such as thick juice and cane juice. By far the largest share goes to bioethanol – 94% in terms of volume and 87% in terms of value. However, as table 1 illustrates, functional molecules (including plastics) provide a much higher economic added value and market growth in the biobased chemical segment compared to alcohols and biogas. Also, the added value in relation to the use of arable land is very attractive for functional molecules. The projected annual growth until 2020, excluding alcohols, is 6.5%, which is well-above projected GDP growth.
Market overview for key fermentation products in 2013 and annual growth projection until 2020
Category Market Size in product output (quantity produced)
Average theoretical yield
Market size in carbohy-drate input required
Market size in value
Average added value generated from car-bohydrate
Market growth until 2020
Arable land use*
Mln ton Ton product/ton glucose
Mln ton CHEQ
Bn USD USD/CHEQ % CAGR Mln ha
Alcohols 99.8 0.51 195.1 110.0 164 4.4% 25.08
Amino Acids
7.1 0.92 7.8 11.0 1,010 5.6% 1.00
Organic Acids
2.9 1.05 2.8 3.5 850 8.8% 0.36
Biogas 0.1 0.27 0.5 0.2 0 5.0% 0.06
Polymers 0.2 0.93 0.2 0.6 2,600 13.5% 0.03
Vitamins 0.2 0.96 0.2 0.7 3,100 2.6% 0.03
Antibiotics 0.2 1.00 0.2 0.8 3,600 4.0% 0.03
Industrial Enzymes
0.1 1.00 0.1 0.3 2,600 8.0% 0.01
Total 110.5 206.8 127.0 4.6% 26.6
*Land use estimates vary greatly with the different region and the crop used to produce the sugar, current estimates are based on weighted average yields (ton CHEQ / ha) of sugar cane and sugar beet
Note: Rough-cut added value from carbohydrate obtained by market value – average cost of CHEQ at 400 USD per ton and ignoring side-streams, energy, etc.
Source: BCC Research, FO Licht Renewable Chemicals Database, NOVA Institut, FAO/OECD, Deloitte Analysis
Table 1 Market overview for key fermentation products
The key product using fermentation process technology today is bioethanol (included in alcohols in table 1 above). This development is driven by the relatively ease with which ethanol can be produced and, more importantly, by regional requirements for supplements to fossil fuels for the transportation sector. The latter is stimulated by various regulatory measures in the US, Brazil and Europe.
Global Arable Land
1,500 mln ha

3
Other key fermentation products with sufficient market potential (i.e. excluding bioethanol) equate to roughly 11.6 million tons of carbohydrate equivalents and have a turnover potential of 17.1 billion dollars (see table 1). These include amino acids, organic acids such as lactic and succinic acid, as well as polymers such as xanthan.
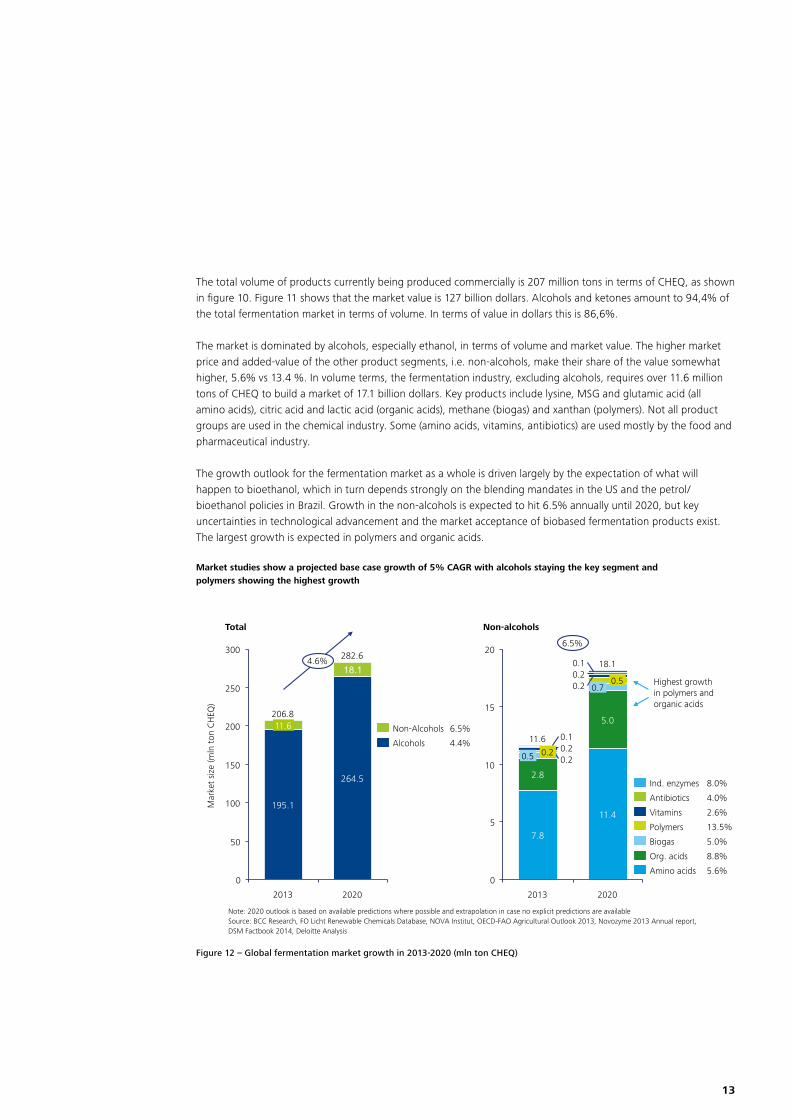
Market studies show a projected base case growth of 5% CAGR with alcohols staying the key segment and polymers showing the highest growth
300
250
50
100
200
150
0
4.6% 282.6
206.8
2013 2020
195.1
11.6
18.1
264.5
20
15
10
5
0
0.2
0.1
7.8
0.1
0.5 0.2 0.2
2013
11.6
2.8
6.5%
2020
18.1
11.4
5.0
0.7 0.5 0.2
0.2
Amino acids 5.6%
Org. acids 8.8%
Biogas 5.0%
Polymers 13.5%
Vitamins 2.6%
Antibiotics 4.0%
Ind. enzymes 8.0%
Alcohols 4.4% Non-Alcohols 6.5%
Note: 2020 outlook is based on available predictions where possible and extrapolation in case no explicit predictions are available
Source: BCC Research, FO Licht Renewable Chemicals Database, NOVA Institut, OECD-FAO Agricultural Outlook 2013, Novozyme 2013 Annual report, DSM Factbook 2014, Deloitte Analysis
Total Non-alcohols
Highest growth in polymers and organic acids
Mar
ket
size
(mln
ton
CH
EQ)
Figure 2 – Global fermentation market in 2013 and projection for 2020 (mln ton CHEQ)
The competitiveness of North-West Europe and sugar beetsThe attractiveness of the fermentation-based chemical industry depends on the price levels of the functional molecules as chemical products, including the mainly fossil-based alternatives with which they compete, the yield of fermentation processes and the market prices for biobased feedstocks.
Sugar, a major biobased feedstock, comes either directly from cane or beet or indirectly from corn or tapioca starch, and it can be competitive against fossil alternatives for selected high-value-added products. Globally, four main regions emerge as attractive locations for fermentation businesses, each with a different feedstock: • Brazil, mainly sugar cane• US, mainly corn• South-East Asia, mainly tapioca/cassava and sugar cane• North-West Europe, mainly wheat and sugar beets
The cost levels to produce sugar in North-West Europe are amongst the lowest in the world due to increasing crop and sugar yields in the fields and from production efficiencies. Although weather conditions are also relevant, our analysis of the underlying drivers show the relative cost position is likely to improve further in the coming years. The global supply-cost curve for the most recent season shows the impact of efficiency improvements.

4
Note: Production costs of raw sugar converted to w.s.e. multiplying by 1.087 (polarisation constant) and adding refining costs of $65 / ton, raw sugar volume converted to w.s.e. by dividing volume by 1.087; Note 2: Production costs for beet and cane include for both land and factory costs for labour, capital (incl. a.o. land rent and depreciation), input (incl. a.o. seeds, fertilizer, chemicals, and energy), and factory by-product revenue.
Source: LMC International Sugar & HFS report 2014, UNICA Harvest Reports 09/10 – 12/13, Deloitte Analysis
20 170 70 90
2.500
60
3.000
2.000
500
150 130 140
0 100 120 40
1.500
1.000
50 160 110 30 80 10 0
Volume (mln ton w.s.e.)
In the last season, volumes have been higher than average and the Netherlands has taken the lead in low cost sugar production
Pro
duct
ion c
ost
(U
SD /
to
n w
.s.e
.)
Thailand
(Cane)
Netherlands
(Beets)
South/Central Brazil (Cane)
India (Cane)
Cane Beet
Global white sugar market price range (2008-2013)
UK (Beets)
France (Beets)
Germany (Beets)
Figure 3 – Global supply curve of sugar 2012/2013 (USD/ton w.s.e)
Sugar beet from North-West Europe and especially the Netherlands appears to be particularly cost competitive due to low inbound and outbound transportation costs, high sugar yields per hectare of land, large-scale facilities and the ability to supply ample volumes of thick sugar juice on a year-round basis. Other benefits include access to the tightly knit network in the ARRRA region (Antwerp-Rotterdam-Rhine-Ruhr-Area) and the high level of education in the cluster in both chemical and agricultural technology.
Dispelling the myth surrounding European white sugar prices A recent EC report on industrial white sugar, as shown in figure 4 below, shines an interesting light on the perception that European prices still exceed world market prices:• EU prices were higher the world market prices before 2009, leading companies to invest elsewhere • EU prices were below London No 5 white sugars between 2009 and 2012• EU prices for non-food sugars converged to world market levels in 2013

5
Source: FO Licht, Deloitte Analysis
Prices for white and raw sugar have ranged between $350 and $800 per ton over recent years, European industrial white sugar has been less volatile and converged to world market levels
Spo
t p
rice
(U
SD/t
on)
200
01-01-2008 01-01-2009 01-01-2010 01-01-2011 01-01-2012 01-01-2013 01-01-2014
0
400
600
800
1,000
Raw sugar price (New York No. 11)White sugar price (London No. 5)White Sugar (Moving Quarterly average)European industrial white sugar from sugar producers
Global white sugar market price range (2008-2013)
Figure 4 – Raw and white sugar prices 2008-2013 (USD/ton)
Furthermore, the EU will be lifting production quotas for food-grade sugar in 2017. Deregulation means the production volume of sugar beets sales will grow substantially. It also entails production shifts to the most efficient growing areas in Europe.
Investment hurdlesThe preface already referred to some of the hurdles that legislators and other stakeholders need to address to create a level playing field. The most relevant of these is the set of measures that stimulates the use of biomass for biofuels. These measures discourage investment in European facilities that produce high value-added biobased materials because they limit access to biomass for other uses and increase net costs. The unintentional consequence is the advantage given to fossil-based alternatives. Surveys and analysis by TNO show that this factor and the insufficient availability of venture capital adversely affect the pilot and commercialisation phases in particular17, 18.
This report shows that it is worthwhile taking on these challenges. The biotechnological (r)evolution has the potential to stimulate innovation, economic growth and create jobs. Today, the convergence of the chemical and agricultural eco-system and the biotechnological knowhow in North-West Europe make for a prime location. Fermentation is where ‘Agri meets Chemicals’.

1. Where Agri meets Chemicals: rationale, background and scope of the study
6
The competitiveness of the fossil-based chemical industry in North-West Europe is increasingly under pressure because of the US shale gas revolution and high energy prices in Europe. Other global developments, triggered by megatrends such as urbanization, mobility, the rapidly aging population and work force in Europe and the rising middle class in the high-growth economies, compound the situation. At the same time, the use of biobased feedstock – sugar, starch and cellulose – and fermentation process technologies are expanding. Sustainability as another megatrend is the driver here. This creates new opportunities in Europe due to the intensity of the chemical and agricultural eco-systems and the body of knowledge on the intersecting boundaries of these two domains. This is where ‘Agri meets Chemicals’.
In addition, the projection is that biobased feedstock supplies will increase in North-West Europe from 2017 onwards due to de-regulation in the EU resulting from the new common agricultural policy. Europe will be lifting production and import quota for sugars and iso-glucose, creating a free market and increasing production volumes. As a result, the EU will have several million tons of additional supplies each year.
Previous studies have investigated the economics of producing specific chemicals via the bio-route, for example, DOW has explored the specific case of the beet-to-ethanol-to-ethylene pathway under 2011 market conditions1. However, the competiveness of biobased feedstocks from North-West Europe from the perspective of the chemical industry is not well understood. Consequently, there is limited insight into the competitiveness of biobased feedstocks based on sugar beets compared to alternatives such as sugar cane from Brazil, corn (dextrose) from the US and tapioca (starch) from South-East Asia.
Yet a number of stakeholders have shown a shared interest in receiving fact-based answers to the following questions:• What is the supply/demand balance for biobased products and feedstocks (cost-price curves)?• What are the current and projected availability and prices of major feedstocks in the global market?• What are the primary fermentation processing options?• What are the key uncertainties and sensitivities?• What is the competitive position of North-West Europe in the ARRRA cluster?
“IT meets Telecom” – The case of ICTIt is always hard to predict the future, especially when it comes to the impact of new technologies on industry sectors. Who could have predicted 25 years ago that IT and Telecommunication would merge to create ICT? Telecom was firmly analogue and IT was digital. As Rudyard Kipling said about the East and West: “Never the twain shall meet.” But how fast things have moved since analysts first observed that the Telecom sector was experimenting with digital technology. They understood that IT and Telecom would soon merge into something new and amazing. Indeed, the millennial generation is blissfully unaware of life before ICT. As soon as the markets appreciated what was going on, investment money flowed into new companies that straddled IT and Telecom. A new industry emerged and some giants in IT and Telecom were sidelined.
Do we have a comparable situation with Agri and Chemicals today?

7
First and second generation technology Fermentation is currently based on processing C6 sugars (C6H12O6) while the commercial processing of C5 sugars is still in early stages of development. Depending on the crop, sugars can originate directly from the crop itself or from starch or cellulosic material. Starch and cellulosic material require hydrolysis and enzymes to break the material down into sugars before the fermentation step, as shown in the figure below. This process is commercially viable for starches.
Cellulosic material can and will be a source of carbohydrates for chemicals in the future, but is not a commercially viable process today
The process of converting cellulosic material is more
complex, so it is not yet used on a commercial scale. It will
require continued technological advancements and reduced
costs to become profitable
Cellulosic materials (wood, paper waste, food residue, etc.)
Sugars
Hydrolysis of cellulose
Hydrolysis of starch
Fermentation Commercially viable and
in operation today
Source: Industry expert interviews, Deloitte Analysis
Starchy crops (e.g. cassava, wheat, corn)
Sugar cane, sugar beet
Sugar production
Starch production
Starch
Sugar
Cellulosic residue
Figure 5 – Production of fermentation inputs from cellulosic material and starches
However, the process of converting cellulosic material is more complex and not yet used on a commercial scale. It will require continued technological advancements and reduced costs to become profitable. Project Liberty, a JV of DSM-POET in the US, aims to show the commercial viability of large-scale production of cellulosic bio-ethanol. The facility opened in September of 2014. The term second generation can be misleading since it applies to the pre-processing of cellulosic materials to produce sugars. First- and second-generation products both use fermentation to convert sugars but rather than using the sugars directly from the crops, second generation products use the “waste” of the crop, i.e. the cellulose.
Of course, the stated ambition of brand-owners and many chemical companies is to drive second or next-generation technologies based on various types of biomass, even though fermentation-based chemicals require relatively insignificant amounts of biobased feedstocks compared to fuels. Given the limited and decreasing availability of arable and fertile land, the effective and efficient use of biomass is rightfully high on the agenda of the biotechnology industry.
8
In light of the current commercial status of and limited data for next-generation fermentation, this study does not cover cellulosic materials and their processing. A description of the different isomers of sugar, starch and cellulose, and next generation fermentation using hemicelluloses and C5 sugars is available in the appendix.
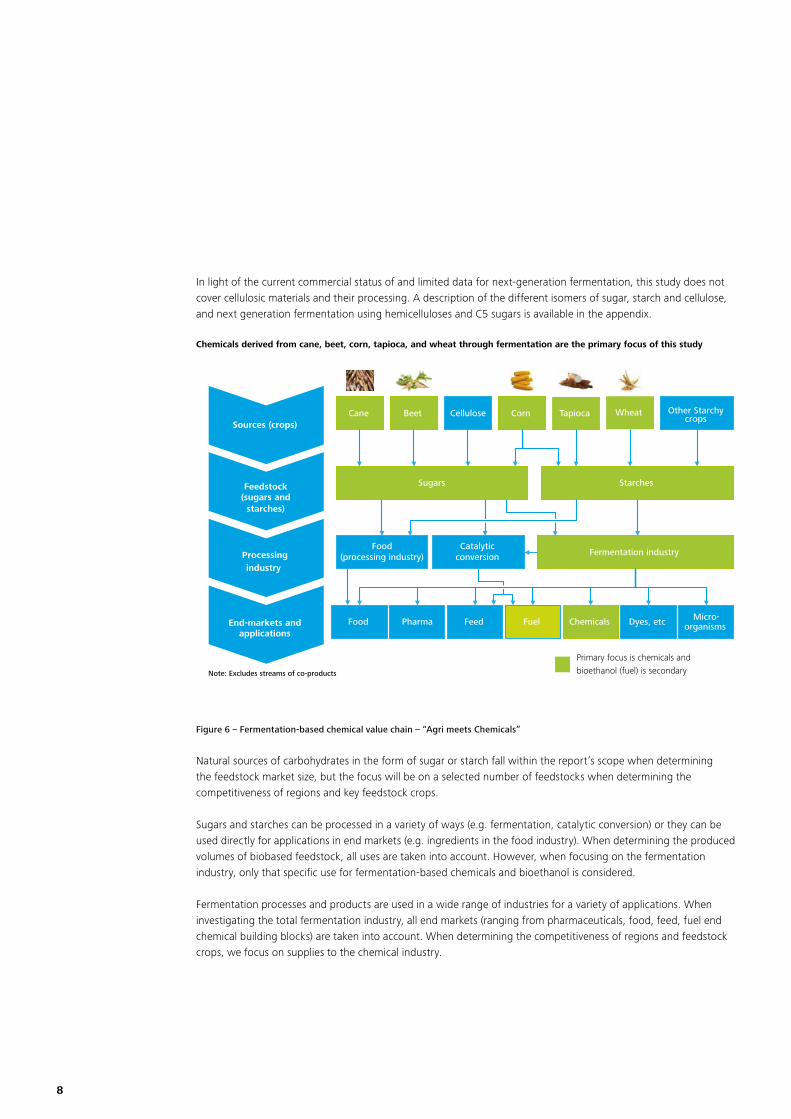
Chemicals derived from cane, beet, corn, tapioca, and wheat through fermentation are the primary focus of this study
Note: Excludes streams of co-products
Sources (crops)
Feedstock (sugars and
starches)
Processing industry
End-markets and applications
Cane Beet Corn Tapioca Other Starchy crops
Food(processing industry) Fermentation industry
Pharma Fuel Chemicals Food Feed Dyes, etc Micro-organisms
Catalytic conversion
Sugars Starches
Wheat
Primary focus is chemicals and bioethanol (fuel) is secondary
Cellulose
Figure 6 – Fermentation-based chemical value chain – “Agri meets Chemicals”
Natural sources of carbohydrates in the form of sugar or starch fall within the report’s scope when determining the feedstock market size, but the focus will be on a selected number of feedstocks when determining the competitiveness of regions and key feedstock crops.
Sugars and starches can be processed in a variety of ways (e.g. fermentation, catalytic conversion) or they can be used directly for applications in end markets (e.g. ingredients in the food industry). When determining the produced volumes of biobased feedstock, all uses are taken into account. However, when focusing on the fermentation industry, only that specific use for fermentation-based chemicals and bioethanol is considered.
Fermentation processes and products are used in a wide range of industries for a variety of applications. When investigating the total fermentation industry, all end markets (ranging from pharmaceuticals, food, feed, fuel end chemical building blocks) are taken into account. When determining the competitiveness of regions and feedstock crops, we focus on supplies to the chemical industry.

9
With a significantly higher added value than ethanol, the land use for biobased chemicals is very small compared to the global land use
141146108
2020 2030**
+4%
2013
Land use ethanol (mln ha)* Added value ethanol (bn USD)
Land use functional molecules (mln ha)* Added value functional molecules (bn USD)
2030** 2013 2020
241
1912
2030** 2020 2013
+7%
2013 2020 2030**
0.1% 2.0%
x.x%
0.2%
1.5% 2.0% 2.0%
+29%30
22
+7%
+29%
0%3031
23
+4% 0%
= Fraction of global use of arable land***
*** Land use is based on weighed average land use of sugar cane and sugar beet;*** 2030 target is based on a scenario where 30% of petro chemicals is substituted by agri feedstock; *** Arable land is the land under temporary agricultural crops (multiple-cropped areas are counted only
once), temporary meadows for mowing or pasture, land under market and kitchen gardens and land temporarily fallow (less than five years). The abandoned land resulting from shifting cultivation is not included in this category. Data for “Arable land” are not meant to indicate the amount of land that is potentially cultivable. Data are expressed in 1000 hectares.
Source:BCC Research, FO Licht Renewable Chemicals Database, NOVA Institut, FAO/OECD, Deloitte Analysis, Rabobank Analysis
Figure 7 – Land use and added value for fuel and functional molecules in 2013, 2020 and 2030 (mln ha and bn USD)
The “4Fs”: Food, Feed, Fuel and Functional Molecules
Development of crops for functional molecules, biomaterials, biochemicals and nutraceuticals is good for society at large. The footprint of biobased chemicals is lower than that of fossil-based alternatives. Furthermore, it is beneficial for farmers; the higher added value of chemicals may help to increase farm income per hectare. More income per hectare stimulates agricultural productivity. Underinvestment due to low margins is the main reason behind the low productivity in many parts of the world. A higher farm income may also revitalize rural areas and limit the migration of the rural poor to the world’s mega cities.
Arable land is limited; we have on our planet approximately 1,5 billion hectares available. Agriculture can never produce enough biomass to still the world’s hunger for energy and hence is not the cure for our reliance on oil. The calorific value of current global agricultural production is less than one third of global energy demand (13 bn ton oil equivalent, IEA 2014), barely enough to satisfy global transport fuel demand.
However agriculture can easily provide enough feedstock to the chemical industry without jeopardizing food production. Current demand for petrochemicals is only 300 mln ton per annum. Replacing all petrochemicals would require just 5% of agricultural biomass production and global arable land. This is about 60 times less than what would be required to replace all fossil energy. Besides, in terms of market value per ton, chemicals are on average priced 15 times higher than energy.
10
Given the ongoing debate about the appropriate use of agricultural products for purposes other than food and feed, it is helpful to get a balanced perspective on the use of agricultural crops and biomass for biobased chemicals. Our analysis underscores three main points: • While the added-value for biobased chemicals is high, crop and land use are very small compared to food, feed
and fuel, and this will remain the case• The fermentation-based chemical industry, while growing, is very small compared to petrochemicals• Oil and gas are used mainly for energy; only a small part is used for chemicals – approx. 4% and another 4% for
the energy required to make the chemicals, whereas the total added value for chemicals is comparable
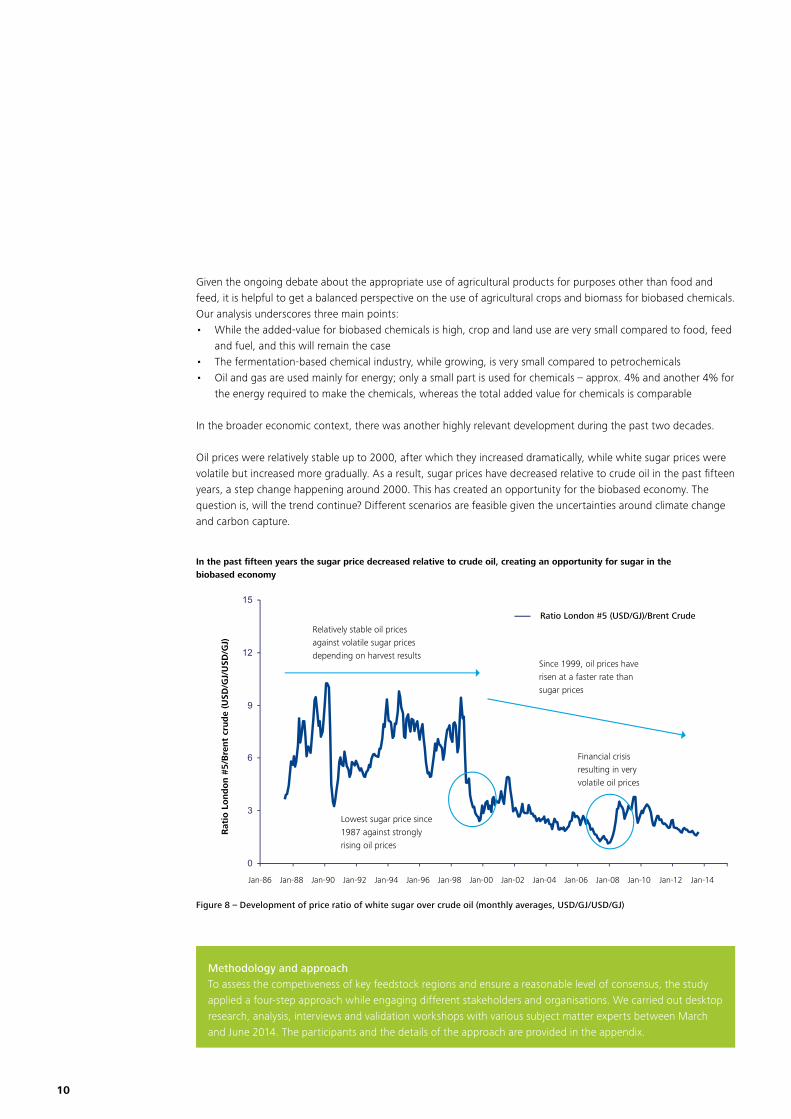
In the broader economic context, there was another highly relevant development during the past two decades.
Oil prices were relatively stable up to 2000, after which they increased dramatically, while white sugar prices were volatile but increased more gradually. As a result, sugar prices have decreased relative to crude oil in the past fifteen years, a step change happening around 2000. This has created an opportunity for the biobased economy. The question is, will the trend continue? Different scenarios are feasible given the uncertainties around climate change and carbon capture.
In the past fifteen years the sugar price decreased relative to crude oil, creating an opportunity for sugar in the biobased economy
0
3
6
9
12
15
Jan-86 Jan-88 Jan-90 Jan-92 Jan-94 Jan-96 Jan-98 Jan-00 Jan-02 Jan-04 Jan-06 Jan-08
Ratio London #5 (USD/GJ)/Brent Crude
Relatively stable oil prices against volatile sugar prices depending on harvest results
Lowest sugar price since 1987 against strongly rising oil prices
Financial crisis resulting in very volatile oil prices
Since 1999, oil prices have risen at a faster rate than sugar prices
Jan-10 Jan-12 Jan-14
Rat
io L
ond
on #
5/B
rent
crud
e (U
SD/G
J/U
SD/G
J)
Figure 8 – Development of price ratio of white sugar over crude oil (monthly averages, USD/GJ/USD/GJ)
Methodology and approachTo assess the competiveness of key feedstock regions and ensure a reasonable level of consensus, the study applied a four-step approach while engaging different stakeholders and organisations. We carried out desktop research, analysis, interviews and validation workshops with various subject matter experts between March and June 2014. The participants and the details of the approach are provided in the appendix.

11
2. The global fermentation market is valued at 127 bn dollar and expected to grow above GDP
Industrial fermentation is a complex, multi-step process that converts sugars, starches and cellulosic material into food, feed, fuel and other industrial products. The conversion uses enzymes or micro-organisms such as yeasts and algea, which may be genetically modified, and takes place in bioreactors or fermentors. Subsequent down-stream processing is typically required to isoloate and purify the target product. C6 sugars can be isolated directly from some crops such as cane and sugar beets or indirectly from starches in crops such as tapioca, wheat or corn by using enzymatic hydrolyis as a pre-processing step. However, the isolation of C5 and C6 sugars from cellulosic materials and the separation from lignine is more complex and requires breakthroughs in pre-treatment and enzyme technologies.
The Figure 9 below shows that eight product groups are currently produced commercially using a fermentation process. Several other product groups are in development phases, ranging from analysis to testing. This study excludes the industrial production of yeast and other micro-organisms.
Currently eight key categories of molecules or compounds are produced commercially and ample opportunities for future developments exist
*Selection based on interviews and in-depth research that showed these products are currently produced on a very small scale, e.g. farnasene is produced on laboratory scale of appr. 0.04 million tons per yearNote: Yeasts and other microorganisms excluded from the scope of this studySource: BCC Research, FO Licht Renewable Chemicals Database, Deloitte Analysis
•Ethanol •Butanol •BDO •Acetone
Amino acids
Organic acids
Biogas Industrial enzymes
Polymers
Vitamins
Anti- biotics
Alcohols &
Ketones
Currently commercial fermentation processes
•MSG •Lysine •Threonine •Tryptophan
•Citric •Lactic •Succinic
•Methane
•Xanthan •PHA
•Vitamin C •Vitamin B2 •Vitamin B12
•Beta-lactam •Tetracycline •Clavulic
acid
•Amylase •Cellulase •Lipase •Protease
Selection of future developments based on current research (ranging from theoretical research to testing plant phase)*
•Nonane •Tetra-
decane Olefins Amines Esters Alkanes
•Butadiene •Isoprene •Propene •Farnesene
•Histamine •Tyramine
•Malonyl -ACP
Dyes
•Various dyes (e.g. Indigo)
Microbial oils
•Biodiesel
Figure 9 – Fermentation molecules and a selection of representative compounds
Market sizing approachFermentation as a process is not commonly described as a separate market. However, to identify key opportunities for bio-based feedstocks, we identified the key products and processes that are fermentation-based. For each of these products, their market size in tons of product is known. The theoretical yield of a product from glucose can be calculated based on the reaction stoichiometry (see appendix). Using this maximum theoretical yield, the carbohydrate equivalent (CHEQ) has been determined to aggregate results. Due to the use of the maximum theoretical yield, volumes in CHEQ are likely to be underestimated.
12
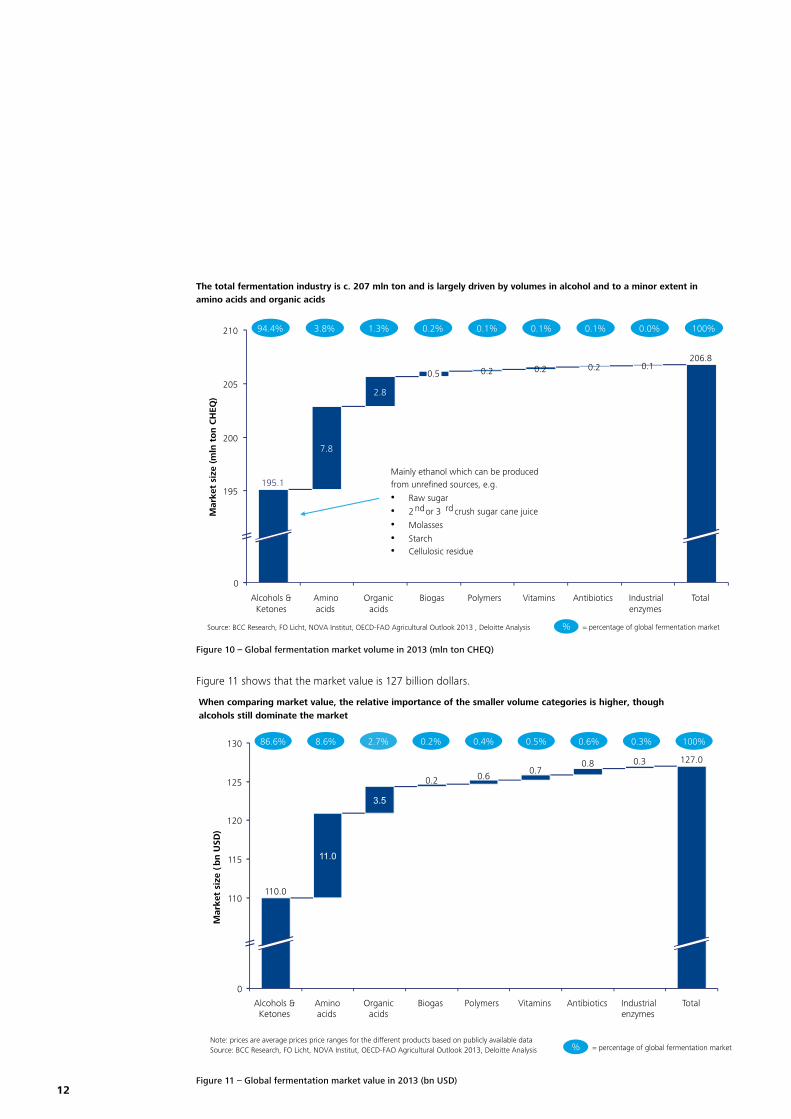
The total fermentation industry is c. 207 mln ton and is largely driven by volumes in alcohol and to a minor extent in amino acids and organic acids
Source: BCC Research, FO Licht, NOVA Institut, OECD-FAO Agricultural Outlook 2013 , Deloitte Analysis = percentage of global fermentation market
205
210
195
0
200
0.1 0.2
Vitamins Polymers
0.2
Antibiotics
7.8
195.1
Amino acids
0.2
2.8
Alcohols & Ketones
Organic acids
Biogas Total Industrial enzymes
206.8
Mar
ket
size
(m
ln t
on C
HEQ
)
94.4% 3.8% 1.3% 0.2% 0.1% 0.1% 0.1% 0.0%
Mainly ethanol which can be produced from unrefined sources, e.g.
• Raw sugar
• 2 nd or 3 rd crush sugar cane juice
• Molasses
• Starch • Cellulosic residue
100%
0.5
%
Figure 10 – Global fermentation market volume in 2013 (mln ton CHEQ)
Figure 11 shows that the market value is 127 billion dollars.
When comparing market value, the relative importance of the smaller volume categories is higher, though alcohols still dominate the market
Note: prices are average prices price ranges for the different products based on publicly available dataSource: BCC Research, FO Licht, NOVA Institut, OECD-FAO Agricultural Outlook 2013, Deloitte Analysis = percentage of global fermentation market%
Mar
ket
size
(b
n U
SD)
86.6% 100% 8.6% 2.7% 0.2% 0.4% 0.5% 0.6% 0.3%
125
120
115
0
110
130
Biogas
3.5
Organic acids
11.0
0.2
0.7
Alcohols & Ketones
110.0
Vitamins
0.8
Antibiotics Industrial enzymes
Total
127.0 0.3
0.6
Polymers Amino acids
Figure 11 – Global fermentation market value in 2013 (bn USD)
13
The total volume of products currently being produced commercially is 207 million tons in terms of CHEQ, as shown in figure 10. Figure 11 shows that the market value is 127 billion dollars. Alcohols and ketones amount to 94,4% of the total fermentation market in terms of volume. In terms of value in dollars this is 86,6%.
The market is dominated by alcohols, especially ethanol, in terms of volume and market value. The higher market price and added-value of the other product segments, i.e. non-alcohols, make their share of the value somewhat higher, 5.6% vs 13.4 %. In volume terms, the fermentation industry, excluding alcohols, requires over 11.6 million tons of CHEQ to build a market of 17.1 billion dollars. Key products include lysine, MSG and glutamic acid (all amino acids), citric acid and lactic acid (organic acids), methane (biogas) and xanthan (polymers). Not all product groups are used in the chemical industry. Some (amino acids, vitamins, antibiotics) are used mostly by the food and pharmaceutical industry.
The growth outlook for the fermentation market as a whole is driven largely by the expectation of what will happen to bioethanol, which in turn depends strongly on the blending mandates in the US and the petrol/bioethanol policies in Brazil. Growth in the non-alcohols is expected to hit 6.5% annually until 2020, but key uncertainties in technological advancement and the market acceptance of biobased fermentation products exist. The largest growth is expected in polymers and organic acids.
Market studies show a projected base case growth of 5% CAGR with alcohols staying the key segment and polymers showing the highest growth
Note: 2020 outlook is based on available predictions where possible and extrapolation in case no explicit predictions are availableSource: BCC Research, FO Licht Renewable Chemicals Database, NOVA Institut, OECD-FAO Agricultural Outlook 2013, Novozyme 2013 Annual report, DSM Factbook 2014, Deloitte Analysis
300
250
50
100
200
150
0
4.6% 282.6
206.8
2013 2020
195.1
11.6
18.1
264.5
20
15
10
5
0
0.2
0.1
7.8
0.1
0.5 0.2 0.2
2013
11.6
2.8
6.5%
2020
18.1
11.4
5.0
0.7 0.5 0.2
0.2
Amino acids 5.6% Org. acids 8.8%
Biogas 5.0%
Polymers 13.5%
Vitamins 2.6%
Antibiotics 4.0%
Ind. enzymes 8.0%
Alcohols 4.4% Non-Alcohols 6.5%
Total Non-alcohols
Highest growth in polymers and organic acids
Mar
ket
size
(mln
ton
CH
EQ)
Figure 12 – Global fermentation market growth in 2013-2020 (mln ton CHEQ)

14
3. The attractiveness of the fermentation-based chemical industry depends on end-markets and alternative feedstocks price levels as well as product yields
To evaluate the attractiveness of biobased feedstocks and the fermentation-based chemical industry, several criteria are relevant. These fall broadly into two main categories: financial and non-financial. This study explores the financial aspects although the non-financial criteria turn out to be equally important. Drivers are growth and sales price developments in the end-markets, the availability and prices of alternative feedstocks, as well as the product yield of the fermentation process.
Financial criteriaThe business case for biobased production clearly needs to be proved on a case-by-case basis. As part of the private and confidential part of this study, we therefore developed a model to evaluate the financial returns based on specific input parameters.
The economic feasibility is driven largely by the projected actual yield of the fermentation process and its various costs, such as energy, utilities and capital costs. The feedstock cost (i.e. the market price) is typically dictated by global commodity markets and can therefore be influenced to a lesser extent. Prices for pharmaceutical products, nutraceuticals and nutritional product ingredients are usually much higher than feed and fuel prices. Price setting depends on the availability of alternatives to buyers and additional product characteristics compared to these fossil-based alternatives. A ‘green premium’ is often only found when CO2 tax credits or similar measures are in place or when consumers are willing to pay extra for a green brand.
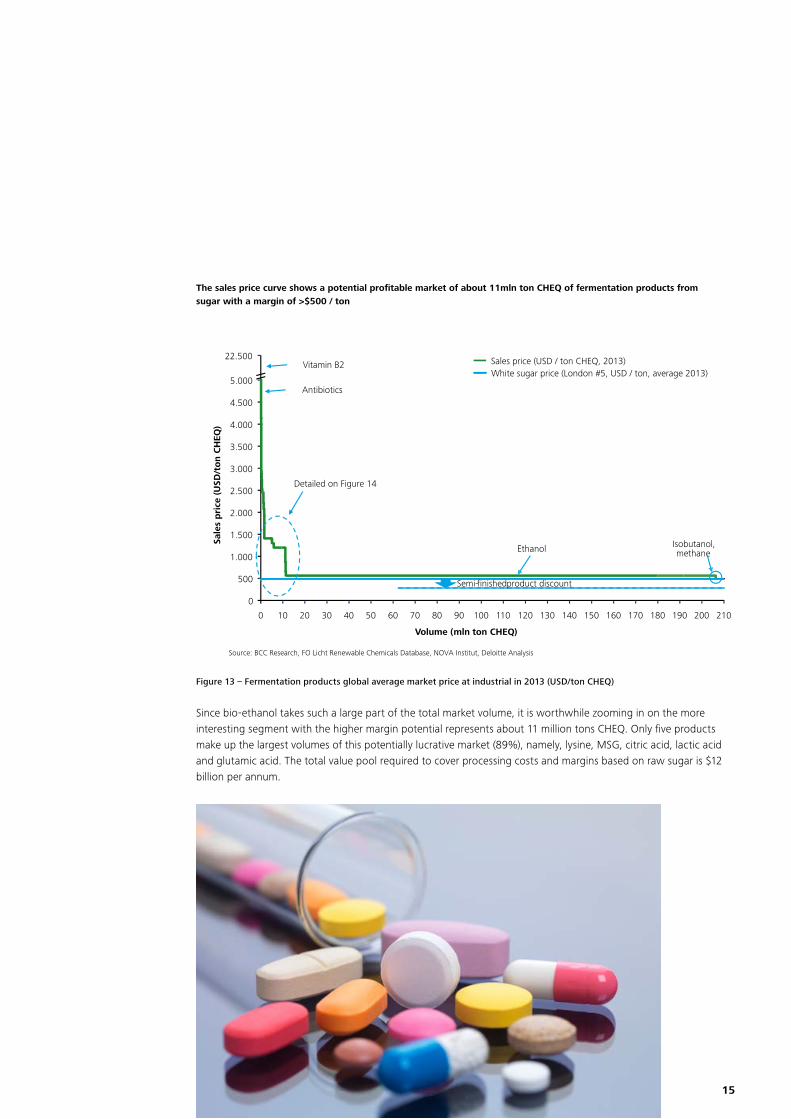
The sales price curve in the diagram below shows a potentially profitable market of about 11 million tons (in CHEQ) of fermentation products produced from sugar, with a margin of more than $500 per ton. The total value pool required to cover processing costs and margins based on raw sugar is $26 billion per annum. This excludes further processing into products such as PE, PET, PLA, etc.
The economic success of the product, which is discussed in more detail later in the report, depends on two aspects: the fermentation process’ starting point and the feedstock’s required purity for fermentation in the bioreactor. Consequently, instead of working with sugar and paying the white sugar price, it may be better working with semi-finished products, using the discount to create additional margin through a backward-integrated fermentation process. Clearly, there is a trade-off since this approach may require the elimination of impurities. The effective use of side streams and sale of the by-products is also an important factor in overall profitability.
15
The sales price curve shows a potential profitable market of about 11mln ton CHEQ of fermentation products from sugar with a margin of >$500 / ton
Source: BCC Research, FO Licht Renewable Chemicals Database, NOVA Institut, Deloitte Analysis
4.000
0
5.000
200 160 120
2.500
140 110
4.500
180 90 80 130 170 100 70 30
22.500
50 40
3.500
2.000
500
1.500
60 210 0 10 20 190
3.000
150
1.000
Sale
s p
rice
(U
SD/t
on C
HEQ
)
Ethanol
Vitamin B2
Antibiotics
Sales price (USD / ton CHEQ, 2013) White sugar price (London #5, USD / ton, average 2013)
Detailed on Figure 14
Isobutanol,methane
Semi-finished product discount
Volume (mln ton CHEQ)
Figure 13 – Fermentation products global average market price at industrial in 2013 (USD/ton CHEQ)
Since bio-ethanol takes such a large part of the total market volume, it is worthwhile zooming in on the more interesting segment with the higher margin potential represents about 11 million tons CHEQ. Only five products make up the largest volumes of this potentially lucrative market (89%), namely, lysine, MSG, citric acid, lactic acid and glutamic acid. The total value pool required to cover processing costs and margins based on raw sugar is $12 billion per annum.
16
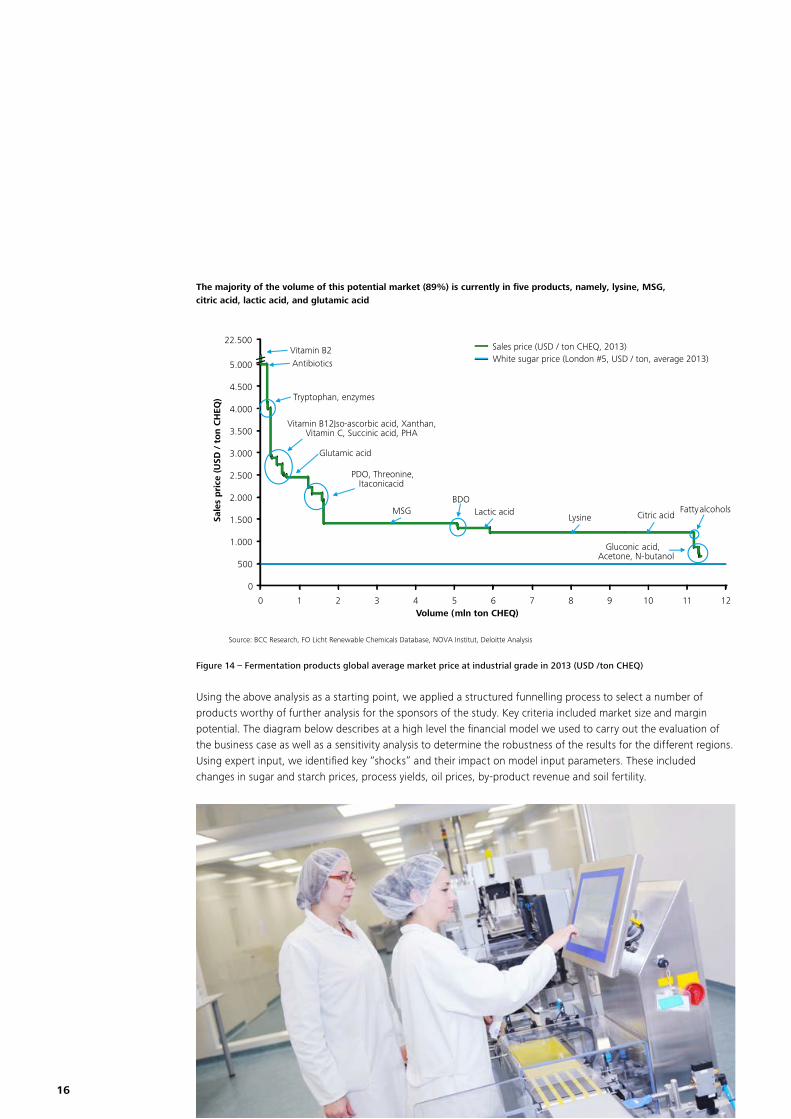
The majority of the volume of this potential market (89%) is currently in five products, namely, lysine, MSG, citric acid, lactic acid, and glutamic acid
Source: BCC Research, FO Licht Renewable Chemicals Database, NOVA Institut, Deloitte Analysis
12
0
11 10 9 8 7 3 2 4
500
1.000
1
4.500
1.500
2.000
5
2.500
0
3.000
5.000
6
3.500
4.000
22.500
Volume (mln ton CHEQ)
Sale
s p
rice
(U
SD /
to
n C
HEQ
)
Vitamin B2 Antibiotics
Sales price (USD / ton CHEQ, 2013) White sugar price (London #5, USD / ton, average 2013)
Glutamic acid
MSG Citric acid
PDO, Threonine, Itaconic acid
Vitamin B12, Iso-ascorbic acid, Xanthan, Vitamin C, Succinic acid, PHA
Tryptophan, enzymes
Gluconic acid, Acetone, N-butanol
Lysine Fatty alcohols
BDO Lactic acid
Figure 14 – Fermentation products global average market price at industrial grade in 2013 (USD /ton CHEQ)
Using the above analysis as a starting point, we applied a structured funnelling process to select a number of products worthy of further analysis for the sponsors of the study. Key criteria included market size and margin potential. The diagram below describes at a high level the financial model we used to carry out the evaluation of the business case as well as a sensitivity analysis to determine the robustness of the results for the different regions. Using expert input, we identified key “shocks” and their impact on model input parameters. These included changes in sugar and starch prices, process yields, oil prices, by-product revenue and soil fertility.
17
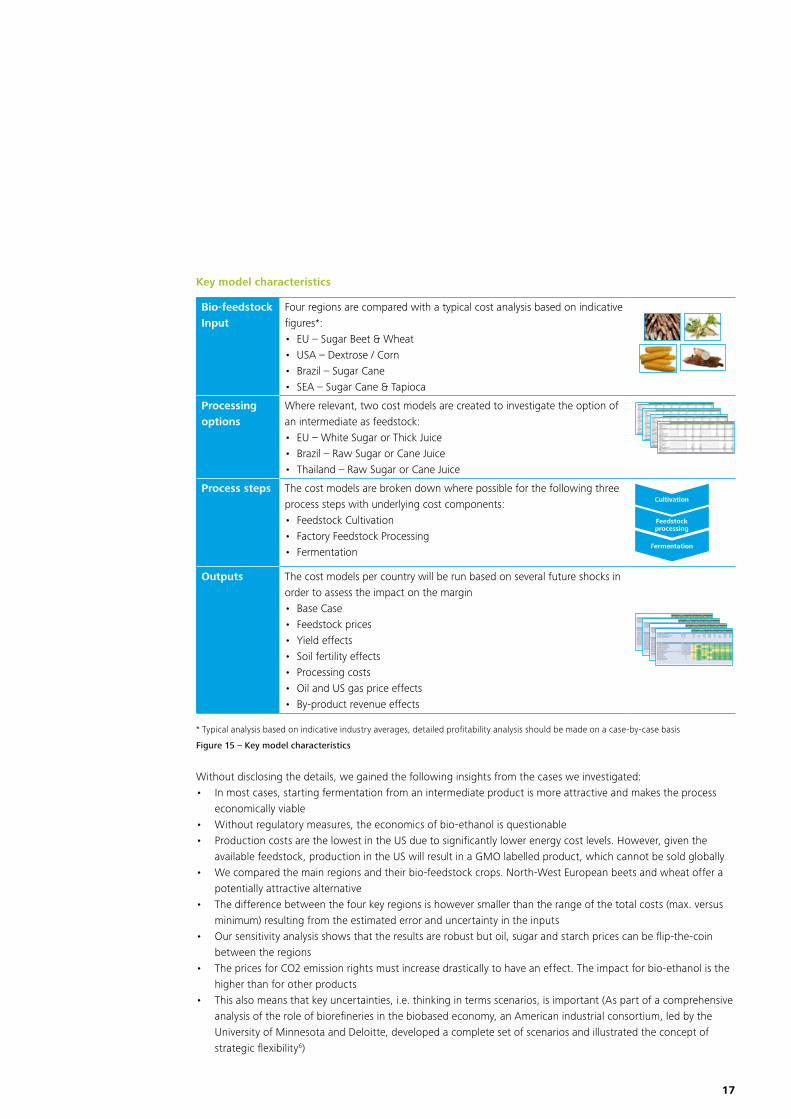
Key model characteristics
Bio-feedstock Input
Four regions are compared with a typical cost analysis based on indicative figures*:• EU – Sugar Beet & Wheat• USA – Dextrose / Corn• Brazil – Sugar Cane• SEA – Sugar Cane & Tapioca
Processing options
Where relevant, two cost models are created to investigate the option of an intermediate as feedstock: • EU – White Sugar or Thick Juice• Brazil – Raw Sugar or Cane Juice• Thailand – Raw Sugar or Cane Juice
Process steps The cost models are broken down where possible for the following three process steps with underlying cost components:• Feedstock Cultivation• Factory Feedstock Processing• Fermentation
Cultivation
Feedstock processing
Fermentation
Outputs The cost models per country will be run based on several future shocks in order to assess the impact on the margin• Base Case• Feedstock prices• Yield effects• Soil fertility effects• Processing costs• Oil and US gas price effects• By-product revenue effects
* Typical analysis based on indicative industry averages, detailed profitability analysis should be made on a case-by-case basis
Figure 15 – Key model characteristics
Without disclosing the details, we gained the following insights from the cases we investigated:• In most cases, starting fermentation from an intermediate product is more attractive and makes the process
economically viable• Without regulatory measures, the economics of bio-ethanol is questionable• Production costs are the lowest in the US due to significantly lower energy cost levels. However, given the
available feedstock, production in the US will result in a GMO labelled product, which cannot be sold globally• We compared the main regions and their bio-feedstock crops. North-West European beets and wheat offer a
potentially attractive alternative• The difference between the four key regions is however smaller than the range of the total costs (max. versus
minimum) resulting from the estimated error and uncertainty in the inputs• Our sensitivity analysis shows that the results are robust but oil, sugar and starch prices can be flip-the-coin
between the regions• The prices for CO2 emission rights must increase drastically to have an effect. The impact for bio-ethanol is the
higher than for other products• This also means that key uncertainties, i.e. thinking in terms scenarios, is important (As part of a comprehensive
analysis of the role of biorefineries in the biobased economy, an American industrial consortium, led by the University of Minnesota and Deloitte, developed a complete set of scenarios and illustrated the concept of strategic flexibility6)
18
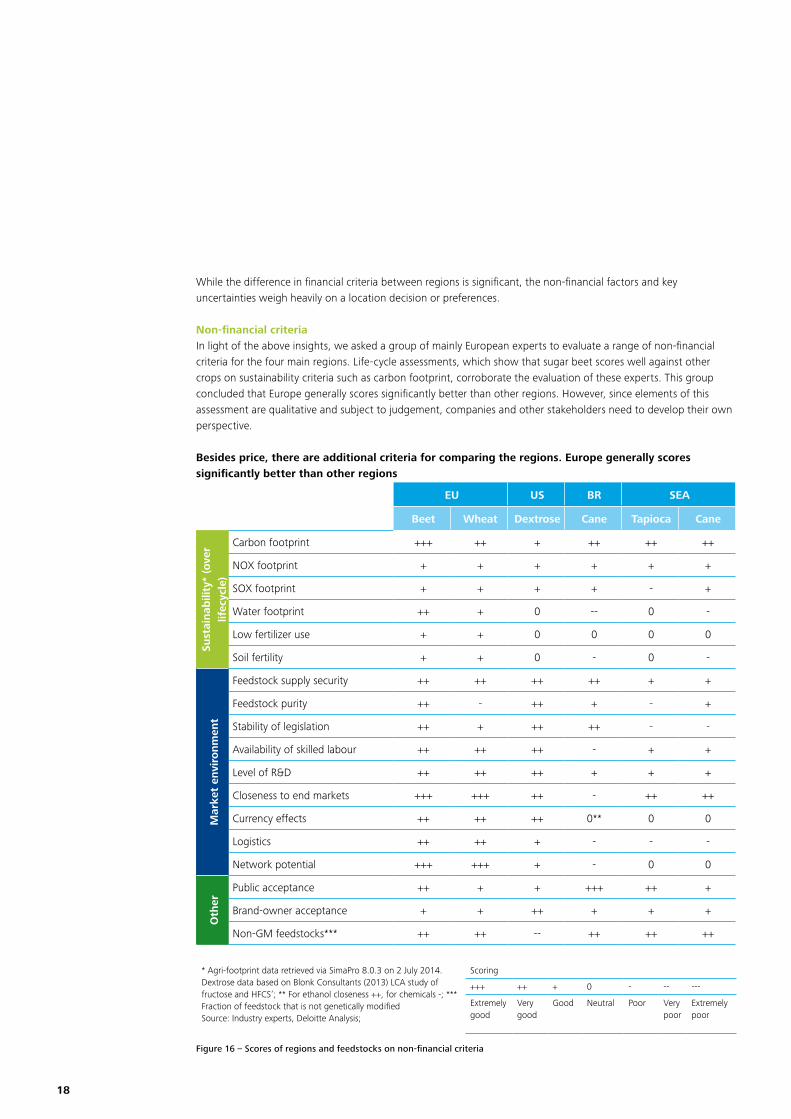
While the difference in financial criteria between regions is significant, the non-financial factors and key uncertainties weigh heavily on a location decision or preferences.
Non-financial criteriaIn light of the above insights, we asked a group of mainly European experts to evaluate a range of non-financial criteria for the four main regions. Life-cycle assessments, which show that sugar beet scores well against other crops on sustainability criteria such as carbon footprint, corroborate the evaluation of these experts. This group concluded that Europe generally scores significantly better than other regions. However, since elements of this assessment are qualitative and subject to judgement, companies and other stakeholders need to develop their own perspective.
Besides price, there are additional criteria for comparing the regions. Europe generally scores significantly better than other regions
EU US BR SEA
Beet Wheat Dextrose Cane Tapioca Cane
Sust
ainab
ility
* (o
ver
lifec
ycle
)
Carbon footprint +++ ++ + ++ ++ ++
NOX footprint + + + + + +
SOX footprint + + + + - +
Water footprint ++ + 0 -- 0 -
Low fertilizer use + + 0 0 0 0
Soil fertility + + 0 - 0 -
Mar
ket
envi
ronm
ent
Feedstock supply security ++ ++ ++ ++ + +
Feedstock purity ++ - ++ + - +
Stability of legislation ++ + ++ ++ - -
Availability of skilled labour ++ ++ ++ - + +
Level of R&D ++ ++ ++ + + +
Closeness to end markets +++ +++ ++ - ++ ++
Currency effects ++ ++ ++ 0** 0 0
Logistics ++ ++ + - - -
Network potential +++ +++ + - 0 0
Oth
er
Public acceptance ++ + + +++ ++ +
Brand-owner acceptance + + ++ + + +
Non-GM feedstocks*** ++ ++ -- ++ ++ ++
* Agri-footprint data retrieved via SimaPro 8.0.3 on 2 July 2014. Dextrose data based on Blonk Consultants (2013) LCA study of fructose and HFCS‘; ** For ethanol closeness ++, for chemicals -; *** Fraction of feedstock that is not genetically modifiedSource: Industry experts, Deloitte Analysis;
Scoring
+++ ++ + 0 - -- ---
Extremely good
Verygood
Good Neutral Poor Verypoor
Extremely poor
Figure 16 – Scores of regions and feedstocks on non-financial criteria

19
4. Key feedstocks in the US, Brazil, South-East Asia and North-West Europe include sugars and starches from cane, beet, tapioca and corn
This section identifies the main regions and crops for the fermentation industry and explores some of the pricing dynamics.
The top four crops for the fermentation industry are cane, beet, tapioca and corn. Every year, 5.5 billion tons of crops are grown, containing 2.4 billion tons of carbohydrate. In fact, 61% of crops contain 89% of the global carbohydrate (CHEQ) supply in starch. Together, the top four crops add up to 75% of the volume, generating 80% of the global carbohydrate production. The diagram below illustrates the significant variance in the percentage of carbohydrates (CHEQ) compared to crop volumes.
Annually 5.5 bn ton crops are grown containing 2.4 bn ton carbohydrate; 61% of the crops contain 89% of the global carbohydrate supply in starch
* Other coarse grains includes millet, oats, rye, triticale, buckwheat, fonio, canary seed, and quinoa; ** Other roots & tubers includes sweet potatoes, yams, taro, and yautiaNote: figures include mentioned sources of carbohydrates only; Source: FAO, USDA nutrient database, Deloitte Analysis
4%
0%
40%
20%
100%
80%
60%
Corn starch 27%
3%
Rice starch 23%
Sugar 11%
2,388
2%
Starch 89%
Wheat starch 21%
4%
2,388
Cane sugar 9%
5%
7%
40%
20%
80%
0%
100%
60%
5,457 5,457
Sugar crops 39%
Corn kernel 16%
Starch crops 61%
Rice kernel 13%
Wheat kernel 12%
Sugar cane 34%
2%
Global supply of carbohydrates (mln ton CHEQ, 2012)
Global supply of harvested crops containing carbohydrates (mln ton crop, 2012)
Sugar beet Potatoes
Sugar cane Sorghum
Cassava
Barley
Corn Wheat
Rice Other coarse grains*
Other roots & tubers **
Figure 17 – Global supply of harvested crops and carbohydrates in 2012 (mln ton)

20
The study focuses on the regions with the highest concentration of carbohydrates of interest to the fermentation industry
* Other coarse grains includes millet, oats, rye, triticale, buckwheat, fonio, canary seed, and quinoa; ** Other roots & tubers includes sweet potatoes, yams, taro, and yautiaSource: OECD-FAO Agricultural Outlook 2013, USDA nutrient database, Deloitte Analysis
Study focus
Total: 2,4 mln ton CHEQ
24% 28%18%
24%
41%
31%
9%5%
11% 12%
21%14%
19%
12%
11%
11%
7%
20%
41%
15%
43%34%
23%17%
38%
23%
61%52%
42%
70%
41%48%
54%
4%7%
26%
10%
30%5%
9%
39%
8%
0%
25%
50%
75%
100%
Potatoes
98
4%
64 100 224
Barley Cassava Wheat
507
Sugar cane
4%
4%
43
Sugar beet
37
Sorghum Other roots
& tubers**
50
Other coarse grains*
66
4%
648 552
Rice Corn
3%
EU
SEA
BR
RoW
India
China
US
Figure 18 – Global production of carbohydrate feedstocks per region in 2012 (mln ton CHEQ)
Globally, four key regions emerge for the biobased fermentation industry: • The US: corn• Brazil: sugar cane• South-East Asia (Thailand, Malaysia): tapioca and/or sugar cane • North-West Europe: sugar beet and wheat
These regions produce sufficient volumes at the most competitive cost levels for their feedstock. Alternative feedstock includes cellulosic material to be processed into sugar by hydrolysis through the use of acids. Therefore, the study focuses on the regions with the highest concentration of carbohydrates that are of interest to the fermentation industry.
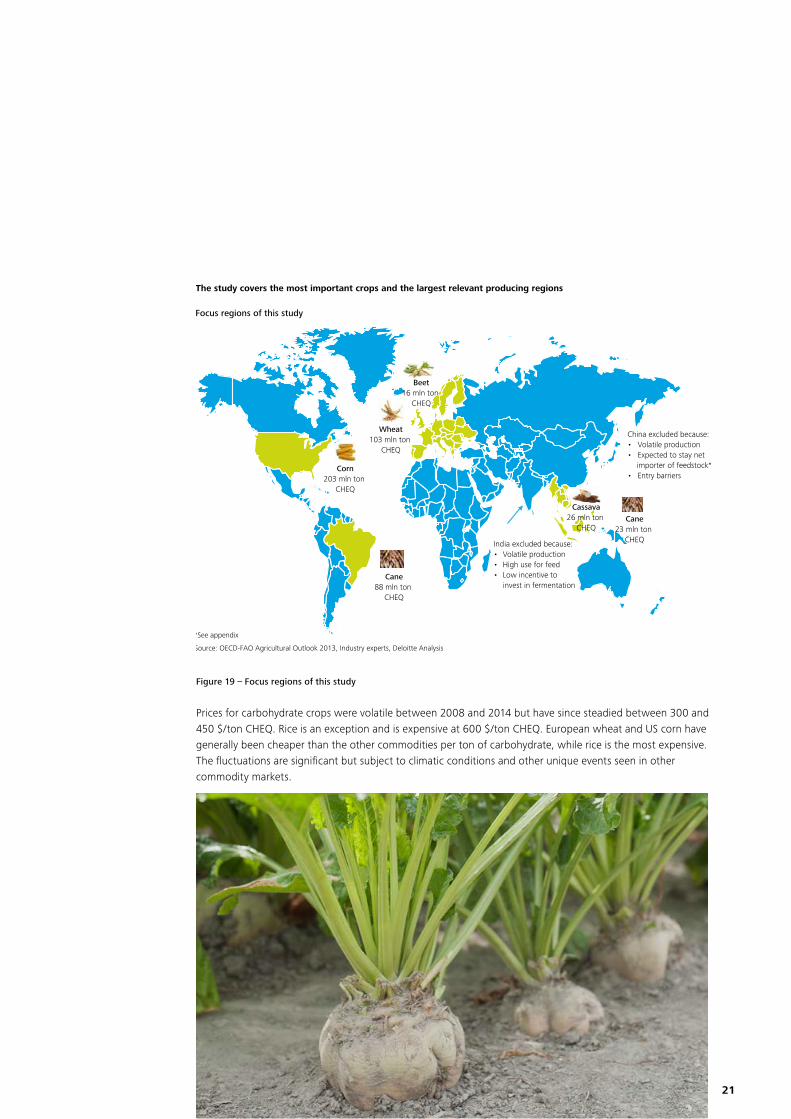
21
The study covers the most important crops and the largest relevant producing regions
*See appendix
Source: OECD-FAO Agricultural Outlook 2013, Industry experts, Deloitte Analysis
Focus regions of this study
Corn203 mln ton
CHEQ
Cane88 mln ton
CHEQ
Wheat103 mln ton
CHEQ
India excluded because:• Volatile production• High use for feed• Low incentive to
invest in fermentation
Cassava26 mln ton
CHEQCane
23 mln ton CHEQ
China excluded because:• Volatile production• Expected to stay net
importer of feedstock*• Entry barriers
Beet16 mln ton
CHEQ
Figure 19 – Focus regions of this study
Prices for carbohydrate crops were volatile between 2008 and 2014 but have since steadied between 300 and 450 $/ton CHEQ. Rice is an exception and is expensive at 600 $/ton CHEQ. European wheat and US corn have generally been cheaper than the other commodities per ton of carbohydrate, while rice is the most expensive. The fluctuations are significant but subject to climatic conditions and other unique events seen in other commodity markets.

22
387 419480
European wheat and US corn have generally been cheaper than the other commodities per ton carbohydrate, while rice is the most expensive
Note: Wheat, corn, and rice prices exclude processing costs of freeing starch, processing costs are an estimated $50 – 100 per ton starch
Source: FO Licht, Bloomberg, Oanda, Indexmundi, USDA nutrient database, Deloitte Analysis
0
500
1.000
1.500
2016 2014 2012 2010 2008
US Corn
287 386
Severe drought
0
500
1.000
1.500
2016 2014 2012 2010 2008
Thai Rice
435567
286378
Global rice crisis
0
500
1.000
1.500
2016 2014 2012 2010 2008
EU Wheat
0
500
1.000
1.500
2016 2014 2012 2010 2008
Raw sugar (New York #11)
0
500
1.000
1.500
2016 2014 2012 2010 2008
Thai Tapioca
0
500
1.000
1.500
2016 2014 2012 2010 2008
White sugar price (London #5)
Commodity price (USD / ton) Commodity price (USD / ton CHEQ)
Figure 20 – Feedstock commodity prices in 2008-2013 (monthly average, USD/ton, USD/ton CHEQ)
Although the agricultural commodities have global market prices, local prices differ due to transport costs, regional premium and semi-finished product discounts. As shown in the introduction, the price of white sugar has decreased significantly since 2000 relative to crude oil. The final section of this report explores future price developments.
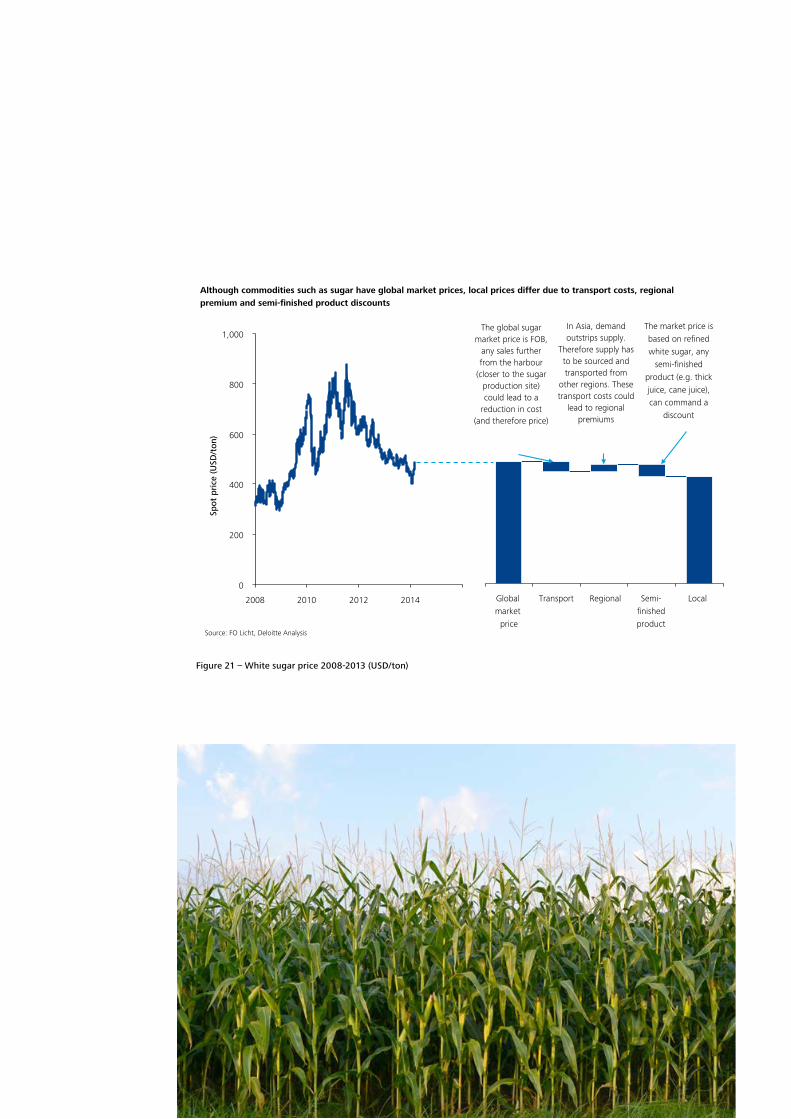
23
Although commodities such as sugar have global market prices, local prices differ due to transport costs, regional premium and semi-finished product discounts
400
200
0 2014 2012
1,000
800
600
2010 2008
Source: FO Licht, Deloitte Analysis
Spot
pri
ce (U
SD/t
on)
Regional Local Transport Global market
price
Semi-finishedproduct
The global sugar market price is FOB,
any sales further from the harbour
(closer to the sugar production site) could lead to a
reduction in cost (and therefore price)
In Asia, demand outstrips supply.
Therefore supply has to be sourced and transported from
other regions. These transport costs could
lead to regional premiums
The market price is based on refined white sugar, any
semi-finished product (e.g. thick juice, cane juice), can command a
discount
Figure 21 – White sugar price 2008-2013 (USD/ton)
24
5. Food, Feed, Fuel and Functional Molecules – What crops are used for and the way they are processed varies tremendously
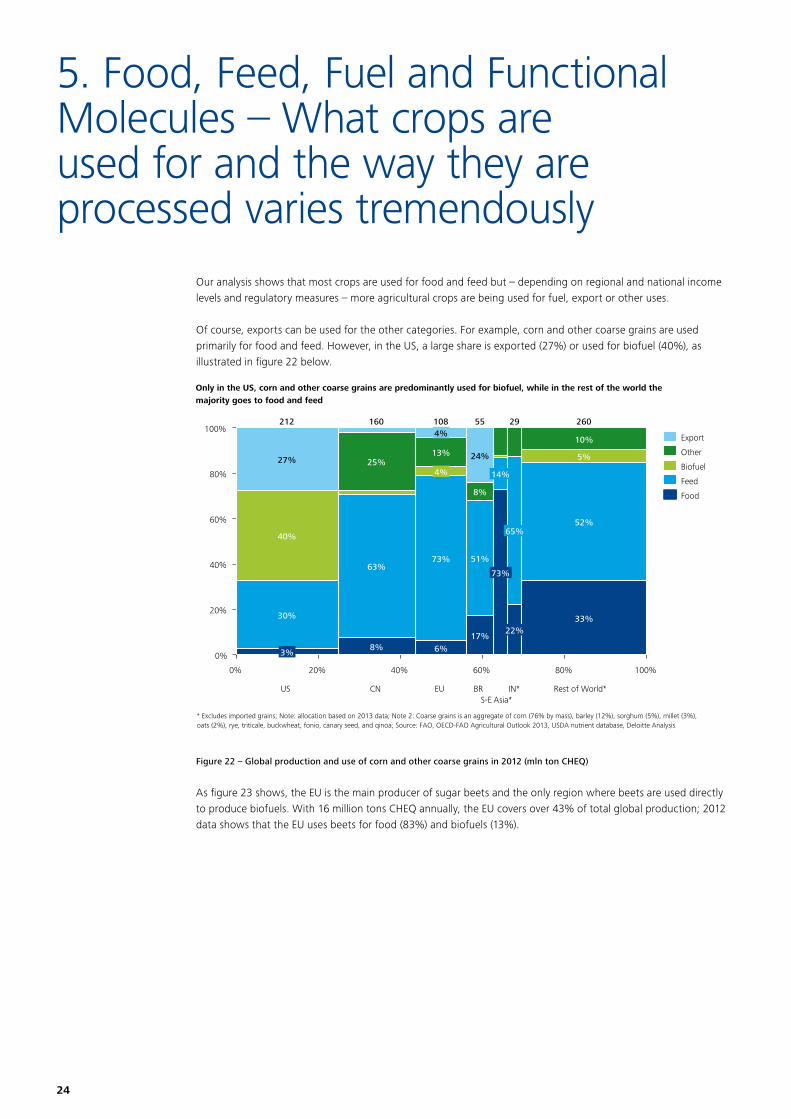
Our analysis shows that most crops are used for food and feed but – depending on regional and national income levels and regulatory measures – more agricultural crops are being used for fuel, export or other uses.
Of course, exports can be used for the other categories. For example, corn and other coarse grains are used primarily for food and feed. However, in the US, a large share is exported (27%) or used for biofuel (40%), as illustrated in figure 22 below.
Only in the US, corn and other coarse grains are predominantly used for biofuel, while in the rest of the world the majority goes to food and feed
60% 80% 0%
60%
40%
20%
20%
0%
100%
40% 100%
80%
40%
25%
212
US
27%
3%
63%
30%
5%
IN*
260
Rest of World*
10%
33%
52% 65%
S-E Asia*
73%
14%
29
51%
55 108
6%
73%
22%
8%
BR
8%
EU
4% 160
24%
4%
13%
CN
17%
* Excludes imported grains; Note: allocation based on 2013 data; Note 2: Coarse grains is an aggregate of corn (76% by mass), barley (12%), sorghum (5%), millet (3%), oats (2%), rye, triticale, buckwheat, fonio, canary seed, and qinoa; Source: FAO, OECD-FAO Agricultural Outlook 2013, USDA nutrient database, Deloitte Analysis
Food
Biofuel Feed
Other Export
Figure 22 – Global production and use of corn and other coarse grains in 2012 (mln ton CHEQ)
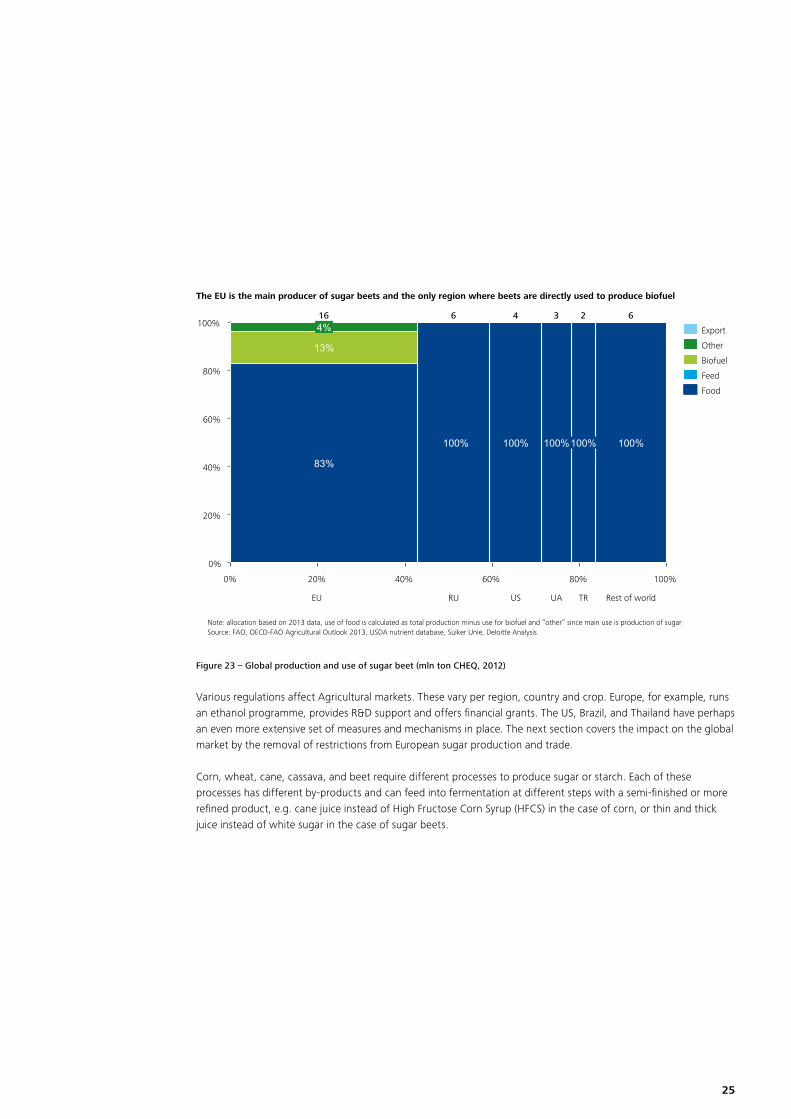
As figure 23 shows, the EU is the main producer of sugar beets and the only region where beets are used directly to produce biofuels. With 16 million tons CHEQ annually, the EU covers over 43% of total global production; 2012 data shows that the EU uses beets for food (83%) and biofuels (13%).
25
The EU is the main producer of sugar beets and the only region where beets are directly used to produce biofuel
Food
Biofuel Feed
Other Export
60%
40%
80%
20%
0%
100% 80% 60% 40% 20% 0%
100% 4%
100%
RU
16 6
100%
2 4
100%
US
83%
UA
3
100%
13%
Rest of world TR EU
100%
6
Note: allocation based on 2013 data, use of food is calculated as total production minus use for biofuel and “other” since main use is production of sugarSource: FAO, OECD-FAO Agricultural Outlook 2013, USDA nutrient database, Suiker Unie, Deloitte Analysis
Figure 23 – Global production and use of sugar beet (mln ton CHEQ, 2012)
Various regulations affect Agricultural markets. These vary per region, country and crop. Europe, for example, runs an ethanol programme, provides R&D support and offers financial grants. The US, Brazil, and Thailand have perhaps an even more extensive set of measures and mechanisms in place. The next section covers the impact on the global market by the removal of restrictions from European sugar production and trade.
Corn, wheat, cane, cassava, and beet require different processes to produce sugar or starch. Each of these processes has different by-products and can feed into fermentation at different steps with a semi-finished or more refined product, e.g. cane juice instead of High Fructose Corn Syrup (HFCS) in the case of corn, or thin and thick juice instead of white sugar in the case of sugar beets.

26
* Wet milling process ** Required for manually harvested cane only since a harvester machine cuts the cane during harvestingSource: Unica, Suiker Unie, Corn Refiners Association, Thai Tapioca Association, Overleggroep Producenten Natte Veevoeders
Starch
Cleaning
Dry grinding
Wetting
Starch separation
Drying
Starch refining
Wheat
HFCS, Starch
Cleaning
Steeping
Germ separation
Grinding
Syrup conversion
Starch separation
Syrup refining
Corn*
Washing
Cutting**
Crushing
Juice purification
Crystallisation
Evaporation
Centrifuging
Raw sugar
Sugar cane
Starch
Cleaning
Peeling & cuttingroots
Rasping
Filtering
Settling & Drying
Centrifuging
Grinding
Cassava
Washing
Slicing
Juice extraction
Juice purification
Crystallisation
Evaporation
Centrifuging
White sugar
Sugar beet
Corn, wheat, cane, cassava and beet require very different processes to produce sugar or starch
Figure 24 – Carbohydrate production processes
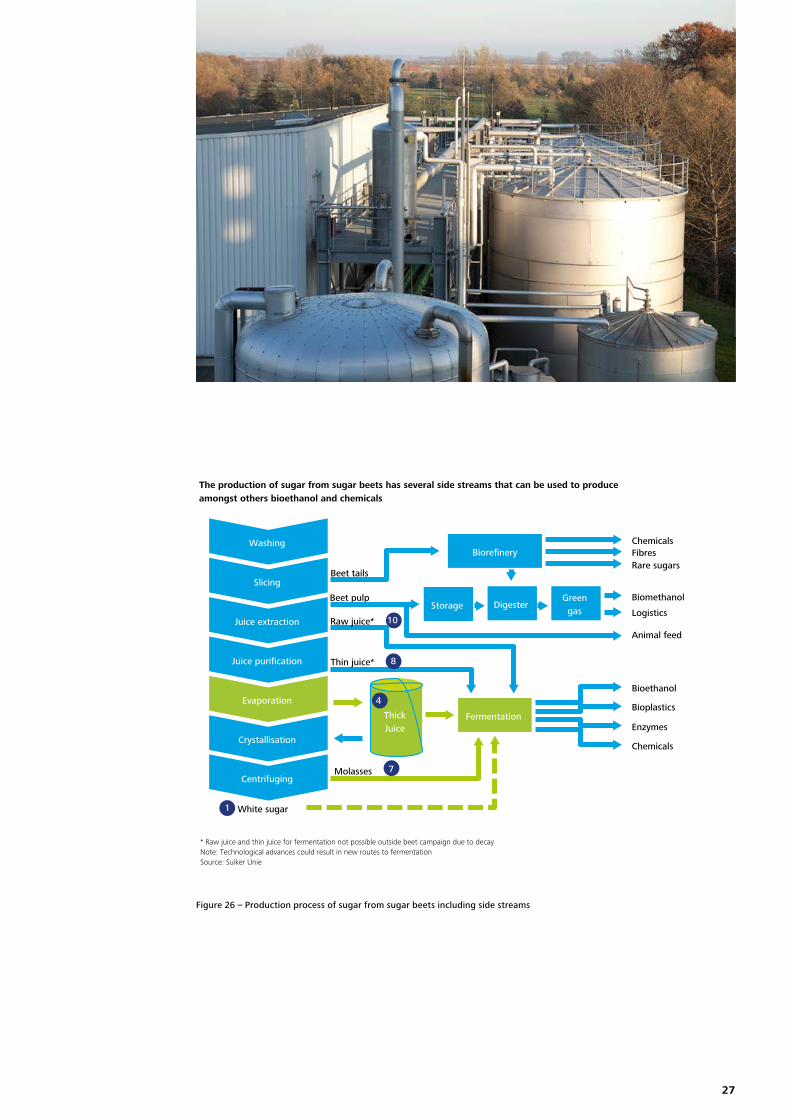
As already seen in the chemical industry, the degree of vertical and horizontal integration has a significant impact on the economics of fermentation and biobased chemicals. We explored each of the five main processes in more detail, as shown in figure 24. Figure 25 shows the trade-off between price, purity and processing costs. Figure 26 shows the production of sugar from sugar beets, the various side streams and possible intermediates of sugar and white sugar for the fermentation step. The numbers in figure 26 correspond with the relevant substrates from figure 25, i.e. white sugar, thin beet juice and thick beet juice.
A producer of fermentation products can choose feedstocks with different purities, optimising the trade-offs between cost price and processing costs
USD
Purity
1 White sugar
2 Raw sugar 4 Thick
beet juice
8 Thin beet juice
9 CaneJuice
11 2nd press cane juice
10 Rawbeet juice
Feedstock price
Processing costs
With increasing purity, the feedstock price increases, but fermentation processing costs decrease
With less refined product, the potential for synergies and by-product revenue (chain integration) also increases.
7 Molasses 5 Starch
6 Starch slurry
12 Raw crop
3 Syrup
(glucose)
Figure 25 – Price-purity trade-off for fermentation feedstocks
27
The production of sugar from sugar beets has several side streams that can be used to produce amongst others bioethanol and chemicals
* Raw juice and thin juice for fermentation not possible outside beet campaign due to decayNote: Technological advances could result in new routes to fermentationSource: Suiker Unie
Molasses
Washing
Slicing
Juice extraction
Juice purification
Crystallisation
Evaporation
Centrifuging
White sugar
Thick Juice
Chemicals Fibres Rare sugars
Biomethanol
Bioethanol
Bioplastics
Enzymes
Chemicals
Beet pulp
Beet tails
Animal feed
Biorefinery
Storage Digester Green gas Logistics
Fermentation
Thin juice*
Raw juice*
1
4
8
10
7
Figure 26 – Production process of sugar from sugar beets including side streams
28
6. North-West Europe can be a competitive location for fermentation-based processes and business
The global sugar export market is limited to 50-60 million tons because of sugar-specific and general agricultural protective and regulatory measures limiting preferential trade agreements (PTAs). These extensive measures are the result of national or regional programmes. Raw cane sugar from Brazil, providing 40% of global supply, dominates the price and volume of the global sugar market. Brazil has been by far the largest exporter for the past five years, with 24 million tons of w.s.e. (White Sugar Equivalents). Thailand is a close second. Exports from Europe to the rest of the world is limited to 1.35 million tons per annum, with the Netherlands representing just a fraction. The last part of this section covers the impact of the lifting of restrictions in Europe.
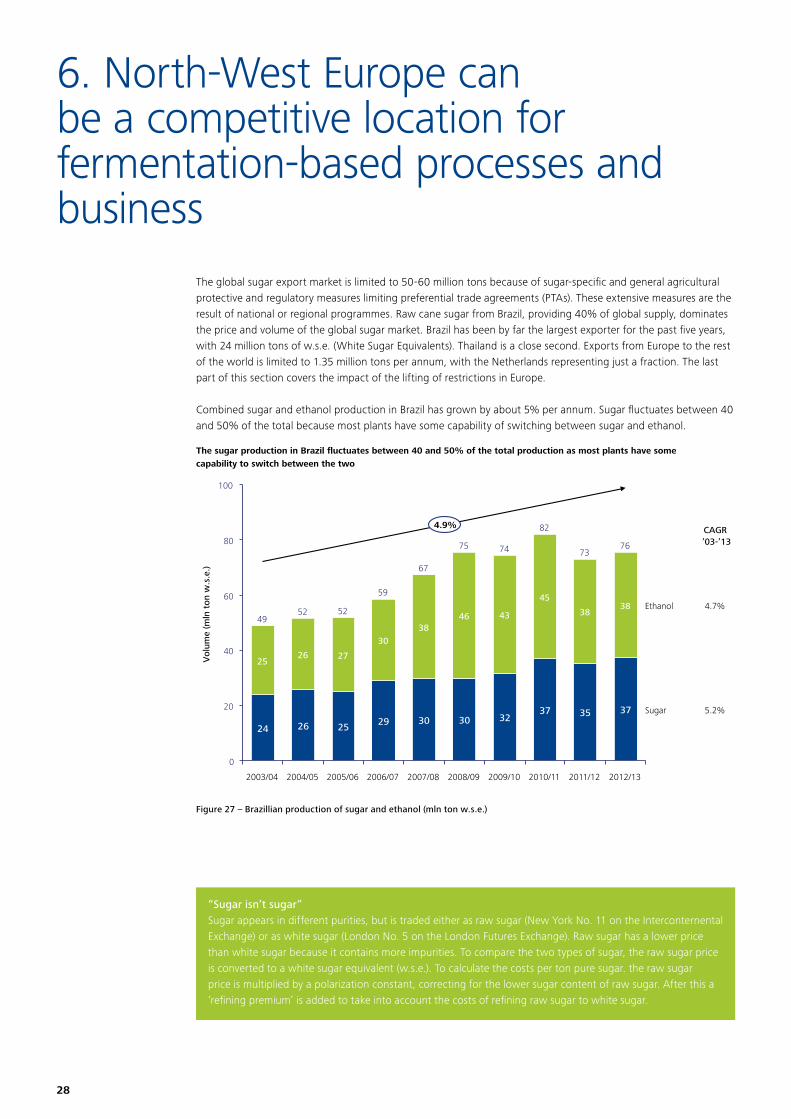
Combined sugar and ethanol production in Brazil has grown by about 5% per annum. Sugar fluctuates between 40 and 50% of the total because most plants have some capability of switching between sugar and ethanol.
The sugar production in Brazil fluctuates between 40 and 50% of the total production as most plants have some capability to switch between the two
20
0
40
80
60
100
35
73
45
2012/13 2009/10
4.9%
38
2011/12
38
2010/11
74
32
75
2007/08
67
43 46 Ethanol 4.7%
30 Sugar 5.2%
76
37 30
37
2008/09
38
82
52
26
29
25 27
59
30
26
2003/04
24
49
2006/07
25
2005/06
52
2004/05
Vol
ume
(mln
ton
w.s
.e.)
CAGR ’03-’13
Figure 27 – Brazillian production of sugar and ethanol (mln ton w.s.e.)
“Sugar isn’t sugar”Sugar appears in different purities, but is traded either as raw sugar (New York No. 11 on the Interconternental Exchange) or as white sugar (London No. 5 on the London Futures Exchange). Raw sugar has a lower price than white sugar because it contains more impurities. To compare the two types of sugar, the raw sugar price is converted to a white sugar equivalent (w.s.e.). To calculate the costs per ton pure sugar. the raw sugar price is multiplied by a polarization constant, correcting for the lower sugar content of raw sugar. After this a ‘refining premium’ is added to take into account the costs of refining raw sugar to white sugar.

29
The export of Brazilian sugar is a key driver for world sugar market prices and therefore forms the basis on our analysis of industrial dynamics, which is a stable system driven by the crude oil price and the strength of the Brazilian Real (BRL). The higher conversion rate for the BRL against the USD leads to higher prices for sugar on the global market.
Global world market prices are volatile, ranging from 350-800 USD/ton CHEQ, with white sugar being somewhat more expensive than raw sugar. Since 2011, prices have decreased.
A recent EC report on industrial white sugar shines an interesting light on the perception that European prices exceed world market prices:• EU prices were higher than world market prices before 2009, encouraging companies to invest elsewhere• EU prices were below London No 5 white sugars between 2009 and 2012• EU prices for non-food sugars converged to world market levels in 2013
Prices for white and raw sugar have range between $350 and $800 per ton over recent years, European industrial white sugar had been less volatile
Source: FO Licht, Deloitte Analysis
01-01-2008 01-01-2009 01-01-2011 01-01-2014 01-01-2012 01-01-2010
800
600
1,000
400
0
200
01-01-2013
Spo
t p
rice
(U
SD /
to
n)
White sugar price (London No. 5) Raw sugar price (New York No. 11)
White Sugar (Moving Quarterly average) European industrial white sugar from sugar producers
Global white sugar market price range (2008-2013)
Figure 28 – Raw and white sugar prices in 2008-2013 (USD/ton)
30
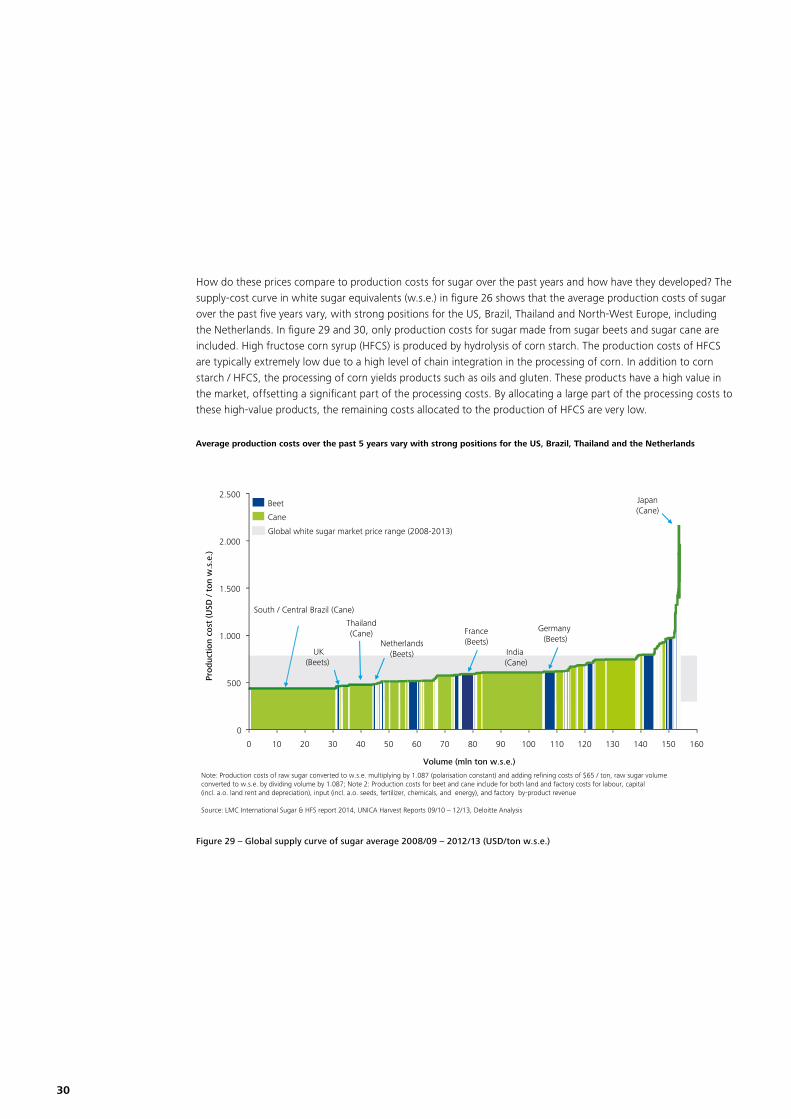
How do these prices compare to production costs for sugar over the past years and how have they developed? The supply-cost curve in white sugar equivalents (w.s.e.) in figure 26 shows that the average production costs of sugar over the past five years vary, with strong positions for the US, Brazil, Thailand and North-West Europe, including the Netherlands. In figure 29 and 30, only production costs for sugar made from sugar beets and sugar cane are included. High fructose corn syrup (HFCS) is produced by hydrolysis of corn starch. The production costs of HFCS are typically extremely low due to a high level of chain integration in the processing of corn. In addition to corn starch / HFCS, the processing of corn yields products such as oils and gluten. These products have a high value in the market, offsetting a significant part of the processing costs. By allocating a large part of the processing costs to these high-value products, the remaining costs allocated to the production of HFCS are very low.
Average production costs over the past 5 years vary with strong positions for the US, Brazil, Thailand and the Netherlands
160 80 50
1.000
60
500
130 90
2.000
70 40 140 20 120 10
1.500
30
2.500
0
0 110 150 100
Volume (mln ton w.s.e.)
Note: Production costs of raw sugar converted to w.s.e. multiplying by 1.087 (polarisation constant) and adding refining costs of $65 / ton, raw sugar volume converted to w.s.e. by dividing volume by 1.087; Note 2: Production costs for beet and cane include for both land and factory costs for labour, capital (incl. a.o. land rent and depreciation), input (incl. a.o. seeds, fertilizer, chemicals, and energy), and factory by-product revenue
Source: LMC International Sugar & HFS report 2014, UNICA Harvest Reports 09/10 – 12/13, Deloitte Analysis
Prod
ucti
on c
ost
(USD
/ t
on w
.s.e
.)
Thailand(Cane)
Netherlands (Beets)
Japan (Cane)
Cane
Beet
South / Central Brazil (Cane)
Global white sugar market price range (2008-2013)
India (Cane)
France (Beets)
Germany (Beets)
UK(Beets)
Figure 29 – Global supply curve of sugar average 2008/09 – 2012/13 (USD/ton w.s.e.)

31
As shown in figure 30, volumes were higher than average in the previous season, and the Netherlands and the UK took the lead in low-cost sugar production. This appears to be a development an interesting development.
Note: Production costs of raw sugar converted to w.s.e. multiplying by 1.087 (polarisation constant) and adding refining costs of $65 / ton, raw sugar volume converted to w.s.e. by dividing volume by 1.087; Note 2: Production costs for beet and cane include for both land and factory costs for labour, capital (incl. a.o. land rent and depreciation), input (incl. a.o. seeds, fertilizer, chemicals, and energy), and factory by-product revenue.
Source: LMC International Sugar & HFS report 2014, UNICA Harvest Reports 09/10 – 12/13, Deloitte Analysis
20 170 70 90
2.500
60
3.000
2.000
500
150 130 140
0 100 120 40
1.500
1.000
50 160 110 30 80 10 0
Volume (mln ton w.s.e.)
In the last season, volumes were higher than average and the Netherlands took the lead in low cost sugar production. This trend will continue.
Pro
duct
ion c
ost
(U
SD /
to
n w
.s.e
.)
Thailand
(Cane)
Netherlands
(Beets)
South/Central Brazil (Cane)
India (Cane)
Cane Beet
Global white sugar market price range (2008-2013)
UK (Beets)
France (Beets)
Germany (Beets)
Figure 30 – Global supply curve of sugar in 2012/13 (USD/ton w.s.e.)
Our analysis of the drivers reveals an underlying, longer-term trend that is driving down costs. The charts in figure 31 below analyse the evolution of cultivation areas, crop yields and sugar yields in three countries for two key crops. Brazil and Thailand increased production mostly by increasing acreage and/or crop yield, whereas production in the Netherlands, while under quota, became much more efficient. The same applies to other North-West European countries.

32
When compared to Brazil and Thailand, the Netherlands is the only region where both crop yield and sugar yield have increased.
* Figures include all cane and sugar produced, no adjustment for ethanol production has been madeSource: LMC International Sugar & HFS report 2014, Deloitte Analysis
‘00 ‘80
0
‘20
8
4
Cultivation area (mln ha)
Crop yield (ton crop / ha)
Total production (mln ton w.s.e .)
Sugar yield (ton w.s.e . / ton crop)
Bra
zil*
(C
ane)
Th
aila
nd
(Can
e)
Net
herl
ands
(B
eet)
0
50
100
‘80 ‘00 ‘20 0%
‘20 ‘00
20%
10%
‘80 ‘80
80
40
0
‘20 ‘00
X X =
2
1
0
‘20 ‘00 ‘80
0
50
100
‘20 ‘80 ‘00
10%
0%
20%
‘80 ‘20 ‘00 ‘80 ‘00
10
5
0
‘20
0.2
0.1
0.0
‘20 ‘80 ‘00
0
50
100
‘20 ‘00 ‘80
20%
‘20
10%
0%
‘00 ‘80 ‘00 ‘80
1
‘20
0
2
+5.9%
+2.8%
-3.7%
-0.4%
+2.2%
+2.0%
% = CAGR 2000-2013
-0.4%
-0.4%
+0.7%
+5.1%
+4.6%
-1.1%
Quota
Figure 31 – Evolution of production drivers per region 1980-2013. Cultivation area, crop and sugar yield
Beets versus caneBeets and cane are different in several respects. Yields from beet have shown significant improvement, whereas cane sugar yields have plateaued. What are the differences between these crops causing this?
Cane – Sugar yield (ton WSE/ha) has decreased by 0.8% annually in the past 15 years• Planted only every 5-7 years• Cuttings are used to plant new cane• Thus, plants with the same genome are used consistently over the years• Although higher yield technologies are becoming available, the resulting pace of yield improvements
is slow
Beet – Sugar yield (ton WSE / ha) has increased 2.7% annually• Planted every year (maximum of once every 4-5 years)• Seeds are not used for replant, so need to be bought every season• By selecting best breeds, continuous improvement in crop yield can be achieved• Other factors also influence yield, e.g. limited availability of land, climate

33
Since 2000, but especially in recent years, the total cost of producing sugar in Brazil has increased significantly more than in Europe and the Netherlands – 6% vs. 1.5% per annum as shown in figure 32. This is putting Brazilian margins under pressure. The combination of the cost of processing crops and growing the crops appears to explain the difference between Brazil and the Netherlands. Also, factories in the Netherlands appear to have become more efficient.
Since 2000 the production costs in Brazil have increased significantly more than in the Netherlands, resulting in a higher price level
Note: cost levels same as previously definedSource: LMC International Sugar & HFS report 2014, Deloitte Analysis
481
0
250
500
750
1980 1985 1990 1995 2000 2005 2010 2015
+6.0%
281
0
250
500
750
1980 1985 1990 1995 2000 2005 2010 2015
+1.5%
429
513
0
250
500
750
1980 1985 1990 1995 2000 2005 2010 2015
+3.7%
Production costs (USD / ton w.s.e., 1980-2013)
Brazil – Cane Netherlands – Beets
Thailand – Cane
% = CAGR 2000-2013
Total Cost
Crop Cost
Total Cost
Crop Cost
Total Cost
Crop Cost
575
308
0
250
500
750
1980 1985 1990 1995 2000 2005 2010 2015
+1.5% EU – Beets
Total Cost
Crop Cost
149
267
Figure 32 – Production costs in 1980-2013 (USD/ton w.s.e.)
In addition to these improvements in production costs, changes to regulations in 2017 will remove restrictions from European sugar production and trade in the global market. This will increase production volumes. Figure 33 shows the various measures and changes that will occur as well as the expected impact.
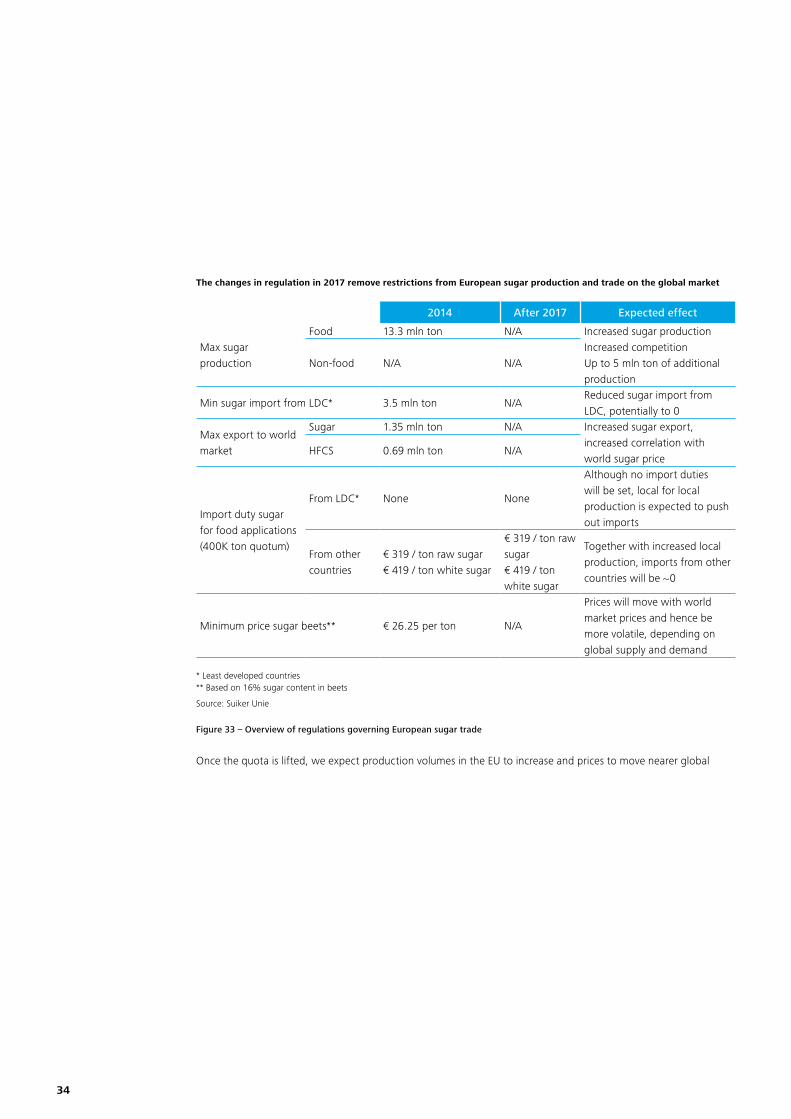
34
The changes in regulation in 2017 remove restrictions from European sugar production and trade on the global market
2014 After 2017 Expected effect
Max sugar production
Food 13.3 mln ton N/A Increased sugar productionIncreased competitionUp to 5 mln ton of additional production
Non-food N/A N/A
Min sugar import from LDC* 3.5 mln ton N/AReduced sugar import from LDC, potentially to 0
Max export to world market
Sugar 1.35 mln ton N/A Increased sugar export, increased correlation with world sugar price
HFCS 0.69 mln ton N/A
Import duty sugar for food applications (400K ton quotum)
From LDC* None None
Although no import duties will be set, local for local production is expected to push out imports
From other countries
€ 319 / ton raw sugar€ 419 / ton white sugar
€ 319 / ton raw sugar€ 419 / ton white sugar
Together with increased local production, imports from other countries will be ~0
Minimum price sugar beets** € 26.25 per ton N/A
Prices will move with world market prices and hence be more volatile, depending on global supply and demand
* Least developed countries ** Based on 16% sugar content in beets
Source: Suiker Unie
Figure 33 – Overview of regulations governing European sugar trade
Once the quota is lifted, we expect production volumes in the EU to increase and prices to move nearer global
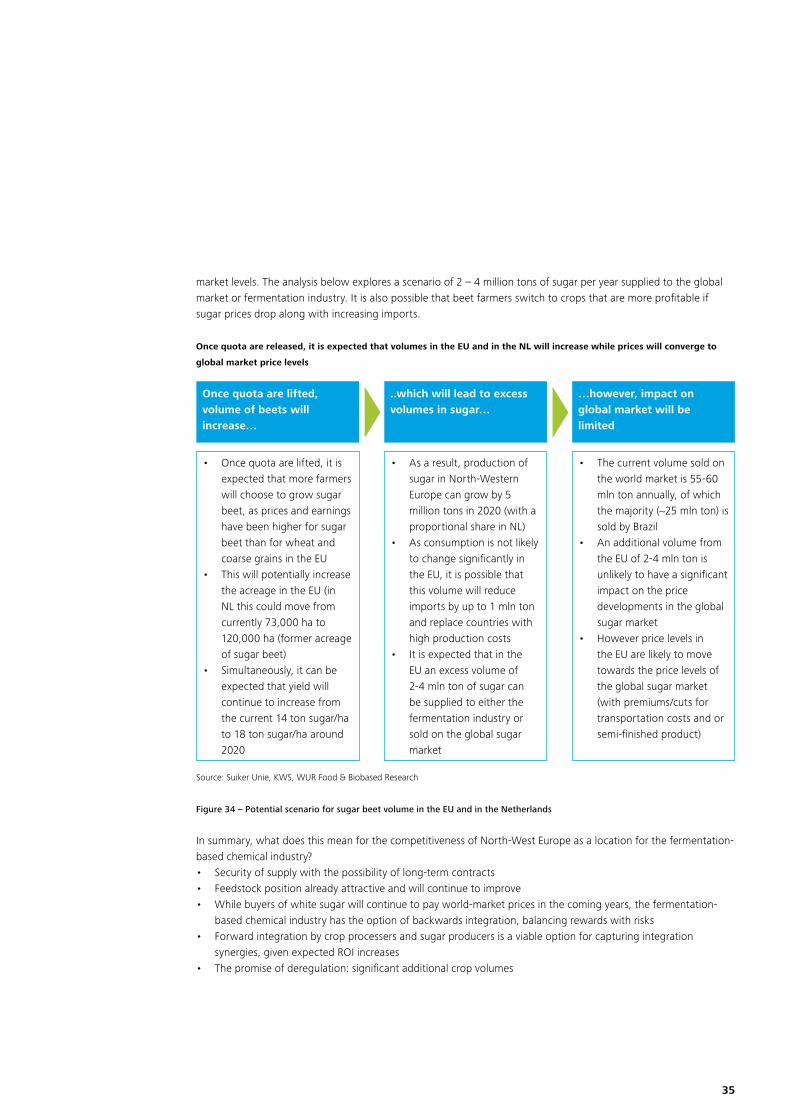
35
market levels. The analysis below explores a scenario of 2 – 4 million tons of sugar per year supplied to the global market or fermentation industry. It is also possible that beet farmers switch to crops that are more profitable if sugar prices drop along with increasing imports.
Once quota are released, it is expected that volumes in the EU and in the NL will increase while prices will converge to
global market price levels
• Once quota are lifted, it is expected that more farmers will choose to grow sugar beet, as prices and earnings have been higher for sugar beet than for wheat and coarse grains in the EU
• This will potentially increase the acreage in the EU (in NL this could move from currently 73,000 ha to 120,000 ha (former acreage of sugar beet)
• Simultaneously, it can be expected that yield will continue to increase from the current 14 ton sugar/ha to 18 ton sugar/ha around 2020
Once quota are lifted, volume of beets will increase…
• As a result, production of sugar in North-Western Europe can grow by 5 million tons in 2020 (with a proportional share in NL)
• As consumption is not likely to change significantly in the EU, it is possible that this volume will reduce imports by up to 1 mln ton and replace countries with high production costs
• It is expected that in the EU an excess volume of 2-4 mln ton of sugar can be supplied to either the fermentation industry or sold on the global sugar market
..which will lead to excess volumes in sugar…
• The current volume sold on the world market is 55-60 mln ton annually, of which the majority (~25 mln ton) is sold by Brazil
• An additional volume from the EU of 2-4 mln ton is unlikely to have a significant impact on the price developments in the global sugar market
• However price levels in the EU are likely to move towards the price levels of the global sugar market (with premiums/cuts for transportation costs and or semi-finished product)
…however, impact on global market will be limited
Source: Suiker Unie, KWS, WUR Food & Biobased Research
Figure 34 – Potential scenario for sugar beet volume in the EU and in the Netherlands
In summary, what does this mean for the competitiveness of North-West Europe as a location for the fermentation-based chemical industry?• Security of supply with the possibility of long-term contracts• Feedstock position already attractive and will continue to improve• While buyers of white sugar will continue to pay world-market prices in the coming years, the fermentation-
based chemical industry has the option of backwards integration, balancing rewards with risks• Forward integration by crop processers and sugar producers is a viable option for capturing integration
synergies, given expected ROI increases• The promise of deregulation: significant additional crop volumes
36
7. In a nutshell: A surprisingly positive picture for North-West Europe and the sugar beet
Global competition in the chemical market is intensifying. The abundance of shale gas in the US, oil and gas in the Middle East and coal in China means the European chemical industry is under increasing pressure to find new ways to create a sustainable competitive advantage. Given that one key lies in innovation in biotechnology and biorefineries that require new partnerships between the agricultural and chemical sectors, what are the main conclusions?• The fermentation platform is where ‘agriculture meets chemicals’: it bridges the gap between the two
and thereby unlocks a golden opportunity for both important sectors• NW-EU has strong feedstock position and competitiveness is still improving
– NW-EU, especially The Netherlands, has a surprisingly attractive and strong feedstock position offering long-term security of supply to the fermentation industry
– The cost position for sugars from NW-EU compared to Brazil, US and Thailand has rapidly improved during the past decade to the extent that it is now competitive. Due to further intensification in the agricultural industry and improvements of crop seeds and yields, the competitiveness is likely to continue to improve for a number of years in the future
• Sugar has become cheaper compared to oil – Relative to crude oil, white sugar has become significantly cheaper. After the turning point in 1999/2000,
the trend continues until today• Releasing quota will increase production and sugar prices will converge
– Due to de-regulation large additional volumes (2 to 4 mln tons / annum) from NW-EU are expected to come on the market from 2017 onwards
– After 2017, prices for food and non-food sugars are expected to converge to world market levels since the additional volumes of feedstock coming on the market in NW-EU are small compared to the exports from the dominant player Brazil
• Fermentation industry is small, but fast-growing – The current market for biobased chemicals, such as biobased plastics, is still relatively small; however, it is
growing at a much higher percentage than the other segments such as bioethanol – From an economic perspective, it appears biobased chemicals and materials are an attractive market
segment with a project 6.5% CAGR until 2020 and gross margin contribution of $ 12 billion per annum• Sugar value chain remains attractive and value chain integration provides synergies
– The sugar value chain based on NW-EU crops remains attractive in the long term. Although European sugar prices for food dropped significantly in 2014, the evidence indicates sugar producers are currently still operating in a sellers-market
– Vertical and horizontal integration provide synergies, incl. cost savings, by eliminating/skipping the final energy-intensive steps for producing white sugar and making optimal use of side-streams; e.g. in the case of sugar beets thin or thick juice may be used instead of white sugar
• Land use needed for functional molecules is insignificant – The use of sugar & starch for biobased chemicals compared to food, feed and fuel is insignificant and will
remain so; the added-value and margin however is very significant compared to bioethanol• Each product needs its own business case
– For a number of reasons such as the difference between actual and theoretical yields, each product obviously needs to be evaluated on its own merit and specific parameters for its business case. It appears that the specific business cases we investigated with a detailed model are surprisingly robust and show a solid position for NW-EU
• Non-financial factors can “flip-the-coin” – Investors and other stakeholders in the fermentation-based chemical industry are well advised to evaluate
the different options in the four major regions investigated in this study taking into account the financial as well as non-financial factors
– Since non-financial factors as well as various incentives and regulatory measures can easily “flip the coin”, governments and investors need to pay close attention to external factors influencing the business case for locating facilities in NW-EU

37
Contacts
Ton RunneboomChairman Biorenewables Business [email protected]+31 653 938 833
Vincent OomesPartnerDeloitte [email protected]+31 655 853 081
Daan DijkManaging Director Sustainable Business [email protected] +31 622 934 186
Willem VaessenDirector Chemical Value ChainDeloitte [email protected]+ 31 613 121 120

38
A. Approach of the study
B. Key fermentation processes and theoretical yields
C. Definitions of mono- and polysaccharide carbohydrates
D. Interviewees
E. Steering committee
F. Reference material
G. Abbreviations and country codes
Appendices

39
A. Approach of the study
The study applied a four-step approach to assess the competitiveness of different regions and key feedstocks.
A four-step approach to assess the competitiveness
March 2014 June 2014
• Identify key carbohydrate crops
• Determine market volume by crop and geography and utilisation
• Compare feedstock price levels
• Understand production processes and input to fermentation industry
• Deep dive into sugar industry
• Identify current and future potential fermentation processes
• Calculate theoretical yield of fermentation products
• Collect and analyse available market data
• Calculate market sizes in carbohydrate equivalents including split by region
• Develop global price curve of fermentation products
• Select key products and processes for the fermentation-based chemical industry
• Model cost price build-up of key feedstocks in multiple regions for selected products
• Evaluate performance of key feedstock and regions on non-financial criteria
• Note: The model and detailed business cases for the different products belong to the private part of the study
• Determine key uncertainties
• Develop potential shocks and assess impact on key uncertainties
• Model impact of shocks on competitiveness
Asses key feedstock markets
Analyse fermentation
products & processes
Determine competitiveness of key feedstock
regions
Investigate impact of potential shocks(sensitivity analysis)
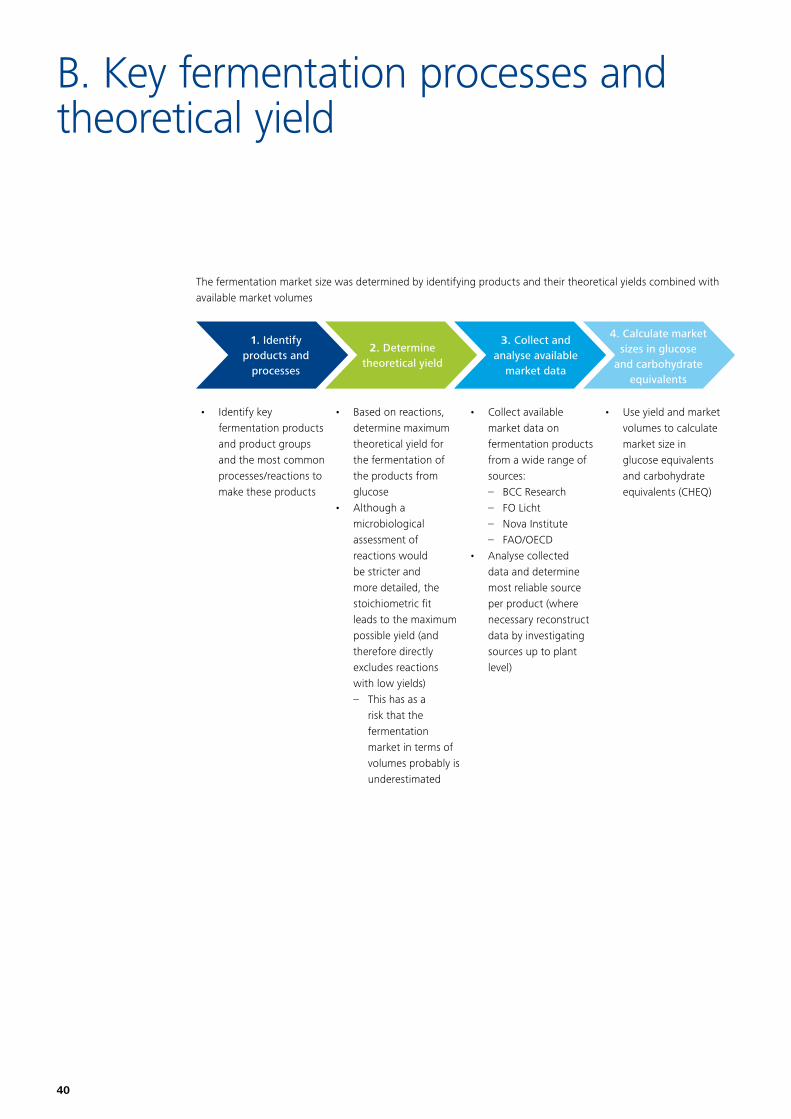
40
B. Key fermentation processes and theoretical yield
The fermentation market size was determined by identifying products and their theoretical yields combined with available market volumes
• Identify key fermentation products and product groups and the most common processes/reactions to make these products
• Based on reactions, determine maximum theoretical yield for the fermentation of the products from glucose
• Although a microbiological assessment of reactions would be stricter and more detailed, the stoichiometric fit leads to the maximum possible yield (and therefore directly excludes reactions with low yields) – This has as a
risk that the fermentation market in terms of volumes probably is underestimated
• Collect available market data on fermentation products from a wide range of sources: – BCC Research – FO Licht – Nova Institute – FAO/OECD
• Analyse collected data and determine most reliable source per product (where necessary reconstruct data by investigating sources up to plant level)
• Use yield and market volumes to calculate market size in glucose equivalents and carbohydrate equivalents (CHEQ)
1. Identify products and
processes
2. Determine theoretical yield
3. Collect and analyse available
market data
4. Calculate market sizes in glucose
and carbohydrate equivalents

41
Alcohols have a low yield as molecules are dissimilar to glucose; amino and organic acids have a higher similarity and, therefore, a higher yield.
Theoretical yields of fermentation products
Category Compound ReactionMolar mass Theoretical yield**
(g/mol)(g product/ g glucose)
Alcohols
Ethanol C6H12O6 à 2 C2H6O + 2 CO246.07 0.51
Beer C6H12O6 à 2 C2H6O + 2 CO246.07 0.51
Wine C6H12O6 à 2 C2H6O + 2 CO246.07 0.51
Isobutanol C6H12O6 à C4H10O + 2 CO2 + H2O 74.12 0.41
PDO 2 C6H12O6 à 3 C3H8O2 + 3 CO276.09 0.63
N-butanol C6H12O6 à C4H10O + 2 CO2 + H2O 74.12 0.41
BDO 11 C6H12O6 à 12 C4H10O2 + 18 CO2 + 6 H2O 90.12 0.55
Acetone 2 C6H12O6 à 3 C3H6O + 3 CO2 + 3 H2O 58.08 0.48
Fatty alcohols Estimated based on typical alcohol yield Variable 0.50
Amino Acid
Lysine 7 C6H12O6+ 12 NH3 à 6 C6H14N2O2+ 6 CO2 + 18 H2O 146.19 0.70
MSG* 5 C6H12O6 + 3 O2 + 6 NH3à 6 C5H9NO4+ 12 H2O 169.11 1.13
Glutamic acid 5 C6H12O6 + 3 O2 + 6 NH3à 6 C5H9NO4+ 12 H2O 147.13 0.98
Threonine 2 C6H12O6 + 3 NH3à 3 C4H9NO3+ 3 H2O 119.12 0.99
Tryptophan 23 C6H12O6 +24 NH3à12 C11H12N2O2+6 CO2+ 102 H2O 204.23 0.59
Organic Acid
Citric acid 2 C6H12O6 + 3 O2 à 2 C6H8O7 + 4 H2O 192.12 1.07
Lactic acid C6H12O6 à 2 C3H6O390.08 1.00
Gluconic acid C6H12O6 + O2 à C6H10O7 + H2O 196.16 1.09
Itaconic acid 5 C6H12O6 + 3 O2à 6 C5H6O4 + 12 H2O 130.10 0.87
Succinic acid 7 C6H12O6 + 6 CO2à 12 C4H6O4 + 6 H2O 118.09 1.12
*MSG is produced by reacting glutamic acid with NaOH, the stoichiometry from sugar is thus the same as for glutamic acid
**Based on reaction stoichiometry, molecular mass of product, and molecular mass of glucose (180.16 g/mol), e.g. for ethanol: 2 ethanol of 46.07 g/mol divided by 1 glucose of 180.16 g/mol equals a yield of 0.51
Source: Deloitte Analysis
1. Identify products and
processes
2. Determine theoretical yield
3. Collect and analyse available
market data
4. Calculate market sizes in glucose
and carbohydrate equivalents
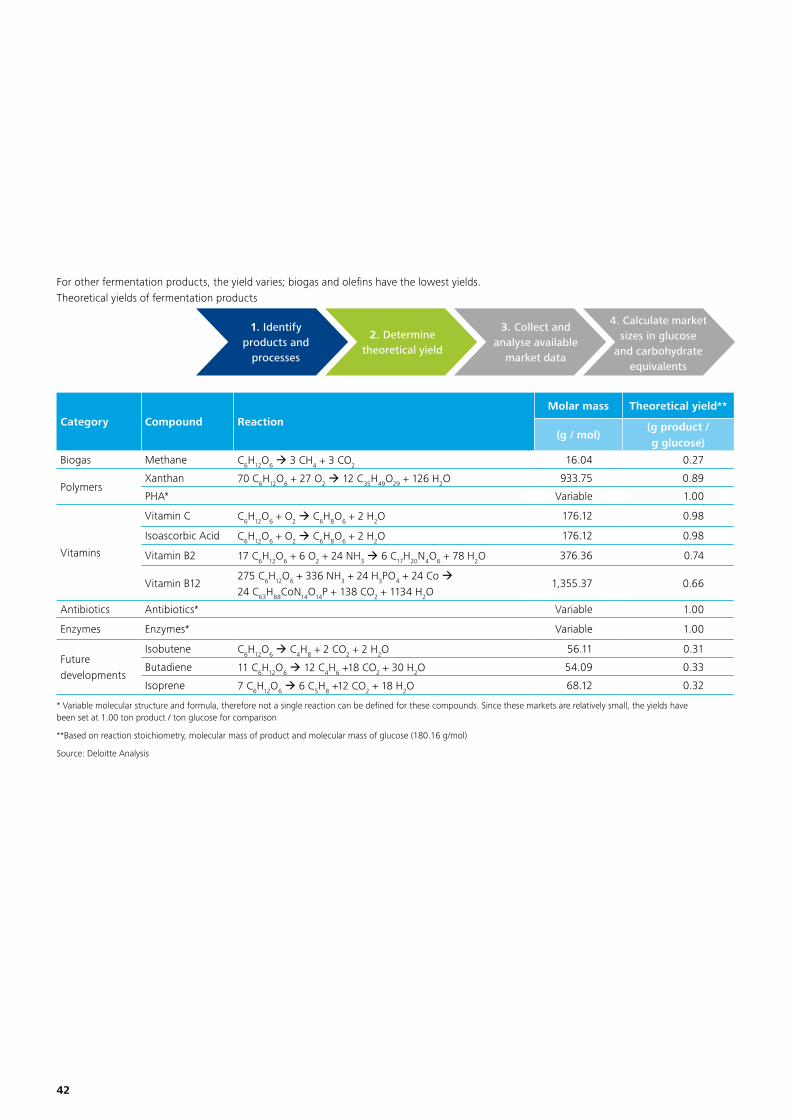
42
For other fermentation products, the yield varies; biogas and olefins have the lowest yields.Theoretical yields of fermentation products
Category Compound ReactionMolar mass Theoretical yield**
(g / mol)(g product / g glucose)
Biogas Methane C6H12O6 à 3 CH4 + 3 CO216.04 0.27
PolymersXanthan 70 C6H12O6 + 27 O2 à 12 C35H49O29 + 126 H2O 933.75 0.89
PHA* Variable 1.00
Vitamins
Vitamin C C6H12O6 + O2 à C6H8O6 + 2 H2O 176.12 0.98
Isoascorbic Acid C6H12O6 + O2 à C6H8O6 + 2 H2O 176.12 0.98
Vitamin B2 17 C6H12O6 + 6 O2 + 24 NH3 à 6 C17H20N4O6 + 78 H2O 376.36 0.74
Vitamin B12275 C6H12O6 + 336 NH3 + 24 H3PO4 + 24 Co à24 C63H88CoN14O14P + 138 CO2 + 1134 H2O
1,355.37 0.66
Antibiotics Antibiotics* Variable 1.00
Enzymes Enzymes* Variable 1.00
Future developments
Isobutene C6H12O6 à C4H8 + 2 CO2 + 2 H2O 56.11 0.31
Butadiene 11 C6H12O6 à 12 C4H6 +18 CO2 + 30 H2O 54.09 0.33
Isoprene 7 C6H12O6 à 6 C5H8 +12 CO2 + 18 H2O 68.12 0.32
* Variable molecular structure and formula, therefore not a single reaction can be defined for these compounds. Since these markets are relatively small, the yields have been set at 1.00 ton product / ton glucose for comparison
**Based on reaction stoichiometry, molecular mass of product and molecular mass of glucose (180.16 g/mol)
Source: Deloitte Analysis
1. Identify products and
processes
2. Determine theoretical yield
3. Collect and analyse available
market data
4. Calculate market sizes in glucose
and carbohydrate equivalents
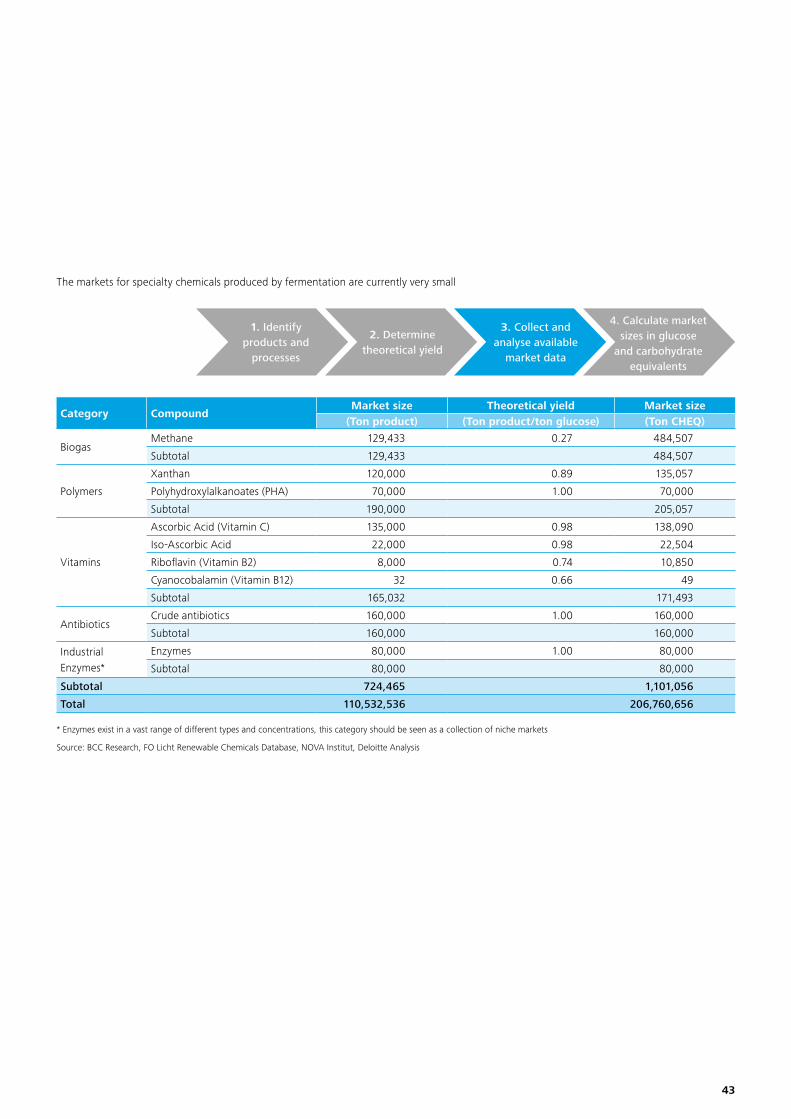
43
The markets for specialty chemicals produced by fermentation are currently very small
Category CompoundMarket size Theoretical yield Market size
(Ton product) (Ton product/ton glucose) (Ton CHEQ)
BiogasMethane 129,433 0.27 484,507
Subtotal 129,433 484,507
Polymers
Xanthan 120,000 0.89 135,057
Polyhydroxylalkanoates (PHA) 70,000 1.00 70,000
Subtotal 190,000 205,057
Vitamins
Ascorbic Acid (Vitamin C) 135,000 0.98 138,090
Iso-Ascorbic Acid 22,000 0.98 22,504
Riboflavin (Vitamin B2) 8,000 0.74 10,850
Cyanocobalamin (Vitamin B12) 32 0.66 49
Subtotal 165,032 171,493
AntibioticsCrude antibiotics 160,000 1.00 160,000
Subtotal 160,000 160,000
Industrial Enzymes*
Enzymes 80,000 1.00 80,000
Subtotal 80,000 80,000
Subtotal 724,465 1,101,056
Total 110,532,536 206,760,656
* Enzymes exist in a vast range of different types and concentrations, this category should be seen as a collection of niche markets
Source: BCC Research, FO Licht Renewable Chemicals Database, NOVA Institut, Deloitte Analysis
1. Identify products and
processes
2. Determine theoretical yield
3. Collect and analyse available
market data
4. Calculate market sizes in glucose
and carbohydrate equivalents
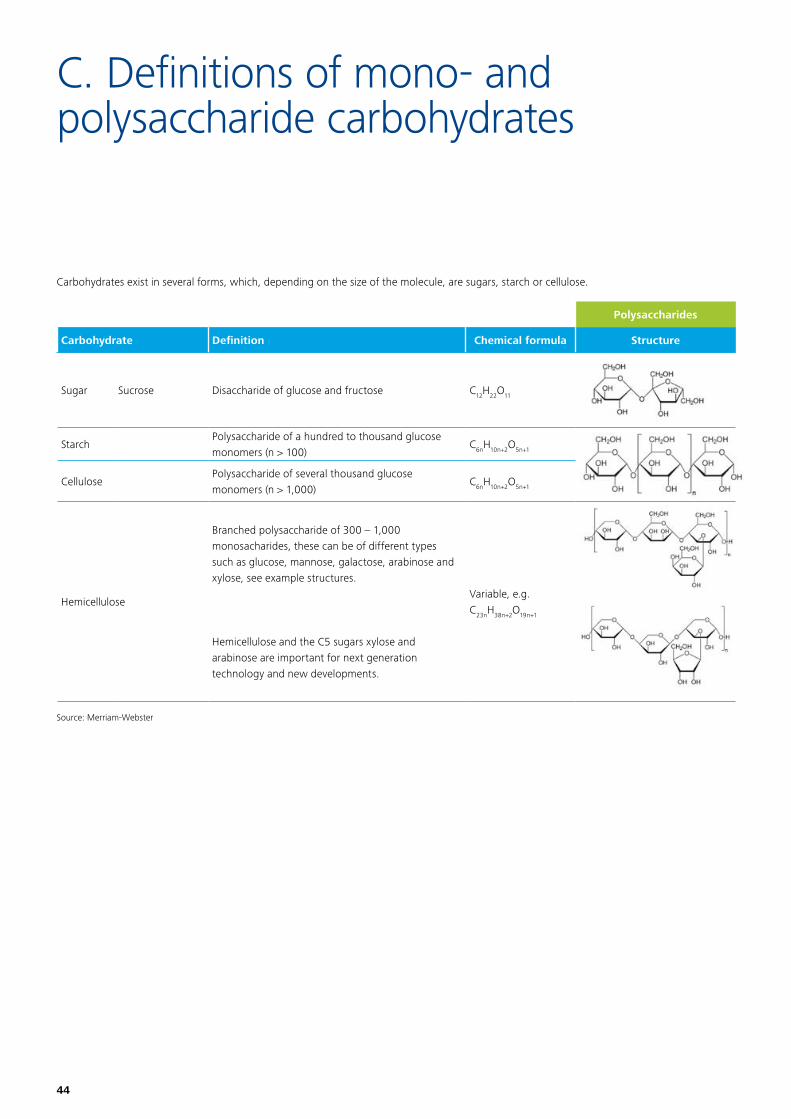
44
C. Definitions of mono- and polysaccharide carbohydrates
Carbohydrates exist in several forms, which, depending on the size of the molecule, are sugars, starch or cellulose.
Polysaccharides
Carbohydrate Definition Chemical formula Structure
Sugar Sucrose Disaccharide of glucose and fructose C12H22O11
StarchPolysaccharide of a hundred to thousand glucose monomers (n > 100)
C6nH10n+2O5n+1
CellulosePolysaccharide of several thousand glucose monomers (n > 1,000)
C6nH10n+2O5n+1
Hemicellulose
Branched polysaccharide of 300 – 1,000 monosacharides, these can be of different types such as glucose, mannose, galactose, arabinose and xylose, see example structures.
Hemicellulose and the C5 sugars xylose and arabinose are important for next generation technology and new developments.
Variable, e.g. C23nH38n+2O19n+1
Source: Merriam-Webster

45
Monosaccharides
Carbohydrate DefinitionChemical formula
Structure
Sugars
GlucoseMonosaccharide with a six-membered ring, produced by plants during photosynthesis. Also known as dextrose or grape sugar
C6H12O6
FructoseMonosaccharide with a five-membered ring, occurring in fruits and honey. Isomer of glucose
C6H12O6
Galactose
Monosaccharide with a six-membered ring, structural isomer of glucose, less soluble and less sweet than glucose, occurs in nature in combination with other monosaccharides
C6H12O6
MannoseMonosaccharide with a six-membered ring, structural isomer of glucose, occurs mainly in plant cell walls
C6H12O6
XyloseMonosaccharide with a five-membered ring, not fermentable with ordinary yeasts
C5H10O5
ArabinoseMonosaccharide with a five-membered ring, not fermentable with ordinary yeasts
C5H10O5
Source: Merriam-Webster
46
D. Interviewees
Name Organisation Role
Peter Nieuwenhuizen AkzoNobel Director Innovation, Partnerships & Complexity Reduction
Martijn van Loon AkzoNobel Strategy Analyst
Ton Runneboom Biorenewables Business Platform Chairman
Hans van der Pol Corbion Strategic Marketing Director – New Business Ventures
German Heil Corbion Project Director Biomass
Stephan Paauwe Corbion Supply Chain Development Director
Floris Buijzen Corbion Market Development Manager – New business Ventures
Anton Robek DSM President Biobased Products & Services
Oliver May DSM Head R&D Biobased Products & Services
Stefanie Eggers KWS Project Manager Business Development Sugarbeet
Daniël Kerkhof Limako Director
Jan Nieuwenhuis Ministry of Economic Affairs Director Biobased Economy
Daniëlle de Nie Natuur & Milieu Senior project manager
Rein Coster NFIA Director Chemicals
Paul Bosch Rabobank Associate Analyst F&A Research
Justin Sherrard Rabobank Global strategist F&A Supply Chain
Hans van Hooren Rabobank Executive Director Large Corporates – Team F&A
Daan Dijk Rabobank Managing Director Sustainable Business Development
Gerbrand Haanschoten Rabobank SVP Project Finance
Simone te Buck RVO Advisor BioBased Economy
Koos van Haasteren SABIC Vice-president Europe
Jan de Boer SABIC Green Chemistry Campus Technology Leader
Peter van der Ham SABIC Sustainable Projects Development Leader
Albert Markusse Suiker Unie CEO
Gert Sikken Suiker Unie Managing Director Agricultural Affairs
Paul Mesters Suiker Unie Director Production
Frank van Noord Suiker Unie Director R&D
Erik van Hellemond Suiker Unie Project leader biobased technology
Job Jan Simmelink Suiker Unie Business Analyst
Mario Vissers Suiker Unie Business Analyst
Jan-Harm Urbanus TNO Technology manager Biobased Economy
Colette Alma VNCI General Director
Nelo Emerencia VNCI Speerpuntmanager Onderwijs & Innovatie
Johan Sanders WUR Food & Biobased Research Innovation Manager
47
E. Steering committee
• Ton Runneboom (BBP)• Simone te Buck (RVO)• Hans van der Pol (Corbion)• Daan Dijk (Rabobank)• Hans van Hooren (Rabobank)• Albert Markusse (Suiker Unie)

48
F. Reference material
[1] Althoff, J., Biesheuvel, K., de Kok, A., Pelt, H., Ruitenbeek, M, Spork, G., Tange, J., and Wevers, R., (2013) Economic Feasibility of the Sugar Beet-to-Ethylene Value Chain
[2] Annevelink, A., de Jong, E., van Ree, R. and Zwart, R.W.R. (2006) Official minutes of the first workshop on the possibilities of biorefinery concepts for the industry, held at hotel “De Wageningse Berg”, Wageningen, the Netherlands.
[3] Biobased Industry Consortium (July 2012) Accelerating innovation and market uptake of biobased products[4] Carus, M., Carrez D., Kaeb, H., Ravenstijn, J., Venus, J. (2011) Policy paper on Bio-based Economy in the EU.
Level Playing Field for Bio-based Chemistry and Materials. Updated version 6 June 2011[5] Dammer, L., Carus M. (2014) Study in investment climate in biobased industries in the Netherlands.
Nova Institute[6] Deloitte Consulting LLP and BioBusiness Alliance of Minnesota (2009) Destination 2025. Focus on the Future of
the Renewable Materials Industry[7] F.O.Licht (2014) International sugar and sweetener report 2. World sugar balances 2004/05 – 2013/14[8] Fresco, L., Dijk. D. (2006) Biomass for food or fuel [9] Giordano, D. (2014) Green chemistry: PROESA (r) technology to convert biomass into biobased chemicals [10] LMC International (2011) Analysis of Support Measures in Sugar Industries. Report for CEFS Brussels[11] LMC International (2014) Sugar and HFS Production Costs. Global Benchmarking 2014 Report[12] März, Ulrich Dr. (2009) Market research report World markets for fermentation ingredients FOD020C
BCC research[13] OECD (2006) Agricultural market impacts of future growth in the production of biofuels[14] Rabobank, Food and Agribusiness Research and Advisory (2014) Bioplastics moving to the Beet[15] Sanders, J (2014) Biorefinery The bridge between agriculture and chemistry. Farewell address at WUR[16] Soare, A, Kersch, K, Lux research (20..) The Bio-based Chemical Industry through 2030 [17] Suurs, R., Roelofs, E. (2014) Quickscan investeringsklimaat voor biobased bedrijven TNO[18] Suurs, R., Roelofs, E. (2014) Biobased investment climate in the Netherlands and Europe[19] King, D., Hagan, A., Löffler, K., Gillman, N., Weihe, U. and Oertel, S. -World Economic Forum- (2014) The
Future of Industrial Biorefineries
Presentations[21] Vaseghi, S., WEF and Deloitte (2010) Biorefineries and a fresh Perspective for Collaborative Innovation in the
Chemical Industry

49
Websites
Source URL
[22] Merriam Webster Dictionary http://www.merriam-webster.com/
[23] FO Licht – Renewables Database http://www.renewablechemicals.net
[24] FAO http://faostat.fao.org/
[25] USDA Nutrient Database http://ndb.nal.usda.gov/ndb/search/list
[26] OECD-FAO Agricultural Outlook 2013-2022 http://stats.oecd.org/viewhtml.aspx?QueryId=48184&vh=0000&vf=0&l&il=&lang=en#
[27] Bloomberg http://www.bloomberg.com
[28] Oanda www.oanda.com/currency/historical-rates/
[29] Indexmundi http://www.indexmundi.com/commodities/?commodity=rice&months=120
[30] Unica http://english.unica.com.br/
[31] Corn Refiners Association http://www.corn.org/
[32] Thai Tapioca Association http://www.thaitapiocastarch.org/
[33] Overleggroep Natte Veevoeders http://www.opnv.nl/index.php?option=com_zoo&task=category&category_id=1&Itemid=250
[34 Nova Insitute http://www.biobased.eu/market_study/onlinedb/
[35] Kirin http://www.kirinholdings.co.jp/english/news/2013/0822_01.html
[36] USDA http://www.ers.usda.gov/data-products/sugar-and-sweeteners-yearbook-tables.aspx#25442
[37] Agricultural Marketing Resource Centre http://www.agmrc.org/renewable_energy/ethanol/ethanol__prices_trends_and_markets.cfm
[38] VNCI Website https://www.vnci.nl/chemie/feiten-en-cijfers/
[39] EIA http://tonto.eia.gov/dnav/pet/hist/LeafHandler.ashx?n=PET&s=RBRTE&f=D
‘Agri-footprint data retrieved via SimaPro 8.0.3 on 2 July 2014. Dextrose data based on Blonk Consultants (2013) LCA study of fructose and HFCS’
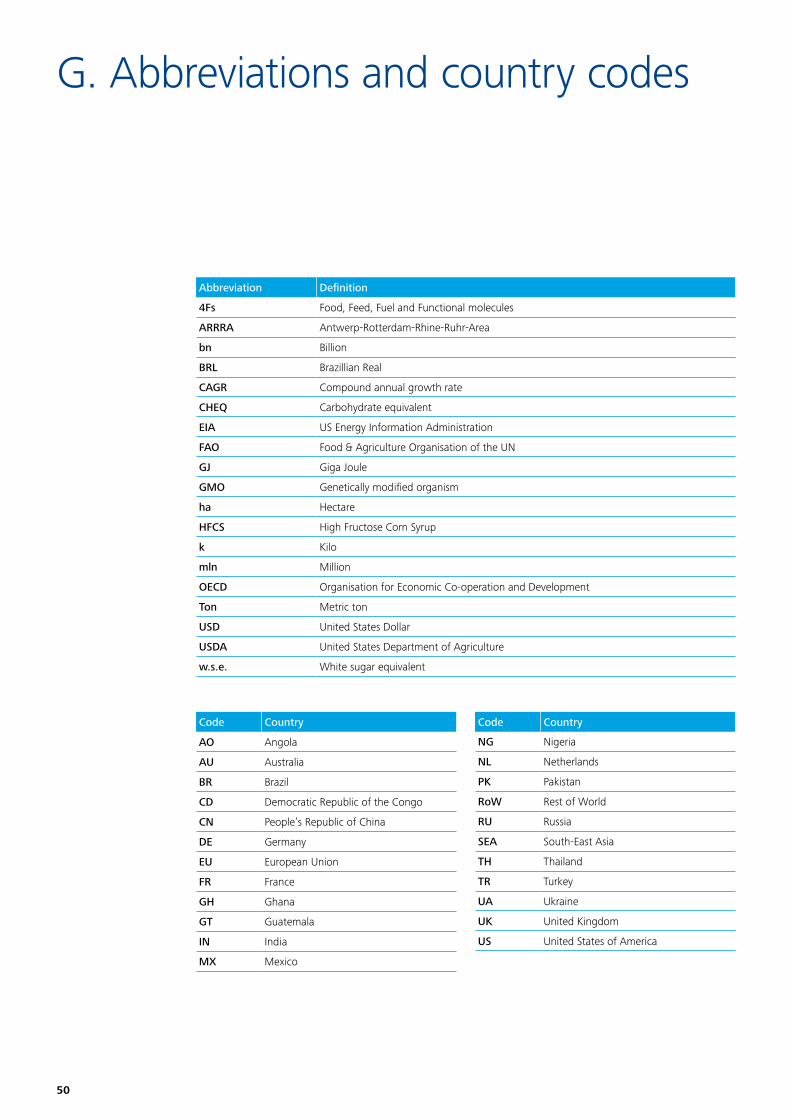
50
Abbreviation Definition
4Fs Food, Feed, Fuel and Functional molecules
ARRRA Antwerp-Rotterdam-Rhine-Ruhr-Area
bn Billion
BRL Brazillian Real
CAGR Compound annual growth rate
CHEQ Carbohydrate equivalent
EIA US Energy Information Administration
FAO Food & Agriculture Organisation of the UN
GJ Giga Joule
GMO Genetically modified organism
ha Hectare
HFCS High Fructose Corn Syrup
k Kilo
mln Million
OECD Organisation for Economic Co-operation and Development
Ton Metric ton
USD United States Dollar
USDA United States Department of Agriculture
w.s.e. White sugar equivalent
G. Abbreviations and country codes
Code Country
AO Angola
AU Australia
BR Brazil
CD Democratic Republic of the Congo
CN People’s Republic of China
DE Germany
EU European Union
FR France
GH Ghana
GT Guatemala
IN India
MX Mexico
Code Country
NG Nigeria
NL Netherlands
PK Pakistan
RoW Rest of World
RU Russia
SEA South-East Asia
TH Thailand
TR Turkey
UA Ukraine
UK United Kingdom
US United States of America

51

Deloitte refers to one or more of Deloitte Touche Tohmatsu Limited, a UK private company limited by guarantee (“DTTL”), its network of member firms, and their related entities. DTTL and each of its member firms are legally separate and independent entities. DTTL (also referred to as “Deloitte Global”) does not provide services to clients. Please see www.deloitte.nl/about for a more detailed description of DTTL and its member firms.
Deloitte provides audit, tax, consulting, and financial advisory services to public and private clients spanning multiple industries. With a globally connected network of member firms in more than 150 countries and territories, Deloitte brings world-class capabilities and high-quality service to clients, delivering the insights they need to address their most complex business challenges. Deloitte’s more than 200,000 professionals are committed to becoming the standard of excellence.
This communication contains general information only, and none of Deloitte Touche Tohmatsu Limited, its member firms, or their related entities (collectively, the “Deloitte network”) is, by means of this communication, rendering professional advice or services. No entity in the Deloitte network shall be responsible for any loss whatsoever sustained by any person who relies on this communication.
© 2014 Deloitte The Netherlands