opioids and substances of misuse - alberta.ca · alberta health . opioids and substances of misuse...
TRANSCRIPT

Alberta Health
Opioids and Substances of Misuse Alberta Report, 2016 Q4
February 7, 2017

Alberta Health, Health Standards, Quality, and Performance Opioids and Substances of Misuse, Alberta Report, 2016 Q4 February 7, 2017
© 2017 Government of Alberta Page 1
Opioids and Substances of Misuse Alberta Report 2016 Q4 Key points
• From January to December 2016, 343 individuals died from an apparent drug overdose related to fentanyl in Alberta (including 22 cases where carfentanil was involved).
• In 2016, of the 343 drug overdose deaths related to fentanyl, 70 deaths occurred in the first quarter, 81 in the second, 81 in the third, and 111 in the fourth. By comparison, in 2015 there were 257 deaths related to fentanyl, with 73 occurring in the first quarter, 66 in the second, 66 in the third, and 52 in the fourth.
• The majority of deaths (89%) in 2016 occurred in larger urban centers. 83 per cent of the deaths in 2015 occurred in larger urban centers.
• From Jan-Dec 2016, the rate of drug overdose deaths related to fentanyl in the Calgary Zone was 9.3 per 100,000 (n=150), and 8.1 in the Edmonton Zone (n=109).
• The majority of drug overdose deaths related to fentanyl that occurred in the cities of Edmonton and Calgary occurred outside of the central urban core (85%).
• Approximately 25 per cent of deaths that occurred in the cities of Edmonton and Calgary were among individuals with no fixed address or an unknown home address.
• From Jan. 1, 2014 to September 30, 2016 there were (approximately) 19,930 emergency and urgent care visits related to opioids and other substances of misuse, averaging 1,812 visits per quarter.
• These emergency and urgent care visits occurred among (approximately) 13,970 unique individuals, of whom, 22 per cent had more than one visit. There has been an increase in the number of visits over time, with 53 per cent more in the third quarter of 2016 compared to the third quarter of 2014.
• From Jan. 1, 2014 to Dec. 31, 2016, the quarterly opioid dispensations from community pharmacies increased by 23 per cent to approximately 1,034,000 in the Q4 of 2016.
• From Jan. 1, 2014 to Dec. 31, 2016, a quarterly average of approximately 12 per cent of people with an opioid dispensation from a community pharmacy were dispensed an oral morphine equivalence (OME) greater than 200 mg per day.

Alberta Health, Health Standards, Quality, and Performance Opioids and Substances of Misuse, Alberta Report, 2016 Q4 February 7, 2017
© 2017 Government of Alberta Page 2
Disclaimer This surveillance report presents emergency department, prescriptions from community pharmacies, emergency medical services, and mortality data associated with opioids and other substances of misuse in Alberta. Results are subject to change based on differences in reporting schedules and updates from the various data systems.
The majority of data is presented on a quarterly basis from Jan. 1, 2014 (unless specified otherwise) and includes the most recent quarterly data available at the time the report is created. Data sources are updated at differing time periods. Data may change in later reporting as it is submitted by the medical examiner, health facilities, and pharmacies. Recent data may be less complete due to delays in data submission. Emergency department data can have up to a three month lag and therefore, the most recent quarter is not included for this data.
Mortality data is subject to change as certification of deaths can take up to six months. Deaths in this report includes Albertans who died from an apparent drug overdose related to fentanyl and apparent drug overdose deaths related to an opioid other than fentanyl.
Due to the complexity of non-fentanyl opioid related drug overdose deaths, and the ongoing investigations necessary to reliably attribute cause of death in these cases, there is no Q4 data available for non-fentanyl opioid drug overdose deaths in this issue of the report.
The number of apparent drug overdose deaths related to fentanyl/opioids may change (including increases/decreases in previous numbers) as certification of cause of death may lead to a change in classification in some instances. Throughout this report:
• Q1 =January to March
• Q2 = April to June
• Q3 = July to September
• Q4 = October to December
Edmonton census metropolitan area (CMA) includes: City of Edmonton, Fort Saskatchewan, Lancaster Park, Leduc, Sherwood Park, Spruce Grove, St. Albert, and Stony Plain
Calgary census metropolitan area (CMA) include: City of Calgary, Airdrie, Black Diamond, Cochrane, High River, and Okotoks Oral Morphine Equivalence (OME) is a relative measure of the strength of an opioid in comparison to the strength of morphine. Cut offs of 90 and 200 OME were used for the purpose of this report as these are often used as benchmarks to indicated higher doses than would typically be clinically indicated.
For more details on data sources and methods, please see the Data notes section at the end of this report.
Alberta Health, Health Standards, Quality, and Performance Opioids and Substances of Misuse, Alberta Report, 2016 Q4 February 7, 2017
© 2017 Government of Alberta Page 3
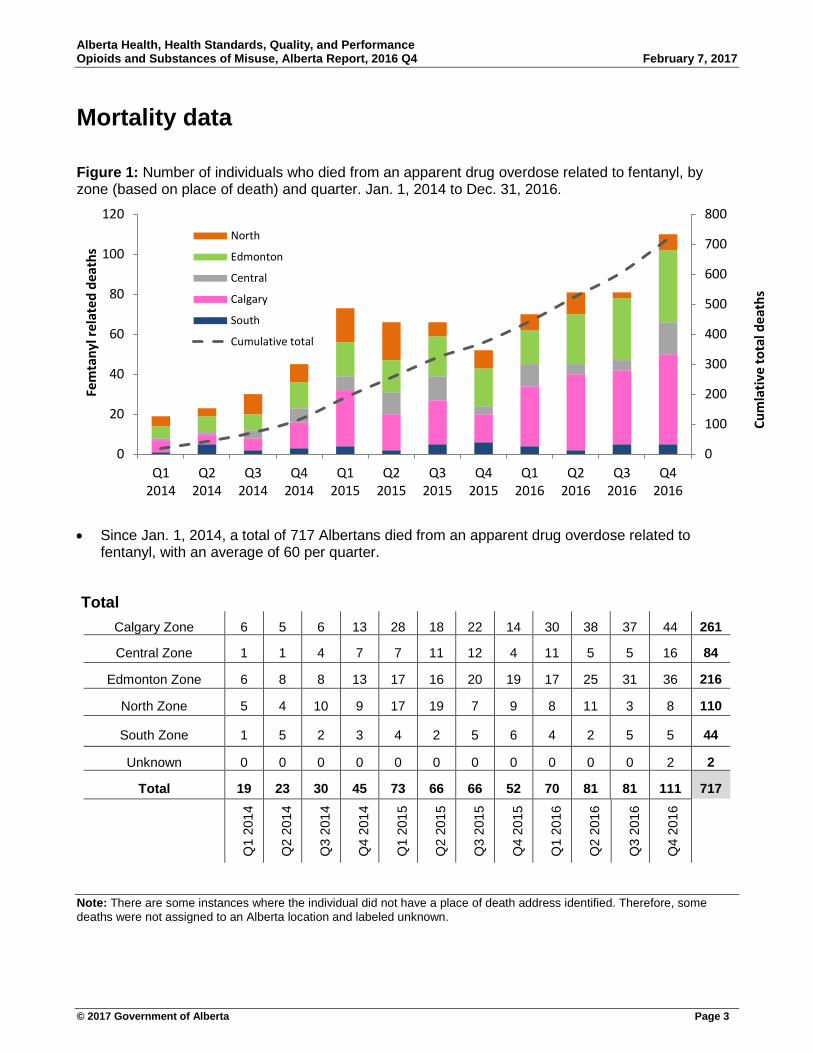
Mortality data Figure 1: Number of individuals who died from an apparent drug overdose related to fentanyl, by zone (based on place of death) and quarter. Jan. 1, 2014 to Dec. 31, 2016.
• Since Jan. 1, 2014, a total of 717 Albertans died from an apparent drug overdose related to
fentanyl, with an average of 60 per quarter.
Total Calgary Zone 6 5 6 13 28 18 22 14 30 38 37 44 261
Central Zone 1 1 4 7 7 11 12 4 11 5 5 16 84
Edmonton Zone 6 8 8 13 17 16 20 19 17 25 31 36 216
North Zone 5 4 10 9 17 19 7 9 8 11 3 8 110
South Zone 1 5 2 3 4 2 5 6 4 2 5 5 44
Unknown 0 0 0 0 0 0 0 0 0 0 0 2 2
Total 19 23 30 45 73 66 66 52 70 81 81 111 717
Q1
2014
Q2
2014
Q3
2014
Q4
2014
Q1
2015
Q2
2015
Q3
2015
Q4
2015
Q1
2016
Q2
2016
Q3
2016
Q4
2016
Note: There are some instances where the individual did not have a place of death address identified. Therefore, some deaths were not assigned to an Alberta location and labeled unknown.
0
100
200
300
400
500
600
700
800
0
20
40
60
80
100
120
Q12014
Q22014
Q32014
Q42014
Q12015
Q22015
Q32015
Q42015
Q12016
Q22016
Q32016
Q42016
Cum
lativ
e to
tal d
eath
s
Fem
tany
l rel
ated
dea
ths
North
Edmonton
Central
Calgary
South
Cumulative total

Alberta Health, Health Standards, Quality, and Performance Opioids and Substances of Misuse, Alberta Report, 2016 Q4 February 7, 2017
© 2017 Government of Alberta Page 4
Figure 2: Rate of deaths per 100,000 due to an apparent drug overdose related to fentanyl, by place of death, by Zone & number of deaths in major urban centers* 2014–2016
Total deaths to date since Jan 1, 2014: 717
• The rate of deaths per 100,000 due to an apparent drug overdose related to fentanyl increased by 110 per cent from 2014 to 2015, and by 33 per cent from 2015 to 2016.
• Compared to Edmonton CMA, Calgary CMA had 38 per cent more apparent drug overdose deaths related to fentanyl in 2016.
• From 2014 to 2016, 85 per cent (606) of these deaths occurred in larger urban centers. Fort McMurray (35), Grand Prairie (36), Red Deer (39), Medicine Hat (10), Lethbridge (22), Edmonton CMA (215), Calgary CMA (249).
Note: Coloured (orange-red) Zones represent fatality rate per 100,000 and blue circles represent number of deaths in major urban centers.
* Fort McMurray, rand Prairie, Red Deer, Medicine Hat, Lethbridge, Edmonton, Calgary, and municipalities within the census metropolitan area of Edmonton and Calgary.
Total AB deaths: 117|AB rate: 2.9
Deaths in urban centers: 88
Total AB deaths: 257 |AB rate: 6.1
Deaths in urban centers: 213
Total AB deaths: 343 |AB rate: 8.1
Deaths in urban centers: 305
2014 2015 2016

Alberta Health, Health Standards, Quality, and Performance Opioids and Substances of Misuse, Alberta Report, 2016 Q4 February 7, 2017
© 2017 Government of Alberta Page 5
Figure 3: Proportion of apparent drug overdose deaths related to fentanyl, by central urban core/non-central core addresses, in the Cities of Edmonton and Calgary, based on the individual’s home address, Jan. 1, 2016 to Dec. 31, 2016.
Edmonton central urban core: Boyle Street, Central McDougall, McCauley, Oliver, Queen Mary Park, Riverdale, Rossdale Cloverdale, Garneau, Strathcona , University of Alberta.
Calgary central urban core: Downtown (including the Downtown West End and Downtown East Village), Eau Claire, Chinatown, Beltline, Connaught/Cliff Bungalow, and Victoria Park.
If an individual had a unknown address, but died in Edmonton or Calgary, they were included as NFA/address unknown.
5.4%
64.1%
30.4%
City of Edmonton
Central urban core
Non central urban core
No fixed address oraddress unknown
6.5%
73.2%
20.3%
City of Calgary
Central urban core
Non central urban core
No fixed address oraddress unknown
Total deaths included: 92
Total deaths included: 138

Alberta Health, Health Standards, Quality, and Performance Opioids and Substances of Misuse, Alberta Report, 2016 Q4 February 7, 2017
© 2017 Government of Alberta Page 6
Figure 4: Proportion of apparent drug overdose deaths related to fentanyl, by central urban core/non-central core addresses in the Cities of Edmonton and Calgary, based on the place of death, Jan. 1, 2016 to Dec. 31, 2016.
Edmonton central urban core: Boyle Street, Central McDougall, McCauley, Oliver, Queen Mary Park, Riverdale, Rossdale Cloverdale, Garneau, Strathcona , University of Alberta.
Calgary central urban core: Downtown (including the Downtown West End and Downtown East Village), Eau Claire, Chinatown, Beltline, Connaught/Cliff Bungalow, and Victoria Park.
There are instances where an individual died in Edmonton or Calgary, but resided outside the cities
20.0%
80.0%
City of Edmonton
Central urban core
Non central urban core
11.4%
88.6%
City of Calgary
Central urban core
Non central urban core
Total deaths included: 95
Total deaths included: 140
Alberta Health, Health Standards, Quality, and Performance Opioids and Substances of Misuse, Alberta Report, 2016 Q4 February 7, 2017
© 2017 Government of Alberta Page 7
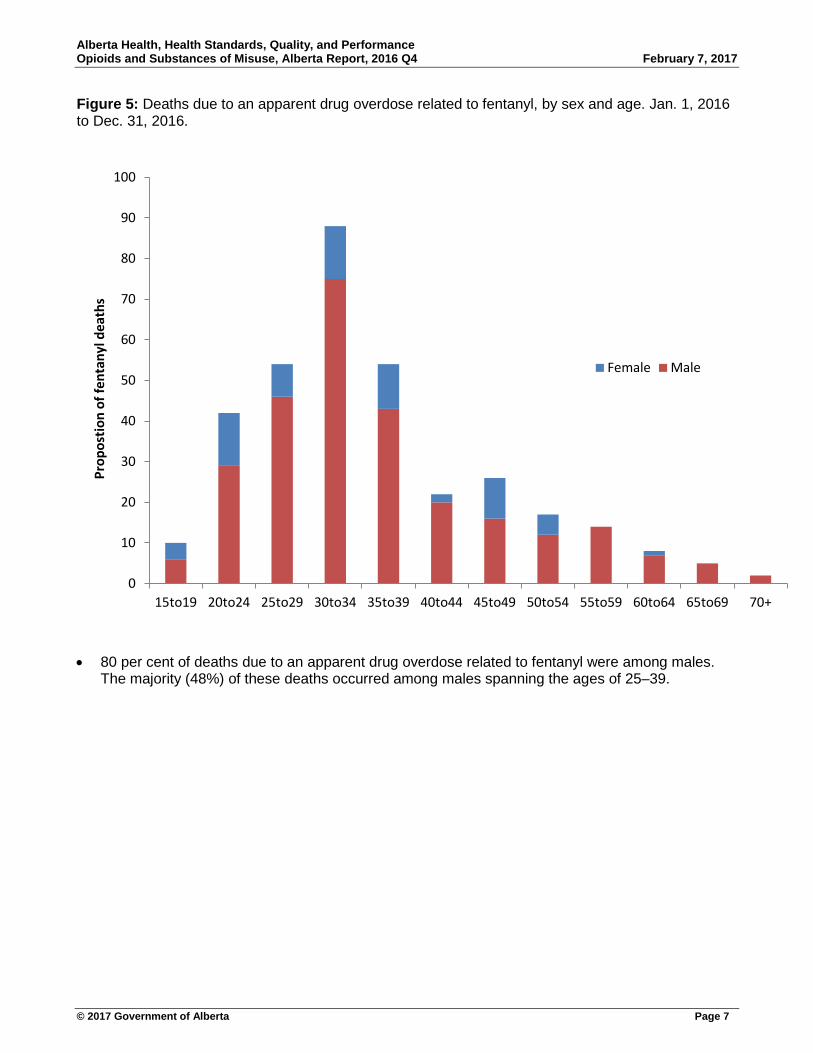
Figure 5: Deaths due to an apparent drug overdose related to fentanyl, by sex and age. Jan. 1, 2016 to Dec. 31, 2016.
• 80 per cent of deaths due to an apparent drug overdose related to fentanyl were among males. The majority (48%) of these deaths occurred among males spanning the ages of 25–39.
0
10
20
30
40
50
60
70
80
90
100
15to19 20to24 25to29 30to34 35to39 40to44 45to49 50to54 55to59 60to64 65to69 70+
Prop
ostio
n of
fent
anyl
dea
ths
Female Male

Alberta Health, Health Standards, Quality, and Performance Opioids and Substances of Misuse, Alberta Report, 2016 Q4 February 7, 2017
© 2017 Government of Alberta Page 8
Figure 6: Proportion of deaths due to an apparent drug overdose related to fentanyl, by additional substances contributing to cause of death. Jan. 1, 2016 to Dec. 31, 2016.
• Among deaths due to an apparent drug overdose related to fentanyl, multiple substances are
involved in the majority of deaths. The most frequent being cocaine, alcohol, and methamphetamine.
Note: Out of all reported apparent drug overdose related to fentanyl, 124 had the substances contributing to the cause of death confirmed.
Prescribable opioid includes: codeine, oxycodone, hydromorphone, tramadol, morphine, and methadone
57%
25%
18%
15%
9%
6%
5%
2%
0% 10% 20% 30% 40% 50% 60%
Multi-substance (inlcudes at least one othersubstances in addition to fentanyl)
Cocaine
Alcohol
Methamphetamine
Heroin
Benzodiazepines
Prescribable opioid
W 18

Alberta Health, Health Standards, Quality, and Performance Opioids and Substances of Misuse, Alberta Report, 2016 Q4 February 7, 2017
© 2017 Government of Alberta Page 9
Figure 7: Proportion of deaths due to an apparent drug overdose related to fentanyl, by medical history within the 30 days before the date of death. Jan. 1, 2016 to Dec. 31, 2016.
• Among deaths due to an apparent drug overdose related to fentanyl, the most frequent health
care utilization within the 30 days before the individual’s date of death was a dispensation for an opioid, antidepressant, or anxiolytic, and/or a service related to a mental health or substance abuse issue.
Note: 134 deaths due to an apparent drug overdose related to fentanyl, had their primary healthcare (PHN) number available and are therefore included this analysis. The above includes the number of individuals who sought one of the services at least once. Individuals can be counted in more than one category.
36%
24%
16%
13%
10%
3%
2%
1%
0% 5% 10% 15% 20% 25% 30% 35% 40%
Antidepressant/anxiolytic prescribed from acommunity pharmacy
Opioid dispensed from a community pharmacy
Substance abuse related visit (physician, inpatient, oremergency visit)
ED visit related to opioid/substances of misuse
Mental health related visit (physician, inpatient, oremergency visit)
Methadone dispensed from a community pharmacy
Medical care for pain (physician, inpatient, oremergency visit)
Suboxone dispensed from a community pharmacy
Within 30 days before death

Alberta Health, Health Standards, Quality, and Performance Opioids and Substances of Misuse, Alberta Report, 2016 Q4 February 7, 2017
© 2017 Government of Alberta Page 10
Figure 8: Proportion of deaths due to an apparent drug overdose related to fentanyl, by prescription opioid related factors within the year before the date of death. Jan. 1, 2016 to Dec. 31, 2016.
• Among deaths due to an apparent drug overdose related to fentanyl, almost 60 per cent of the
individuals who had an opioid prescribed in the year before their death, also had a benzodiazepine prescribed within a week before or after an opioid was prescribed.
• Almost 40 per cent of individuals were prescribed an opioid from three or more different health care providers. In addition, 23 per cent of individuals went to three or more pharmacies for an opioid prescription.
• The most frequent type of opioid prescribed in the year leading up to a drug overdose death that matched one of the types of opioid that contributed to the cause of death were codeine and hydromorphone.
Note: The above includes 72 individuals who had at least one opioid prescribed in the year leading up to their death.
56%
55%
23%
18%
11%
4%
4%
37%
23%
7%
7%
3%
0% 10% 20% 30% 40% 50% 60% 70% 80% 90% 100%
Benzodiazepine prescription 1 week before or after an…
Codeine prescription
Oxycodone prescription
Hydromorphone prescription
Tramadol prescription
Fentanyl prescription
Morphine prescription
Opioid prescribed from multiple providers (3 or more)
Opioid dispensed from multiple pharmacies (3 or more)
Type of opioid prescribed same as…
≥ OME 90 mg per day
≥ OME 200 mg per day
Within 365 days before death

Alberta Health, Health Standards, Quality, and Performance Opioids and Substances of Misuse, Alberta Report, 2016 Q4 February 7, 2017
© 2017 Government of Alberta Page 11
Figure 9: Deaths due to an apparent drug overdose related to an opioid other than fentanyl, by prescription opioid related factors within the year before the date of death. Jan. 1, 2016 to Dec. 31, 2016
• Among deaths due to an apparent drug overdose related to an opioid other than fentanyl, over 70
per cent of the individuals who had an opioid prescribed in the year before their death, also had a benzodiazepine prescribed within a week before or after an opioid was prescribed.
• Almost 40 per cent of individuals were prescribed an opioid from three or more different health care provider. In addition, over 34 per cent of individuals went to more than one pharmacy for an opioid prescription.
• The most frequently type of opioid prescribed in the year leading up to a drug overdose death that matched one of the types of opioid that contributed to the cause of death was oxycodone.
Note: The above includes 38 individuals who had at least one opioid prescribed in the year leading up to their death.
76%
63%
45%
11%
8%
5%
8%
39%
34%
26%
26%
13%
0% 10% 20% 30% 40% 50% 60% 70% 80% 90% 100%
Benzodiazepine prescription 1 week before or after an…
Codeine prescription
Oxycodone prescription
Hydromorphone prescription
Morphine prescription
Tramadol prescription
Fentanyl prescription
Opioid prescribed from multiple providers (3 or more)
Opioid dispensed from multiple pharmacies (3 or more)
Type of opioid prescribed same as…
≥ OME 90 mg per day
≥ OME 200 mg per day
Within 365 days before death

Alberta Health, Health Standards, Quality, and Performance Opioids and Substances of Misuse, Alberta Report, 2016 Q4 February 7, 2017
© 2017 Government of Alberta Page 12
Emergency department visits Figure 10: Rate of emergency department (ED) visits related to opioid use and other substances of misuse, by quarter and zone, per 100,000 population. Jan. 1, 2014 to Sept. 30, 2016.
• The rate of emergency department visits related to opioid use and substance misuse increased by an average of six per cent on a quarterly basis from 2014–2106, and increased by 23 per cent from the first quarter in 2016 to the third quarter in 2016.
• The rate of emergency department visits related to opioid use and substance misuse in the South Zone was the highest on average; approximately 23 per cent higher the provincial average.
• The Edmonton and Calgary zones had the highest number of emergency department visits related to opioid use and substance misuse, and on average per quarter made up 27 and 29 per cent of all provincial ED visits related to opioid use and other substances of misuse, respectively.
0
10
20
30
40
50
60
70
80
90
ED v
isit
rate
per
100
,000
Calgary
Central
Edmonton
North
South
Alberta Health, Health Standards, Quality, and Performance Opioids and Substances of Misuse, Alberta Report, 2016 Q4 February 7, 2017
© 2017 Government of Alberta Page 13
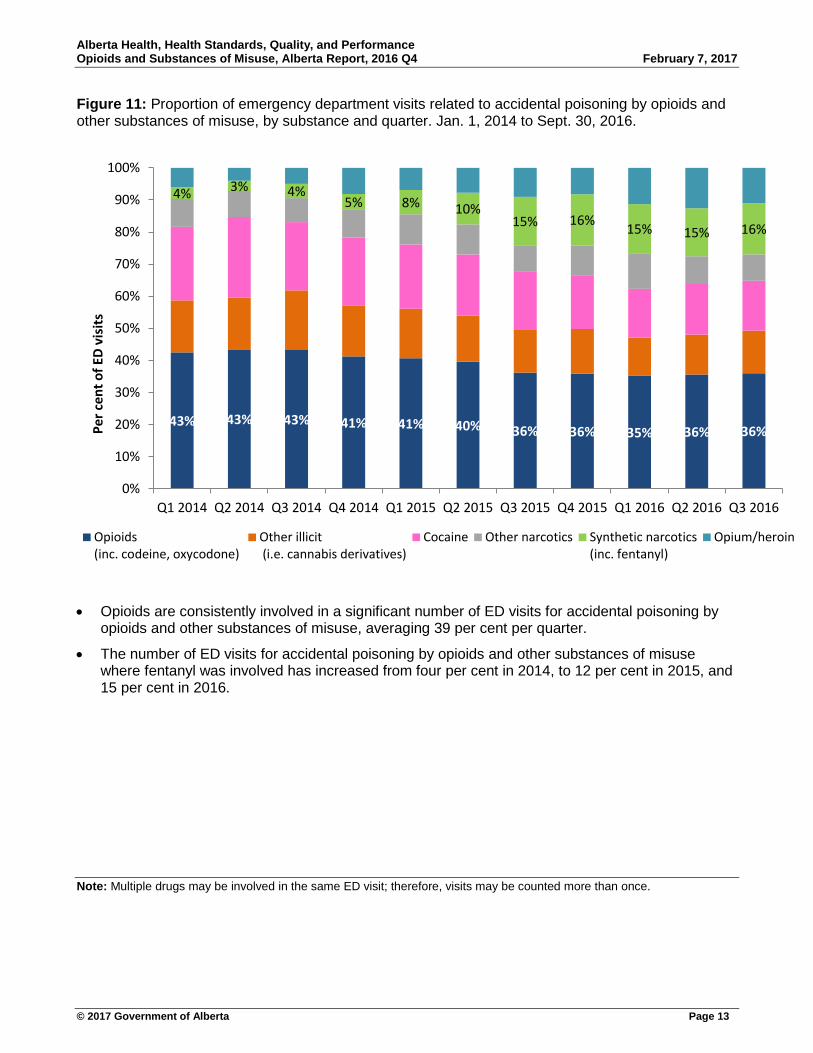
Figure 11: Proportion of emergency department visits related to accidental poisoning by opioids and other substances of misuse, by substance and quarter. Jan. 1, 2014 to Sept. 30, 2016.
• Opioids are consistently involved in a significant number of ED visits for accidental poisoning by opioids and other substances of misuse, averaging 39 per cent per quarter.
• The number of ED visits for accidental poisoning by opioids and other substances of misuse where fentanyl was involved has increased from four per cent in 2014, to 12 per cent in 2015, and 15 per cent in 2016.
Note: Multiple drugs may be involved in the same ED visit; therefore, visits may be counted more than once.
43% 43% 43% 41% 41% 40% 36% 36% 35% 36% 36%
4% 3% 4% 5% 8% 10%
15% 16% 15% 15% 16%
0%
10%
20%
30%
40%
50%
60%
70%
80%
90%
100%
Q1 2014 Q2 2014 Q3 2014 Q4 2014 Q1 2015 Q2 2015 Q3 2015 Q4 2015 Q1 2016 Q2 2016 Q3 2016
Per c
ent o
f ED
visi
ts
Opioids(inc. codeine, oxycodone)
Other illicit (i.e. cannabis derivatives)
Cocaine Other narcotics Synthetic narcotics(inc. fentanyl)
Opium/heroin

Alberta Health, Health Standards, Quality, and Performance Opioids and Substances of Misuse, Alberta Report, 2016 Q4 February 7, 2017
© 2017 Government of Alberta Page 14
Figure 12: Emergency department visits related to poisoning by opioids and narcotics by cause and age. Jan. 1, 2014 to Sept. 30, 2016.
• Among those under the age of five, nearly all opioid poisonings are accidental (97%).
• Opioid poisoning as a result of intended self –harm was most frequent among youth aged 5–14 (57%), and decreased as age increased.
• Among older individuals, opioid poisoning as a result of an adverse reaction during therapeutic use occurred most frequently, especially among those 85 and older (54%).
0%
10%
20%
30%
40%
50%
60%
70%
80%
90%
100%
0 to 4 5 to 14 15 to 24 25 to 39 40 to 64 65 to 84 85 +
Prop
ortio
n of
ED
visi
ts fo
r opi
oid
pois
onin
g
Age group
Accidental Intented self harm Adverse reaction during theraputic use Unknown

Alberta Health, Health Standards, Quality, and Performance Opioids and Substances of Misuse, Alberta Report, 2016 Q4 February 7, 2017
© 2017 Government of Alberta Page 15
Figure 13: Number of emergency department visits related to opioid and narcotic use, by individual’s opioid prescription status (from a community pharmacy) in the last 12 months, by sex and age. Jan. 1, 2014 to Sept. 30, 2016.
• In general, males had significantly more visits than females across most age groups, most notably in the age groups spanning 20–44 years of age. For both sexes, persons between 25–29 years of age had the most emergency department visits.
• On average, 20 per cent of individuals visiting the emergency department for opioid and narcotic use were taking prescription opioids equivalent to 90 mg of morphine per day in the year leading up to their ED visit.
• Among individuals aged 65 and higher, males were 1.8 times more likely than females to have an OME of 90 mg or more per day in the year before their ED visit related to opioid and narcotic use.
Oral Morphine Equivalence (OME) is the strength of an opioid equivalent to the strength of morphine. OME is calculated; OME = strength (in mg) X quantity X OME conversion factor (unique to opioid type).
900 700 500 300 100 100 300 500 700
0-45-910-1415-1920-2425-2930-3435-3940-4445-4950-5455-5960-6465-6970-7475-7980-8485+
ED visits
Females-Opioid Rx
Males-Opioid Rx
Females-No Opioid Rx
Males-No Opioid Rx

Alberta Health, Health Standards, Quality, and Performance Opioids and Substances of Misuse, Alberta Report, 2016 Q4 February 7, 2017
© 2017 Government of Alberta Page 16
Emergency Medical Services data Figure 14: Distribution of Emergency Medical Services (EMS) responses to opioid related events, Alberta, Jan. 1, 2016 to Dec. 31, 2016.
• In 2016, there were 2,267 EMS responses in Alberta to opioid related events. 84 per cent of these events occurred in the following larger urban centers: City of Calgary (988), City of Edmonton (812), City of Grande Prairie (53), City of Medicine Hat (61).
Note: This data is from AHS EMS Direct delivery – ground ambulance. Air ambulance and Contractors are not included. There are close to 70 communities serviced by contractors, including Ft. McMurray, Lethbridge, and Red Deer. Therefore not all EMS activity is captured here. EMS opioid related events refers to any EMS response where the Medical Control Protocol of Opiate Overdose was documented and/or naloxone was administered.

Alberta Health, Health Standards, Quality, and Performance Opioids and Substances of Misuse, Alberta Report, 2016 Q4 February 7, 2017
© 2017 Government of Alberta Page 17
Figure 15: Distribution of Emergency Medical Services (EMS) responses to opioid related events, Edmonton and Calgary, Jan. 1, 2016 to Dec. 31, 2016.
• Within the City of Edmonton, the areas with the highest concentration of EMS responses to opioid related events were the downtown areas, including Central McDougall, McCauley, and Boyle Street.
• Within the City of Calgary, the areas with the highest concentration of EMS responses to opioid related events were the downtown areas, including the Downtown East Village, Beltline, and Downtown West End. In addition, the Eastern Central areas had high concentrations, including the Forest Lawn areas.
Note: This data is from AHS EMS Direct delivery – ground ambulance. Air ambulance and Contractors are not included. Therefore not all EMS activity is captured here. EMS opioid related events refers to any EMS response where the Medical Control Protocol of Opiate Overdose was documented and/or naloxone was administered.
Edmonton Calgary
Alberta Health, Health Standards, Quality, and Performance Opioids and Substances of Misuse, Alberta Report, 2016 Q4 February 7, 2017
© 2017 Government of Alberta Page 18
Opioid dispensing from community pharmacies
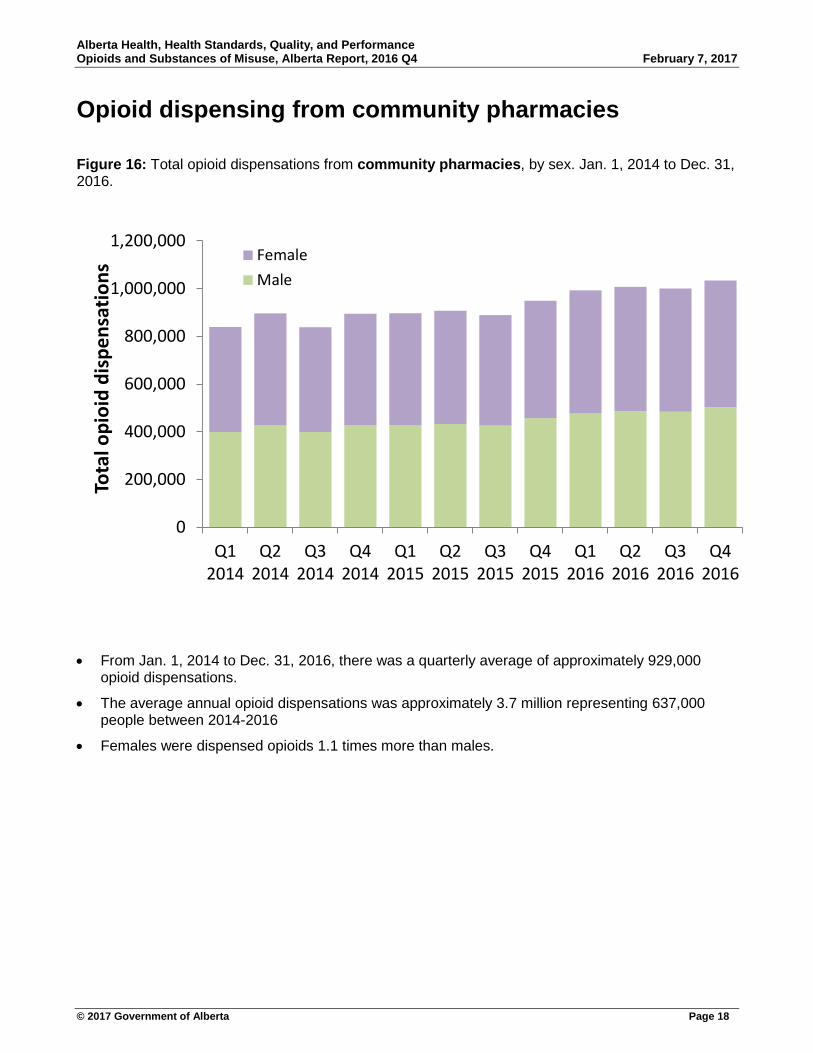
Figure 16: Total opioid dispensations from community pharmacies, by sex. Jan. 1, 2014 to Dec. 31, 2016.
• From Jan. 1, 2014 to Dec. 31, 2016, there was a quarterly average of approximately 929,000 opioid dispensations.
• The average annual opioid dispensations was approximately 3.7 million representing 637,000 people between 2014-2016
• Females were dispensed opioids 1.1 times more than males.
0
200,000
400,000
600,000
800,000
1,000,000
1,200,000
Q12014
Q22014
Q32014
Q42014
Q12015
Q22015
Q32015
Q42015
Q12016
Q22016
Q32016
Q42016
Tota
l opi
oid
disp
ensa
tions
FemaleMale

Alberta Health, Health Standards, Quality, and Performance Opioids and Substances of Misuse, Alberta Report, 2016 Q4 February 7, 2017
© 2017 Government of Alberta Page 19
Figure 17: Rate of opioid dispensations from community pharmacies, by sex and age. Jan. 1, 2016 to Dec. 31, 2016.
• From Jan. 1, 2016 to Dec. 31, 2016, the dispensation rate for opioids was slightly higher in females than males less than 50 years old, and significantly higher among females than males 69 years and older.
• The dispensation rate for opioids was two times higher in females than males among those aged 90 years and older.
0
5000
10000
15000
20000
25000
30000
35000
0to9 10to19 20to29 30to39 40to49 50to59 60to69 70to79 80to89 90+
Disp
ensa
tions
per
10,
000
popu
latio
n
Female
Male
Alberta Health, Health Standards, Quality, and Performance Opioids and Substances of Misuse, Alberta Report, 2016 Q4 February 7, 2017
© 2017 Government of Alberta Page 20
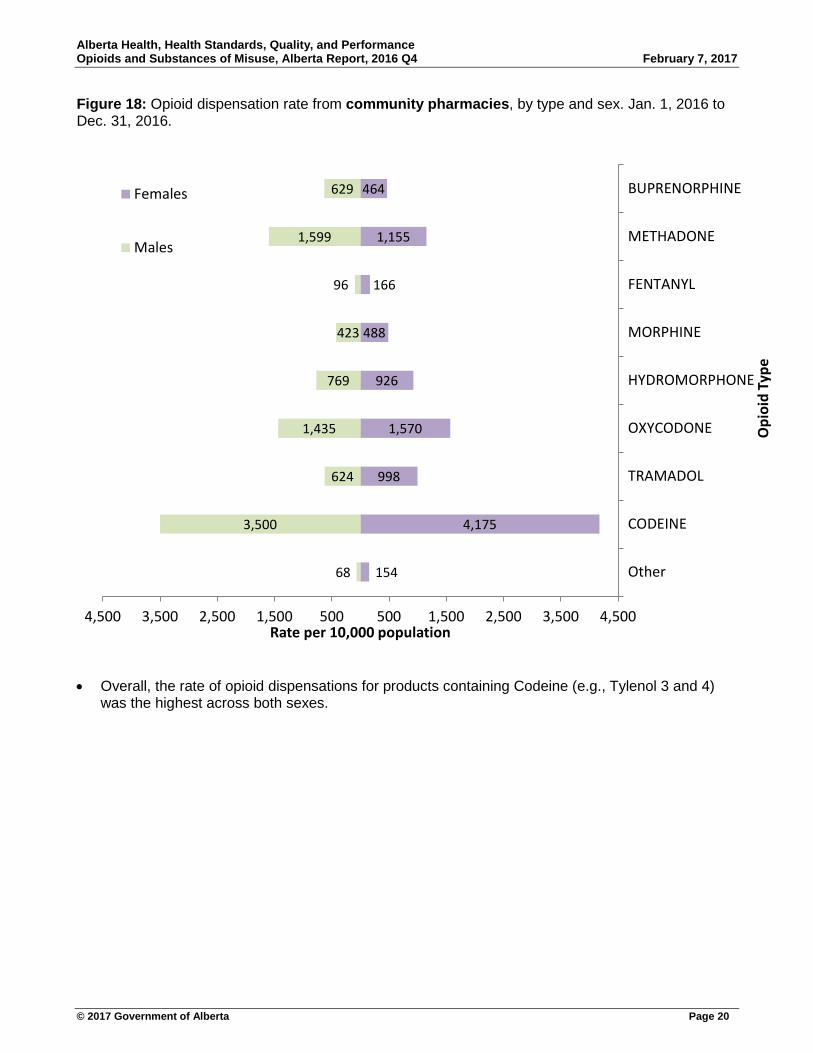
Figure 18: Opioid dispensation rate from community pharmacies, by type and sex. Jan. 1, 2016 to Dec. 31, 2016.
• Overall, the rate of opioid dispensations for products containing Codeine (e.g., Tylenol 3 and 4) was the highest across both sexes.
154
4,175
998
1,570
926
488
166
1,155
464
68
3,500
624
1,435
769
423
96
1,599
629
4,500 3,500 2,500 1,500 500 500 1,500 2,500 3,500 4,500
Other
CODEINE
TRAMADOL
OXYCODONE
HYDROMORPHONE
MORPHINE
FENTANYL
METHADONE
BUPRENORPHINE
Rate per 10,000 population
Opi
oid
Type
Females
Males

Alberta Health, Health Standards, Quality, and Performance Opioids and Substances of Misuse, Alberta Report, 2016 Q4 February 7, 2017
© 2017 Government of Alberta Page 21
Figure 19: Opioid dispensation rate from community pharmacies, by zone and type. Jan. 1, 2016 to Dec. 31, 2016.
.
• The dispensing rate for codeine containing products was by far the highest throughout the province.
• The South Zone had the overall highest dispensing rates for opioids and on average rates were 50 per cent higher than the provincial average.
0
500
1,000
1,500
2,000
2,500
3,000
3,500
4,000
4,500
5,000
South Calgary Central Edmonton North
Disp
ensa
tions
per
10,
000
popu
latio
n
CODEINE FENTANYL HYDROMORPHONE MORPHINE
OXYCODONE TRAMADOL METHADONE Other

Alberta Health, Health Standards, Quality, and Performance Opioids and Substances of Misuse, Alberta Report, 2016 Q4 February 7, 2017
© 2017 Government of Alberta Page 22
Figure 20: The proportion (quarterly average) of people with opioid dispensations from community pharmacies of >90 OME and >200 OME per day, of those with at least one opioid dispensation.
• There is a quarterly average of approximately 12 per cent of people with opioid dispensations
>200 OME per day, and 23 per cent of people with opioid dispensations >90 OME per day.
Oral Morphine Equivalence (OME) is the strength of an opioid equivalent to the strength of morphine. OME is calculated; OME = strength (in mg) X quantity X OME conversion factor (unique to opioid type).
0%
5%
10%
15%
20%
25%
30%
35%
40%
45%
50%
Q12014
Q22014
Q32014
Q42014
Q12015
Q22015
Q32015
Q42015
Q12016
Q22016
Q32016
Q42016
Prop
ortio
n of
peo
ple
with
Opi
oid
Dis
pens
atio
ns
>90 OME per day
>200 OME per day

Alberta Health, Health Standards, Quality, and Performance Opioids and Substances of Misuse, Alberta Report, 2016 Q4 February 7, 2017
© 2017 Government of Alberta Page 23
Naloxone kit dispensing Figure 21: Naloxone kits dispensed through community pharmacies and harm reduction agencies, by zone. Jan. 1, 2016 to Dec. 31, 2016.
• As of Dec 31, 2016, 9,572 naloxone kits have been dispensed to Albertans. This includes
distribution from: community pharmacies, Harm Reduction Agencies, provincial correctional facilities, post-secondary institutions, Opioid Dependency Treatment Clinics, community health centres, inner city agencies, AHS pharmacies, First Nations reserve communities and urgent care centres in urban and rural communities.
• Throughout the province, with the exception of the Edmonton Zone, Harm Reduction agencies are dispensing approximately 60 per cent more naloxone kits compared to community pharmacies.
Number of sites registered to distribute naloxone kits
Community Pharmacies Other sites Total
North Zone 79 52 131
Edmonton Zone 247 34 281
Central Zone 89 36 125
Calgary Zone 271 51 322
South Zone 73 21 94
Total 759 194 953
0
200
400
600
800
1,000
1,200
North Zone Edmonton Zone Central Zone Calgary Zone South Zone
Nal
oxon
e ki
ts d
ispe
nsed
Community Pharmacies
Harm Reduction Agencies

Alberta Health, Health Standards, Quality, and Performance Opioids and Substances of Misuse, Alberta Report, 2016 Q4 February 7, 2017
© 2017 Government of Alberta Page 24
Figure 22: Naloxone kits dispensed through community pharmacies, by zone and month. Jan. 1, 2016 to Dec. 31, 2016.
• The Edmonton zone has had the largest volume of Naloxone kits dispensed, with an average of
70 kits per month. The Calgary zone dispensed the next highest volume with an average of 47 kits per month. Across Alberta, 164 kits were dispensed by community pharmacies a month on average.
• The median age of an individual receiving a Naloxone kit was 35 years, and 57 per cent were male.
• Since Jan 1, 2016, 1,964 naloxone kits have been dispensed from community pharmacies in Alberta. There were 1,593 unique individuals (of the individuals that submitted a primary healthcare number) who had a naloxone kit dispensed. Of those, 208 had more than one claim.
Note: Only naloxone kits dispensed from community pharmacies (as submitted into the Pharmaceutical Information Network) are included in this graph. Naloxone kit distribution occurring from non-pharmacy sites is not captured here.
0
500
1,000
1,500
2,000
2,500
0
50
100
150
200
250
300
350
400
Jan Feb Mar Apr May Jun Jul Aug Sep Oct Nov Dec
Cum
ulat
ive
tota
l kits
dis
pens
ed
Nal
oxon
e ki
ts d
ispe
nsed
North
Edmonton
Central
Calgary
South
Cumulative total

Alberta Health, Health Standards, Quality, and Performance Opioids and Substances of Misuse, Alberta Report, 2016 Q4 February 7, 2017
© 2017 Government of Alberta Page 25
Data notes Data source(s) for report 1. Alberta Ambulatory Care database (ACCS) 2. Alberta Health Care Insurance Plan (AHCIP) Quarterly Population Registry Files 3. Alberta Health and Wellness Postal Code Translation File (PCTF) 4. Pharmaceutical Information Network (PIN) 5. Alberta Consolidated Laboratory Database 6. Scheduled monthly release of OMCE fentanyl & opioid fatality data
Mortality data Mortality statistics are subject to change as certification of deaths can take up to six months due to the inherent complexity of testing and interpretation of results, which requires specialized knowledge and must be done by medical examiners and the Chief Toxicologist and Deputy Chief Toxicologist. The deaths in this report includes Albertans who died from an apparent drug overdose related to fentanyl.
Emergency Medical Services data Emergency Medical Services (EMS) data comes from AHS EMS Direct delivery – ground ambulance services. Air ambulance and Contractors are not included. AHS direct delivery does 97.7 per cent of the operational responses in the City of Edmonton, 99.9 per cent in the City of Calgary, and approximately 82 per cent in the entire province of Alberta. There are close to 70 Alberta communities serviced by contractors, including Ft. McMurray, Lethbridge, and Red Deer. This data does not reflect the contract services in those communities.
Note: AHS dispatch manages EMS resources within a borderless system and will move units (direct delivery/ contractor) to provide coverage and response in any area of the province according to the respective dispatch centre’s system status management plan. Therefore, if an AHS Direct delivery ground unit responded in a community that normally has contracted units stationed in it, this data would be represented here.
EMS opioid related events refers to any EMS response where the Medical Control Protocol of Opiate Overdose was documented and/or naloxone was administered.
Emergency visits Emergency Department (ED) visits are defined by the Alberta MIS chart of accounts. Specifically, the 3 Functional Centre Accounts used to define any ACCS visits into an emergency visit could be: 1. 71310 – Ambulatory care services described as emergency 2. 71513 – Community Urgent Care Centre (UCC). As of 2014, the UCCs in Alberta are listed below:
♦ Airdrie Regional Health Centre, Cochrane Community Health Centre, North East Edmonton Health Centre, Health First Strathcona, Okotoks Health and Wellness Centre, Sheldon M Chumir Centre, South Calgary Health Centre
3. 71514 – Community Advanced Ambulatory Care Centre (AACC). As of 2014, the only AACC in Alberta is La Crete Health Centre
Figure 10: Includes ED visits for all behavioural and mood disorders due to opioid use, and poisoning by all substances-all causes. (All F11 and T40 ICD-10 codes, any diagnosis field)

Alberta Health, Health Standards, Quality, and Performance Opioids and Substances of Misuse, Alberta Report, 2016 Q4 February 7, 2017
© 2017 Government of Alberta Page 26
Figure 11: Includes ED visits for poisoning by all substances-all causes. (All T40 ICD-10 codes, any diagnosis field)
Figure 12: Includes ED visits for poisoning by opioids (including methadone), synthetic narcotics (including fentanyl), and other narcotics-all causes. (T40.2-T40.4, T40.6 ICD-10 codes, any diagnosis field)
Figure 13: Includes ED visits for all behavioural and mood disorders due to opioid use, poisoning by opioids (including methadone), synthetic narcotics (including fentanyl), and other narcotics-all causes. (All F11, T40.2-T40.4, T40.6 ICD-10 codes, any diagnosis field)
“All behavioural and mood disorders due to opioid use” includes: acute intoxication, harmful use, dependence syndrome, withdrawal state, psychotic disorder, amnesic state, other and unspecified disorders.
“Poisoning” refers to an overdose, or toxic effect.
All substances include: opium, heroine, methadone, other opioids, synthetic narcotics (including fentanyl), cocaine, other narcotics, cannabis derivatives, LSD, hallucinogens.
Opioid dispensing and oral morphine equivalents 1. The Pharmaceutical Information Network (PIN) Database is used to estimate dispensation rates
for the province between 2014 and 2016 only from community pharmacies. The dispensation rates presented are not unique and it is possible that one person could have more than one dispensation of the same drug within a week, month, and/or year. Much of this variability is dependent on the way the drug is prescribed.
2. The PIN database is up-to-date; To date, the PIN database has records up to Dec. 31, 2016. PIN records can change due to data reconciliations, which may affect results. Results are more stable with older data, that is, data in 2015 will experience less changes than data in 2016.
3. Dispensation rates are calculated using the adjusted mid-year population size in 2015 and PIN data for the current calendar year. To date, the current calendar year is from Dec. 31, 2015 to Dec. 31, 2016.
4. Oral Morphine Equivalence (OME) is the strength of an opioid equivalent to the strength of morphine. OME is calculated; OME = strength (in mg) X quantity X OME conversion factor (unique to opioid type). OME is used to standardize the strength and quantities of various opioids for purposes of comparison.
5. OME calculations were restricted to drugs administered orally and those with an OME factor. Other units such as “bottles”, “box”, “syrups” were not included.

Alberta Health, Health Standards, Quality, and Performance Opioids and Substances of Misuse, Alberta Report, 2016 Q4 February 7, 2017
© 2017 Government of Alberta Page 27
Opioids types are defined by ATC Code, as given in the table below.
1 The ATC name for R05DA20 is “combinations” which include drugs that contain codeine, hydrocodone, and normethadone hydrochloride. Classifications of codeine and hydrocodone were based on both drug identification number and ATC code. 2 The ATC name for R05FA02 is “opium derivatives and expectorants” which include drugs that contain codeine and hydrocodone. Classifications of these drugs were based on both drug identification number and ATC code. 3 See footnote #1 4 See footnote #2
ATC Code Drug Name ATC Name N02AA59, N02AA79, R05DA04, R05DA201, R05FA022, M03BA53, M03BB53, N02BE51, and N02BA51
Codeine Codeine
R05DA03, R05DA203, R05FA024 Hydrocodone Hydrocodone
N02AB03, N01AH01 Fentanyl Fentanyl
N02AA03 Hydromorphone Hydromorphone
N02AA01 Morphine Morphine
N02AA05, N02AA55, N02BE51, and N02BA51
Oxycodone Oxycodone
N02AX02, N02AX52 Tramadol Tramadol
N07BC02 Methadone Methadone
N02AA Natural Opium Alkaloids
Other
N02AA02 Opium Other
N02AB02 Pethidine Other
N02AC04,N02AC54 Dextropropoxyphene Other
N01AH03 Sufentanil Other
N01AH06 Remifentanil Other
N01AX03 Ketamine Other
R05DA20 Normethadone Other
N02AD01 Pentazocine Other
N02AE01,N04BC51 Buprenorphine Other
N02AF01 Butorphanol Other
N02AF02 Nalbufine Other
N02AX06 Tapentadol Other