opinion of anses on the establishment of · pdf filecomplex, slow or rapid ... shows that...
TRANSCRIPT

ANSES Opinion Request No 2012-SA-0186
The Director General
Maisons-Alfort, 2 December 2016
OPINION of the French Agency for Food, Environmental
and Occupational Health & Safety
on the establishment of recommendations on sugar intake
ANSES undertakes independent and pluralistic scientific expert assessments.
ANSES's public health mission involves ensuring environmental, occupational and food safety as well as assessing the potential health risks they may entail.
It also contributes to the protection of the health and welfare of animals, the protection of plant health and the evaluation of the nutritional characteristics of food.
It provides the competent authorities with the necessary information concerning these risks as well as the requisite expertise and technical support for drafting legislative and statutory provisions and implementing risk management strategies (Article L.1313-1 of the French Public Health Code). Its opinions are made public. This opinion is a translation of the original French version. In the event of any discrepancy or ambiguity the French language text dated 2 December 2016 shall prevail.
On 20 July 2012, ANSES issued an internal request to conduct the following expert appraisal: "balance of three macronutrients in daily energy intake".
1. BACKGROUND AND PURPOSE OF THE REQUEST The most recent French recommendations concerning carbohydrates were issued in 2001 (AFSSA, 2001). For total carbohydrates, the recommended intakes at the time were from 50 to 55% of total energy intake (TEI), without any precise breakdown being proposed between the different types of carbohydrates. However, it was also recommended that "sugars and sweet products be limited to less than 10% of energy intake". Most national and international organisations have proposed reference values for total carbohydrates (EFSA, 2010, WHO, 2015). The issue of total and/or added sugars has also been systematically addressed, but a quantified recommendation is not always made. When a threshold value is proposed, it is generally 10% of TEI and concerns free sugars (added sugars and fruit juice). This recommendation was originally issued by the WHO. In its most recent update, the WHO maintained this recommendation of 10% of TEI and proposed a further recommendation to limit free sugar intakes to less than 5% of TEI, which would have additional health benefits, especially regarding dental caries. This recommendation of 10% of TEI corresponds, on the basis of the TEIs used in the method implemented to update the PNNS guidelines (ANSES, 2016), i.e. 2100 kcal in women and 2600 kcal in men, to daily added sugar intakes of 52.5 g in adult women and 65 g in adult men. Similarly, the recommendation of 5% of TEI corresponds to daily added sugar intakes of 26.2 g in women and 32.5 g in men.

Page 2 / 22
ANSES Opinion
Request No 2012-SA-0186
This expert appraisal is intended to update this recommendation in light of the latest literature data on the health effects of various types of sugars, while taking into account developments concerning the scientific approach with which the sugars are studied (terminology, definitions, classification).
2. ORGANISATION OF THE EXPERT APPRAISAL The expert appraisal was carried out in accordance with French Standard NF X 50-110 “Quality in Expert Appraisals – General Requirements of Competence for Expert Appraisals (2003)”. ANSES entrusted the expert appraisal to the Working Group on "Balance between macronutrients" reporting to the Expert Committee (CES) on "Human Nutrition". ANSES has analysed the links of interest declared by the experts prior to their appointment and throughout the work, in order to avoid potential conflicts of interest with regard to the matters dealt with as part of the expert appraisal. The experts’ declarations of interests are made public via the ANSES website (www.anses.fr). In order to ensure the scientific validity of the expert appraisal while respecting ethical rules, ANSES separated this WG into three expert groups mandated to work respectively on the following themes:
- Distribution of macronutrients in total energy intake (TEI); - Recommendations on carbohydrate intakes; - Recommendations on fibre intakes.
The work of the expert group on "Recommendations on carbohydrate intakes" focused on updating the qualitative and quantitative recommendations on carbohydrate intakes, including sugars. The methodological and scientific aspects of the work were submitted to the CES on several occasions.
This Opinion summarises the collective expert appraisal relating to the recommendations on sugar intake. This summary was submitted to the CES on "Human Nutrition" for final discussion on 25 June 2015.
This work falls within the framework of ANSES's broader examination of the balance of macronutrient intakes, work that needs to take place prior to the revision of food recommendations. The recommendations from this expert appraisal were endorsed and taken into account by the CES as part of the updating of the food guidelines of the National Health and Nutrition Programme (PNNS 3), regarding which ANSES received a formal request from the Directorate General of Health on 3 April 2012.
2.1. WG's working method The WG based its analysis on the results of a detailed literature search conducted in April 2013, focusing on studies and meta-analyses published after 2006 – the date of the last WHO expert appraisal on carbohydrates (Nishida and Martinez Nocito, 2007). Because several topics had not been specifically addressed by the WHO (in particular non-alcoholic fatty liver disease, uric acid concentrations), some studies published prior to 2006 were therefore taken into account. Studies published during the expert appraisal were included in this analysis, and an update of the literature published between April 2013 and April 2015 was carried out in May 2015. This review encompassed the main sugars found in food in France (distinguished according to their biochemical form and form of intake: natural or added, liquid or solid) as well as the different types of health effects (risk of the development of diseases, modification of eating behaviour). The list of key words used in this search is shown in Annex 1. This data review led the WG to propose a maximum sugar intake value.
Page 3 / 22
ANSES Opinion
Request No 2012-SA-0186
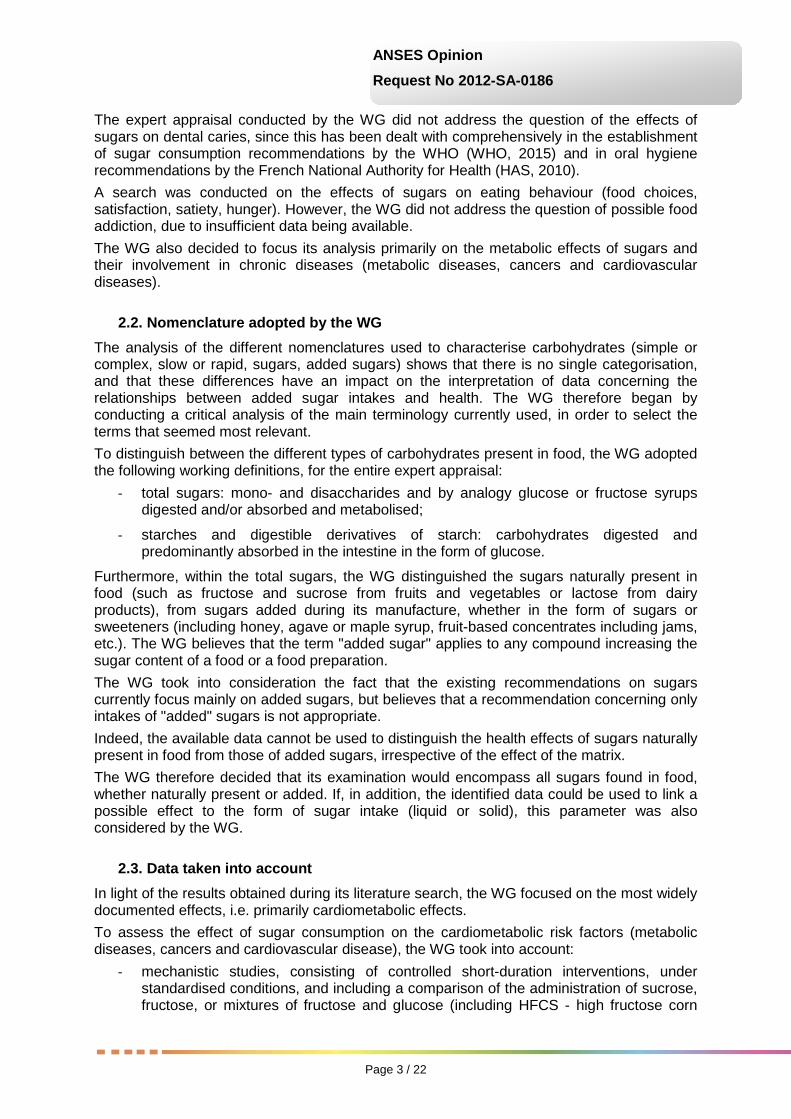
The expert appraisal conducted by the WG did not address the question of the effects of sugars on dental caries, since this has been dealt with comprehensively in the establishment of sugar consumption recommendations by the WHO (WHO, 2015) and in oral hygiene recommendations by the French National Authority for Health (HAS, 2010). A search was conducted on the effects of sugars on eating behaviour (food choices, satisfaction, satiety, hunger). However, the WG did not address the question of possible food addiction, due to insufficient data being available. The WG also decided to focus its analysis primarily on the metabolic effects of sugars and their involvement in chronic diseases (metabolic diseases, cancers and cardiovascular diseases).
2.2. Nomenclature adopted by the WG The analysis of the different nomenclatures used to characterise carbohydrates (simple or complex, slow or rapid, sugars, added sugars) shows that there is no single categorisation, and that these differences have an impact on the interpretation of data concerning the relationships between added sugar intakes and health. The WG therefore began by conducting a critical analysis of the main terminology currently used, in order to select the terms that seemed most relevant. To distinguish between the different types of carbohydrates present in food, the WG adopted the following working definitions, for the entire expert appraisal:
- total sugars: mono- and disaccharides and by analogy glucose or fructose syrups digested and/or absorbed and metabolised;
- starches and digestible derivatives of starch: carbohydrates digested and predominantly absorbed in the intestine in the form of glucose.
Furthermore, within the total sugars, the WG distinguished the sugars naturally present in food (such as fructose and sucrose from fruits and vegetables or lactose from dairy products), from sugars added during its manufacture, whether in the form of sugars or sweeteners (including honey, agave or maple syrup, fruit-based concentrates including jams, etc.). The WG believes that the term "added sugar" applies to any compound increasing the sugar content of a food or a food preparation. The WG took into consideration the fact that the existing recommendations on sugars currently focus mainly on added sugars, but believes that a recommendation concerning only intakes of "added" sugars is not appropriate. Indeed, the available data cannot be used to distinguish the health effects of sugars naturally present in food from those of added sugars, irrespective of the effect of the matrix. The WG therefore decided that its examination would encompass all sugars found in food, whether naturally present or added. If, in addition, the identified data could be used to link a possible effect to the form of sugar intake (liquid or solid), this parameter was also considered by the WG.
2.3. Data taken into account In light of the results obtained during its literature search, the WG focused on the most widely documented effects, i.e. primarily cardiometabolic effects. To assess the effect of sugar consumption on the cardiometabolic risk factors (metabolic diseases, cancers and cardiovascular disease), the WG took into account:
- mechanistic studies, consisting of controlled short-duration interventions, under standardised conditions, and including a comparison of the administration of sucrose, fructose, or mixtures of fructose and glucose (including HFCS - high fructose corn

Page 4 / 22
ANSES Opinion
Request No 2012-SA-0186
syrups1), or sugar-sweetened beverages, with a control diet (low-sugar diet, isocaloric quantity of glucose alone, etc.);
- longitudinal epidemiological studies, in which the consumption of sugars, fructose, glucose, sucrose, or sugar-sweetened beverages was compared to the development of cardiometabolic risk factors or the occurrence of cardiovascular or metabolic diseases;
- clinical trials including an intervention focusing on dietary intake of sugar or sugar-sweetened beverages and for which the clinical assessment criteria included weight, body composition, or risk markers of cardiovascular diseases or markers of metabolic deregulation;
- meta-analyses of these different types of studies.
Cross-sectional epidemiological studies and "ecological" epidemiological data that use aggregate data and not individual data concerning sugar intakes were not taken into account, given the level of uncertainty in their findings.
3. ANALYSIS AND CONCLUSIONS OF THE CES AND THE WG The studies identified by the literature search were grouped according to the parameters assessed:
- weight gain, distinguishing between the effects on energy expenditure and the effects on energy intake;
- glucose homeostasis and insulin sensitivity; - blood lipids; - intrahepatic lipids and the risk of non-alcoholic liver disease; - plasma uric acid concentrations; - blood pressure.
1 glucose-fructose syrups

Page 5 / 22
ANSES Opinion
Request No 2012-SA-0186
3.1. Effects of sugars on energy expenditure, energy intake and weight gain Mechanistic studies
In the short term, it has been clearly established that the dietary thermogenesis induced by fructose is higher than that of glucose (Table 1).
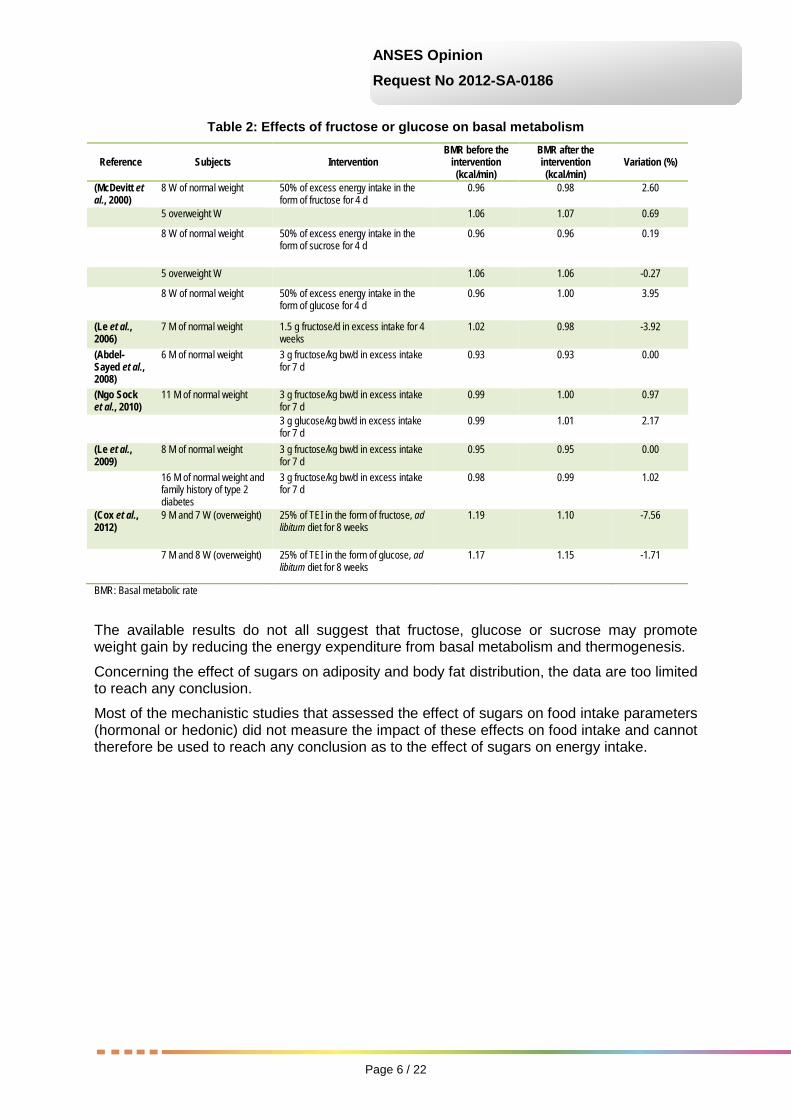
In addition, most of the studies, lasting from four to twenty-eight days, did not show any change in basal metabolism (Table 2). The medium- and long-term effects on basal metabolism of a diet high in fructose or glucose have been less frequently studied.
Table 1: Effects of fructose and glucose on thermogenesis
Reference Subjects Test meal Fructose
thermogenesis (% E)
Glucose thermogenesis
(% E)
Gluc th/Fruc th
(%)
p of linear trend
(Sharief and Macdonald, 1982)
6 M of normal weight 5 g sucrose or glucose/kg bw
4.0 2.6 154 NS
(Tappy et al., 1986)
6 M and 4 W of normal weight 75 g pure fructose or glucose
10.2 6.5 157 < 0.05
(Simonson et al., 1988)
5 M and 4 W of normal weight 75 g pure fructose or glucose
9.4 6.0 157 NS
5 M and 4 W of normal weight (elderly)
10.3 3.4 303 < 0.05
2 M and 7 W (obese) 8.6 2.6 331 < 0.05
(Schwarz et al., 1989)
10 M and 10 W of normal weight 75 g fructose or glucose in a test meal
12.4 10.7 116 < 0.01
(Schwarz et al., 1992)
23 W of normal weight 75 g fructose or glucose in a test meal
10.2 8.4 121 < 0.01
(Martines et al., 1994)
6 M of normal weight 1 g fructose or glucose/kg bw
11.2 10.7 105 NS
(Fukagawa et al., 1995)
6 W and 2 M of normal weight 75 g pure fructose or glucose
9.4 8.1 116 NS
4 M and 4 W of normal weight 7.7 6.5 118 NS
(Blaak and Saris, 1996)
10 M of normal weight 75 g pure fructose or glucose
11.1 8.0 139 < 0.017
10 M of normal weight 75 g pure fructose or glucose
11.4 8.0 143 < 0.017
(Van Gaal et al., 1999)
13 W (obese) 100 g pure fructose or glucose
6.8 4.5 152 < 0.006
Mean 9.4 6.6 162
Interval (4-12.4) (2.6-10.7) (105-157)
M: Men W: Women NS: Not significant E: Energy expenditure
Page 6 / 22
ANSES Opinion
Request No 2012-SA-0186
Table 2: Effects of fructose or glucose on basal metabolism
Reference Subjects Intervention BMR before the
intervention (kcal/min)
BMR after the intervention (kcal/min)
Variation (%)
(McDevitt et al., 2000)
8 W of normal weight 50% of excess energy intake in the form of fructose for 4 d
0.96 0.98 2.60
5 overweight W 1.06 1.07 0.69
8 W of normal weight 50% of excess energy intake in the form of sucrose for 4 d
0.96 0.96 0.19
5 overweight W 1.06 1.06 -0.27
8 W of normal weight 50% of excess energy intake in the form of glucose for 4 d
0.96 1.00 3.95
(Le et al., 2006)
7 M of normal weight 1.5 g fructose/d in excess intake for 4 weeks
1.02 0.98 -3.92
(Abdel-Sayed et al., 2008)
6 M of normal weight 3 g fructose/kg bw/d in excess intake for 7 d
0.93 0.93 0.00
(Ngo Sock et al., 2010)
11 M of normal weight 3 g fructose/kg bw/d in excess intake for 7 d
0.99 1.00 0.97
3 g glucose/kg bw/d in excess intake for 7 d
0.99 1.01 2.17
(Le et al., 2009)
8 M of normal weight 3 g fructose/kg bw/d in excess intake for 7 d
0.95 0.95 0.00
16 M of normal weight and family history of type 2 diabetes
3 g fructose/kg bw/d in excess intake for 7 d
0.98 0.99 1.02
(Cox et al., 2012)
9 M and 7 W (overweight) 25% of TEI in the form of fructose, ad libitum diet for 8 weeks
1.19 1.10 -7.56
7 M and 8 W (overweight) 25% of TEI in the form of glucose, ad libitum diet for 8 weeks
1.17 1.15 -1.71
BMR: Basal metabolic rate
The available results do not all suggest that fructose, glucose or sucrose may promote weight gain by reducing the energy expenditure from basal metabolism and thermogenesis.
Concerning the effect of sugars on adiposity and body fat distribution, the data are too limited to reach any conclusion.
Most of the mechanistic studies that assessed the effect of sugars on food intake parameters (hormonal or hedonic) did not measure the impact of these effects on food intake and cannot therefore be used to reach any conclusion as to the effect of sugars on energy intake.
Page 7 / 22
ANSES Opinion
Request No 2012-SA-0186
Intervention studies
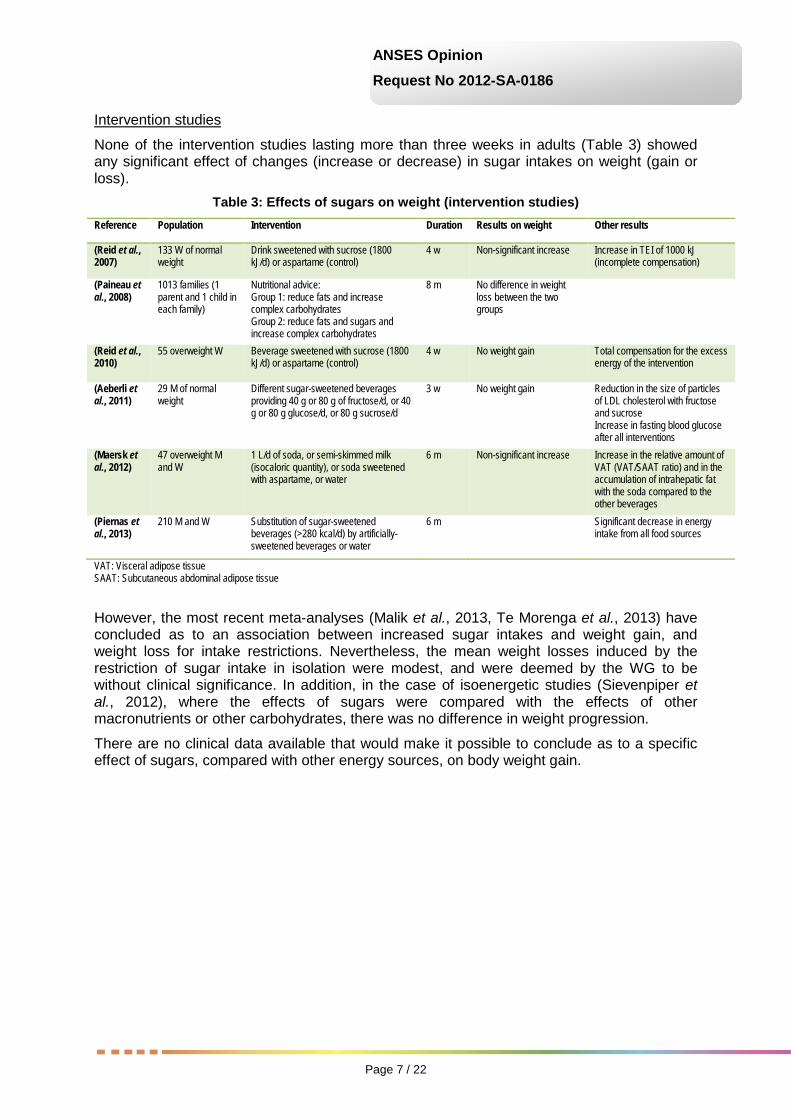
None of the intervention studies lasting more than three weeks in adults (Table 3) showed any significant effect of changes (increase or decrease) in sugar intakes on weight (gain or loss).
Table 3: Effects of sugars on weight (intervention studies) Reference Population Intervention Duration Results on weight Other results
(Reid et al., 2007)
133 W of normal weight
Drink sweetened with sucrose (1800 kJ/d) or aspartame (control)
4 w Non-significant increase Increase in TEI of 1000 kJ (incomplete compensation)
(Paineau et al., 2008)
1013 families (1 parent and 1 child in each family)
Nutritional advice: Group 1: reduce fats and increase complex carbohydrates Group 2: reduce fats and sugars and increase complex carbohydrates
8 m No difference in weight loss between the two groups
(Reid et al., 2010)
55 overweight W Beverage sweetened with sucrose (1800 kJ/d) or aspartame (control)
4 w No weight gain Total compensation for the excess energy of the intervention
(Aeberli et al., 2011)
29 M of normal weight
Different sugar-sweetened beverages providing 40 g or 80 g of fructose/d, or 40 g or 80 g glucose/d, or 80 g sucrose/d
3 w No weight gain Reduction in the size of particles of LDL cholesterol with fructose and sucrose Increase in fasting blood glucose after all interventions
(Maersk et al., 2012)
47 overweight M and W
1 L/d of soda, or semi-skimmed milk (isocaloric quantity), or soda sweetened with aspartame, or water
6 m Non-significant increase Increase in the relative amount of VAT (VAT/SAAT ratio) and in the accumulation of intrahepatic fat with the soda compared to the other beverages
(Piernas et al., 2013)
210 M and W Substitution of sugar-sweetened beverages (>280 kcal/d) by artificially-sweetened beverages or water
6 m Significant decrease in energy intake from all food sources
VAT: Visceral adipose tissue SAAT: Subcutaneous abdominal adipose tissue
However, the most recent meta-analyses (Malik et al., 2013, Te Morenga et al., 2013) have concluded as to an association between increased sugar intakes and weight gain, and weight loss for intake restrictions. Nevertheless, the mean weight losses induced by the restriction of sugar intake in isolation were modest, and were deemed by the WG to be without clinical significance. In addition, in the case of isoenergetic studies (Sievenpiper et al., 2012), where the effects of sugars were compared with the effects of other macronutrients or other carbohydrates, there was no difference in weight progression.
There are no clinical data available that would make it possible to conclude as to a specific effect of sugars, compared with other energy sources, on body weight gain.
Page 8 / 22
ANSES Opinion
Request No 2012-SA-0186
Epidemiological studies
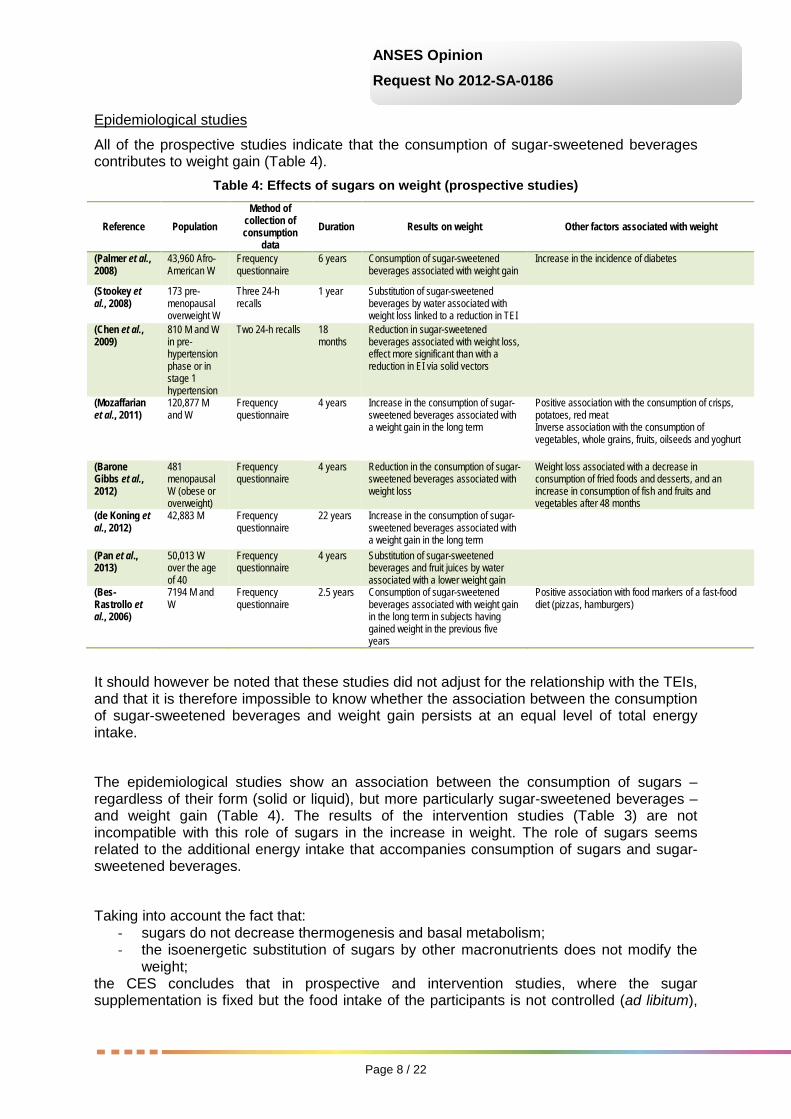
All of the prospective studies indicate that the consumption of sugar-sweetened beverages contributes to weight gain (Table 4).
Table 4: Effects of sugars on weight (prospective studies)
Reference Population Method of
collection of consumption
data Duration Results on weight Other factors associated with weight
(Palmer et al., 2008)
43,960 Afro-American W
Frequency questionnaire
6 years Consumption of sugar-sweetened beverages associated with weight gain
Increase in the incidence of diabetes
(Stookey et al., 2008)
173 pre-menopausal overweight W
Three 24-h recalls
1 year Substitution of sugar-sweetened beverages by water associated with weight loss linked to a reduction in TEI
(Chen et al., 2009)
810 M and W in pre-hypertension phase or in stage 1 hypertension
Two 24-h recalls 18 months
Reduction in sugar-sweetened beverages associated with weight loss, effect more significant than with a reduction in EI via solid vectors
(Mozaffarian et al., 2011)
120,877 M and W
Frequency questionnaire
4 years Increase in the consumption of sugar-sweetened beverages associated with a weight gain in the long term
Positive association with the consumption of crisps, potatoes, red meat Inverse association with the consumption of vegetables, whole grains, fruits, oilseeds and yoghurt
(Barone Gibbs et al., 2012)
481 menopausal W (obese or overweight)
Frequency questionnaire
4 years Reduction in the consumption of sugar-sweetened beverages associated with weight loss
Weight loss associated with a decrease in consumption of fried foods and desserts, and an increase in consumption of fish and fruits and vegetables after 48 months
(de Koning et al., 2012)
42,883 M Frequency questionnaire
22 years Increase in the consumption of sugar-sweetened beverages associated with a weight gain in the long term
(Pan et al., 2013)
50,013 W over the age of 40
Frequency questionnaire
4 years Substitution of sugar-sweetened beverages and fruit juices by water associated with a lower weight gain
(Bes-Rastrollo et al., 2006)
7194 M and W
Frequency questionnaire
2.5 years Consumption of sugar-sweetened beverages associated with weight gain in the long term in subjects having gained weight in the previous five years
Positive association with food markers of a fast-food diet (pizzas, hamburgers)
It should however be noted that these studies did not adjust for the relationship with the TEIs, and that it is therefore impossible to know whether the association between the consumption of sugar-sweetened beverages and weight gain persists at an equal level of total energy intake.
The epidemiological studies show an association between the consumption of sugars – regardless of their form (solid or liquid), but more particularly sugar-sweetened beverages – and weight gain (Table 4). The results of the intervention studies (Table 3) are not incompatible with this role of sugars in the increase in weight. The role of sugars seems related to the additional energy intake that accompanies consumption of sugars and sugar-sweetened beverages.
Taking into account the fact that: - sugars do not decrease thermogenesis and basal metabolism; - the isoenergetic substitution of sugars by other macronutrients does not modify the
weight; the CES concludes that in prospective and intervention studies, where the sugar supplementation is fixed but the food intake of the participants is not controlled (ad libitum),

Page 9 / 22
ANSES Opinion
Request No 2012-SA-0186
the observed weight changes may be secondary to an excess energy consumption associated with the sugars.
3.2. Effects of sugars on glucose homeostasis and insulin sensitivity In short- and medium-term studies in which no major change in weight and/or body composition was observed (Table 5), the data do not show a decrease in insulin sensitivity or the onset of glucose intolerance related to sugar consumption.
Table 5: Effects of sugars on insulin resistance (randomised controlled trials)
Reference Subjects Duration Intervention Control Measurement Main result
(Le et al., 2006)
7 M of normal weight
28 d fructose 1.5 g/kg/day
low-fructose weight maintenance diet
euglycemic hyperinsulinemic clamp with two levels of insulin
No hepatic or muscular resistance to insulin
(Le et al., 2009)
24 healthy subjects and 16 with family history of T2D
7 d fructose 3.5 g/kg lean body mass/d
low-fructose weight maintenance diet
hyperinsulinemic clamp with two levels of insulin
Hepatic resistance to insulin. No muscular resistance to insulin
(Faeh et al., 2005)
7 M of normal weight
7 d fructose 3 g/kg/d
low-fructose weight maintenance diet
hyperinsulinemic clamp with three levels of insulin
Hepatic resistance to insulin and adipose tissue. No muscular resistance
(Aeberli et al., 2013)
8 M of normal weight
fructose 80 g/d
glucose 80 g/d hyperinsulinemic clamp with two levels of insulin
Hepatic resistance to insulin. No muscular resistance to insulin
(Couchepin et al., 2008)
8 M and 8 W of normal weight
7 d fructose 3.5 g/kg lean body mass/d
low-fructose weight maintenance diet
hyperglycemic clamp Hepatic resistance to insulin in M, but not in W; no muscular resistance
(Hokayem et al., 2013)
18 M and 20 W with metabolic syndrome and family history of T2D
7 d fructose 3 g/kg/d
low-fructose weight maintenance diet
hyperinsulinemic clamp with two levels of insulin (without glucose production measurement)
Muscular resistance to insulin, corrected by polyphenols; hepatic sensitivity not measured
(Thorburn et al., 1990)
2 M and 4 W with T2D
3 m fructose 13% TEI
sucrose 13% TEI hyperinsulinemic clamp No insulin resistance
(Black et al., 2006)
13 M of normal weight
6 w sucrose 25% TEI (isocaloric diet)
sucrose 10% TEI hyperinsulinemic clamp with two levels of insulin (with no measurement of glucose production)
No insulin resistance
(Lewis et al., 2013)
9 M and 4 W (overweight)
6 w fructose 15% TEI (isocaloric diet)
sucrose 5% TEI hyperinsulinemic clamp with two levels of insulin (with no measurement of glucose production)
No insulin resistance
T2D: Type 2 diabetes
The data indicate that only a very large increase in fructose intake, of around 80 g/d, leads to a decrease in hepatic sensitivity to insulin. This effect, however, is modest and is not accompanied by a clinically significant increase in fasting blood glucose.
Lastly, a limited number of epidemiological cohort studies (Fagherazzi et al., 2013, Greenwood et al., 2014) indicate an increase in the incidence of diabetes in high consumers of sugar or sugar-sweetened beverages. However, the relationship may be partly related to the weight status, as the association disappears after adjustment for the BMI. The effects of sugars in the very long term on glucose homeostasis and insulin sensitivity remain unknown.
3.3. Effects of sugars on blood lipids Due to the fact that its metabolism differs from that of other sugars, fructose causes specific effects, in particular on blood lipids.
Page 10 / 22
ANSES Opinion
Request No 2012-SA-0186
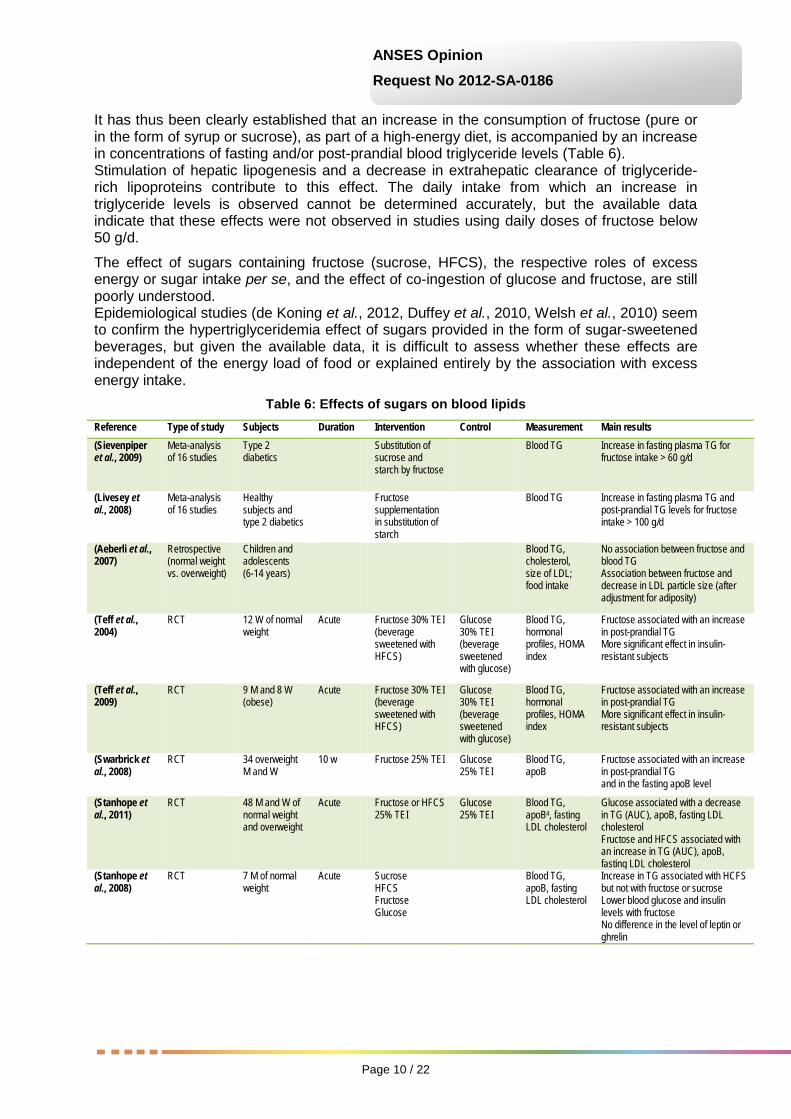
It has thus been clearly established that an increase in the consumption of fructose (pure or in the form of syrup or sucrose), as part of a high-energy diet, is accompanied by an increase in concentrations of fasting and/or post-prandial blood triglyceride levels (Table 6). Stimulation of hepatic lipogenesis and a decrease in extrahepatic clearance of triglyceride-rich lipoproteins contribute to this effect. The daily intake from which an increase in triglyceride levels is observed cannot be determined accurately, but the available data indicate that these effects were not observed in studies using daily doses of fructose below 50 g/d.
The effect of sugars containing fructose (sucrose, HFCS), the respective roles of excess energy or sugar intake per se, and the effect of co-ingestion of glucose and fructose, are still poorly understood. Epidemiological studies (de Koning et al., 2012, Duffey et al., 2010, Welsh et al., 2010) seem to confirm the hypertriglyceridemia effect of sugars provided in the form of sugar-sweetened beverages, but given the available data, it is difficult to assess whether these effects are independent of the energy load of food or explained entirely by the association with excess energy intake.
Table 6: Effects of sugars on blood lipids Reference Type of study Subjects Duration Intervention Control Measurement Main results (Sievenpiper et al., 2009)
Meta-analysis of 16 studies
Type 2 diabetics
Substitution of sucrose and starch by fructose
Blood TG Increase in fasting plasma TG for fructose intake > 60 g/d
(Livesey et al., 2008)
Meta-analysis of 16 studies
Healthy subjects and type 2 diabetics
Fructose supplementation in substitution of starch
Blood TG Increase in fasting plasma TG and post-prandial TG levels for fructose intake > 100 g/d
(Aeberli et al., 2007)
Retrospective (normal weight vs. overweight)
Children and adolescents (6-14 years)
Blood TG, cholesterol, size of LDL; food intake
No association between fructose and blood TG Association between fructose and decrease in LDL particle size (after adjustment for adiposity)
(Teff et al., 2004)
RCT 12 W of normal weight
Acute Fructose 30% TEI (beverage sweetened with HFCS)
Glucose 30% TEI (beverage sweetened with glucose)
Blood TG, hormonal profiles, HOMA index
Fructose associated with an increase in post-prandial TG More significant effect in insulin-resistant subjects
(Teff et al., 2009)
RCT 9 M and 8 W (obese)
Acute Fructose 30% TEI (beverage sweetened with HFCS)
Glucose 30% TEI (beverage sweetened with glucose)
Blood TG, hormonal profiles, HOMA index
Fructose associated with an increase in post-prandial TG More significant effect in insulin-resistant subjects
(Swarbrick et al., 2008)
RCT 34 overweight M and W
10 w Fructose 25% TEI Glucose 25% TEI
Blood TG, apoB
Fructose associated with an increase in post-prandial TG and in the fasting apoB level
(Stanhope et al., 2011)
RCT 48 M and W of normal weight and overweight
Acute Fructose or HFCS 25% TEI
Glucose 25% TEI
Blood TG, apoB4, fasting LDL cholesterol
Glucose associated with a decrease in TG (AUC), apoB, fasting LDL cholesterol Fructose and HFCS associated with an increase in TG (AUC), apoB, fasting LDL cholesterol
(Stanhope et al., 2008)
RCT 7 M of normal weight
Acute Sucrose HFCS Fructose Glucose
Blood TG, apoB, fasting LDL cholesterol
Increase in TG associated with HCFS but not with fructose or sucrose Lower blood glucose and insulin levels with fructose No difference in the level of leptin or ghrelin

Page 11 / 22
ANSES Opinion
Request No 2012-SA-0186
(Maersk et al., 2012)
RCT 47 overweight M and W
6 m 1L/d of sweetened soda
1L/d of artificially-sweetened soda, or skimmed milk, or water
TG, cholesterol Sweetened soda associated with an increase in TG and total cholesterol No difference for HDL cholesterol, blood glucose, insulin levels and the HOMA index
(Stanhope et al., 2009)
RCT 32 overweight M and W
10 w Fructose 25% TEI Glucose 25% TEI
TG, cholesterol, lipoprotein lipase (LPL) activity
Fructose associated with an increase in total TG, total cholesterol, HDL cholesterol, small and dense LDL, oxidised LDL, and a decrease in LPL activity No difference in fasting TG
(Silbernagel et al., 2011)
RCT 20 M and W of normal weight
4 w Fructose 150 g added to an ad libitum diet
Glucose 150 g added to an ad libitum diet
TG, cholesterol Fructose associated with an increase in fasting TG No difference for cholesterol, blood insulin and glucose levels
(Sobrecases et al., 2010)
RCT 30 M of normal weight
4-7 d Fructose 3.5 g/kg of lean body mass/d
Saturated fatty acids (SFA) 30% TEI
Fasting TG Fructose associated with an increase in fasting TG SFA associated with a decrease in TG compared to the pre-intervention status
(Raben et al., 2011)
RCT 23 overweight M and W
10 w Sucrose, 2 g/kg/d in foods and beverages
Artificially-sweetened beverages
Fasting and post-prandial TG
Sucrose associated with an increase in fasting and post-prandial TG and body weight
(Faeh et al., 2005)
RCT 7 M of normal weight
6 d Fructose 3 g/kg/d Pre-intervention
Fasting TG Fructose associated with an increase in fasting TG
(Le et al., 2006)
RCT 7 M of normal weight
6 d and 28 d
Fructose 1.5 g/kg/d
Pre-intervention
Fasting TG Fructose associated with an increase in fasting TG No difference between days 6 and 28
(Le et al., 2009)
RCT 8 M of normal weight 8 children of normal weight with family history of T2D
6 d Fructose 3.5 g/kg/d
Pre-intervention
Fasting TG Fructose associated with an increase in fasting TG
(Theytaz et al., 2012)
RCT 9 M of normal weight
6 d Fructose 3 g/kg/d Pre-intervention
Fasting TG Fructose associated with an increase in fasting TG
(Ngo Sock et al., 2010)
RCT 11 M of normal weight
6 d Fructose 3.5 g/kg lean body mass/d
Glucose 3.5 g/kg lean body mass/d
TG, cholesterol Similar increase in VLDL with glucose and fructose No effect on HDL cholesterol Increase in TG with fructose but not with glucose
(Couchepin et al., 2008)
RCT 8 M of normal weight 8 pre-menopausal W of normal weight
6 d Fructose 3.5 g/kg/d
Pre-intervention
Fasting TG Increase in fasting TG No difference between men and women
(Egli et al., 2013)
RCT 8 M and W of normal weight
6 d Fructose 30% TEI + physical activity (PA) Fructose 30% TEI without PA
Low-fructose diet and without PA
Fasting and post-prandial TG
Fructose associated with an increase in TG Preventive effect of PA on fructose-induced dyslipidaemia
RCT: Randomised controlled trial TG: Triglycerides AUC: Area under the curve
HFCS: High fructose corn syrup ApoB: Apolipoprotein B

Page 12 / 22
ANSES Opinion
Request No 2012-SA-0186
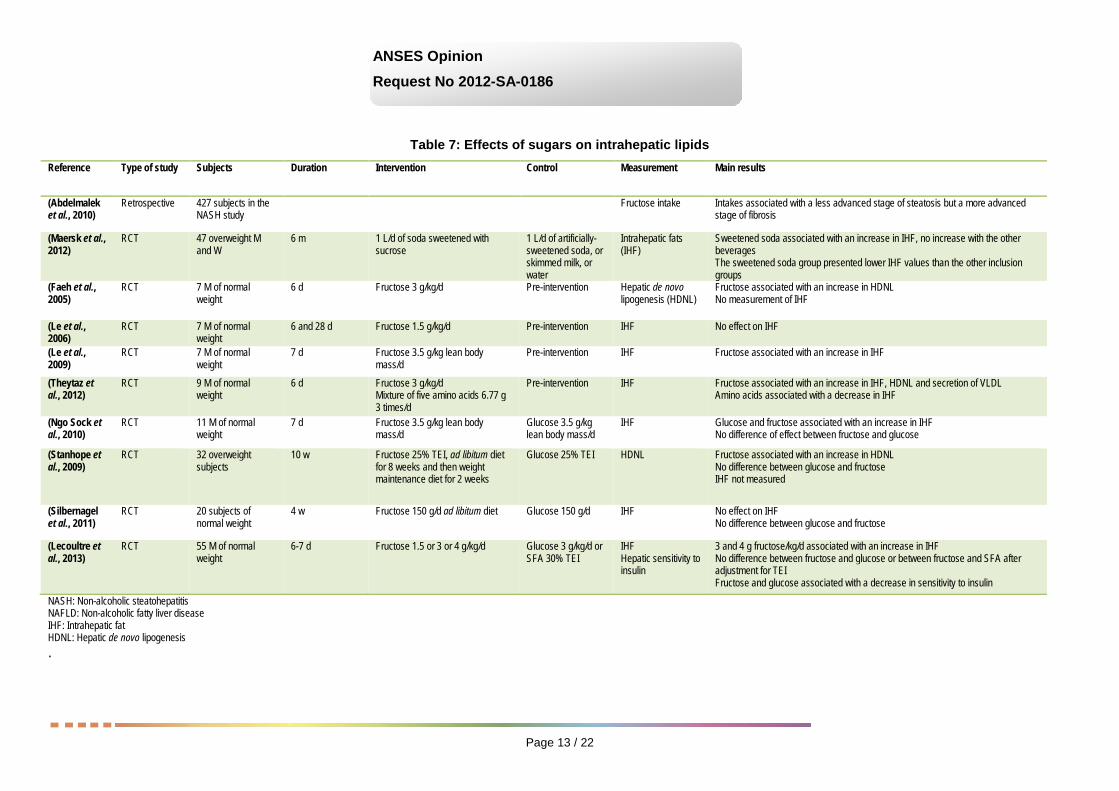
3.1. Effects of sugars on intrahepatic lipids and the risk of non-alcoholic liver disease A diet that is rich in fructose can induce an intrahepatic lipid overload (Table 7) but there are not currently enough data with which to conclude as to a direct relationship between sugar consumption and the occurrence of non-alcoholic liver disease. It should be noted however that experimental studies in animals show changes such as oxidative stress or the formation of aldehydes, which could lead to inflammation or promote the progression of a steatosis, regardless of the cause, to a steatohepatitis.
Page 13 / 22
ANSES Opinion
Request No 2012-SA-0186
Table 7: Effects of sugars on intrahepatic lipids
Reference Type of study Subjects Duration Intervention Control Measurement Main results
(Abdelmalek et al., 2010)
Retrospective 427 subjects in the NASH study
Fructose intake Intakes associated with a less advanced stage of steatosis but a more advanced stage of fibrosis
(Maersk et al., 2012)
RCT 47 overweight M and W
6 m 1 L/d of soda sweetened with sucrose
1 L/d of artificially-sweetened soda, or skimmed milk, or water
Intrahepatic fats (IHF)
Sweetened soda associated with an increase in IHF, no increase with the other beverages The sweetened soda group presented lower IHF values than the other inclusion groups
(Faeh et al., 2005)
RCT 7 M of normal weight
6 d Fructose 3 g/kg/d Pre-intervention Hepatic de novo lipogenesis (HDNL)
Fructose associated with an increase in HDNL No measurement of IHF
(Le et al., 2006)
RCT 7 M of normal weight
6 and 28 d Fructose 1.5 g/kg/d Pre-intervention IHF No effect on IHF
(Le et al., 2009)
RCT 7 M of normal weight
7 d Fructose 3.5 g/kg lean body mass/d
Pre-intervention IHF Fructose associated with an increase in IHF
(Theytaz et al., 2012)
RCT 9 M of normal weight
6 d Fructose 3 g/kg/d Mixture of five amino acids 6.77 g 3 times/d
Pre-intervention IHF Fructose associated with an increase in IHF, HDNL and secretion of VLDL Amino acids associated with a decrease in IHF
(Ngo Sock et al., 2010)
RCT 11 M of normal weight
7 d Fructose 3.5 g/kg lean body mass/d
Glucose 3.5 g/kg lean body mass/d
IHF Glucose and fructose associated with an increase in IHF No difference of effect between fructose and glucose
(Stanhope et al., 2009)
RCT 32 overweight subjects
10 w Fructose 25% TEI, ad libitum diet for 8 weeks and then weight maintenance diet for 2 weeks
Glucose 25% TEI HDNL Fructose associated with an increase in HDNL No difference between glucose and fructose IHF not measured
(Silbernagel et al., 2011)
RCT 20 subjects of normal weight
4 w Fructose 150 g/d ad libitum diet Glucose 150 g/d IHF No effect on IHF No difference between glucose and fructose
(Lecoultre et al., 2013)
RCT 55 M of normal weight
6-7 d Fructose 1.5 or 3 or 4 g/kg/d Glucose 3 g/kg/d or SFA 30% TEI
IHF Hepatic sensitivity to insulin
3 and 4 g fructose/kg/d associated with an increase in IHF No difference between fructose and glucose or between fructose and SFA after adjustment for TEI Fructose and glucose associated with a decrease in sensitivity to insulin
NASH: Non-alcoholic steatohepatitis NAFLD: Non-alcoholic fatty liver disease IHF: Intrahepatic fat HDNL: Hepatic de novo lipogenesis .

Page 14 / 22
ANSES Opinion
Request No 2012-SA-0186
3.2. Effects of sugars on uric acid levels In the short term, intervention studies indicate that the consumption of fructose, at high doses and associated with an excess energy intake, increases uric acid levels by a moderate degree (Table 8).
In the long term, the pathological consequences of this increase in the general population are unknown.
Table 8: Effects of sugars on uric acid levels Reference Type of study Subjects Duration Intervention Control Measurement Main results (Sun et al., 2010)
Retrospective 9384 subjects
Intakes of fructose and total sugars Concentrations of UA
No association between fructose and UA Inverse association between intakes of fibre and concentrations of UA
(Choi and Curhan, 2008)
Prospective 46,393 subjects
12 y Intakes of fructose, sugar-sweetened beverages Incidence of gout
Association between sugar-sweetened beverages and gout No association with artificially-sweetened beverages Association with foods rich in fructose (fruit juice, apples, oranges)
(Wang et al., 2012)
Meta-analysis 425 subjects > 7 d Fructose Glucose UA No effect of fructose in an isocaloric situation, increased levels of UA in a high-calorie situation No effect of substitution of fructose by glucose
(Silbernagel et al., 2011)
RCT 20 subjects of normal weight
4 w Fructose 150 g in addition to an ad libitum diet
Glucose 150 g in addition to an ad libitum diet
Fasting UA No effect on UA No difference between fructose and glucose
(Cox et al., 2012)
RCT 32 overweight subjects
10 w Fructose 25% of TEI and ad libitum diet for 8 weeks, and then weight maintenance diet for 2 weeks
Glucose and Fructose 25% of TEI and ad libitum diet for 8 weeks, and then weight maintenance diet for 2 weeks
UA level over 24 h UA increased more with fructose than with glucose
(Le et al., 2009)
RCT 7 M of normal weight
Acute Fructose 3.5 g/kg lean body mass/d
Pre-intervention Fasting UA Fructose associated with an increase in UA
(Ngo Sock et al., 2010)
RCT 11 M of normal weight
7 d Fructose 3.5 g/kg lean body mass/d
Glucose 3.5 g/kg lean body mass/d
Fasting UA Glucose and fructose associated with an increase in UA, no difference between the two sugars
(Madero et al., 2011)
RCT 131 overweight subjects
6 w Average fructose intakes (50-73 g/d) by supplementation in fruit and low-calorie diet
Low fructose intakes (<20g/d) and low-calorie diet
UA No difference between the two diets on levels of UA, weight loss greater with the average fructose diet
UA: uric acid
3.3. Effects of sugars on blood pressure The available data, limited in number and generally obtained for durations shorter than 2 weeks (Forman et al., 2009, Grasser et al., 2014, Ha et al., 2012, Le et al., 2006, Perez-Pozo et al., 2010, Stanhope et al., 2009), do not show any relationship between sugar consumption and blood pressure. Studies over the long term are needed to confirm or rule out this lack of relationship.

Page 15 / 22
ANSES Opinion
Request No 2012-SA-0186
3.4. Conclusions Concerning weight gain, intervention studies as well as epidemiological data do not show any association with sugar consumption when the energy intake of subjects is controlled for. In addition, controlled intervention studies indicate that sugars do not decrease thermogenesis and basal metabolism, and that the isoenergetic substitution of sugars by other macronutrients does not modify weight. Thus, in prospective and intervention studies, where the sugar supplementation is fixed but the food intake of the participants is not controlled, the observed weight changes may be secondary to an excess energy consumption associated with the sugars. The weight gain is related to an excess energy intake. Sugars and particularly sugar-sweetened beverages contribute to this excess energy intake.
Concerning the effect of sugars on adiposity and the distribution of body fat, the data are too limited to reach any conclusion.
Concerning glucose homeostasis and insulin sensitivity, the studies indicate that only a very large increase in fructose intake, of around 80 g/d, leads to a decrease in hepatic sensitivity to insulin. This effect, however, is modest and is not accompanied by a clinically significant increase in fasting blood glucose. A limited number of epidemiological cohort studies indicate an increase in the incidence of diabetes in high consumers of sugar-sweetened beverages; however this is in part linked to the weight status.
Concerning blood lipids, epidemiological studies indicate a hypertriglyceridemia effect of sugars provided in the form of sugar-sweetened beverages, but these data do not show a specific effect, independent of total energy intake. The effect of sugars containing fructose (sucrose, HFCS), the respective roles of excess energy or sugar intake per se, and the effect of co-ingestion of glucose and fructose, are still poorly understood. But in the intervention studies, daily intakes of fructose above 50 g/d can lead to an increase in fasting and/or post-prandial blood triglycerides.
Concerning intrahepatic lipids, uric acid and blood pressure, in the short- and medium-term intervention studies, deleterious metabolic effects of sugars were observed, in the case of very high consumption and/or consumption associated with an excess energy intake. However, the long-term impact of these changes on the occurrence of pathologies remains unknown.
Concerning the risks to oral health, the CES reiterates that the relationship between the consumption of fermentable sugars and dental caries has now been demonstrated. The work carried out, in particular in the framework of the recommendations of the WHO (WHO, 2015) and the French National Authority for Health (HAS, 2010), shows an increase in the incidence of dental caries with a convincing level of evidence for free sugar intakes above 10% of TEI.
In total, the significant data on the specific effects of sugar consumption show an increase in triglyceride and uric acid levels related to intakes of total fructose (free fructose and that contained in sucrose). For the effects on triglyceride levels, the CES considers the level of evidence to be convincing for fructose intakes above 50 g/d. For uric acid levels, the level of evidence was deemed convincing for single very high fructose loads, above 100 g/d, but insufficient for food intakes in the long term; moreover, it cannot be said that this increase in uric acid levels has harmful consequences on health.
For the risk of non-alcoholic fatty liver disease, a small number of intervention studies show that an excess energy intake, in particular in the form of fructose, increases the concentration of intrahepatic lipids in healthy subjects. The epidemiological data are, however, insufficient to assess the role of sugars in the occurrence of this pathology.
It is commonly accepted that weight gain follows excess energy intake and it appears that sugars contribute to this excess intake. In these conditions the CES considers that sugars, and more particularly in liquid form (sodas, nectars, fruit juices produced from concentrates, fresh fruit juices, smoothies, etc.) contribute to weight gain, with a convincing level of evidence.

Page 16 / 22
ANSES Opinion
Request No 2012-SA-0186
For the other pathologies, the levels of evidence are insufficient. However, for those where weight gain and obesity are established risk factors, the contribution of sugars to excess energy intake must not be overlooked, in particular for type 2 diabetes, endometrial cancer and breast cancer.
3.5. Recommendations There are currently many recommendations on added or free sugars, including those of the WHO (10% of TEI). In light of the available data, the CES considers that a recommendation focusing only on intakes of "added" sugars is not justified. Indeed, the available data cannot be used to distinguish the health effects of sugars naturally present in food from those of added sugars.
The literature analysis conducted in the framework of this expert appraisal shows that there is a range of evidence converging towards the harmful effects of high sugar intakes which makes it necessary to issue recommendations limiting sugar intakes in the population. The data currently available cannot be used to precisely establish the threshold of total sugars from which these effects appear. The CES considered it necessary, however, to propose a maximum limit to this intake.
In order to establish this limit, the CES decided to transpose the most reliable literature data to all of the sugars. In general, these data have been obtained with fructose.
By assuming that the specific effects of sugars are related to their fructose content, the CES decided to set a maximum limit to the intake of sugars containing fructose (sucrose, glucose-fructose syrups, honey or other syrups and natural concentrates containing fructose, pure fructose). The CES chose to use the lowest intake identified in the literature above which a change in risk markers is observed. The minimum consumption for which a significant increase in blood concentrations of triglycerides was observed is 50 g of fructose per day. Concerning lactose and galactose, which are the other two sugars consumed by the general population, the available data are not sufficient to be able to establish a relationship with a risk. The maximum consumption limit for sugars proposed by the CES does not therefore relate to the sugars naturally present in milk and dairy products.
An intake of 50 g of fructose corresponds to an intake of 100 g of sucrose. The CES therefore proposes setting an upper limit of 100 g/day for total consumption of sugars, excluding lactose and galactose. This limit applies to the general healthy adult population, and to total sugars, whether they are naturally present in food or added during food manufacture or preparation. The CES stresses that this value represents an upper intake limit not to be exceeded, and not an intake recommendation.

Page 17 / 22
ANSES Opinion
Request No 2012-SA-0186
4. AGENCY CONCLUSIONS AND RECOMMENDATIONS
ANSES adopts the conclusions and recommendations of the Working Group and the CES on "Human Nutrition".
This work confirms that sugar consumption beyond a certain quantity presents health risks due to direct effects on weight gain and the increase in triglyceride and uric acid levels, as well as indirect effects on type 2 diabetes and certain cancers, diseases that are currently major public health issues. In addition, there is no specific benefit to sugar consumption once the carbohydrate needs have been covered. In this context, ANSES recommends limiting total sugar intakes of the population to below the maximum value of 100 g per day. It should be noted that this value has only been set here for adult subjects. Additional recommendations should be established specifically for the vulnerable population of children and adolescents.
In France, 20% of adults have total sugar intakes, excluding lactose and galactose, above 100 g/d: (INCA 2, CIQUAL data, see Annex 2). The mean intakes display wide inter-individual variations (75 g/d day with a standard deviation of 35.6 g/d), in particular according to sex and age. The threshold value of 100 g/d was observed to have been exceeded in a range extending from 12% in women over 55 years of age to 33% in men aged 18-34 years. These exceeded values are observed as early as 3 years of age, regardless of the age group considered, and are just as much cause for concern in younger people (20% of those aged 3-10 years old). It also seems a matter of concern that the amounts of sugar consumed by younger people are equal to, or even exceed, those of adults.
Compliance with this threshold value of 100 g/d requires effective measures aiming to reduce the consumption of added sugars.
In addition, ANSES reiterates that limiting added sugar intake to 10% of TEI2, widely disseminated in many countries, is based on a WHO recommendation relating to free sugars. The WHO’s definition of free sugars includes both added sugars and fruit juice. The Agency is unable to assess the share of the population concerned by the exceeding of this threshold value associated with the consumption of added sugars. In this context, the Agency stresses the need for access to data on added sugar in food, and the confidentiality of industrial recipes may not be used as grounds to refuse this access.
2 i.e. 50 g/d for a calorie intake of 2000 kcal

Page 18 / 22
ANSES Opinion
Request No 2012-SA-0186
ANSES therefore recommends that:
- consumers pay attention to their total sugar intakes, verifying the addition of sucrose in their culinary preparations and beverages, and choosing the least sweet products, by comparing levels of total sugars, for which labelling is now mandatory;
- manufacturers undertake efforts to reformulate the available products containing added sugars, without substituting them with intense sweeteners or ingredients containing sugars (such as musts, concentrated fruit juice, honey, etc.), and ensure that they control the content of added sugars in new products offered to consumers;
- healthcare professionals raise awareness among their patients as to the health effects of sugars and in particular sugar-sweetened beverages on weight gain and the associated pathologies;
- the public authorities:
- given the limited effectiveness of charters on voluntary decreases3, consider the establishment of regulatory measures targeting the main vectors of added sugars, in order to take action within a managed timetable, on the number of products concerned and the degree of reduction in the levels of added sugars;
- raise the awareness of the population about the health effects of sugars, from a very early age, through information campaigns; the emphasis should be on nutritional education provided in schools; children should learn to identify the products that are vectors of sugars and to limit them as part of a varied diet;
- limit the availability of sweetened products in automatic vending machines and in particular in all places of education and teaching (primary and secondary schools, higher education facilities, universities, etc.);
- take measures to limit the incentive to consume sweet products (visual, audio-visual or audio advertising, free distributions, etc.);
- make it mandatory to provide composition data on added sugars in manufactured products;
- conduct a debate on the ways of informing consumers about the amount of added sugars in food;
- the research community:
- undertake new studies to clarify the precise nature of the relationship between sugar consumption and the associated pathologies;
- explore new avenues in the field of cognitive psychology or neurophysiology in order to understand, through new approaches, the effects of sugars on food intake, eating behaviour generally, and health;
- conduct longitudinal studies on the development of sugar consumption from a very early age in order to identify the possible role of habituation to sweet tastes as a determinant of behaviour in adulthood.
ANSES emphasises that the maximum intake threshold established in the framework of this work concerns the healthy adult population. Other populations, in particular children, have characteristics (metabolic, behavioural, physiological, etc.) that justify the establishment of specific 3 Combris, P.; Enderli, G.; Gauvreau, J.; Ménard, C.; Soler, L.-G.; Spiteri, M.; Volatier, J.-L., 2014. Interventions publiques et démarches d'entreprises pour l'amélioration de la qualité nutritionnelle de l'offre alimentaire : apports et limites. Cahier de nutrition et de diététique. 49(1), 22-31.

Page 19 / 22
ANSES Opinion
Request No 2012-SA-0186
recommendations. This debate will be undertaken as a continuation of the work conducted by the Agency in the framework of the PNNS.
ANSES reiterates its previous conclusion, issued as part of its assessment of the nutritional risks and benefits of intense sweeteners (ISs): "This objective of reducing sugar intake should be achieved by reducing the overall sweetness of food, from a very early age. Therefore, regarding sweetened beverages (significant vectors of sugars and ISs), artificially-sweetened beverages and sugar-sweetened beverages should not be consumed as substitutes for water".
Dr Roger GENET
KEYWORDS Carbohydrates; sugars; fructose; glucose; sucrose; lactose; galactose; starch; blood glucose levels; insulin levels; diabetes; non-alcoholic fatty liver disease; uric acid levels; obesity; overweight.

Page 20 / 22
ANSES Opinion
Request No 2012-SA-0186
ANNEX 1: KEY WORDS OF THE WG'S DETAILED LITERATURE SEARCH
( TITLE ( "dietary glucose" OR "glucose intake" OR fructose OR sucrose OR lactose OR "glucose syrup" OR "high fructose corn syrup" OR hfcs ) AND TITLE-ABS-KEY ( trygliceridemia OR triacylglycerol OR dyslipidemia OR hdl OR ldl OR cholesterolemia OR insulin-resistance OR insulinemia OR "insulin sensitivity" OR "glucose intolerance" OR "blood glucose" OR "oral glucose test" OR "glycated hemoglobin" OR "fatty liver" OR nash OR "uric acid" OR hyperuricemia OR gout ) AND KEY ( human ) ) AND DOCTYPE ( ar OR re ) AND SUBJAREA ( mult OR agri OR bioc OR immu OR neur OR phar OR mult OR medi OR nurs OR vete OR heal ) AND PUBYEAR > 2012
( TITLE ( "dietary glucose" OR "glucose intake" OR fructose OR sucrose OR lactose OR "glucose syrup" OR "high fructose corn syrup" OR hfcs ) AND TITLE ( overweight OR obesity OR "body fat mass" OR bmi OR "weight gain" OR "type 2 diabetes" OR "diabetes mellitus" OR "metabolic syndrome" OR "cardiovascular disease" OR "heart disease" OR "coronary heart disease" OR stroke ) OR TITLE ( "Colorectal cancer" OR "breast cancer" OR "endometrium cancer" OR "ovary cancer" OR "prostate cancer" ) AND TITLE-ABS-KEY ( human ) ) AND SUBJAREA ( mult OR agri OR bioc OR immu OR neur OR phar OR mult OR medi OR nurs OR vete OR dent OR heal ) AND PUBYEAR > 2012
( TITLE ( "dietary glucose" OR "glucose intake" OR fructose OR sucrose OR lactose OR "glucose syrup" OR "high fructose corn syrup" OR hfcs ) AND TITLE-ABS-KEY ( "Food intake" OR palatability OR satiety OR satiation OR appetite OR hunger OR snacking ) OR TITLE-ABS-KEY ( "solid and liquid" OR "drinking and eating" OR "beverage and solid food" ) AND TITLE-ABS-KEY ( human ) ) AND SUBJAREA ( mult OR agri OR bioc OR immu OR neur OR phar OR mult OR medi OR nurs OR vete OR dent OR heal ) AND PUBYEAR > 2012

Page 21 / 22
ANSES Opinion
Request No 2012-SA-0186
Annex 2: Estimates of intakes of total sugars (excluding lactose) of the French population Method
The food consumption data used to estimate total sugar intakes (excluding lactose) came from the Second French Individual Survey on Food Consumption (INCA2) conducted in 2006-07 in three phases, on 4079 individuals aged from 3 to 79 years old (1455 children from 3-17 years old and 2624 adults from 18-79 years old).
Food composition data on lactose (and a fortiori on total sugars excluding lactose) have never been published by CIQUAL due to the large quantity of missing data for this constituent. Building the INCA2 table on the lactose composition of foods therefore relied on filling in missing data. Two scenarios based on two different strategies for filling in missing data were proposed for estimating total sugar intakes excluding lactose:
- Scenario 1 corresponding to low average lactose values and therefore leading to the highest total sugar levels (excluding lactose) in food (worst-case scenario);
- Scenario 2 corresponding to high average lactose values and therefore leading to the lowest total sugar levels (excluding lactose) in food (cautious scenario).
These composition data were then fitted to the consumption data on food consumed in the INCA2 study using the nomenclature developed specifically for this study to estimate the intakes of total sugars (excluding lactose) of the French population.
Results: average daily intakes Table 1. Average daily intakes (in g/d) of total sugars (excluding lactose) according to age and/or sex in adults for Scenario 1
Scenario 1
Men Women Total
Age group N P5 Ave SD P95 N P5 Ave SD P95 N P5 Ave SD P95
18-34 years 273 26.3 87.5 51.7 173.5 416 28.3 71.7 31.7 120.8 689 27.8 79.2* 41.7 141.7
35-54 years 455 28.7 78.5 37.5 151.4 682 27.0 70.2 28.3 123.3 1137 27.3 73.9* 32.5 142.1
55-79 years 359 26.7 75.0 39.2 139.5 439 23.5 68.2 27.9 124.8 798 24.3 71.8* 33.6 134.8
18-79 years 1087 27.4 79.9¦ 42.4 152.2 1537 27.0 70.1ns 29.2 123.3 2624 27.0 74.9*¦ 35.6 138.1
*p <0.05 (test on sex); ¦p<0.05 (test on age); ns: not significant ANSES processing - Source INCA2 (2006-2007)
Table 2. Average daily intakes (in g/d) of total sugars (excluding lactose) according to age and/or sex in adults for Scenario 2
Scenario 2
Men Women Total
Age group N P5 Ave SD P95 N P5 Ave SD P95 N P5 Ave SD P95
18-34 years 273 25.5 86.4 51.3 172.2 416 27.5 70.8 31.5 118.5 689 27.1 78.2* 41.3 140.5
35-54 years 455 27.5 77.2 37.3 149.9 682 26.7 69.3 28.2 122.0 1137 26.8 72.9* 32.4 140.6
55-79 years 359 25.8 73.6 39.0 138.2 439 22.6 67.3 27.7 123.7 798 23.5 70.7* 33.4 133.5
18-79 years 1087 26.5 78.7¦ 42.1 150.5 1537 26.3 69.2ns 29.0 121.9 2624 26.4 73.8*¦ 35.4 137.3
*p <0.05 (test on sex); ¦p<0.05 (test on age); ns: not significant ANSES processing - Source INCA2 (2006-2007)

Page 22 / 22
ANSES Opinion
Request No 2012-SA-0186
Table 3. Average daily intakes (in g/d) of total sugars (excluding lactose) according to age and/or sex in children for Scenario 1
Scenario 1
Boys Girls Total
Age group N P5 Ave SD P95 N P5 Ave SD P95 N P5 Ave SD P95
3-10 years 278 40.9 81.6 32.3 125.4 296 36.9 74.2 26.4 114.8 574 39.1 78.1* 29.7 122.5
11-14 years 211 46.3 89.4 26.6 142.0 245 24.1 75.4 27.6 126.8 456 35.2 82.4* 27.9 134.7
15-17 years 199 33.4 88.0 39.1 159.1 226 31.3 73.6 29.7 131.1 425 31.3 80.6* 34.9 145.7
3-17 years 688 39.0 84.8¦ 33.1 138.9 767 33.4 74.4ns 27.7 124.1 1455 36.5 79.7*ns 30.8 131.9
*p <0.05 (test on sex); ¦p<0.05 (test on age); ns: not significant ANSES processing - Source INCA2 (2006-2007)
Table 4. Average daily intakes (in g/d) of total sugars (excluding lactose) according to age and/or sex in children for Scenario 2
Scenario 2
Boys Girls Total
Age group N P5 Ave SD P95 N P5 Ave SD P95 N P5 Ave SD P95
3-10 years 278 40.4 80.9 32.0 124.8 296 36.4 73.5 26.1 113.2 574 39.0 77.4* 29.4 121.6
11-14 years 211 45.8 88.4 26.4 140.8 245 23.7 74.6 27.4 125.6 456 34.7 81.5* 27.7 132.9
15-17 years 199 32.0 87.0 38.8 158.5 226 30.7 72.8 29.4 130.3 425 30.7 79.7* 34.6 144.8
3-17 years 688 38.6 84.0¦ 32.8 136.9 767 32.9 73.6ns 27.5 122.1 1455 35.9 79.0*ns 30.5 130.2
*p <0.05 (test on sex); ¦p<0.05 (test on age); ns: not significant ANSES processing - Source INCA2 (2006-2007)
Results: prevalence of exceeded daily intake of 100 g of sugars
Prevalence (in %) of exceeded intakes of total sugars (excluding lactose) according to age and/or sex in adults for the two composition scenarios
Men Women Total
Age group Scenario 1 (CI 95%)
Scenario 2 (CI 95%)
Scenario 1 (CI 95%)
Scenario 2 (CI 95%)
Scenario 1 (CI 95%)
Scenario 2 (CI 95%)
18-34 years 33.3 (27.9-38.7) 33.0 (27.7-38.4) 13.6 (9.8-17.4) 13.5 (9.7-17.3) 23.0* (19.6-26.3) 22.8* (19.4-26.1)
35-54 years 23.1 (18.7-27.4) 22.7 (18.4-27.0) 15.8 (12.7-18.9) 14.5 (11.5-17.6) 19.1* (16.4-21.7) 18.2* (15.6-20.9)
55-79 years 21.8 (17.1-26.5) 20.3 (15.6-25.0) 12.3 (9.0-15.7) 12.3 (8.9-15.6) 17.4* (14.2-20.6) 16.6* (13.4-19.7)
18-79 years 25.7¦ (22.8-28.5) 24.6¦ (22.1-27.8) 14.1ns (12.2-16.1) 13.6ns (11.6-15.5) 19.7*ns (18.1-21.3) 19.1*¦ (17.5-20.7) *p <0.05 (test on sex); ¦p<0.05 (test on age); ns: not significant ANSES processing - Source INCA2 (2006-2007)
Prevalence of exceeded intakes of total sugars (excluding lactose) according to age and/or sex in children for the two composition scenarios
Boys Girls Total
Age group Scenario 1 (%) Scenario 2 (%) Scenario 1 (%) Scenario 2 (%) Scenario 1 (%) Scenario 2 (%)
3-10 years 22.2 (17.1-27.4) 21.1 (16.1-26.0) 15.8 (11.0-20.6) 15.0 (10.2-19.8) 19.2ns (15.7-22.7) 18.2ns (14.8-21.6)
11-14 years 34.9 (28.2-41.5) 34.4 (28.0-40.8) 19.0 (12.4-25.7) 17.8 (11.2-24.4) 26.9* (22.0-31.8) 26.1* (21.3-30.9)
15-17 years 36.9 (28.1-45.7) 36.3 (27.6-45.0) 13.6 (9.5-17.8) 12.7 (8.8-16.6) 24.9* (19.3-30.5) 24.1* (18.6-29.7)
3-17 years 28.3¦ (24.5-32.1) 27.4¦ (23.6-31.1) 16.2ns (13.0-19.3) 15.2ns (12.2-18.3) 22.4*¦ (19.9-24.9) 21.5*¦ (19.0-23.9) *p <0.05 (test on sex); ¦p<0.05 (test on age); ns: not significant ANSES processing - Source INCA2 (2006-2007)