opihi aquaculture, feeds - ctsa_feeds.pdfopihi aquaculture, feeds harry ako and nhan thai hua dept...
TRANSCRIPT

Opihi Aquaculture, Feeds
Harry Ako and Nhan Thai Hua
Dept of Molecular Biosciences and Bioengineering
Univ of Hawaii, Manoa

What is opihi?
• High intertidal zones
2
Cellana exarata (makaiauli)
C. talcosa (ko'ele)
C. sandwicensis (alinalina)
• Opihi or limpets are endemic to the Hawaiian Islands
• low intertidal on zones on wave-exposed shores
(Kay and Magruder 1977; Corpuz 1981; Bird 2006).
• low intertidal, sub-tidal rocky
• The target species was the giant opihi C. talcosa • Due to the lack of water skills to dive to collect the giant opihi in deep
water, we decided to switch to the yellow foot opihi C. sandwicensis.

Why opihi is an important potential species for aquaculture?
3
• Opihi is a cultural icon in Hawai‘i, it has been harvested as food “pupu”-snail for centuries.
• High market value, about $220/gallon with shell on (Thompson 2011). • Commercial catch decreased significantly from 150,000 pounds in the 1900s
to about 10,000 pounds in 1978 (Iacchei 2011). • Many people have died while collecting opihi in the past, “the fish of death”. • There have been no available formation for the aquaculture of opihi
A local Hawaiian ate raw opihi right after collection from the wild
Nelson Kaʻai
Purpose
• Learn to hold opihi after capture. Determine natural feeds. • Learn what artificial feeds work and keep opihi from dying
due to starvation. • Assess the protein requirement of opihi. • Assess the carbohydrate requirement of opihi. • Estimate whether opihi might be a commercially culturable
species (it may grow too slowly).
4
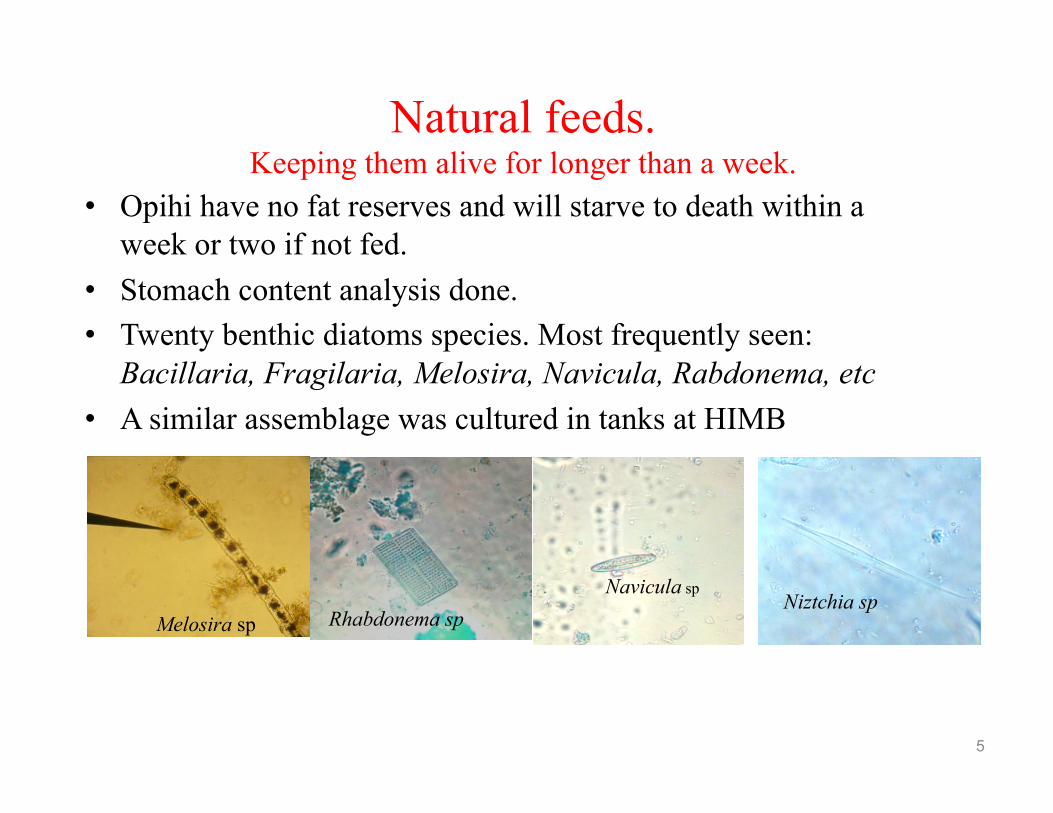
Natural feeds. Keeping them alive for longer than a week.
• Opihi have no fat reserves and will starve to death within a week or two if not fed.
• Stomach content analysis done. • Twenty benthic diatoms species. Most frequently seen:
Bacillaria, Fragilaria, Melosira, Navicula, Rabdonema, etc • A similar assemblage was cultured in tanks at HIMB
5
Melosira sp Rhabdonema sp Navicula sp
Niztchia sp

6
Day %dry matter/body weight/day
1 0.70 0.59 1.30 - - 1.20 0.25 - 2 0.93 0.60 - - 0.84 - 0.30 - 3 0.12 0.42 0.42 0.74 0.78 - 0.87 0.75 4 - 1.12 0.55 - - 0.56 0.50 0.37 5 0.12 0.56 0.84 1.06 0.52 1.11 0.33 0.37
Aver. 0.37 0.66 0.62 0.36 0.43 0.57 0.45 0.30 0.47±0.13%
Opihi fed well on biofilm at 0.47% DM/BW/day, they survived well
• This was an interim feed for opihi while an artificial feed was being developed

Artificial feeds. Palatability will be important.
Need to do your work before animals starve to death.
7
Ø Sea urchin feeds
Feed style Animals Feed consumption (%DM/BW/day)
6% fish 6% squid 3 0.12±0.05
12% fish 0% squid 3 0.05±0.06
0% fish 12 % squid 3 0.09
Mussel Homogenate 3 0.02±0.00
Squid homogenate 3 0.02
Control (Biofilm) 2 Ad libitum
• The best feeding rate was 0.12% DM/BW/day.
• Only two animals were alive after 30 days.
Conclusion: The sea urchin feed were not eaten in amounts high enough to support survival. Need to investigate feeding enhancers.

8
Ingredients (%)
Fish/soy Soy/corn
Fish meal 15 - Soybean meal 10 35
Corn meal - 10 Gelatin 18 18 Alginate 9.0 9.0 CO/MFO 3.0 3.0 Vitamin mix 1.0 1.0 Cholesterol 0.4 0.4
Feed enhancer experiments. • Carnivore versus herbivore, attractants
• Betaine, Spirulina, GABA and DMPT did not enhance feeding. Biofilm did!
b b b
b b
a
0
0.05
0.1
0.15
0.2
0.25
0.3
Feed
con
sum
ptio
n (%
DM
/BW
/day
)
Diet
N= 3, T =5
• Fish/soy was eaten at 0.16±0.06% DM/BW/day versus 0.10±0.03% DM/BW/day for soy/corn diet.
• Carnivore diet preferred.

9
Conclusion: Porphyra completely replaced the cultured biofilm as feeding stimulant.
a a
b
a
b b b
0
0.02
0.04
0.06
0.08
0.1
0.12
0.14
Feed
con
sum
ptio
n (%
DM
/BW
/day
)
Diet
N= 3-6, T = 4-6 days
Task 3. cont.
Further feeding enhancement tests

10
Literature work on feeding enhancers • We looked at abalone diets. • Growth rates were reported. • Several abalone diet ingredients seemed to enhance growth. Since amino
acids etc. were balanced, we reasoned that palatability was the difference. Eating rates were not reported.
.
Diet name Weight gain Diet name Weight gain
Casein 8.6abc Fishmeal 5.9c Fishmeal 8.0bc Soy meal 6.2bc Fish/soy/krill 8.8ab Poultry 1.9d Fish/soy/corn 7.6c Corn meal 1.3d Fish/soy/ shrimp meal 9.4a
Silkworm pupae meal 2.0d
Fish/soy/ green tea 9.1ab
Meat and bone meal 1.0d
Laminaria japonica 3.3d
Soy/corn gluten 7.0ab
different letters indicate significantly different (P<0.05)
Soy/silkworm pupae 7.3a
Corn/silk pupae 0.9d
• Casein too expensive, krill a possibility, shrimp head meal is not really advised for Hawaii, green tea, silk worm meal are probably not available
• Hence, krill meal is another option for the opihi diet.
• If growth tracking palatability and abalone similar to opihi.

Biofilm Fish/
Porphyra Soy/corn/fish/
Porphyra Fish/soy/krill/
Porphyra Alternating diet
Initial weight (g) 5.04±0.62 8.70±1.70 8.89±0.10 6.51±3.40 4.76±2.18
Final weight (g) 5.42±0.65 10.69±0.35 9.65±0.65 8.31±3.24 6.33±2.38
Weight gain (g) 0.38±0.41a 0.78±0.88a 0.76±0.45 a 1.80±1.38b 1.58±0.62b
SGR (%BW/day) 0.10±0.11a 0.11±0.13a 0.12±0.07a 0.44±0.37b 0.44±0.19b Feed consp. (%DM/BW/day) 0.81±0.54 0.15±0.03a 0.18±0.07a 0.73±0.53b *0.51±0.29ab
Survival (%) 50 67 67 67 71
11
Krill meal was the final key palatability ingredient and diet of Porphyra with fish/soy and krill meal could form a base diet for further study on nutrition. Note specific growth rate of about 0.44% BW/day amd calculated estimated growout time of a little over a year.
Final general feeding trial

Effect of dietary protein on growth performance
12
• Five different dietary protein levels.
• The diets were as follows. • N= 8-9 animals/diet, T= 90 days. • Due to an error in stocking, the
weight gain of each animal in each diet was normalized and being used for statistical analysis
• Error, krill meal was used to balance lipid. I is an attractant and should have been held constant.
Ingredient Dietary protein level (%)
27 32 37 42 47 Fishmeal 16.5 19.5 22.5 25.5 28.5 Soy meal 11.5 14.5 17.5 20.5 23.5 Krill meal 4.50 7.50 10.5 13.5 16.5 Porphyra 14.0 14.0 14.0 14.0 14.0 Wheat flour 15.4 14.3 13.3 12.2 11.1 Diatomacetous earth
29.2 21.9 14.6 7.30 0.00
Alginate 5.00 5.00 5.00 5.00 5.00 Corn/fish oil 2.50 1.90 1.20 0.60 - Vit. mix 1.00 1.00 1.00 1.00 1.00 Cholesterol 0.40 0.40 0.40 0.40 0.40 Calculated nutrient Protein 26.5 31.7 37.0 42.4 47.7 Lipid 4.97 4.97 4.97 4.97 4.97 Carbohydrate 17.5 17.8 18.1 18.3 18.6

Dietary protein (%)
27 32 37 42 47
Initial shell length (cm) 2.90±0.26 2.62±0.27 2.68±0.40 2.62±0.23 2.53±0.18
Final shell length (cm) 3.00±0.23 2.88±0.25 2.94±0.32 2.72±0.36 2.72±0.21 Mean initial weight (g) 3.35±0.79a 2.72±0.54a 2.65±1.01a 2.43±0.48a 2.44±0.51a Mean normalized weight gain (g) 0.31±0.11a 0.37±0.13a 0.41±0.20a 0.24±0.15a 0.23±0.08a
Mean SGR (%BW/day) 0.30±0.12a 0.35±0.11a 0.41±0.10a 0.32±0.10a 0.23±0.07a Mean feed consumption (%DM/BW/day) 0.90±0.14a 0.91±0.16a 1.05±0.13a 0.81±0.08ab 0.56±0.12b
FCR 0.94±0.8 0.94±0.24 1.10±0.53 1.11±0.34 1.12±0.25
Survival (%) 67 75 50 63 56
13
Conclusion: No significant differences in growth parameter due to difference in protein levels.
Effect of dietary protein on growth performance

Effect of dietary carbohydrate on growth performance
Aim: to determine the optimal carbohydrate level on growth performance of opihi.
14
• Opihi were fed with four different dietary carbohydrate levels.
• N= 9 animals/diet, T= 90 days.
Ingredient (g/100) Dietary carbohydrate level (%)
18 27 32 37
Fishmeal 16.5 16.5 16.5 16.5
Soy meal 11.5 11.5 11.5 11.5
Krill meal 4.50 4.50 4.50 4.50
Porphyra 14.0 14.0 14.0 14.0
Wheat flour 15.4 26.9 33.7 40.5 Diatomaceous earth 30.9 19.4 12.6 5.80
Calculated nutrient
Protein 26.5 26.5 26.5 26.5
Lipid 3.47 3.47 3.47 3.47
• Amylase activity was very high in the digestive tract system of the Patellacean limpets Patella vulgate, Cellana radiat (Branch 1981).
• No lipase activity was studied in limpet or opihi, but it was reported to be very low in digestive gland of abalone (Knauer et al., 1996).

Measurement Dietary carbohydrate level (%)
18 27 32 37
Mean initial weight (g) 2.80±0.51 3.56±0.37 3.96±0.98 4.34±1.20
Mean 3rd month measurement (g) 3.28±0.51 4.48±0.42 5.03±1.26 4.94±1.31
Mean normalized weight gain (g) 0.19±0.04a,b 0.26±0.04a 0.27±0.09a 0.18±0.09b
Mean SGR (%BWday-1) 0.20±0.03a,b 0.27±0.04a 0.26±0.07a 0.15±0.04b
Feed consumption 0.58±0.17a 0.57±0.09a 0.60±0.27a 0.45±0.07a
FCR 0.83±0.21 0.50±0.30 0.77±0.47 1.16±0.66
Survival (%) 67 78 78 67
15
a,b Means, within the row, different superscript letters are significant differently (P<0.05)
Effect of dietary carbohydrate on growth performance • Partially mortalities was due to weighing when removing them from colanders
Task 5. cont.
• The animals that were fed with 18% carbohydrate showed a tendency toward lower growth rates when compared to 27% (P=0.18) and 32% (P=0.15). The latter were significantly better than 37%.

Final notes on feeds • A feed with 27% protein and 32% carbohydrate would be
recommended. • This may be a model feed for a herbivore that does not use
lipid. • Krill meal and porphyra are needed as feeding attractants. • A final formulated diet may be as follows.
16
Ingredient g/100g Fishmeal 16.5 Soy meal 13.5 Krill meal 8.70 Porphyra 14.0 Wheat flour 33.7 Diatomaceous earth 6.40 Alginate 5.00 Corn/fish oil 1.00 Vit mix 1.00 Cholesterol 0.20 Total 100 Calculated nutrient Protein 27.4 Lipid 3.47 Carbohydrate 32.0

Final notes, cont. • Like abalone we can hold and grow opihi on natural feeds. • We can also use artificial feeds. More convenient. Low
protein herbivore feed with carbohydrate the energy source. Abalone seems similar.
• The animals held were held for months allowing for extended experiments such as final maturation, spawning, and larval rearing.
• Animals live in stagnant water so fancy facilities not required. They actually live right above the water.
• Growth rate about 0.44 g/day. • To do: make final maturation routine, (spawning okay), learn
to do larval rearing
17

18

Task 6. Reproduction performance, final maturation and spawning induction of opihi
Ø The first aim: Determination of spawning season of wild opihi
19
• The spawning season of opihi was examined by monthly measurement of gonadosomatic index (GSI) in associated with histology analysis of their gonad.
• At least 12 animals per month, from November 2011 to December 2012.
• They were carefully dissected to obtain their gonad for GSI and histology analysis.
• Histology sections were about 5-7 µm, stained with hematoxylin and eosin at the Queen Hospital, Hawaii.
• Before attempting to reproduce a new species, it is important to know the reproductive biology of opihi.

• Peak spawning season: Nov.-Dec. and would extended to Jan., based on GSI values of about 30% for males and 24% for females, Dec. 2011 was an exception.
• Histology analysis: mature female oocytes were round and the same sizes; mature male were densely sperm, dark blue stained by hematoxylin.
• Non-spawning season was proposed from February to early September; histology slides showed unclear oocytes formation and ovary cells of the imature female, and sperm were less densely in immature male gonad.
• Final maturation phase occurred in October.
20 Seasonal changes in GSI of opihi C. sandwicensis
cd
ab
cd
a ab
a a a a a ab
bc
d cd
0 5
10 15 20 25 30 35 40 45 50
Nov
.20
11
Dec
. 20
11
Jan.
20
12
Feb.
20
12
Mar
ch.
2012
A
pril.
20
12
May
. 20
12
June
.20
12
July
. 20
12
Aug
. 20
12
Sep.
20
12
Oct
. 20
12
Nov
. 20
12
Dec
. 20
12
GSI
(%)
Month
Task 6. cont.
Immature male Mature male
Immature female Mature female

Ø The next aim was to induce the final maturation of opihi in the laboratory
21
Task 6. cont.
• Adults opihi (9) were fed with the grow-out diet (from task 3) for 3 months from May-Aug. 2012, which was in natural resting period (February- September).
• Animals did not reach to the final maturation over 3 months period, GSI remained constantly. • It may be due to lack of ARA in
diet and/or in non-reproductive photoperiod phase .
v The initial maturation trial
Fatty acid g/100 g C20:4n-6 0.02 C20:5n-3 0.52 ARA/EPA 0.04
• Hence, a low ARA level was relative to low ARA/EPA ratio that might be insufficient for the final maturation.

22
• Literature review for several maturation studies in different species found that an appropriate ARA/EPA ratio of 0.7 would induce final maturation in aquatic animals.
Task 6. cont.
• In our hands, beside nutritional diet, photoperiod is also important for the final maturation.
v Induction of final maturation by manipulating ARA/EPA
Species Diet ARA
(g/100 g DM)
EPA (g/100 g
DM)
Ratio (ARA:EPA)
Reference
Mullet Spawned egg held outdoors 4.00b 5.80 0.69* Tamaru et al.,
1992 Spawned egg held indoors 2.50a 4.70 0.53
Japanese flounder, Paralichthys olivaceous
Diet 1, 0.1% ARA 0.04 0.32 0.12 Furuita et al.,
2003 Diet 2, 0.6% ARA 0.24 0.32 0.70*
Diet 3, 1.49% ARA 0.45 0.30 1.49 Diatoms Nitzschia 0.05 0.08 0.68* Gordon et al.,
2006 Amphora 0.04 0.13 0.27 Navicula 0.02 0.22 0.10 Ako 1995
Chaetoceros calcitrans 5.70** 11.1** 0.51 Volkman et al., 1989
C. gracilis 4.50** 4.60** 0.97 Opihi Mature ovary 0.08 0.96 0.08 Analyzed

• We then added different ARA levels into diet called Low and High ARA diets with the same ARA/EPA ratio of 0.7 as following:
23
Fatty acid
ARA/EPA ratio diet
Control Low ARA High ARA
ARA 0.02 0.24 0.39
EPA 0.34 0.34 0.56
ARA/EPA 0.06 0.70 0.70 Note: oil density 0.9 g/ml, and ARA impurity is 0.9 mg/ml
• Nine adults opihi were used for each diet. • Assessing gonadal development was examined for over 45 days during the
final maturation phase (September-November), 75 days in spawning season (Nov-Dec) and 95 days during post-spawning period (Dec. -Jan.).
• It was noticed that the animals were fed with wrong ARA levels for the first 45 days due to not corrected for oil density and impurity of ARA.

• Opihi reached to the final maturation in both low and high diets after 75 days and the gonad sections also confirmed the mature females for both diets.
• The GSI of opihi decreased in all diets after 95days, it could have been undergone reabsorption. This reflects the ineffective of the diet after spawning season’s photoperiod.
• None of the mature opihi were used for spawning.
24
GSI of opihi fed with various ARA levels for 95 days
50 um
Oc. 4
50 um
Oc. 4
Hence, the ARA/EPA ratio of 0.7 in feed under a favorable photoperiod induced final maturation in opihi.
0
5
10
15
20
25
30
initial 45 75 95
GSI
(%)
Experimental period (day)
control
low ARA
high ARA

25
100 µm
Oc2
Oc2
Oc1
Oc4
B
100 µm
Oc4
Oc4
Oc4
Oc2
Oc3
C
• The gonad of animals rapidly develop and reached to maturity level after three injections.
• Histology slides showed immature oocytes of control trial (top picture) and hormonal induction of mature female (bottom) at week 4.
• We did not have enough animals to induce spawning.
• Twelve adults opihi were injected with 250 ng/g BW (Nuurai et al., 2010) for 5-6 weeks, 7 day intervals, during maturation season
v Induction of final maturation by using salmon GnRH analog (sGnRHa)
• Hence, sGnRHa could properly use to induce final maturation in opihi in future

• Two spawning methods were used: hydrogen peroxide and sGnRHa during the spawning seasons.
26
Ø Induction of spawning
v The first spawning induction by using H2O2 at 0.6x10⁻²%
Trial N No. of spawn
% spawn
Total eggs produced
Fertilization rate (%)
Hatching rate (%)
Control 5 None - - - -
1 7 3 (1F, 2M) 43 26,987 23 7.0
2 7 1 (M) 14 - - -
3 5 4 (2F, 2M) 80 769,956 36±6.6 35±12 4 5 2 (1F, 1M) 40 50,000 ND 6.0
• Therefore, we concluded that H2O2 was not a practical method and not recommend to use as the loss of broodstock.
• Spawning rates varied from14-80% and spawned eggs also varied, these were problems.
• The toxic effect of H2O2 after the first 24 hr was not paid attention for trial 1 to 3, in the last trial, all the broodstock died in a week.
• The opihi may have released gametes due to stress of being died.

v The second spawning method, sGnRHa at dose of 1,000 ng/g BW
27
• Hence, the sGnRHa is an applicable technique and could be used for practical spawning induction of opihi.
Trial n No. of spawn
% spawn
Total eggs produced
Fertilization rate (%)
Hatching rate (%)
Control 5 None - - - -
1 8 3 (2F, 1M) 38 69,440 ND 17±1.7
2 8 3 (M) 38 - - -
3 8 2 (M) 25 - - -
4 8 5 (3F, 2M) 63 200,000 45±4.5 23±2.0
5 6 5 (2F, 3M) 83 40,533 18±2.5 14±2.6
6 9 2 (M) 22 - - -
• No mortalities had occurred after spawning and gave larvae for settlement trials. • A wide range spawning rates (22-83%) and only male spawned in some trials
may be due to maturity level and sexing opihi. • More attention must be paid to the maturity level of broodstock. • High spawning rated of trial 4 and 5 were associated with high level GSI of
broodstock of 39% and 36% of the same cohort.

Larval settlement trials • Aimed to successfully settle opihi larvae with different benthic diatoms and
pelagic algae
28
v Algae preparation:
Three benthic diatoms Amphora montana, Nitzschia hantzschiana and Skeletonema costatum, and two pelagic algae Isocyrisis galbana and Pavlova lutherii
7-10 days
F2 medium 6 settlement aquaria
5-7 days
Ambient temperature, 10,000 Lux
Think layer of film and cloudy pelagic algae
v Experimental larvae: obtained from GnRH trials; 6h after hatching
• 800 larvae/aquarium. • In the meanwhile the experiment was also run in the beakers as control, 30
larvae/beaker (250 mL), two replicates for each combination of benthic diatom and pelagic algae, the same as aquaria above.

• Data are only valid for speculation in further study due to small number of larvae and short survival time
29
a
b b b b b
0 5
10 15 20 25 30 35
Sett
lem
ent l
arva
e (%
)
Benthic diatoms and pelagic algae
• It was difficult to see the settled larvae in the aquaria presumed that due to the over growth of benthic diatom in the settlement plates (20 times higher than reference level for abalone larvae).
• In the control trial in beakers showed that Amphora and Paloval seemed to be preferred up to Day 6.
• They all died after 9 days of settlement. • Assuming that due to algae was not exposed to strong sun light and air conditions
in the laboratory for beaker trials.

Conclusion and suggestion
• We have learned how to collect opihi with minimum mortality • We have developed an effective method for handling opihi with minimized
mortality by using plastic liners and soft container. • We have also developed a practical commercial feed with good palatability,
producing good growth performance while being cost effective. • Protein and carbohydrate were optimized at 27% and 32% respectively. • Nutritional and photoperiod were required to induce final maturation. • We were also successful in inducing spawning by using GnRH • We did not complete the life cycle of the opihi in the laboratory, due to
mortality of our settled larvae fails at Day 9, need to bring to the juvenile phase.
• More work is needed to for maturation, spawning and larval rearing techniques to improve seed production.
• The aquaculture of opihi is close to be realized.
30

Acknowledgements
31
• To Nelson Kaai, Jason Levy providing opihi, to my friends, Chinh Tran and others who have had accompanied me while collecting opihi for my research.
• To MBBE professors and staff for helping me during my study. • To Dr. Chris. Bird for opihi collection, to Dr. Warren Dominy, Dr. Dong Fang,
Dr. Ju at OI for useful suggestions and nutrient analysis, to Dr. Addition Lawrence for sea urchin feed, to Dr. Audrey Asahi for kindly providing algae, to Charles Nelson for providing facilities.
• To others
32
Thank you very much for your attention!!! MAHALO!

33
Task 1: Collection and Handling • Aim: to learn how to collect and handle opihi with minimum mortality. • Removing opihi from the surfaces without killing them was a challenge because
they evolved an ability to cling to rocks in crashing surf. Ø Mortality due to collection
0
10
20
30
40
50
60
70
1st 2nd 3rd 4th 5th 6th 7th 8th 9th
Mor
talit
y (%
)
Collection trial
Kona bay, Big Island Conclusion: With some experiences, achieved about 70% survival.
• Removing them from the rocks while collection led to 58% mortality in the first time.
• It was assumed due to injury during capture
• Eventually, accomplished about 30% mortality in practice.

Task 1, cont.
Ø Mortality due to weighing in feed trials
34
No. of trial 1 2 3 4 5 6 7 8 9 No. of animals 17 33 26 20 17 15 19 21 11 Transfer from Naked tank to
bioassay aquaria Plastic lined aquaria to bioassay
aquaria Transfer mort. within 4 days (ind.)
7 1 3 0 0 0 0 0 0
Ø Mortality due to transfer
Feed trial No. of animal
Mortality (ind.) Weighing unknown
Protein 43 9 8 Carbohydrate 36 6 4
• Soft container with layer plastic tubs was more reliable.
• Removing them from one tank to transfer to another initial resulted 42% mortality. • Plastic aquaria liners solved the transfer mortality issue.
• Hence, plastic liners was one solution
• We did not recognize but over time we realized that there was a low but consistent mortality due to removing animals from colanders.