operative & financial results: fourth quarter...
TRANSCRIPT

O p e r a t i v e & F i n a n c i a l R e s u l t s :F o u r t h Q u a r t e r 2 0 1 5

Re
su
lts
: F
ou
rth
Qu
ar
te
r 2
01
5
2
Grupo Posadas, S.A.B. de C.V. & SubsidiariesMexico City, February 25, 2015
Information presented with respect to previous year under IFRS accounting stan-dards:
• In 2015 total revenues, EBITDA and margin grew 18%, 43% and 3.4pp, respec-tively.
• 14 hotel openings in 2015 with 2,165 rooms, 9% increase vs. 2014.• The pipeline considers 34 new hotels and 22% additional rooms to be open dur-
ing the next 24 months.• Cash available as of December 31, 2015 of $1,214 million (US$71 million).
US$26 million are denominated in dollars, representing 70% of the Senior Notes due 2017.
IR: Gerardo de PrevoisinTel.: (5255) 5326-6757 [email protected]
After recording six consecutive quarters exceeding our guidance. The Net Debt leverage ratio improved 0.9 times versus the same quarter of previous year (from 4.6x to 3.7x) and remains unchanged since 3Q15, despite an additional $0.30 peso or 1.8% depreciation of the MXN versus the USD during the 4Q15.
During the 4Q15 System-wide hotel performance continued improving with better margins. Our Avail-able Daily Rate(ADR) and occupancy increased 6.4% and 1.8 percent points (“pp”) respectively, which resulted in a Revenue Per Available Room (RevPAR) growth of 9.4%, that represents a continued improv-ing growth trend on a quarter by quarter basis for the last 15 consecutive quarters.
Urban hotels, which represent 79% of the total rooms operated, continue to perform better with an increase in RevPAR of 8.1% and our coastal hotels performed with a RevPAR increase of 10.1%.
Our portfolio of brands continues with our recently launched LAT20 by Live Aqua, a new alternative in the high-end segment in the 5th Avenue at Playa del Carmen. In 2015, fourteen Fiesta Inn “Business class” hotels evolved into the 2.10 concept, after these we have 31 fully refurbished hotels.
> Financial Highlights
“During the fourth quarter 2015 we continued with an outstanding performance in our hotels system-wide exceeding by 10% the EBITDA of 4Q14.” said Jose Carlos Azcarraga, Posadas’ CEO
Million pesos as of December 31, 2015 4Q15 %
Var.
YY %2015 %
Var.
YY %
Total Revenues 1,734.6 100 11.6 6,901.2 100 18.0
EBIT 207.8 12 15.9 947.3 14 73.9
EBITDA 331.4 19 9.9 1,362.0 20 42.8

Re
su
lts
: F
ou
rth
Qu
ar
te
r 2
01
5
3
The net loss of the 4Q15 was of $39.3 million, due mainly to the exchange loss of $95.0 million.
The EBITDA as our main source of cash, allowed us to invest more than $600 million in maintenance and refurbishments in our hotels, fulfill our financial and fiscal commitments and generate more than $450 million in net cash in 2015.
It´s worth mentioning that from the cash balance of $1.2 billion, US$26 million are denominated in USD from excess cash collections in 2015 after honoring all USD denominated compromises including ser-vicing our debt. Our USD generation performs as a hedge to the coupons of our Notes due in 2017 and 2022.

Re
su
lts
: F
ou
rth
Qu
ar
te
r 2
01
5
4
> Hotel Development
As of December 31, 2015, we continue with an aggressive pipeline comprised of executed agreements to oper-ate 34 new hotels with 5,049 rooms. This development plan represents an increase in capacity of 22%. These hotels represent a total investment of US$477 million and of these, 24% will be invested by Posadas and 76% will be invested by third parties. Openings are expected to begin in the first quarter of 2016 and we expect all of these to be operating by December 2017 according to commitments made with the different property own-ers. The average life to operate these contracts is over 15 years.
As we continue with an aggressive openings schedule, during the last twelve months 14 hotels with 2,165 ad-ditional rooms were opened (including 5 conversions to the Gamma by Fiesta Inn under a franchise model): One Cuernavaca, Gamma el Castellano Merida, Gamma Monterrey Ancira, One Villahermosa Tabasco 2000, Gamma Ixtapa, One Celaya, One Gran Sur, Gamma Xalapa Nubara, FI Loft Irapuato, Grand Fiesta Americana (GFA) All Inclusive Parks Vallarta, FI Loft Ciudad del Carmen, Gamma Campeche Malecón, LAT 20 by Live Aqua and FI Villahermosa.
Hotel Development
New HotelsHotels Rooms %
Live Aqua 2 320 6.3
Grand Fiesta Americana 2 345 6.8
Fiesta Americana 5 885 17.5
FA Vacation 2 590 11.7
Fiesta Inn 10 1,349 26.7
Gamma by Fiesta Inn 1 48 1.0
One Hoteles 12 1,512 29.9
Total 34 5,049 100
Openings LTM No. of Rooms Type of Contract
One Cuernavaca 125 Managed
Gamma El Castellano, Mérida 153 Franchise
Gamma Monterrey Ancira 244 Franchise
One Villahermosa Tabasco 2000 126 Managed
Gamma Ixtapa 153 Franchise
One Celaya 126 Managed
One Gran Sur 144 Managed
Gamma Xalapa Nubara 121 Franchise
Fiesta Inn Loft Aeropuerto 44 Managed
Fiesta Americana Grand All Inclusive Parks Vallarta 444 Managed
Fiesta Inn Loft Ciudad del Carmen 120 Managed
Gamma Campeche Malecon 146 Franchise
Lat 20 by Live Aqua 60 Leased
Fiesta Inn Villahermosa 159 Managed
Total 2,165

Re
su
lts
: F
ou
rth
Qu
ar
te
r 2
01
5
5
During the quarter, revenues from this segment represented 47.9% of the consolidated revenues. The EBITDA margin was 28.8% representing an 8.4pp improvement over the 4Q14.
A higher ADR (Average Daily Rate) of 14.8% and a 3.0pp increase in occupancy resulted in a RevPAR increase of 19.5%. The gross operating profit margin improved in 2.4pp QQ and 3.1pp YY.
Results for urban hotels showed an improvement when compared with 4Q14; on average with 1.1% less rooms owned and leased due to the shift of the leased Fiesta Inn San Luis Potosi Oriente hotel to a managed agreement, a 12.3% increase in ADR and a 2.8pp increase in occupancy, resulted in a RevPAR improvement of 16.6%.
With 1.4% more average number of rooms available for coastal hotels with the recent opening of the LAT20 hotel and more international travelers and the local yearend vacation period, this segment showed an increase in ADR of 19.9% and in occupancy of 3.6pp. As a result of a better mix of rates the RevPAR increased 26.1% when compared with the same period of previous year.
> Owned and Leased Hotels
4Q15 (QQ) Total % Var. Urban % Var. Coastal % Var.
Average Rooms 5,496 (0.5) 4,202 (1.1) 1,294 1.4
Available Daily Rate 1,427 14.8 1,282 12.3 1,898 19.9
Occupancy (Var. in pp) 75% 3.0 76% 2.8 72% 3.6
RevPAR 1,066 19.5 970 16.6 1,360 26.1
Accumulated Total % Var. Urban % Var. Coastal % Var.
Average Rooms 5,443 (2.9) 4,164 (3.9) 1,279 0.3
Available Daily Rate 1,383 14.8 1,213 10.2 1,867 23.3
Occupancy (Var. in pp) 73% 3.6 71% 3.4 78% 4.0
RevPAR 1,005 20.7 860 15.7 1,456 30.1

Re
su
lts
: F
ou
rth
Qu
ar
te
r 2
01
5
6
The Management line includes management and brand services along with our loyalty management and call center businesses. Revenue represented 13.9% of total revenue in the quarter. The brands business line increased 3% QQ.
The following operating data considers all the hotels we manage in Mexico.
The average number of rooms operated recorded a 7.1% increase in the quarter, while System-wide hotels reported a 6.4% improvement in ADR, a 1.8pp increase in occupancy, and a RevPAR growth of 9.4%. The gross operating profit margin improved 0.5pp QQ and 1.7pp YY. By regions, all over performed versus the same period of previous year. As of the 4Q15 the remaining average life of our management contracts is over ten years.
System-wide urban hotels had an increase in the average number of operated rooms of 5.5% with an improvement in ADR of 4.7% and a 2.2pp in occupancy achieving a RevPAR increase of 8.1%.
Coastal hotels recorded a 17.4% increase in the average number of available rooms after including the Grand Fiesta Americana All Inclusive Parks Vallarta hotel since September 15, 2015, and the LAT 20. In addition, occupancy increased 0.2% while ADR, and RevPar increased 9.7% and 10.1% (after excluding these 2 openings RevPAR is 21.8%), respectively. The growth observed represents a better rate and occupancy mix.
The margin for the 4Q14 represented 3.2%. For 2015 the margin was 22.5%, 4.7pp lower than in the 2014.
Includes owned, leased, managed and franchised hotels.
> Management
4Q15 (QQ) Total % Var. Urban % Var. Coastal % Var.
Average Rooms 20,619 7.1 17,502 5.5 3,117 17.4
Available Daily Rate 1,186 6.4 1,071 4.7 1,889 9.7
Occupancy (Var. in pp) 67% 1.8 68% 2.2 62% 0.2
RevPAR 800 9.4 732 8.1 1,180 10.1
Accumulated Total % Var. Urban % Var. Coastal % Var.
Average Rooms 19,946 8.0 17,157 7.9 2,788 8.8
Available Daily Rate 1,167 5.4 1,043 2.8 1,886 14.5
Occupancy (Var. in pp) 66% 2.1 65% 2.1 69% 1.8
RevPAR 765 8.8 678 6.3 1,294 17.5

Re
su
lts
: F
ou
rth
Qu
ar
te
r 2
01
5
7
> Vacation Club and Other
The Vacation Club and Other business segment primarily includes our vacation properties comprised of the Fiesta Americana Vacation Club (FAVC), The Front Door and KiVac programs. Revenue for the quar-ter amounted to 38.0% of the Posadas’s consolidated revenues in 4Q15 and the contribution margin was 25.5%. The sale of memeberships increased in 16% vs. the same quarter of the previous year. Food and beverages increased 45% QQ and 89% YY.
As of December 31, 2015, the portfolio profile of total receivables which is valued at approximately US$210 million, US$131 million belong to the Fiesta Americana Vacation Club “FAVC” and the remaining balance is a split between The Front Door and KiVac programs. The FAVC has more than 31,000 members and KiVac more than 26,000 travelers that have emerged from a new community that grows at an exceptional pace.
To continue developing our high-end program, last December we acquired a US$5 million plot of land adja-cent to the Grand Fiesta Americana hotel in Los Cabos for our The Front Door program, a 100 room facility will be built to be fully available by mid-2017. Meanwhile the Fiesta Americana Vacation Club Villas located in Acapulco Diamante remains in the evaluation phase.
> EBITDA
In the 4Q15 an EBITDA of $331.4 million was recorded, that compares favorably with the $301.7 million recorded in 4Q14 (+9.9%).
For the last twelve months, EBITDA (IFRS) was $1,362.0 million (US$85.6 million with an average exchange rate of MXN$15.9063 per USD), that represent a 42.8% improvement versus the $954 million in 4Q14 LTM.
> Capital Expenditures
The total consolidated capex was $283 million; $120 million for hotels, $136 million for vocational proper-ties and $27 million for corporate.
For the full year 2015, consolidated capex was $612 million.
Hotels: 43% was used for maintenance and refurbishing hotels –the Fiesta Americana Guadalajara, Fiesta Americana Condesa Cancun, Fiesta Inn Aeropuerto hotel in Mexico City, Fiesta Inn Cuautitlan, and Fiesta Americana Mérida.
The vacation properties capex: 33% was used for The Front Door in Los Cabos and Acapulco.
Corporate: 25% related to our new corporate offices, Information and technology.

Re
su
lts
: F
ou
rth
Qu
ar
te
r 2
01
5
8
> Comprehensive Financial Result
> Net Majority Income
As a result of the aforementioned a net loss of $39.3 million was recorded for the 4Q15 and $470.2 million for 2015.
At the end of the quarter, considering the effect of IFRS, the net coverage ratio was 2.9 times; 0.5 times higher than the observed in the same quarter of the previous year.
In 4Q15 the foreign exchange unrealized loss of $0.30 depreciated 1.8% (MXN/USD) from Septem-ber 30, 2015 to December 31, 2015.
Concept 4Q15 4Q14 2015 2014
Interest earned (7,789) (2,911) (33,066) (22,509)
Interest expense 140,772 110,846 508,840 417,669
Fluctuations loss (gain) 94,953 328,519 707,162 427,934
Other expenses (products) 0 0 0 0
Financial expenses 31,738 19,004 100,080 60,763
Total 259,674 455,459 1,283,016 883,857Figures in thousands of pesos.
Re
su
lts
: F
ou
rth
Qu
ar
te
r 2
01
5
9
> Financial Situation
As of December 31, 2015 the cash balance was $2,214 million (US$70.6 million with an exchange rate at the end of period of $17.2065 per USD). On November 18, 2015, the US$50 million Euro-Commercial paper was paid.
As of the end of the fourth quarter the total assets reached $13,776.9 million (US$800.7 million).
The main uses of cash during the quarter were, among other items, the Senior Notes coupons, capital expen-ditures and taxes.
Total Debt at the end of the quarter was $6,243.6 million (US$362.9 million), net of issuance expenses, while the Net Debt (IFRS) was $5,029.8 million (US$292 million), the Net Debt to EBITDA ratio was 3.7 times under IFRS, which compares favorably as this ratio was 4.6 times in 4Q14.
The Total Debt mix under IFRS at the end of the quarter was as follows: 100% in long-term, in U.S. dollars and with a fixed rate. The average debt maturity was 6.0 years and there was no secured debt outstanding.
As of the release date of this report, the existing corporate ratings are:
• Moody’s: global scale “B2” with stable outlook. • S&P: global “B” with stable outlook. • Fitch: global Issuer Default Rating (IDR) “B” and local “BB+(mex)”, both with stable outlook.
The ratings for the “7.875% Senior Notes Due 2017” and “7.875% Senior Notes Due 2022” were: Moody’s: “B2”/ S&P:”B” / Fitch: “B+ RR3”.
In compliance with article 4.033.02 Frac. VIII of the Mexican Stock Exchange rules, Grupo Posadas coverage is provided by:J.P. Morgan Securities LLC, analyst, Jacob Steinfeld [email protected] (1-212) 834-4066Bank of America Merrill Lynch, analyst, Roy Yackulic [email protected] (1-646) 855-6945 BCP Securities, LLC, analyst: Ben Hough [email protected] (1-203) 629 2181

Re
su
lts
: F
ou
rth
Qu
ar
te
r 2
01
5
1 0
> Grupo Posadas as of December 31, 2015
Posadas is the leading hotel operator in Mexico that owns, leases and manages 141 hotels and 23,259 rooms in the most important and visited urban and coastal destinations in Mexico (99% of total rooms) and owns one hotel in the United States (1%). 79% of rooms are in urban destinations and 21% in coastal. Posadas operates under the following main brands: Live Aqua, LAT20 by Live Aqua, Grand Fiesta Americana, Fiesta Americana, The Explorean, Fiesta Americana Vacation Villas, Fiesta Inn, Gamma by Fiesta Inn and One Hotels.
Posadas trades in the MSE since 1992.
Leased 2,335 rooms
Managed 15,206 rooms
Owned 4,817 rooms
Franchise 901 rooms
Distribution by Rooms
BrandMexico USA Total
Hotels Rooms Hotels Rooms Hotels Rooms
Live Aqua 3 566 3 566
Fiesta Americana 18 5,333 18 5,333
Fiesta Inn 65 9,414 65 9,414
Gamma 9 1,335 9 1,335
FA Vacation Villas 7 1,613 7 1,613
One Hoteles 37 4,582 37 4,582
Otros 1 213 1 203 2 416
Total 140 23,056 1 203 141 23,259
% 99% 1% 100%

Re
su
lts
: F
ou
rth
Qu
ar
te
r 2
01
5
1 1
> Income Statement IFRS (million pesos)
Concept 4Q15 % 4Q14 % Var.% 2015 % 2014 % Var. %
Total Revenues 1,734.6 100.0 1,553.9 100.0 11.6 6,901.2 100.0 5,848.3 100.0 18.0
Owned & Leased Hotels
Revenues 830.1 100.0 755.7 100.0 9.8 3,103.8 100.0 2,717.8 100.0 14.2
Direct cost 591.2 71.2 601.6 79.6 (1.7) 2,335.9 75.3 2,265.1 83.3 3.1
Contribution 238.8 28.8 154.1 20.4 55.0 767.9 24.7 452.7 16.7 69.6
Management
Revenues 241.6 100.0 289.9 100.0 (16.7) 1,123.2 100.0 1,107.9 100.0 1.4
Direct cost 233.9 96.8 206.0 71.1 13.6 870.2 77.5 806.5 72.8 7.9
Contribution 7.7 3.2 83.9 28.9 (90.8) 253.1 22.5 301.4 27.2 (16.0)
FA Vacation
Revenues 608.5 100.0 482.4 100.0 26.1 2,619.8 100.0 1,996.7 100.0 31.2
Direct cost 453.5 74.5 325.0 67.4 39.5 2,011.5 76.8 1,520.7 76.2 32.3
Contribution 155.0 25.5 157.4 32.6 (1.5) 608.3 23.2 475.9 23.8 27.8
Corporate expenses 86.2 5.0 64.1 4.2 34.6 321.1 4.7 255.5 4.4 25.7
Depreciation / amortization 123.6 7.4 122.4 8.0 1.0 414.7 6.1 409.3 7.0 1.3
Asset impairment 0.0 0.0 0.0 0.0 na 0.0 0.0 0.0 0.0 na
Other expenses 38.3 2.2 55.5 3.6 (31.0) 0.5 0.0 46.4 0.8 (99.0)
Other revenues (54.4) (3.1) (25.8) (1.7) 110.6 (54.4) (0.8) (25.8) (0.4) 110.6
Operating Profit 207.8 12.0 179.2 11.5 15.9 947.3 13.7 544.7 9.3 73.9
EBITDA 331.4 19.1 301.7 19.4 9.9 1,362.0 19.7 954.0 16.3 42.8
Comprehensive financing cost 259.7 15.0 455.5 29.3 (43.0) 1,283.0 18.6 883.9 15.1 45.2
Profit Before Taxes & Assoc. Co. 0.0 0.0 0.0 0.0 na 0.0 0.0 0.0 0.0 na
Part. in results of Associated Co. (0.8) (0.0) 0.2 0.0 na (0.8) (0.0) (12.6) (0.2) (94.0)
Profit Before Taxes (52.7) (3.0) (276.1) (17.8) (80.9) (336.5) (4.9) (351.7) (6.0) (4.3)
Discontinued Operations 0.0 0.0 0.8 0.1 na 2.6 0.0 (8.7) (0.1) na
Income taxes (23.1) (1.3) 95.1 6.1 na 132.9 1.9 169.8 2.9 (21.7)
Deferred taxes 5.4 0.3 (389.4) (25.1) na (1.6) (0.0) (1,231.1) (21.1) (99.9)
Net Income before Minority (35.0) (2.0) 17.4 1.1 na (470.4) (6.8) 718.2 12.3 na
Minority Interest 4.3 0.3 2.1 0.1 104.7 (0.2) (0.0) 1.4 0.0 na
Net Majority Income (39.3) (2.3) 15.2 1.0 na (470.2) (6.8) 716.8 12.3 na
Re
su
lts
: F
ou
rth
Qu
ar
te
r 2
01
5
1 2
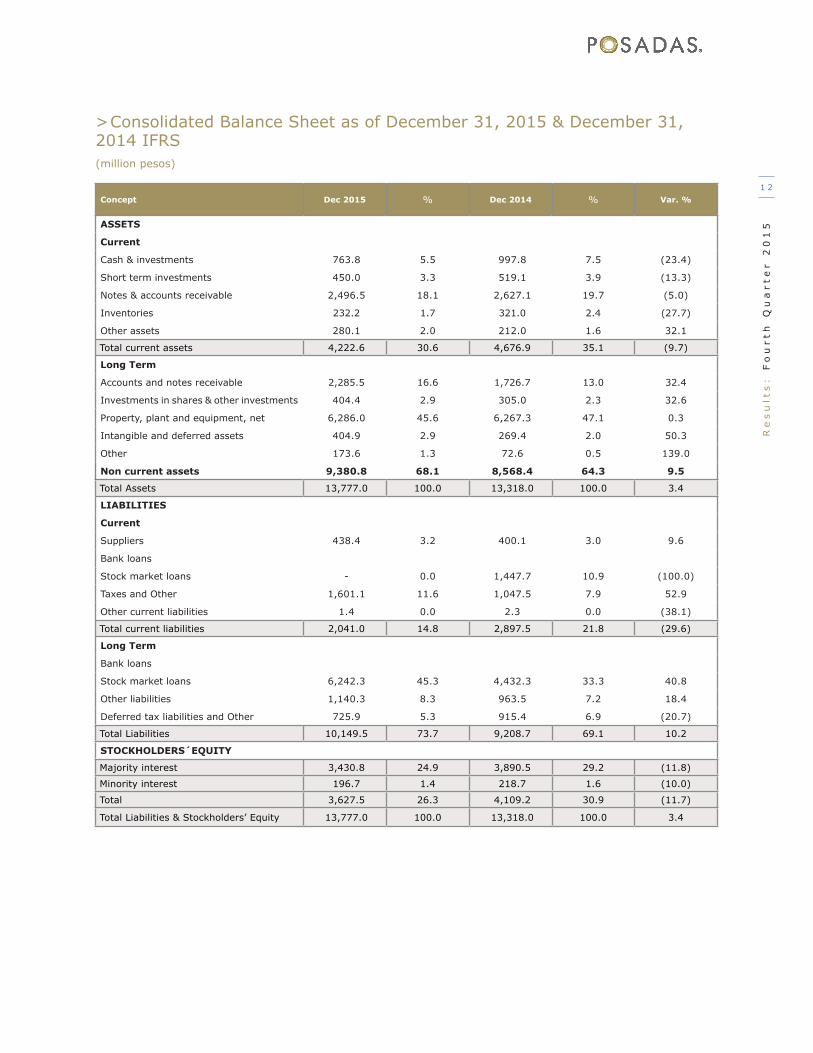
> Consolidated Balance Sheet as of December 31, 2015 & December 31, 2014 IFRS(million pesos)
Concept Dec 2015 % Dec 2014 % Var. %
ASSETS
Current
Cash & investments 763.8 5.5 997.8 7.5 (23.4)
Short term investments 450.0 3.3 519.1 3.9 (13.3)
Notes & accounts receivable 2,496.5 18.1 2,627.1 19.7 (5.0)
Inventories 232.2 1.7 321.0 2.4 (27.7)
Other assets 280.1 2.0 212.0 1.6 32.1
Total current assets 4,222.6 30.6 4,676.9 35.1 (9.7)
Long Term
Accounts and notes receivable 2,285.5 16.6 1,726.7 13.0 32.4
Investments in shares & other investments 404.4 2.9 305.0 2.3 32.6
Property, plant and equipment, net 6,286.0 45.6 6,267.3 47.1 0.3
Intangible and deferred assets 404.9 2.9 269.4 2.0 50.3
Other 173.6 1.3 72.6 0.5 139.0
Non current assets 9,380.8 68.1 8,568.4 64.3 9.5
Total Assets 13,777.0 100.0 13,318.0 100.0 3.4
LIABILITIES
Current
Suppliers 438.4 3.2 400.1 3.0 9.6
Bank loans
Stock market loans - 0.0 1,447.7 10.9 (100.0)
Taxes and Other 1,601.1 11.6 1,047.5 7.9 52.9
Other current liabilities 1.4 0.0 2.3 0.0 (38.1)
Total current liabilities 2,041.0 14.8 2,897.5 21.8 (29.6)
Long Term
Bank loans
Stock market loans 6,242.3 45.3 4,432.3 33.3 40.8
Other liabilities 1,140.3 8.3 963.5 7.2 18.4
Deferred tax liabilities and Other 725.9 5.3 915.4 6.9 (20.7)
Total Liabilities 10,149.5 73.7 9,208.7 69.1 10.2
STOCKHOLDERS´EQUITY
Majority interest 3,430.8 24.9 3,890.5 29.2 (11.8)
Minority interest 196.7 1.4 218.7 1.6 (10.0)
Total 3,627.5 26.3 4,109.2 30.9 (11.7)
Total Liabilities & Stockholders’ Equity 13,777.0 100.0 13,318.0 100.0 3.4

Re
su
lts
: F
ou
rth
Qu
ar
te
r 2
01
5
1 3
>Consolidated Cash Flow Statement - IFRS (Million pesos from January 1st to December 31, 2015 & 2014)
For more information visit www.posadas.com
Consolidated Cash Flow statement
DEC 2015 DEC 2014
Consolidated Net Income Before Taxes (336.5) (351.7)
+ (-) Items not requiring cash
+ (-) Other unrealized items
+ (-) Entries related to Investments 444.7 408.1
+ Asset impairment, Depreciation and Amortization for the year 414.7 409.3
+ (-) Gain or loss on sale property, plant and equipment 88.1
+ (-) Equity in results of associates and joint ventures 0.8 12.6
+ (-) Interest income (34.5) (22.5)
+ (-) Other items (24.4) 8.7
+ (-) Items related to financing activities 1,493.3 1,004.4
+ Accrued interest 508.8 417.7
+ (-) Currency fluctuations 984.5 586.8
+ Derivatives
Cash before taxes 1,601.6 1,060.8
Cash flow provided or used in operation (119.2) (712.8)
+ (-) Decrease (increase) in accounts receivable (442.2) (192.6)
+ (-) Decrease (increase) in inventories 88.8 (179.2)
+ (-) Decrease (increase) in other accounts receivables and other assets (210.3) (93.4)
+ (-) Increase (decrease) in suppliers 38.3 51.8
+ (-) Increase (decrease) in other liabilities 867.0 295.9
+ (-) Income taxes paid or returned (466.6) (595.2)
Net cash flows from operation 1,482.3 348.0
Net cash flow from investing activities (510.3) (382.4)
(-) Permanent investments 69.1 6.3
(-) Investment in property, plant and equipment (612.4) (437.4)
+ Business sales 26.2
+ Interest received 33.1 22.5
+ Sale of property, plant and equipment 5.7
+ (-) Other items
Net cash flow financing activities 972.1 (34.4)
Net cash flows (1,246.0) 314.5
+ Bank financing
+ Stock market financing 1,219.4 740.2
+ Issuance costs (339.5)
+ Other financing, includes margin calls
(-) Bank financing amortization
(-) Stock market financing amortization (1,542.8)
(-) Other financing amortization (7.7)
+(-) Increase (decrease) in equity
(-) Dividends paid (8.0)
+ Premium on issuance of shares 11.0
+ Contribution for future capital increases
(-) Interest expense (573.3) (427.1)
(-) Repurchase of shares (2.0)
+ (-) Other items (1.5)
Net increase (decrease) in cash and cash equivalents (273.9) 280.1
Changes 39.9 11.3
Cash and cash equivalents at the begining of period 997.8 706.4
Cash and cash equivalents at the end of period 763.8 997.8