operational guidance and standards for … · operational guidance and standards for national and...
TRANSCRIPT
OPERATIONAL GUIDANCE AND STANDARDS FOR NATIONAL AND SUBNATIONAL REED+
PROGRAMS IN GHANA
By
Winston Asante October, 2014
Page | 1
Contents
2.12.3 Additionality ............................................................................................................................ 29
2.12.4 Boundaries ................................................................................................................................... 30
2.12.5 Leakage ........................................................................................................................................ 30
2.12.6 Permanence ..................................................................................................................................... 31
INTERNAL RISKS ...................................................................................................................................... 32
EXTERNAL RISKS ...................................................................................................................................... 32
NATURAL RISKS ....................................................................................................................................... 32
Poor project management ...................................................................................................................... 32
Political instability ................................................................................................................................... 32
Fire .......................................................................................................................................................... 32
Project not financially feasible ................................................................................................................ 32
Corruption ............................................................................................................................................... 32
Drought ................................................................................................................................................... 32
Opportunity costs ................................................................................................................................... 32
Changes in the market ............................................................................................................................ 32
Pest & Disease ......................................................................................................................................... 32
Social conflicts ......................................................................................................................................... 32
Insecure tenure ....................................................................................................................................... 32
Seedling mortality ................................................................................................................................... 32
Livelihood constraints ............................................................................................................................. 32
Geologic Events ....................................................................................................................................... 32
leaders ..................................................................................................................................................... 32
Extreme weather .................................................................................................................................... 32
2.12.7 Other cross-cutting issues ....................................................................................................... 32
2.13 Classification of potential REDD+ project types in forest reserves and off-reserve landscapes ........ 33
2.13.1 Assessment of different land use types/systems ........................................................................ 33
2.13.2 REDD+ Potential in the Savannah and transitional zones............................................................ 34
2.13.3 REDD+ Potential in the High forest zone ..................................................................................... 36
2.13.4 Matrix (rank/score different land use types based on criteria/factors above) ........................... 38
Page | 2
2.14 Implications of land use classifications in the major ecological zones for REDD+ activities in off-reserve forest areas .................................................................................................................................... 42
2.14.1 Implications to unique ecological characteristics. ....................................................................... 42
Savannah zone .................................................................................................................................... 42
Transitional zone ................................................................................................................................. 43
High forest zone .................................................................................................................................. 43
3.0 Step-by-step approach in the design, implementation and monitoring of REDD+ strategies for different landuse types in the ecological zones of Ghana for subnational and national REDD+ programs45
3.1 The Emerging REDD+ Environment in Ghana ....................................................................................... 45
3.2 Project Idea and Preliminary Assessment ............................................................................................. 45
3.2.1 Project Conceptualization ......................................................................................................... 45
3.2.2. Identifying the project issue .................................................................................................... 46
3.2.3 Defining baseline activities ....................................................................................................... 46
3.2.3 Analysis of drivers, causes and agents ..................................................................................... 48
3.2.4 Defining project interventions .................................................................................................. 50
3.2.5 Preliminary determination of project scale, area and boundaries .................................. 51
3.2.6 Identifying key project participants ......................................................................................... 52
3.3 Draft Project Idea Note ......................................................................................................................... 52
3.4 Conduct a Thorough Project Feasibility Assessment ............................................................................ 53
3.5 Project Design and Planning ................................................................................................................. 54
3.5.1 Define a Target Market or Standard .......................................................................................... 54
3.5.2 Ensure Effective Community Engagement................................................................................. 55
3.6 Plan for Project Design and developing a project design document (PDD) .......................................... 56
3.7 Developing a Project Design Document ............................................................................................... 57
BIBLIOGRAPHY ............................................................................................................................................ 58
Page | 3
SECTION ONE
1.0 GENERAL INTRODUCTION AND OVERVIEW OF REDD+ READINESS IN GHANA Tropical forest contains about 80% of global terrestrial above-ground carbon stocks (biomass) and plays an important role in the global carbon cycle (Houghton 2005). Tropical forests are a strong carbon sink (Stephens et al 2007). However, tropical deforestation contributes about one fifth of total anthropogenic CO2 emissions to the atmosphere (Houghton 2007). Recognizing the significant role tropical forest resources could play in mitigating future climate disruption, the United Nations Framework Convention on Climate Change (UNFCCC) initiated discussions on how to reduce emissions from deforestation and degradation (REDD+) in developing countries. This is because forest alone in developing countries has the potential to contribute as much as 6Gt towards the overall global target of 17Gt required to maintaining 450 ppm global pathways towards the global goal of limiting average temperature rise below 20C (IWG, 2009). The emerging mechanism of Reducing Emissions from Deforestation and Forest Degradation (REDD+) presents opportunities for developing countries to contribute to climate change mitigation and benefit from associated financial flows. Specifically, such actions and measures are meant to result in the reduction of carbon dioxide emissions from forests, either by preventing their destruction or degradation, or by enhancing carbon stocks through tree planting, conservation, or sustainable management. Ghana has been an active participant in this international process aimed at mitigating climate change, which poses a major threat to humankind on a global scale. In the quest to contribute to the realization of the goals and objectives of REDD+, the Government of Ghana, through designated state institutions, has been collaborating closely with key international and local partners to implement this evolving global mechanism. The Government of Ghana is therefore progressing towards engagement in the emerging mechanism to Reduce Emissions from Deforestation and Forest Degradation (REDD). This engagement is occurring at three levels:
a) Participation in international negotiations under the auspices of the UNFCCC to define and reach an international agreement on REDDplus
b) Preparation to participate at a national level and benefit from a future financing mechanism such as REDD+
c) Building the capacity of local communities and other key stakeholders to participate actively in readiness and implementation activities of REDD+.
The Forest Carbon Partnership Facility of the World Bank is currently providing support in the sum of US$3.4 million for the implementation of a 4-year REDD-Readiness Preparation Proposal
Page | 4

(R-PP), which seeks to position Ghana to effectively participate in the evolving international REDD+ mechanisms. Although many aspects of the international system are yet to be determined, it is clear that for REDD+ to work it must enable results-based payments, either through markets or fund-based transactions. To facilitate transactions of this nature, detailed regulation and monitoring will be essential. Box 1 outlines the tasks and activities associated with the implementation phase of Ghana’s R-PP. Currently, seven pilot projects have been identified for implementation under the REDD+ readiness preparation process, which would provide an opportunity for Ghana to roll-out actual mitigation projects in the forest sector. The selection of these pilot sites fall in line with Step 1activities(Analysis, Preparation and Consultation), as outlined in Ghana’s RPP. Though a number of institutions, NGOs and research organizations have worked on various components of REDD+ implementation, these experiences are only held within these organizations, with no available platform to assist projects proponents in responding to basic design and implementation questions. Furthermore, given that most project proponents of the selected pilot sites have no experience with REDD+ implementation, it is imperative to have a common platform to guide the start-up and implementation of REDD+ projects in Ghana.
Figure: According to the Ministry of Lands and Natural Resources (2012), the forest sector contributes about 6% to Ghana’s Gross Domestic Product (GDP), employs about 2.5 million people and exports wood products worth about $200 million annually. Nearly 60% of the total primary supply comes from biomass (woodfuel and charcoal). Like many tropical countries, there is evidence that the conditions of Ghana‘s forests has been in decline for many years, particularly
Page | 5
since the 1970s. Many forest reserves are heavily encroached and degraded, and the off-reserve stocks are being rapidly depleted. Habitats of plant and animal populations are becoming increasingly fragmented. There are also heightened concerns not only about the future of the timber industry but also about the future quality of the natural environment. Therefore mechanisms that are aimed at halting deforestation and forest degradation is an important priority for the country on a number of fronts, and the significant convergence between REDD+ and other aspects of environmental, social and economic policy strengthens the government‘s commitment to REDD+ strategy development (Ghana RPP, 2010).
1.2 SETTING THE CONTEXT There are many manuals and documents on the internet and other reference sources on REDD+ implementation, and many others relating to REDD+ issues in Ghana. But, in spite of the positive gains that have been made over the years, an operational framework to guide Ghana’s REDD+ strategy is still lacking.To date, though many institutions and organizations are interested in the implementation of REDD+, they lack the basic understanding of what it takes to set up a REDD+ project. Compounding this is the confusion of rolling out mitigation projects or projects that have co-benefits for climate change mitigation and a classical REDD+ project in the strict sense, that seeks to go to market. Basically, not all mitigation projects could be considered as REDD+, and project proponents need to know the difference between the design of a REDD+ project and any other forestry project. The overarching purpose of having a single document that could respond to the many design and implementation challenges of most REDD+ proponents is to reflect all the generic documents on REDD+ within the context of Ghana, based on the different ecological zones, diverse landuse and landcover systems, with its associated dynamics of agents and drivers of change. The operational guidance for subnational and national REDD+ is intended to inform the design, implementation, as well as monitoring and evaluation of Ghana’s REDD+ Program and activities at the national and subnational levels. The Guidance document provides background and context on the basic factors to consider in designing REDD+ projects, the inclusion of stakeholders in Ghana’s REDD+ implementation and activities, and outlines the operational procedure for the design and implementation of REDD+ activities at the subnational and national scale. The Guidance also provide best practice advice on how to consult with forest dependent communities and links to resources for further information. The Guidance is intended to be used by climate change practitioners, researchers, project developers, national government and civil society organisation who are involved in mitigation activities in the forest sector, particularly, REDD+.
Page | 6

1.3 SCOPE AND STRUCTURE OF THE REPORT This report is purely a guidance manual that draws from key documents and experiences of REDD+ intervention in Ghana. It has three sections, the introductory section sets the scene for the document in section one, followed by section two which focuses on REDD+ potentials in various landuse systems and ecological zones in Ghana. The final section, section three delves deeper into REDD+ project design and implementation.
Page | 7
SECTION TWO 2.1 IDENTIFICATION OF REDD+ STRATEGIES FOR DIFFERENT LANDUSE TYPES IN VARIOUS ECOLOGICAL ZONES IN GHANA. In decision 1/CP.13 of the Bali Action Plan, ‘Policy approaches and positive incentives on issues relating to reducing emissions from deforestation and forest degradation in developing countries; and the role of conservation, sustainable management of forests and enhancement of forest carbon stocks in developing countries’ was recognized as an enhanced national action on mitigating climate change, among others. Paragraph 70 of decision 1/CP.16 of the Cancun Agreement encourages developing countries to contribute to mitigation actions in the forestry sector by undertaking the following activities (UNFCCC, 2010): (a) reducing emissions from deforestation, (b) reducing emissions from forest degradation, (c) conservation of forest carbon stocks, (d) sustainable management of forests and (e) enhancement of forest carbon stocks. Based on the IPCC guidance on land use representations, the REDD+ activities can be broadly grouped into two main categories (as illustrated in figure 1):
(i) Land use change processes: there are two REDD+ activities that fall within land use change processes based on the fact that it ultimately results in persistent transfer of the initial land representation to another type. E.g. (a) Deforestation (e.g. from forest land (FL), to other land uses) and (b) enhancement of forest carbon stock (e.g. from other lands to FL).
(ii) Change processes within the same land category: there are four REDD+ activities that are not classified based on the land use change processes. They rather represent the changes that occur within the same land representation over a period. For example, FL remaining as FL. (a) degradation (e.g. from unexploited to exploited forest or from unmanaged forest to managed forest); (b) sustainable management of forest; (c) conservation of forest carbon stocks; and (d) enhancement of forest carbon stocks.
Page | 8
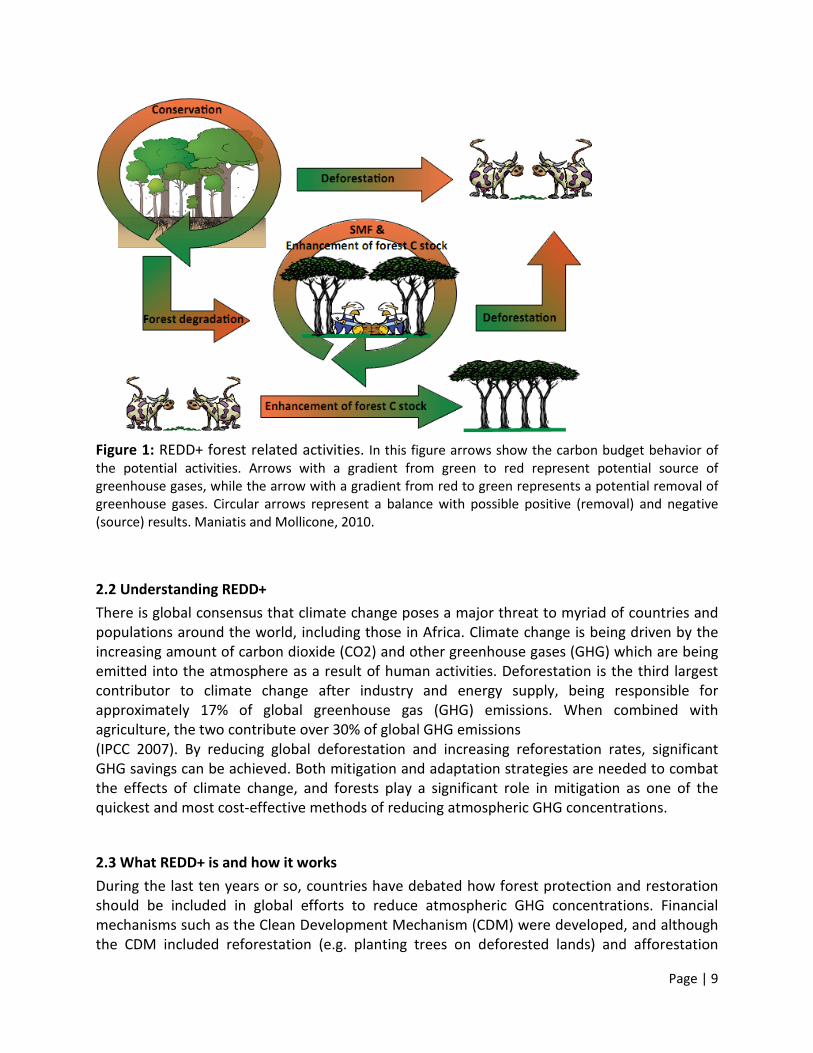
Figure 1: REDD+ forest related activities. In this figure arrows show the carbon budget behavior of the potential activities. Arrows with a gradient from green to red represent potential source of greenhouse gases, while the arrow with a gradient from red to green represents a potential removal of greenhouse gases. Circular arrows represent a balance with possible positive (removal) and negative (source) results. Maniatis and Mollicone, 2010.
2.2 Understanding REDD+ There is global consensus that climate change poses a major threat to myriad of countries and populations around the world, including those in Africa. Climate change is being driven by the increasing amount of carbon dioxide (CO2) and other greenhouse gases (GHG) which are being emitted into the atmosphere as a result of human activities. Deforestation is the third largest contributor to climate change after industry and energy supply, being responsible for approximately 17% of global greenhouse gas (GHG) emissions. When combined with agriculture, the two contribute over 30% of global GHG emissions (IPCC 2007). By reducing global deforestation and increasing reforestation rates, significant GHG savings can be achieved. Both mitigation and adaptation strategies are needed to combat the effects of climate change, and forests play a significant role in mitigation as one of the quickest and most cost-effective methods of reducing atmospheric GHG concentrations.
2.3 What REDD+ is and how it works During the last ten years or so, countries have debated how forest protection and restoration should be included in global efforts to reduce atmospheric GHG concentrations. Financial mechanisms such as the Clean Development Mechanism (CDM) were developed, and although the CDM included reforestation (e.g. planting trees on deforested lands) and afforestation
Page | 9
(planting trees on previously unforested land) it did not include the protection of standing forest. In 2007, the concept of REDD was introduced to the international climate change negotiations and still continues to evolve. In support of this strategy, the international community is in the process of designing a mechanism to incentivize forest-rich countries in the developing world to reduce the amount of deforestation and forest degradation that occurs within their national borders each year. This initiative is known as REDD+. It stands for Reducing Emissions from Deforestation and Forest Degradation (REDD), with the '+' representing the role of conservation, sustainable forest management and carbon stock enhancement. It represents a type of payment for ecosystem service (PES). REDD+ is a performance based mechanism that aims to create financial and other types of incentives to reduce the rate at which forests are being converted to other land-use types and in the process causing carbon dioxide emissions. Thus, REDD+ aims to reduce atmospheric GHG concentrations and contribute to climate change mitigation through five main non-exclusive sets of activities:
I. Reducing emissions from deforestation II. Reducing emissions from degradation
III. Reducing emissions through the role of conservation IV. Sustainable forest management and V. Enhancement of carbon stock.
Generally, the amount of emissions reductions or enhancements from the implementation of one or more of the five activities would be quantified based on a globally recognized methodology. That positive quantity would then be valued as credits that could be sold in an international carbon market. Alternatively the credit could be handed to an international fund set up to provide financial compensation to participating countries that conserve their forest.
2.4 What REDD+ is not Contrary to what many people assume, REDD+ is not a forest conservation project. It is not about community forestry or agroforestry in and of itself. Furthermore, REDD+ does not imply that countries or individual projects will receive upfront money to protect or conserve forest. Rather, it is about creating incentives to reduce the rates at which forests and trees are being lost (deforestation and degradation) or creating incentives to change the way that forests are managed so that additional CO₂ can be sequestered from the atmosphere (CSE or SFM). However, community-based activities, like increasing agricultural productivity, initiation of agroforestry schemes, or generation of revenue from non-timber forest products (NTFPs) are likely to be key activities in a broader emissions reduction or enhancements strategy.
REDD+ is different from traditional conservation or natural resource management projects in that the bulk payment will not be received until the emissions reduction (or sequestration) is demonstrated.
Page | 10

Previous forestry projects and programs were about drawing up a concept, seeking funding to support that concept and its program of action, and then reporting on the outcomes and impacts. To thecontrary, REDD+ is a performance based mechanism; payments are not received until a country orproject can demonstrate that carbon dioxide emissions from deforestation or degradation have beenreduced, or that carbon dioxide in the atmosphere has been sequestered through the growth offorests or trees. Since its acceptance in the international climate change negotiations, REDD+ has sparked dramatic and much needed changes in the way that governments, the private sector, civil society and international bodies think about the value of forests and how best to reduce associated threats. In this respect, REDD+ is a real game-changer. The reality, however, is that REDD+ demands a very high level of rigour and meeting the associated standards is likely to presents many challenges in Ghana. In addition, building a national framework or developing a project can be expensive and technically challenging. For these reasons, and others, REDD+ is not an appropriate or realistic strategy for every forest or agroforestry project, or private sector scheme. In truth, many valuable and important conservation projects or sustainable forest management initiatives are not viable for REDD+. Examples include:
• REDD+ cannot be implemented to support forest conservation where there is not a demonstrated rate of deforestation or degradation. For example, environmental stakeholders in Liberia explored whether it would be possible to generate money from a REDD+ project to support conservation of the Wonegizi Mountains. Unfortunately, due to the legacy of the war, the historical deforestation rate was well under 1%, and therefore the project could not realistically expect to generate enough emissions reductions to justify a project.
• REDD+ is not a viable mechanism where the value of the current exploitative land use (like mining) is far higher than the value of the standing forest and potential REDD+ benefits.
• Small-scale community tree planting or agroforestry projects are not appropriate for REDD+ if they do not demonstrate an actual change in the business as usual scenario, and if substantialemissions reductions or removals cannot be demonstrated.
2.4 Ecological zones in Ghana and associated dominant Land use Systems
Different studies have used various approaches to construct the spatial structure of Ghana’s landscape to the extent possible. This part of the report summarises the major highlights of two major approaches as the basis for the analysis of REDD+ potential in the off reserves areas in the country. The two approaches are based on (a) ecological distinctiveness of Ghana’s landscape (b) IPCC land representations (climate change forest definition).
Page | 11

2.6 Landscape profile based on ecological distinctiveness There are nine ecological zones in Ghana (Hall and Swaine, 1981), as shown in figure 2. However, for the purposes of this study, the classification has been regrouped into three vegetation zones; (a) high forest zone (HFZ), (b) transitional zone and (c) the savannah zone. This reclassification has been done based on the likelihood that Ghana might consider developing different forest reference scenarios for these three zones giving their distinct landscape characteristics. The savannah zone, which includes parts of the transition zone covers two-thirds of the country (15.6 million ha) and extend from the middle to northern part of the country. The remaining southern part (8.2 million ha) is covered by the HFZ. Much of the remaining forests and the commercial volumes of timber resources are located in the HFZ (GFC, 2002). Within the HFZ, there are 216 state-managed forest reserves with a total area of 1.7 million ha. In effect, almost a fifth of the total area of the HFZ is designated as forest reserves.
Figure 2: Ecological zone classification of Ghana.
The size of the forests outside the reserves in the HFZ is estimated to be about 400,000 ha spread across an area of 5 million ha (Abebrese, 2002; Kotey et al., 1998). It is in these off-reserve forests that much of the uncontrolled timber harvesting and deforestation that occurred in the past is taking place. The off-reserve forests are largely located on communally or privately owned-lands and therefore not subject to the strict control or jurisdiction of the state nor is there a land-use plan for the off-reserves either. The decision to put the communal or privately owned lands to any use is largely influenced by either economic gain or social considerations. Off-reserve landowners effectively have the right to do whatever they choose
Page | 12

with their land i.e. whether to clear it for farming, grazing, settlements or for any other purpose. The only right they don’t have is to commercially exploit timber resources on their land. Only the state has the authority to issue permits for the harvesting of timber subject to the consent of the landowners (Osafo, 2005). It is estimated that between 1960 and 1994 an enormous amount of timber was harvested from off-reserve areas (Kotey et al., 1998). As a result, what remains of these off-reserve forests are patches of forests in the form of scattered trees on agricultural fields, secondary forests regenerating from farming, riparian forest strips along streams, sacred groves and some closed-canopy forests (Kotey et al., 1998).
Table 1: Area coverage of High Forest and Savannah zones
Vegetation Zones Area (ha) High Forest Zone Wet Evergreen 657,000 Moist Evergreen 1,777,000 Upland Evergreen 29,200 Moist Semi-deciduous 3,318,000 Dry Semi-deciduous 2,144,000 Southern Marginal 236,000 Southeast Outlier 2,000 Total High Forest 8,163,200 Savanna Zone Tall-grass Savanna 14,694,800 Short-grass Savanna 1,000,000 Total savanna 15,694,800
Sources: FAO, 1998; MES, 2002.
Figure 3 shows the forest reserves and protected areas in Ghana. Basically, the white areas are the off reserve areas, and thus, the area of interest in this document. However, these areas are not necessarily forest but a mosaic of different land uses.
Page | 13

Figure 3: Forest reserves and protected areas in Ghana. Source: Forest Preservation Project/FC/2012.
2.7 Landscape profile based on IPCC land representations (forest definition) Based on IPCC (2003) GPG for LULUCF accounting, there are six land representations for the estimation of anthropogenic GHG emissions by source and removals by sinks. These six representations are consistent with measures to ensure simplicity and reduce cost of forest monitoring. Thus in REDD+ accounting, one of the overriding factors is the changes in carbon stocks, though there could be ecological and structural differences between forest types or different landuse classes, what matters most is the differences in the carbon stocks. Therefore the six landuse classes are;
• Forest Land (FL): This includes all land with woody vegetation consistent with the
thresholds of the national forest definition. It also includes land use types with a vegetation structure that currently fall below, but in situ could potentially reach the proposed national values used to define the forest land category in Ghana, i.e.;
Minimum mapping unit (MMU) is 1.0 ha
Minimum crown cover is 15 %
Potential to reach minimum height at maturity (in situ) as 5 m
• Cropland (CL): This consists of crop land (currently cropped or in fallow), including rice fields, and agro-forestry systems where the vegetation structure falls below the thresholds used for the forest land category. This includes land where over 50% of any defined area is used for agriculture.
Page | 14

• Grassland (GL): This comprises rangelands and pasture lands that are not considered cropland as well as herbs and brushes that fall below the threshold values used in the forest land category such as the other wooded land following the definition in Ghana:
Canopy Cover < 15 %,
height > 5 m,
MMU > 1 ha
• Wetlands: These include areas of peat extraction and land that is covered or saturated by water for all or part of the year (e.g., swamp forests and mangroves) and that does not fall into the forest land, cropland, grassland or settlements categories. It also includes reservoirs as a managed sub-division and natural rivers and lakes as unmanaged sub-divisions.
• Settlements: These consist of all developed land, including transportation infrastructure and human settlements of any size, unless they are already included under other categories.
• Other land: This category includes bare soil, rock, ice, and all land areas that do not fall into any of the other five categories.
Figure 4:Landuse classifications in Ghana for 2010. Source: Forest Preservation Project/FC/2012.
Although this classification is largley coarse because of the wall-to-wall approach, it fairly represents the wide range of various land representations in Ghana. There are a number of
Page | 15
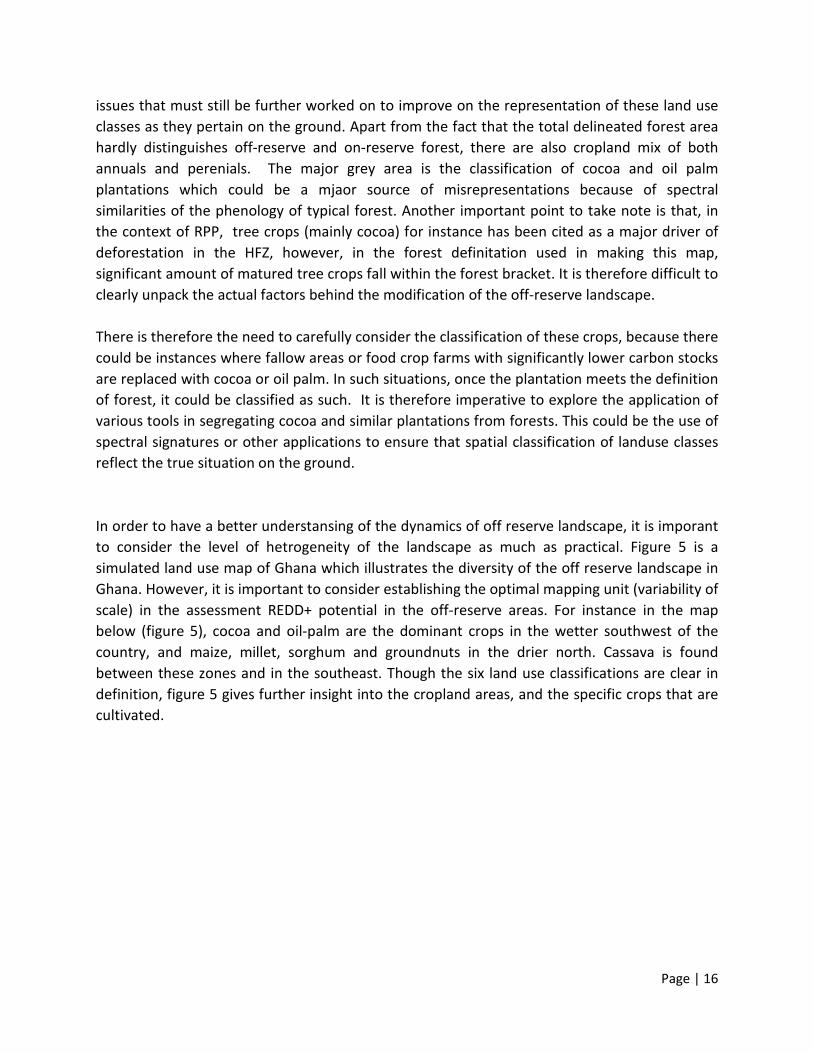
issues that must still be further worked on to improve on the representation of these land use classes as they pertain on the ground. Apart from the fact that the total delineated forest area hardly distinguishes off-reserve and on-reserve forest, there are also cropland mix of both annuals and perenials. The major grey area is the classification of cocoa and oil palm plantations which could be a mjaor source of misrepresentations because of spectral similarities of the phenology of typical forest. Another important point to take note is that, in the context of RPP, tree crops (mainly cocoa) for instance has been cited as a major driver of deforestation in the HFZ, however, in the forest definitation used in making this map, significant amount of matured tree crops fall within the forest bracket. It is therefore difficult to clearly unpack the actual factors behind the modification of the off-reserve landscape. There is therefore the need to carefully consider the classification of these crops, because there could be instances where fallow areas or food crop farms with significantly lower carbon stocks are replaced with cocoa or oil palm. In such situations, once the plantation meets the definition of forest, it could be classified as such. It is therefore imperative to explore the application of various tools in segregating cocoa and similar plantations from forests. This could be the use of spectral signatures or other applications to ensure that spatial classification of landuse classes reflect the true situation on the ground. In order to have a better understansing of the dynamics of off reserve landscape, it is imporant to consider the level of hetrogeneity of the landscape as much as practical. Figure 5 is a simulated land use map of Ghana which illustrates the diversity of the off reserve landscape in Ghana. However, it is important to consider establishing the optimal mapping unit (variability of scale) in the assessment REDD+ potential in the off-reserve areas. For instance in the map below (figure 5), cocoa and oil-palm are the dominant crops in the wetter southwest of the country, and maize, millet, sorghum and groundnuts in the drier north. Cassava is found between these zones and in the southeast. Though the six land use classifications are clear in definition, figure 5 gives further insight into the cropland areas, and the specific crops that are cultivated.
Page | 16

Figure 5: Simulated landuse map of Ghana. Source FAO, 2004.
With regard to forest areas, there is significant variation in forest classes based on canopy cover (Figure 6). The forest reserves are in better conditions than forests in the off-reserve areas. Whilst most forest reserves still have closed forest with 65% or more canopy cover, in the off-reserve areas canopy cover does not exceed 65%.
Figure 6: Forest land classes in Ghana based on canopy cover. Source: Forest Preservation Project/FC/2012.
Page | 17

2.8 Criteria or factors determining potential REDD+ project types
This section discusses the key criteria or factors identified to be determining potential REDD+ project types. Drawing on the relevant concepts and debate in the REDD+ arena, six factors (as a minimum) have been identified to be the key determinants of potential REDD+ project types: carbon stocks, co-benefits, constraints/integrity, drivers or agents of deforestation, additionality and other cross-cutting issues.
2.9 Identification of Criteria or factors The major criteria determining the viability of REDD+ interventions in off-reserve areas have been broadly grouped into social, biophysical and REDD+ related concepts. Table 2 presents the major criteria for REDD+ project consideration in off-reserve areas.
Table 2: Criteria determining REDD+ projects in off-reserves areas in Ghana
A. Social criteria Forest governance and harmonization of sectoral laws Law enforcement Collaboration with stakeholder institutions including traditional authorities and local people B. Biophysical criteria Baseline carbon stocks Drivers, agents and underlying factors of deforestation and degradation Sustainable forest monitoring C. REDD+ related criteria Co-benefits Constraints and integrity of REDD+ projects Additionality Applicability of REDD+ methodologies Safeguards and land use right Permanence and risks Leakage Project boundary
Page | 18

2.10 Biophysical criteria
2.10.1 Baseline carbon stocks Carbon stocks in different land use types give a good idea about the potential emissions due to anthropogenic activities in the baseline scenario. In addition, it also help understand land use change dynamics and contributes to the decision making process in project phase interventions that can be used to address the emissions. This provides an opportunity to also ascertain the amount of emission reductions or removals potentials that could be achieved in a given area over a period. For example, the carbon stocks in a unit area of an intact forest in the HFZ are higher than that of the savannah zone. This information gives a clear idea about the extent of emissions associated with anthropogenic activities in these ecological zones, including removals that could be achieved. Thus, these processes are important first steps in assessing the feasibility of a project and possible next steps towards project development. Figure 6 illustrates a snapshot of biomass stocks in different landuse systems in Ghana as of 2012. The map shows an obvious difference in carbon stocks in the savannah, transitional and high forest zones. It is instructive to note that, though the savannah areas have relatively low carbon stocks, it constitutes about two-thirds of the total forest area of Ghana. Thus there is the possibility that the lower carbon stocks will be compensated for by the land area, which could amount to an enormous carbon build up. Within the high forest zone, the difference between the biomass found in forest reserves and protected areas, and the biomass in off-reserve areas dominated by agriculture and tree crops is clearly evident. Even though the high forest zone has the highest overall biomass, the biomass in forest reserves ranges (making up approximately 20% of the high forest zone) from 225-400 Mg/ha, although the uncertainty is also quite high (± 70 to 80 Mg/ha). The remaining 80%, which falls within the “off-reserve” area of the high forest zone contains biomass ranging from 125 to 225 Mg/ha (± 70-80 Mg/ha). What the map (figure 7) also reveals is that in the high forest zone, biomass declines as one progress farther outside of protected areas. Thus, there are clear bands or buffers surrounding the forest reserves and protected areas that has higher biomass (225-250 Mg/ha) than the rest of the agricultural landscape and other landuse types in the off-reserve areas. This indicates that over the past century, with the expansion of agriculture, deforestation and degradation have contributed to a significant reduction in off reserve carbon stocks (Asare et al., 2012).
Page | 19

Figure 7: Aboveground biomass distribution in Ghana. Source: Asare et al., 2012.
Based on the landuse dynamics of the ecological zone or project area, it is important to consider which carbon pool(s) will be affected by anthropogenic activities, and thus offers a good opportunity for emission reductions. There are six carbon pools in LULUCF accounting, however, not all pools may be applicable in a REDD+ project. Table 3 shows the various carbon pools and their relative contribution to ecosystem carbon stocks.
Table 3:Carbon pools and their relative contribution to ecosystem carbon stocks in tropical forests
Page | 20
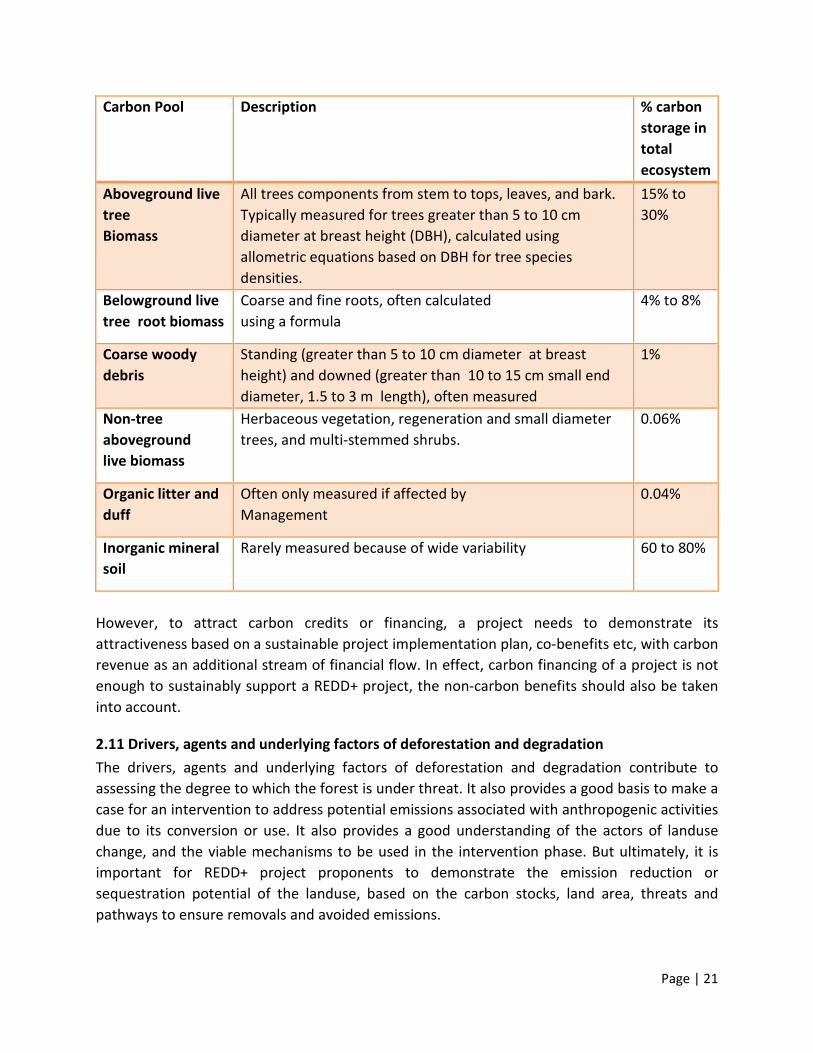
Carbon Pool Description % carbon storage in total ecosystem
Aboveground live tree Biomass
All trees components from stem to tops, leaves, and bark. Typically measured for trees greater than 5 to 10 cm diameter at breast height (DBH), calculated using allometric equations based on DBH for tree species densities.
15% to 30%
Belowground live tree root biomass
Coarse and fine roots, often calculated using a formula
4% to 8%
Coarse woody debris
Standing (greater than 5 to 10 cm diameter at breast height) and downed (greater than 10 to 15 cm small end diameter, 1.5 to 3 m length), often measured
1%
Non-tree aboveground live biomass
Herbaceous vegetation, regeneration and small diameter trees, and multi-stemmed shrubs.
0.06%
Organic litter and duff
Often only measured if affected by Management
0.04%
Inorganic mineral soil
Rarely measured because of wide variability 60 to 80%
However, to attract carbon credits or financing, a project needs to demonstrate its attractiveness based on a sustainable project implementation plan, co-benefits etc, with carbon revenue as an additional stream of financial flow. In effect, carbon financing of a project is not enough to sustainably support a REDD+ project, the non-carbon benefits should also be taken into account.
2.11 Drivers, agents and underlying factors of deforestation and degradation The drivers, agents and underlying factors of deforestation and degradation contribute to assessing the degree to which the forest is under threat. It also provides a good basis to make a case for an intervention to address potential emissions associated with anthropogenic activities due to its conversion or use. It also provides a good understanding of the actors of landuse change, and the viable mechanisms to be used in the intervention phase. But ultimately, it is important for REDD+ project proponents to demonstrate the emission reduction or sequestration potential of the landuse, based on the carbon stocks, land area, threats and pathways to ensure removals and avoided emissions.
Page | 21

Studies have concluded that the greatest potential for reducing Ghana’s GHG emissions and expanding its carbon sinks lies in the forestry and land-use change sectors (Ghana NatComm, 2000). This potential lies in reducing the deforestation rate in the off-reserve areas where much of the uncontrolled deforestation predominantly caused by “slash and burn” agriculture occurs. This is because farming in Ghana is traditional in the sense that it is small-scale and subsistence in nature, rain-fed and typically done with pick axes, hoes and cutlasses. It is therefore not mechanized nor is the use of modern inputs widespread or intensive as most farmers lack the capital to afford these products. As a result methods of farming are labour-intensive and land-extensive (Abagale et al., 2003; Abebrese, 2002; Gillet, 2002). This expansive trend has been responsible, in significant part, for the conversion of Ghana’s forests – at least a third of Ghana’s tropical high forest cover has disappeared in the past 20 years. As a result, very little forest remains in the off-reserve landscape (Hansen, et al. 2009).
With the rate of population growth exceeding that of food production (Asare, 2004 cited in Osafo, 2005), and the government supporting efforts to increase cash crop production, fallow periods are increasingly being shortened and agricultural lands are expanding at a rate of 9 percent every couple of years (Agyarko, 2001). This has progressed to such an extent that the state forestry authority, the Ghana Forestry Commission has been forced to issue permits to timber companies to salvage trees on farmlands which would otherwise have been destroyed by the farmers (Bamfo, 2005). Farmers are also unwilling to maintain trees on their land because of the damage caused to their farms from timber harvesting operations and the lack of adequate compensation payments for such damage. Farmers rather team up with chainsaw operators to illegally harvest trees for timber (Abagale et al., 2003; Glastra, 1999). Without economic incentives to convince farmers to conserve the remaining forests, practice agroforestry and/or enable the regeneration of forests, Ghana’s deforestation rate and emissions will continue to increase.
Ghana‘s R-PIN gives an approximate estimation of the relative importance of the various drivers as: agricultural expansion [c.50%]; harvesting of wood [c. 35%]; population & development pressures [c. 10%]; mineral exploitation and mining [c. 5%]. (Ghana RPP, 2010). The underlying causes are those typical of degradation in the more heavily populated countries of the tropics, and involve a complex of demographic, economic and policy influences. The immediate drivers include: forest industry over-capacity; policy/market failures in the timber sector; burgeoning population in both rural and urban areas, which increases local demand for agricultural and wood products; high demand for wood and forest products on the international market; heavy dependence on charcoal and wood fuel for rural and urban energy; limited technology development in farming systems, and continued reliance on cyclical “slash and burn” methods to maintain soil fertility.
Furthermore, the prominence of one forest crop in the national economy (cocoa), and recent changes in shade regimes (from shade to full-sun systems), have also exerted a major influence on trends in forest cover. Mining (industrial and artisanal/small scale) is a concern in some
Page | 22

areas, as is oil palm cultivation and the use of fire in livestock management. Figure 9, shows the deforestation risk map as of 2012. It is very clear that the high forest zone is under the greatest threat1 (based on 3 risk factors; road, settlement and slope), and these areas are basically the off reserve forest. This threat of deforestation is confirmed by figure 10. From the historical deforestation perspective (figure 10), though the HFZ is undergoing a much rapid landuse change, it is quite clear that the savannah and transitional areas are not insulated. However, as much as figure 9 gives some indication about the future threats to forested areas, it would have been much helpful if the projections had been based on much more additional and realistic parameters such as population, government policies and interventions etc.
Figure 8: Deforestation risk map of Ghana. Source Forest Preservation project/FC/2012
1 It should be emphasized that the off-reserve areas in the HFZ also include cocoa farms and other tree crops, which were classified as forests. From a realistic point of view, it would take more than risk factors such as road, settlement and slope to convert cocoa and other tree/cash crops to other landuse.
Page | 23
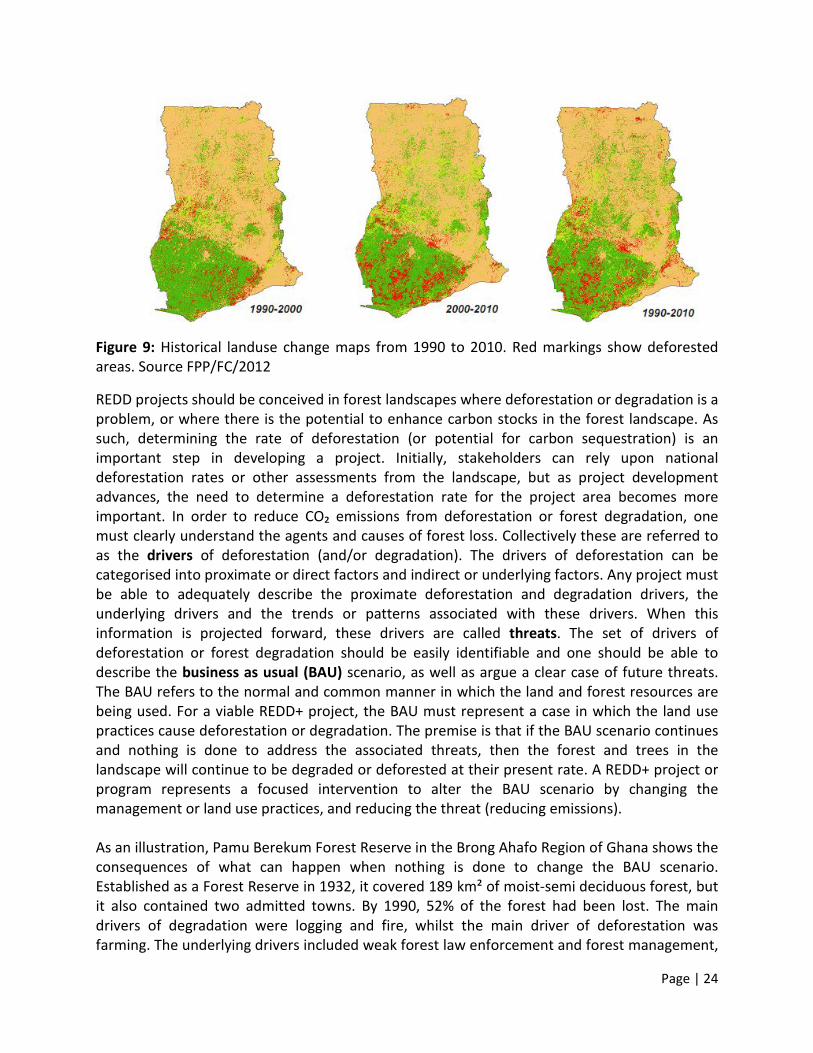
Figure 9: Historical landuse change maps from 1990 to 2010. Red markings show deforested areas. Source FPP/FC/2012
REDD projects should be conceived in forest landscapes where deforestation or degradation is a problem, or where there is the potential to enhance carbon stocks in the forest landscape. As such, determining the rate of deforestation (or potential for carbon sequestration) is an important step in developing a project. Initially, stakeholders can rely upon national deforestation rates or other assessments from the landscape, but as project development advances, the need to determine a deforestation rate for the project area becomes more important. In order to reduce CO₂ emissions from deforestation or forest degradation, one must clearly understand the agents and causes of forest loss. Collectively these are referred to as the drivers of deforestation (and/or degradation). The drivers of deforestation can be categorised into proximate or direct factors and indirect or underlying factors. Any project must be able to adequately describe the proximate deforestation and degradation drivers, the underlying drivers and the trends or patterns associated with these drivers. When this information is projected forward, these drivers are called threats. The set of drivers of deforestation or forest degradation should be easily identifiable and one should be able to describe the business as usual (BAU) scenario, as well as argue a clear case of future threats. The BAU refers to the normal and common manner in which the land and forest resources are being used. For a viable REDD+ project, the BAU must represent a case in which the land use practices cause deforestation or degradation. The premise is that if the BAU scenario continues and nothing is done to address the associated threats, then the forest and trees in the landscape will continue to be degraded or deforested at their present rate. A REDD+ project or program represents a focused intervention to alter the BAU scenario by changing the management or land use practices, and reducing the threat (reducing emissions). As an illustration, Pamu Berekum Forest Reserve in the Brong Ahafo Region of Ghana shows the consequences of what can happen when nothing is done to change the BAU scenario. Established as a Forest Reserve in 1932, it covered 189 km² of moist-semi deciduous forest, but it also contained two admitted towns. By 1990, 52% of the forest had been lost. The main drivers of degradation were logging and fire, whilst the main driver of deforestation was farming. The underlying drivers included weak forest law enforcement and forest management,
Page | 24
a perverse policy environment, and development objectives (in the admitted towns) that conflicted with the forest management goals. If, at the time, concerted action has been taken to change the BAU scenario by focusing efforts to stop illegal encroachment, curb the spread of fire, and address the policy conflicts and lack of forest governance, then half of the forest could have been saved. This did not occur and as a result, by the year 2000, only 1 km² of forest remained. Interviews with key informants, focus group discussions, field-based assessments of the landscape, and the use of historic and current land use/land cover maps are the best ways to identify and verify drivers and threats. What can be more challenging, however, is identifying the underlying drivers and threats which are often at the root of the problem. For example, while the expansion of small-holder agriculture is a dominant driver of forest degradation (and over the long-term of deforestation) in Ghana, the story behind this driver is often much more complex. It is therefore crucial to understand who the agents of deforestation are (are they local farmers or migrant farmers from other areas of the country), what their motivations might be (seeking land for subsistence crops or economic crops like cocoa or cashew), and who or what lies behind their choices (who is the landowner and what are the sharecropping conditions). For instance, is a person or a policy, even with the best of intentions, creating incentives that cause the activities? Given the complexity of separate legal provisions for tree and land tenure, one must ask what the role of the chief is and the type of support, either formal or informal, that the farmer might be receiving from other agricultural development projects. Understanding the full story is critical to being able to reduce the threat and change the way that the land is being used. At the national scale, Ghana’s REDD readiness preparation proposal (R-PP) cites the main drivers that are responsible for decades of gradual degradation and eventual deforestation; four are direct drivers, while four are underlying drivers.
Page | 25

Box 1 Proximate/direct causes: human activities or immediate actions that directly impact forest cover and loss of carbon Example: Agriculture expansion (cocoa expansion), illegal chainsaw logging, firewood extraction Underlying/indirect causes: complex interactions of fundamental social, economic, political, cultural and technological processes that are often distant from their area of impact. -International (i.e. markets, commodity prices), national (i.e. population growth, domestic markets, national policies, governance) and local circumstances (i.e. change in household behavior)
Source: Kissinger et al., 2012.
Page | 26
2.12 REDD+ Related criteria
2.12.1 Co-benefits In every REDD+ project, the prime objective is to ensure removal of GHGs by sinks and also avoid emissions by sources. This entails the implementation of specific activities and programs such as forest monitoring, social and environmental safeguards, enforcement of laws and good forest governance practices, sustainable rural energy supply associated with the use of improved cook stoves and woodlot systems, sustainable agricultural intensification etc. Invariably, a successful implementation of these activities trigger ancillary benefits that come with preserving terrestrial ecosystems e.g. erosion and desertification control, improved health (associated with reduced exposure to indoor air pollutants through the use of improved cook stoves), protecting watersheds (purification, prevention of pollution and flood protection), biodiversity and wildlife, including ecotourism and rain making benefits. These are also referred to as non-carbon values or benefits. Though co-benefits are not targeted outputs of REDD+ projects, they offer additional benefits and incentives which ultimately build into the intended livelihood improvements and ecosystem sustainability of the project. For instance most buyers in the voluntary market are willing to pay premiums for projects with demonstrable co-benefits, which could serve as additional avenues for financial flow through the REDD+ project. Hence co-benefits are important requirements which improve the attractiveness of the project. Figure 8 shows an example of how REDD+ project activities could trigger direct and indirect biodiversity co-benefits. However from the illustration in figure 8, it is obvious that REDD+ projects could also result in negative implications for co-benefits. There is therefore the need for careful planning and implementation of REDD+ activities, with particular emphasis on safeguards and adherence to project methodologies and standards.
Page | 27

Figure 10: Major opportunities and risks for biodiversity benefits of REDD+. Source UNREDD.
2.12.2 Constraints/integrity
Like every forestry project, REDD+ projects have factors that limit the attainment of the desired outcome. These factors could also affect the integrity of the project as a mitigation activity in the forestry sector. It is therefore important to consider specific factors and activities that could affect the successful implementation of the project. A major constraint in Ghana that could seriously hinder the successful implementation of a REDD+ program in off reserve areas is land tenure and disputes associated with land ownership. This is particularly true for most off reserve areas in Ghana, and has implications for carbon rights, benefit sharing regime, project intervention strategies and sustainability of the REDD+ project. This could possibly be the reasons why many REDD+ project proponents are considering on-reserve sites.
Most off reserve land holdings are fragmented under different ownership and tenure regimes, and are under smallholder agriculture. Given the fact that a viable REDD+ project should cover hundreds to thousands of hectares (sometimes not in a contiguous manner), depending on the methodology being applied, it is important that serious attention is paid to tenure and land management rights. Disregarding secured tenure, limits the scope and potential of REDD+, places forest based people at risk, and may engender such opposition that can guarantee failure of the REDD+ project (Larson and Petkova, 2011). The permanence of the project is also an important constraining factor that could affect the integrity of the project. Permanence refers to how robust a project is to potential changes that could reverse the carbon benefits of the project at a future date. Although all sectors have the potential for impermanence, forest carbon projects face particular scrutiny due to a perceived risk that poor management, fire,
Page | 28

pests, changes in government policy or political power etc. can lead to the destruction of forest and the subsequent release of emissions. Various strategies can be used to avoid and safeguard against the risk of impermanence. First and foremost, it is important that all stakeholder interests (government, local communities, private sector, etc.) are aligned with the long-term project objectives. Specific approaches, such as the land sparing and sharing, creation of protected areas, community development, establishment of endowments for project management and monitoring, and the use of carbon buffers can also help ensure permanence. Ultimately, strategies must be tailored to the particular project site and situation. But in the Ghanaian context, fire is an extremely important consideration, especially in the savannah and transitional areas, including parts of the HFZ. Other constraining factors are the capacity of the management team, financial viability, opportunity costs and associated pressures of alternative land uses, and project longevity based on legal agreements or requirements.
2.12.3 Additionality The fundamental challenge for REDD+ mechanisms is to demonstrate “additionality.” Additionality is simply defined for REDD+ as “carbon emission reductions and/or increased removals that are additional to what would have occurred without the REDD+ mechanism” (Cortez and Stephen, 2009). In order to provide real climate change mitigation, emission reductions financed through carbon markets must be additional. To be additional, nations or projects claiming REDD+ credits must show that reduced deforestation rates or increased sequestration rates attributed to the project would not have occurred in the absence of carbon finance.
Additionality of carbon benefits, i.e. the fact that they would not have been created in the absence of carbon finance, is at the heart of carbon offsets. The standard approach of demonstrating additionality has been developed under the CDM and is used in virtually the same form by the VCS. Two basic principles exist, and project activities are seen as additional either if they would have been financially less attractive than a realistic alternative (financial additionality), or if they would have faced insurmountable barriers that would have prevented their implementation under normal circumstances. A project can also be ‘first of its kind’, meaning that no precedence exists that would have paved the way for a comparable undertaking in the particular region or industry (Cortez and Stephen, 2009). In the Ghanaian context, incorporation of shade trees in cocoa farms could be a typical example of a project that exhibits additionality. Under this circumstance, it is known and actually recommended that optimal shade trees are needed in a cocoa agroforestry system to ensure sustained productivity. In an era where declining rainfall and temperature increases are seriously impacting on agriculture, the inclusion of shade trees in cocoa systems cannot be overemphasized. However, cocoa farmers are not adopting the recommended shade levels due to a complex interaction of forest governance issues, lack of extension etc. Hence the incorporation of shade trees in a REDD+ intervention project is additional and could result in improved mitigation within the cocoa landscape. Also, though forest reserves are gazetted
Page | 29

areas that must be observed only for forest use, with laws and institutions backing its protection, there is evidence that the current operational regime for forest reserve protection has not been adequate to averse deforestation and degradation. Hence REDD+ interventions could be put in place to overcome insurmountable challenges that are preventing sustainable management of forest reserves in Ghana. This context is also additional, once it can be proven.
2.12.4 Boundaries While this might seem like a simple task, deciding what is “in” and what is “out” can present challenges and often has implications on the ultimate viability of the project. Boundaries can be drawn according to natural boundaries (rivers), built boundaries (roads) social units (traditional area boundaries) or management units (forest reserve, district boundary). Regardless of the type of boundary, the rationale for where the boundaries are drawn should be clear and consideration should be given to potential tensions or conflicts associated with a boundary, and what falls inside and what is left outside. Depending on the size of the area, a sober assessment as to whether there is sufficient capacity and resources to implement the project activities across the project area (and often times beyond) and within the set time-frame set is also necessary. The size or scale of a project is crucial. In Ghana, estimated deforestation rates (approximately 2%/annum) and carbon stocks suggest that a project which falls within the high forest zone should cover at least 35,000-50,000 hectares. From an economic standpoint, based on potential carbon revenue, a smaller project of 5,000 to even 20,000 ha is simply not viable. Consideration should also be given to the size and rate of change of the population in the project area and outside the project area. Important questions to consider with respect to project boundaries include:
• What is the rationale for these boundaries? • Do the selected boundaries reflect the social and institutional boundaries within the
landscape? • How will differences between the project boundaries and other boundaries (traditional
area, administrative, management) be dealt with? • Does the project have sufficient capacity and resource to manage activities within the
project area?
2.12.5 Leakage Leakage describes a scenario where the deforestation or degradation that the project is trying to reduce is simply shifted outside of the project boundaries. Leakage is defined as the net change in anthropogenic emissions occurring outside the project boundary which is measurable and attributable to the project activity. Leakage most typically occurs when a project minimizes the occurrence of negative practices in the project area, but instead of stopping them altogether, the agents simply shift their practices elsewhere. There are 3 main aspects of leakage:
1. It must be measurable 2. It must be attributable to project implementation 3. It must show an increase in emissions when compared to the project baseline.Most projects are
developed with a core zone or project area, which is surrounded by a reference area that is
Page | 30

monitored as a leakage belt. Figure 2 shows a scenario where a project was implemented to slow deforestation, but instead of slowing the rate, it simply pushed the deforestation outside the project boundaries but within the reference zone.
2.12.6 Permanence REDD+ projects are designed to last for 20 to 30 years, and implicit in the concept of the project is that the carbon asset—the forest or trees—will remain in the landscape and the deforestation rate will be reduced. This is a much longer time-span than typical conservation or development projects (4 year project cycle) or even government programs (5 years), and as such there are a number of risks to the permanence of the trees, forest, and carbon in the landscape. A REDD+ project must be designed to ensure that emissions reductions will persist over the life of the project, and that the associated carbon assets are permanent. Important questions include:
• Will the forest or trees be there in 20-30 years’ time? • Will the implemented activities actually reduce the rate of deforestation? • Will these activities be adopted and maintained over the life of the project?
Each project must describe how permanence of the carbon assets will be achieved. In truth, no project is risk free and there is not an absolute guarantee of permanence. Nonetheless, projects need to honestly assess what they can control and what is beyond the project’s control. To do this means conducting a risk assessment and describing the real internal, external, and natural risks, and then outlining how the project plans to mitigate these risks.
It is essential to understand what level of risk there is so that the carbon benefits of the project can be adjusted accordingly. For the purposes of a feasibility assessment a 20% deduction in carbon benefits should be made for non-permanence risk.
Page | 31

INTERNAL RISKS EXTERNAL RISKS NATURAL RISKS
Poor project management Political instability Fire
Project not financially feasible
Corruption Drought
Opportunity costs Changes in the market Pest & Disease
Social conflicts Insecure tenure Seedling mortality
Livelihood constraints Geologic Events Loss of personnel or community
leaders Extreme weather
2.12.7 Other cross-cutting issues Aside the above mentioned factors, there are other cross-cutting issues such as governance and harmonisation of sectoral laws (because the off-reserve area is comprised of a mosaic landuse with sometimes competing interests), law enforcement, applicability of REDD+ methodologies, safeguards, decentralising the implementation of the national REDD+ strategy through collaboration with stakeholder institutions (including traditional authorities and local people) and synergy building, landuse rights and sustainable forest monitoring challenges. Governance refers to “the setting, application and enforcement or non-enforcement of regime rules” (Kjaer 2004). This includes inadequate sensitization and enforcement of forest laws and policies, including non - enforcement of rules protecting local communities ’ rights. Governance issues are critical building blocks of any REDD+ project, and could be localized, depending on the extent of the utilization and pressure on the resource. For instance, issues concerning off-reserve trees management and exploitation are totally different in the HFZ as compared to the savannah zone, basically because of the economic plays of cash crops in the HFZ. As such, reforming the tree tenure regime is widely viewed as a necessary precondition for reinvigorating the off-reserve stock, so are mechanisms to improve multi-stakeholder dialogue and decision making. A simple analysis of threats and decision-making under three hypothetical carbon-rights scenarios shows that when carbon rights are allocated according to the real drivers of deforestation and decision-making, the permanence risk is much less than when carbon rights are tied to economic tree rights or to land ownership and land tenure (Asare, 2010). This also dovetails into issues of landuse rights and the role of migrants in land utilization
Page | 32

and decision making. Thus, the fact that someone owns a land does not necessarily make him an agent of emissions.
Also, for an area to be viable for REDD+ implementation, and be able to gain certified emission reductions (CER) in the carbon market, an applicable standard and methodology should be selected. This is a very complex exercise that involves a careful examination of the landuse dynamics and drivers, opportunity cost, as well as viable options for emission reductions, which fits into the overall feasibility of the project. For instance an area under consideration for a proposed REDD+ project can have a strong case to avoid emissions based on threats to forests etc., but if the communities are unwilling to subject themselves to the project phase interventions, there cannot be a REDD+ project. In effect it is not just enough for an area to have an emission reduction potential based on a few set of criteria, but a holistic analysis of the terrain is required, which includes several combination of factors and adequate satisfaction of the requirements of the chosen standard and methodology. This also means that the area under consideration and the project proponents should have adequate options for safeguards to ensure that negative impacts (social and environmental) of the project can be mitigated and positive impacts enhanced.
2.13 Classification of potential REDD+ project types in forest reserves and off-reserve landscapes
2.13.1 Assessment of different land use types/systems There are five emission reductions and removal enhancement activities that can be implemented under a REDD+ strategy. These are;
i. Avoided deforestation (planned and unplanned), eg halting the rate of secondary forest conversion.
ii. Avoided degradation (planned and unplanned), eg avoiding authorised logging in sacred grooves and relic forests.
iii. Sustainable forest management,
iv. Forest carbon stocks enhancement, eg agroforestry interventions, especially the use of shade trees, management of natural regeneration leading to secondary forest formation
v. Conservation of forest carbon stocks, eg management of sacred groves, dedicated forests and gallery forests.
Page | 33

There are also options for combining strategies to create a particular methodology, for instance, a methodology for carbon accounting in project activities that reduce emissions from mosaic deforestation and degradation. Depending on the landuse dynamics and the interrelationships among the driving factors, etc., a particular standard and methodology can be selected or developed. But it is noteworthy that developing a new methodology under a given standard is quite expensive, and should be a final option. Hence serious considerations should be given to modalities to adapt an existing methodology for a proposed project.
The forest reserve areas are one of the most straight forward landscapes in Ghana. Land tenure is clear, it is mostly forest land, with known drivers and agents of deforestation and degradation. Nevertheless, the off-reserve areas in Ghana are characterized by diverse landuses and drivers of landuse change including landuse rights, land and tree tenure as well as conflicting stakeholder interests. Therefore the potential for REDD+ project types in off-reserve areas require a careful analysis of the criteria above and other requirements to ensure project feasibility. Thus, to ensure major impacts, such a project should be always looked at from the landscape perspective to make it more viable. This could comprise an integrated project on forests under various canopy closeness or woodlands and croplands.
However, it is also important to note that REDD+ projects could be rolled out in different forms. Though the classical intention for the establishment of the REDD+ mechanism is to create an incentive for developing countries to protect, better manage and wisely use their forest resources through the implementation of projects, the architecture for the UNFCCC REDD+ mechanism is still evolving and is not yet fully functional. Hence the compliance and voluntary markets are the major platforms for REDD+ financing. It is obvious that not all projects could meet the methodological and eligibility requirements of generating certified emission reductions (CER) in the compliance and voluntary markets.
Thus, it is important to differentiate REDD+ projects which are being prepared for the carbon market from forestry projects which have mitigation potentials and co-benefits. In effect, not all mitigation projects could be described as REDD+ projects in the strict sense. This is important in managing expectations associated with REDD+ project incentives. For instance, a project could have a perfect emission reductions potential, but the area coverage could be too small, making it financially unattractive for the existing markets, because implementation costs could far surpass financial benefits that could be generated from the carbon market.
2.13.2 REDD+ Potential in the Savannah and transitional zones The savannah zone of Ghana is made up of vast areas of savannah woodlands and grasslands, with few forests patches as per the forest definition of Ghana (tree height = 5m, canopy cover = 15% and land area = 1 ha), and as used by the Forest Preservation Project (FPP) of the Forestry Commission (figure 4, FPP/FC, 2012). Land tenure is pretty clear, with much reduced or no disputes over land ownership, mostly under a single paramount chief. This is particularly true for most parts of Gonja land, Dogomba and parts of the Upper West Region, where most of the
Page | 34
remaining savannah forests and woodland are located. Though per the national forest definition, the forest cover in the savannah is very little and only exists in patches, there are vast areas of savannah woodlands with aboveground carbon stocks sometimes reaching 60MgC/ha. Thus, lower levels of carbon stocks could be compensated for by area. The zone also experiences significant anthropogenic land-intensive activities which are sources of serious emissions of carbon dioxide, with associated loss of habitat and wildlife. Drivers of deforestation and degradation could be described largely as mosaic rather than frontier, and are linked to hunters and Fulani herdsmen setting fire to the vegetation, illegal logging of rosewood and mahogany, slash & burn agriculture, as well as unregulated charcoal production. The charcoal production chain is particularly a major driver of change of the savannah/transition landscapes. The emissions sources are both land based and non-land based throughout the supply chain. For example, the production processes as well as kilns are highly inefficient, and involve exploitation of huge volumes of wood, and are strongly linked to food crop production. For instance it is estimated that 7 kg of wood is required in order to produce 1 kg of charcoal (Mombu et al, 2007). Currently, because of the immense pressure on the forests, shea trees are now being exploited for charcoal production, a situation that could be likened to a taboo in times past, due to the importance of shea trees to the rural economy of the savannah and parts of the transitional zones. The demand for charcoal has placed the vegetation in the savannah and transitional zones under immense pressure. When charcoal production is coupled with wildfires and shifting agricultural practices, the associated emissions could be alarming. However, any attempt to regulate and streamline charcoal production should be carefully examined, since it is a major component of the rural livelihood in the transitional and savannah zones. In this regard, the LPG price rationalization policy by government is expected to push demand for woodfuel or charcoal up.
Invariably, deforestation and forest degradation activities are mostly carried out in the off-reserve areas, because the reserved forests are under relatively strict controls. But a careful observation of the wildlife movement in the savannah zone indicates a need for harmonious relationship between the on-reserve and off-reserve areas. For instance, the off-reserve area between the Mole National park and Bui National park serves as an important migration corridor for most of the wild animals (pers. Comm with Victor Mombu), many of them under various levels of CITES protection. Hence project activities that seek to avoid or slow the conversion of savannah woodland for charcoal production and climate-smart agricultural interventions would boost efforts to sustainably manage the remaining forest patches and woodlands. But also, regulation of logging and good governance strategies could enhance the management of the off-reserve forest patches and woodland.
Page | 35
Therefore a REDD+ activity in the savannah and transitional zones could be associated with significant emission reductions probably as a cost-effective price. However the extent of the initial social cost could be prohibitive if the design of the REDD+ activity is not well thought through. In the long to medium term, critical co-benefits which will have transformational livelihood improvements for the rural poor, in addition to wildlife conservation could be a positive incentive. Therefore emphasis could also be given to sustaining ecotourism, with its associated multiplier effects on surrounding communities. Based on observations in the landscape, the savannah and transitional zones could have feasible projects to reduce deforestation and forest degradation with possible extensions to forest carbon stocks enhancement strategies. The base case for “additionality” of such a project could be highly positive. This is because the unsustainable existing situation will most likely get worst without any intervention since there is no planned management of the off-reserve forests and woodland. Thus the northern region and most parts of the transitional zone offer good opportunities for forest carbon stocks enhancement in croplands as well as woodlands, which could be integrated into avoiding deforestation in the few patches of forest as shown in figure 4. Figures 4 and 7 provide useful information on the remaining forest areas as well as woodlands, with associated carbon stocks that could inform preliminary decisions on suitable areas for particular REDD+ interventions.
2.13.3 REDD+ Potential in the High forest zone Ghana has one of the highest deforestation rates in Africa; approximately 2% per annum within the High Forest Zone (FAO 2006) and the country has lost more than 85% of its forest cover over the past 100 years (Hansen et al., 1999). Invariably, cocoa has been one of the prime drivers of deforestation in Ghana, in addition to other factors such as conversion of forested lands to annual agriculture use (slash and burn agriculture), illegal logging operations and uncontrolled harvesting of NTFPs. The rapid decline of the off-reserve tree stock is an area of particular concern. This was formerly government policy (off-reserve areas being earmarked for progressive conversion to agriculture and other non-forest uses), but a policy change in 1994 in favour of sustainable production has failed to arrest the decline. With very little incentives, smallholder farmers will rather keep trees off their farms than risk collateral damage from timber operations to their plantation and food crops. The loss of forest cover in the off-reserve areas is also compounded by the unregulated chainsaw logging (Ghana RPP, 2010). For over a century, cocoa has been the major driver of land use change in the high forest zone, and in recent times, the evolution of the full-sun cocoa systems which are now widely adopted have accelerated the pace of deforestation and the removal of shade trees. It is known, however, that the traditional varieties (“Tetteh Quarshie”) require much denser crown cover and, in the past, their need for high atmospheric humidity encouraged the farming population to support the forest reserve policy (Ghana RPP, 2010) and the retention of shade trees. But in recent times the full-sun systems are widespread. This is coupled with oil palm
Page | 36
expansion and its associated implications for deforestation, though this has been less researched as compared to cocoa.
As the second largest cocoa producer in the world, some 30% of Ghana’s population is dependent on cocoa for part or all of its livelihood, and cocoa exports account for approximately one quarter of total exports (ISSER 2003), with cocoa farms covering an estimated 1.45 million hectares (Anim-Kwapong and Frimpong 2008). The increase in cocoa production over the past decade, however, has largely been due to expansion of the land area under cocoa, rather than improved productivity. In fact, studies within the sector suggest that on-farm productivity is quite low and that 40% of farmers fail to make a net profit (Asare and David 2010). An additional challenge is that in the Western Region and southern Brong-Ahafo Region much of the cocoa is grown with low shade cover (less than approximately 10% canopy cover) - a management regime that tends to harbor less biodiversity and carbon (Wade et al., 2011) and is less resilient to changes in climate (Anim-Kwapong and Frimpong 2008) compared to some of the older cocoa growing regions where farmers still grow the crop with relatively higher canopy cover. In Ghana, the agro-forestry / tree crops / agriculture sector is as important as the forest sector itself in defining options for REDD+, because much of the processes of deforestation relate to agricultural or agro-forestry conversion. The cocoa sector presents particularly interesting opportunities in relation to REDD+, with potentially major impacts given its dominant position in the high forest zone.
The best way to do so could be to bundle timber rights with cocoa production, so that the additional timber income tips the balance in favour of the shade-loving cocoa varieties (Ghana RPP, 2010). Providing incentives for the re-establishment of the shade tolerant and dependent varieties would have the important knock-on benefit of enhancing public support for the retention of forest reserves (Ghana RPP, 2010). However, Aitken (2009) observed no significant effect of cocoa variety on carbon stocks or on the number of shade trees on farms growing new and old varieties2. Thus, from a realistic view point, it is not a matter of promoting shade tolerant varieties (i.e. Amazon and Amelonado/”Tetteh Quarshie”), because no farmer will do that under the current circumstances, but most importantly, an effective off-reserve REDD+ project could provide the right incentives3 for farmers to incorporate shade trees in cocoa farms, irrespective of the variety (because the new varieties are also known to tolerate some level of shade), with strong emphasis on the trade-off between cocoa systems with shade trees and those without shade trees.
This could eventually create a corridor that links most protected areas and forest reserves that will result in biodiversity, watershed and improved livelihood co-benefits. More specifically, an
2 Old varieties represent Amazon and Amelonado/”Tetteh Quarshie”, whilst new varieties represent the hybrids. 3 These incentives could be the review and practical enforcement of tree tenure regimes, constant awareness creation and sensitization on favorable laws and policies that encourage trees in farming systems, as well as adequate compensation for farm damages and conflict management associated with off-reserve timber exploitation.
Page | 37

off-reserve REDD+ strategy could explore the options of avoiding forest degradation by preventing community members from encroaching into forested areas to establish new farms (with options of integrating various agroforestry systems in food crop production), and encouraging them not to cut down mature forest trees in replanting old cocoa farms. In addition, it could focus on carbon stock enhancement (CSE) through the planting of shade trees or enabled natural regeneration in new/young farms (cocoa agroforests).
2.13.4 Matrix (rank/score different land use types based on criteria/factors above) Given the above factors, the different landuses have been ranked according to the scores illustrated in table 4
Table 4: An illustration of scores for different landuse types
Score Ƿ
Ɨ Ƿ µ Ɨ Ƿ
β µ Ɨ Ƿ Ω β µ Ɨ Ƿ
Description Low Medium High
A higher illustration of symbols shows a high potential for the criteria in aiding the implementation of a REDD+ project. However, a higher value for constraint and integrity indicates a lower potential for REDD+. Thus, it is a major constraining factor. For instance, a high constraint of law enforcement is a major limitation to the realisation of emission reductions or removal enhancement. Savannah zone Based on figure 7 (biomass map of Ghana), the carbon stocks of forests in the savannah zone were judged to be medium, with high drivers of exploitation and conversion, due to illegal logging, agriculture and charcoal production. There are also high options for additionality and co-benefits for habitats for wildlife, provision of NTFPs etc, but a major constraining factor for REDD+ project (avoided deforestation, conservation of forest carbon stocks or degradation) is that the area coverage could be too small to make it viable (figure 11). It is important to note that most of the forest patches in the savannah zone are located in the forest reserves and protected areas, with only few areas remaining in the off-reserve areas (circled patches). These areas offer the only opportunities for avoided deforestation and degradation options. However, there is the need to quantify the area of these forests for concrete decisions to be taken.
Page | 38
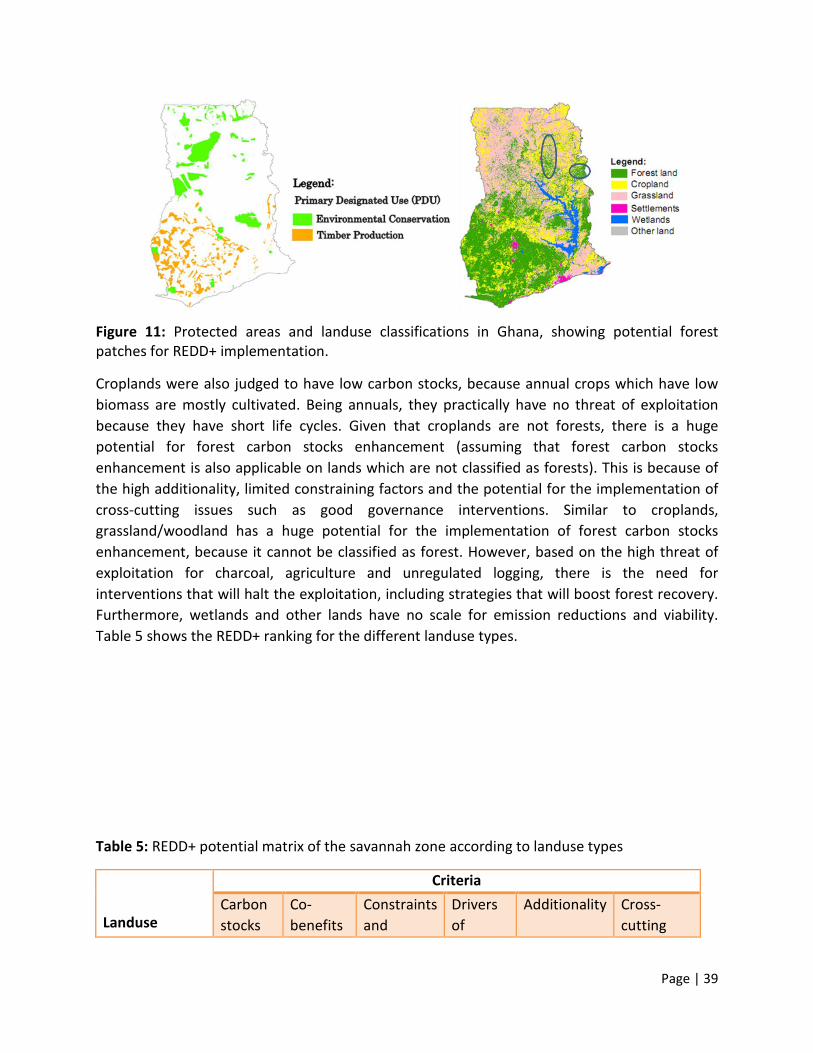
Figure 11: Protected areas and landuse classifications in Ghana, showing potential forest patches for REDD+ implementation.
Croplands were also judged to have low carbon stocks, because annual crops which have low biomass are mostly cultivated. Being annuals, they practically have no threat of exploitation because they have short life cycles. Given that croplands are not forests, there is a huge potential for forest carbon stocks enhancement (assuming that forest carbon stocks enhancement is also applicable on lands which are not classified as forests). This is because of the high additionality, limited constraining factors and the potential for the implementation of cross-cutting issues such as good governance interventions. Similar to croplands, grassland/woodland has a huge potential for the implementation of forest carbon stocks enhancement, because it cannot be classified as forest. However, based on the high threat of exploitation for charcoal, agriculture and unregulated logging, there is the need for interventions that will halt the exploitation, including strategies that will boost forest recovery. Furthermore, wetlands and other lands have no scale for emission reductions and viability. Table 5 shows the REDD+ ranking for the different landuse types. Table 5: REDD+ potential matrix of the savannah zone according to landuse types
Landuse
Criteria Carbon stocks
Co-benefits
Constraints and
Drivers of
Additionality Cross-cutting
Page | 39

integrity landuse change
issues
Forestlands µ Ɨ Ƿ Ω β µ Ɨ Ƿ Ω β µ Ɨ Ƿ Ω β µ Ɨ Ƿ Ω β µ Ɨ Ƿ β µ Ɨ Ƿ Croplands Ƿ µ Ɨ Ƿ Ƿ Ƿ Ω β µ Ɨ Ƿ β µ Ɨ Ƿ Grassland/open woodland
µ Ɨ Ƿ Ω β µ Ɨ Ƿ Ƿ Ω β µ Ɨ Ƿ Ω β µ Ɨ Ƿ β µ Ɨ Ƿ
Wetlands n/a n/a n/a n/a n/a n/a
Other lands n/a n/a n/a n/a n/a n/a
Transitional zone Based on figure 4, there are appreciable forest areas in the transitional zone, which have medium carbon stocks (figure 7). There is also an enormous pressure for exploitation for charcoal, agriculture and unregulated logging, including frequent wildfires, high additionality because these areas are under no form of regulation, with high co-benefit options and better chances of implementing successful cross-cutting issues. Therefore project interventions to halt deforestation and avoid degradation are possible. But a major constraint is difficulties associated with land tenure. Most of the land holdings are fragmented, and will require efforts to ensure permanence of the project.
Except the low carbon stocks and low threats of exploitation of croplands, there is a better scale for the implementation of forest carbon stocks enhancement in the cropland areas in the transitional zone. However, land tenure could be a huge constraint that needs to be addressed. Grasslands/woodlands do not have the scale to achieve emission reductions and removals that could be viable. Else, all other factors are favourable for the implementation of a forest carbon stocks enhancement. There is however, no applicable scale and favourable factors for any REDD+ intervention in wetlands and other lands in the transitional zone. Table 6 shows the matrix for REDD+ options in the transitional zone. Table 6: REDD+ potential matrix of the transitional zone according to landuse types
Page | 40
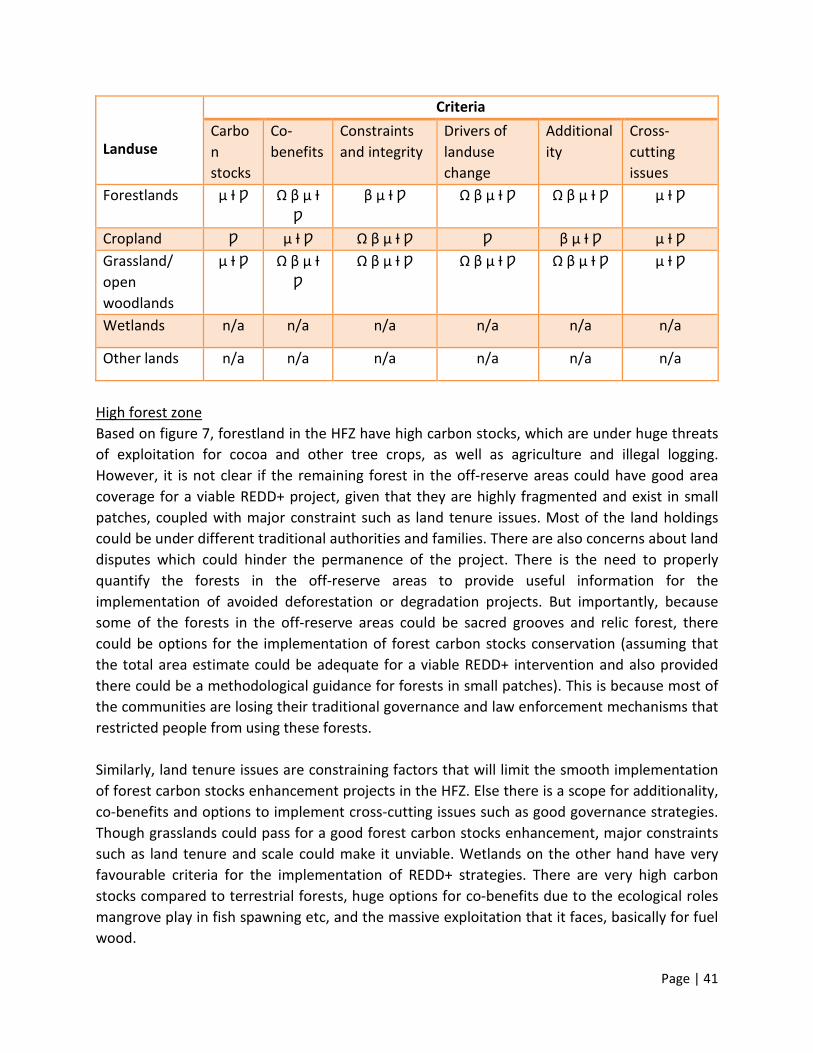
Landuse
Criteria Carbon stocks
Co-benefits
Constraints and integrity
Drivers of landuse change
Additionality
Cross-cutting issues
Forestlands µ Ɨ Ƿ Ω β µ Ɨ Ƿ
β µ Ɨ Ƿ Ω β µ Ɨ Ƿ Ω β µ Ɨ Ƿ µ Ɨ Ƿ
Cropland Ƿ µ Ɨ Ƿ Ω β µ Ɨ Ƿ Ƿ β µ Ɨ Ƿ µ Ɨ Ƿ Grassland/ open woodlands
µ Ɨ Ƿ Ω β µ Ɨ Ƿ
Ω β µ Ɨ Ƿ Ω β µ Ɨ Ƿ Ω β µ Ɨ Ƿ µ Ɨ Ƿ
Wetlands n/a n/a n/a n/a n/a n/a
Other lands n/a n/a n/a n/a n/a n/a
High forest zone Based on figure 7, forestland in the HFZ have high carbon stocks, which are under huge threats of exploitation for cocoa and other tree crops, as well as agriculture and illegal logging. However, it is not clear if the remaining forest in the off-reserve areas could have good area coverage for a viable REDD+ project, given that they are highly fragmented and exist in small patches, coupled with major constraint such as land tenure issues. Most of the land holdings could be under different traditional authorities and families. There are also concerns about land disputes which could hinder the permanence of the project. There is the need to properly quantify the forests in the off-reserve areas to provide useful information for the implementation of avoided deforestation or degradation projects. But importantly, because some of the forests in the off-reserve areas could be sacred grooves and relic forest, there could be options for the implementation of forest carbon stocks conservation (assuming that the total area estimate could be adequate for a viable REDD+ intervention and also provided there could be a methodological guidance for forests in small patches). This is because most of the communities are losing their traditional governance and law enforcement mechanisms that restricted people from using these forests. Similarly, land tenure issues are constraining factors that will limit the smooth implementation of forest carbon stocks enhancement projects in the HFZ. Else there is a scope for additionality, co-benefits and options to implement cross-cutting issues such as good governance strategies. Though grasslands could pass for a good forest carbon stocks enhancement, major constraints such as land tenure and scale could make it unviable. Wetlands on the other hand have very favourable criteria for the implementation of REDD+ strategies. There are very high carbon stocks compared to terrestrial forests, huge options for co-benefits due to the ecological roles mangrove play in fish spawning etc, and the massive exploitation that it faces, basically for fuel wood.
Page | 41
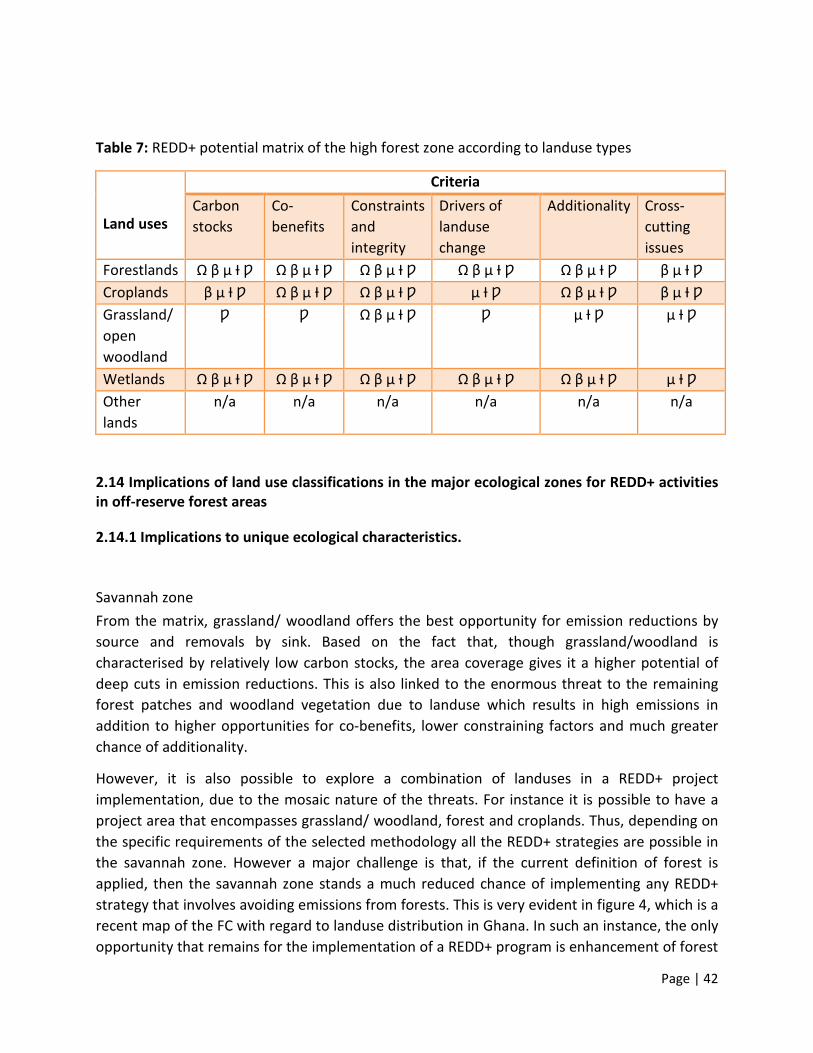
Table 7: REDD+ potential matrix of the high forest zone according to landuse types
Land uses
Criteria Carbon stocks
Co-benefits
Constraints and integrity
Drivers of landuse change
Additionality Cross-cutting issues
Forestlands Ω β µ Ɨ Ƿ Ω β µ Ɨ Ƿ Ω β µ Ɨ Ƿ Ω β µ Ɨ Ƿ Ω β µ Ɨ Ƿ β µ Ɨ Ƿ Croplands β µ Ɨ Ƿ Ω β µ Ɨ Ƿ Ω β µ Ɨ Ƿ µ Ɨ Ƿ Ω β µ Ɨ Ƿ β µ Ɨ Ƿ Grassland/ open woodland
Ƿ Ƿ Ω β µ Ɨ Ƿ Ƿ µ Ɨ Ƿ µ Ɨ Ƿ
Wetlands Ω β µ Ɨ Ƿ Ω β µ Ɨ Ƿ Ω β µ Ɨ Ƿ Ω β µ Ɨ Ƿ Ω β µ Ɨ Ƿ µ Ɨ Ƿ Other lands
n/a n/a n/a n/a n/a n/a
2.14 Implications of land use classifications in the major ecological zones for REDD+ activities in off-reserve forest areas
2.14.1 Implications to unique ecological characteristics.
Savannah zone From the matrix, grassland/ woodland offers the best opportunity for emission reductions by source and removals by sink. Based on the fact that, though grassland/woodland is characterised by relatively low carbon stocks, the area coverage gives it a higher potential of deep cuts in emission reductions. This is also linked to the enormous threat to the remaining forest patches and woodland vegetation due to landuse which results in high emissions in addition to higher opportunities for co-benefits, lower constraining factors and much greater chance of additionality.
However, it is also possible to explore a combination of landuses in a REDD+ project implementation, due to the mosaic nature of the threats. For instance it is possible to have a project area that encompasses grassland/ woodland, forest and croplands. Thus, depending on the specific requirements of the selected methodology all the REDD+ strategies are possible in the savannah zone. However a major challenge is that, if the current definition of forest is applied, then the savannah zone stands a much reduced chance of implementing any REDD+ strategy that involves avoiding emissions from forests. This is very evident in figure 4, which is a recent map of the FC with regard to landuse distribution in Ghana. In such an instance, the only opportunity that remains for the implementation of a REDD+ program is enhancement of forest
Page | 42

carbon stocks, which basically entails afforestation and reforestation, including regeneration management through wildfire control.
On the other hand, the savannah zone equally presents opportunities for agricultural carbon, with emphasis on the soil pool. For instance, Adu-Bredu et al., (2010) observed that the soil pool contributed almost 60% to the total ecosystem carbon stocks. However, their study also observed increased disturbance due to fire which could contribute to high emissions from the soil pool. It is therefore important that measures to reduce emissions from the savannah zone encompass landscape approach to agricultural carbon, instead of a REDD+ regime. Nationally Appropriate Mitigation Actions (NAMAs) could also be explored as a programmatic approach of mitigating emissions in the forestry sector.
Transitional zone Like the savannah zone, the transitional zone exhibits very similar landuse characteristics. However, the transitional zone has relatively high distribution of forests, which makes REDD+ strategies that involve avoiding emissions from deforestation and degradation viable. This is strongly linked to higher threats of deforestation and degradation, co-benefits and additionality. However, constraining factors such as tenure and land holdings must be critically examined to address issues of risks of non-permanence.
Additionally, the cropland and grassland/woodland areas offer good opportunities for emission removals through forest carbon stocks enhancement as well as agroforestry intervention with multi-temporal and multi-spatial benefits of forest recovery in most degraded and deforested areas, including agricultural carbon interventions. With charcoal production which is strongly linked to rural livelihood, being an important source of emissions in this zone, it is imperative that mitigation measures are looked at from the landscape perspective in order to attain the necessary scale for emission reductions. Thus, sustainable and efficient charcoal production could be employed as a project intervention to avoid deforestation and degradation of woodlands and forests. This can also be linked to the promotion and use of efficient cook stoves, and a switch to the use of LPG. Here too, program scale mitigation activities through NAMAs can be explored, without necessarily focusing on REDD+. Overall, the cost of project intervention and monitoring should be considered to ensure that incentives from carbon finance would be sustainable for the entire lifetime of the project. This is the major thrust behind a landscape approach to emission reductions or removals.
High forest zone Based on the matrix, all the landuse types in the HFZ proved to be very viable for REDD+ implementation, with the exception of grassland and other lands, basically because of area coverage. However this depends on the mitigation strategy under consideration. But in a landscape REDD+ approach which encompasses all landuse types, grasslands could be very
Page | 43

viable for forest carbon stocks enhancement, using an appropriate agroforestry intervention. Cocoa has been cited as a major driver of deforestation in the HFZ, with government projecting increased production up to 1 million tonnes by 2012 and beyond. However, given that the size of the forests outside the reserves in the HFZ is estimated to be about 400,000 ha4(mostly degraded primary or secondary forest), which is spread across an area of 5 million ha (Abebrese, 2002; Kotey et al., 1998), the potential for an avoided deforestation REDD+ project appears to be reduced in terms of scale, and the same is true for avoided emission through degradation. This basically means that the remaining off-reserve area’s potential for REDD+ implementation is forest carbon stocks enhancement. But for this to happen, the position of cocoa as a landuse should be adequately clarified as part of the national REDD+ strategy. It is very clear in Ghana’s RPP that cocoa is considered as a crop, however, the latest landuse map of the Forest Preservation Project of the FC clearly bunched cocoa up with natural forests, a contradiction that has implications for the kind of REDD+ strategy that can be implemented in the HFZ. If cocoa is considered as a cropland, then the only alternative intervention for REDD+ in the off-reserve areas is through forest carbon stocks enhancement. On the other hand, if cocoa is classified as forest (a position that will contradict the reality on the ground and the Ghana RPP), then there could be a huge scale for all REDD+ interventions. There could however be approaches to avoid deforestation and degradation in the remnant forests in the HFZ, but the scale and emission reductions potential, need to be examined more critically.
Nevertheless, an area that is largely unexplored is the role of wetlands, particularly mangroves in emission reductions and removals. With below and aboveground carbon stocks almost 10 times higher than terrestrial forests, a massive threat due to exploitation for fuel wood and an appreciable scale (Asante and Jengre, 2012), mangrove forests could be very viable mitigation projects. The south-eastern coastline of Ghana has the highest potential, because of the massive exploitation of mangroves, coupled with pretty organized management regimes. However the condition of the mangroves in the south-western coastline is relatively intact, with very little exploitation pressure, but it is believed that this will be short lived, as infrastructural development associated with oil and gas exploitation and fuelwood utilization begins to peak (Asante and Jengre, 2012).
4 This figure is outdated for this discussion, given the landuse dynamics in the Off-reserve areas in Ghana, it could be lower. However it’s the only available figure as of the time of completing this report.
Page | 44

SECTION THREE
3.0 Step-by-step approach in the design, implementation and monitoring of REDD+ strategies for different landuse types in the ecological zones of Ghana for subnational and national REDD+ programs
3.1 The Emerging REDD+ Environment in Ghana Before starting to design a REDD+ project, it is advisable to analyze the REDD+ environment to clearly define the options. Since 2010, Ghana has engaged stakeholders on various REDD+ initiatives, and within the country several REDD+ related interventions have been rolled out, mostly within the cocoa landscape. Many tropical countries have signed agreements with the Forest Carbon Partnership Facility (FCPF), the UN-REDD Programme and/or the REDD+ Partnership and, in parallel, are at different stages in establishing national REDD+ frameworks. Project proponents should be aware of ongoing REDD strategy development in Ghana, as the elements of this strategy may restrict the eligibility of project activities or may implicitly establish specific legal or technical requirements for stratification, biomass inventory design, or land use change (LUC) monitoring for an eventual compliance regime (although projects may still be eligible under VCS). In addition, it is essential to understand what other subnational or project-based activities are already underway. 5Proponents operating in neighboring sites may want to consider sharing monitoring tasks or developing a joint reference emission scenario (as long as this is allowed by the chosen GHG program standard). Even if project proponents prefer to keep design and implementation independent of other projects, they will have to coordinate the zoning of subnational or project areas to avoid overlaps that could affect emissions accounting.
3.2 Project Idea and Preliminary Assessment
3.2.1 Project Conceptualization Project proponents need to define from the outset what the project’s objectives are, what the activities will be to achieve these objectives, and where the project will take place. They also need to identify project participants and partners who will be critical to implementing activities and reaching objectives. While it may seem obvious, defining what the project will do to enhance or maintain forest cover and biomass should be the very first step of designing a
Page | 45

carbon project. A surprising number of project proponents embark on a complex project design process focusing on measuring and monetizing carbon benefits, without having thoroughly defined what the project will actually do to create the carbon benefits. A key conceptual and practical distinction in this regard is between the project activities that generate carbon benefits – i.e., planting trees, conserving forests, improving forest management – and the technical design component – i.e., calculating and documenting the carbon benefits created by the project activities and getting them certified under a specific standard. In addition, there may be an underlying project that goes beyond these components and is linked to proponents’ broader objectives (see below). This is true of integrated conservation or rural development projects and may also hold for commercial enterprises that involve components which are not integral to the carbon project but nevertheless important to the overall enterprise (e.g., timber processing). More important than terminology is the realization that a carbon project involves more than quantifying carbon benefits, and this has to be kept in mind throughout project design and feasibility assessments.
3.2.2. Identifying the project issue For all forest carbon projects an essential objective will involve either increasing carbon stocks or reducing carbon stock losses. However, there will almost always also be other objectives more closely related to the core mission of the organization proposing the project, for which carbon finance is a valuable tool. These objectives could relate to rural development and poverty alleviation, the protection of biodiversity, or generating corporate revenues.
In any situation, the creation of economic returns, whether for local resource holders, private investors, or both, will feature as a key component of project objectives and is needed to ensure long-term viability of the project and its overall sustainability. Economic returns need not exclusively arise from the sale of carbon credits. Though some restoration or conservation projects may be focused on carbon as the primary or sole source of revenue, aiming to create more than one revenue stream can lead to a much more resilient and attractive project (e.g., through the sustainable production of timber in an AR, REDD, or IFM project). For more on the strategic relationship between a project’s objectives and finances, see the Business Guidance of this series.
3.2.3 Defining baseline activities What underlying activities will achieve project objectives? At this early stage, not all details will be fully defined, but project proponents -- consulting potential participants and seeking outside advice – should be as comprehensive as possible in defining key project interventions that will lead to emissions reductions or removals. In principle, several different types of project activities may be combined in a single project description under the VCS, though each will likely
Page | 46
require application of distinct methodologies. In general, projects with a single activity type are more straightforward in terms of technical design and validation.
Afforestation and Reforestation (AR) Projects AR refers to planting trees or otherwise converting non-forested to forested land.Afforestation refers to establishing forests on land that has historically not had forest cover, while reforestation refers to lands that had been deforested, generally prior to a specific cut-off date. At a minimum, AR project proponents will likely need to:
• Assess available areas for reforestation, with an eye to (1) favorable geographic and ecological characteristics, (2) relatively secure land tenure, and (3) eligibility criteria of the target standards. 4How many hectares could the project realistically cover, and where are lands located?
• Describe species mix and planting arrangements taking into account the objectives of effective carbon sequestration as well as other aims, such as producing timber or generating biodiversity benefits.
• Determine overall management and silvicultural approaches, including possible harvest regimes.
Reduced Emissions from Deforestation and Degradation (REDD) Projects REDD projects aim to avoid the conversion of forests to non-forested areas (deforestation) or to avoid activities that reduce their carbon stocks without leading to outright conversion (degradation). It is worth noting that the VCS distinguishes between legal and illegal degradation and logging. Only illegal, or unplanned, degradation and logging form part of the REDD category, while areas that have been designated or approved for logging by regulatory bodies fall into the Improved Forest Management (IFM) category (described below). At this early stage, proponents of REDD projects will need to:
• Analyze key drivers and agents of deforestation as the basis for defining specific activities – within the control of the project proponent and potential partners – that will be implemented to address these deforestation pressures. Project proponents should be as specific and realistic as possible regarding the likelihood that an intervention will influence deforestation drivers and regarding the capacity of their organization and partners to implement these interventions. For example, what sort of alternative agricultural production systems, conservation area management, incentive payments, land titling, land or concession acquisition, etc. will be put in place to lower deforestation or degradation pressures?
• Develop a causal model and a systematic driver-agent-analysis, which can provide a useful framework for a preliminary description of pressures and help identify counter-measures (causal models and analysis of drivers and agents are discussed in greater depth in the Social Impacts and REDD guidance documents of this series).
Improved Forest Management (IFM) Projects
Page | 47

IFM projects seek to actively improve forest management to maintain and/or increase carbon stocks in forest areas or remaining forests. At a minimum, proponents designing an IFM project will need to:
• Analyze key drivers of degradation or unsustainable forest management. • Describe the specific actions, within the control of the project proponent and potential
partners that will counter degradation pressures and/or lead to improved forest management. This could include, for example, extension of rotation length, reducing logging damages through improved road planning, increasing conservation set-aside areas, and introducing practices to enhance regeneration.
3.2.3 Analysis of drivers, causes and agents REDD is fundamentally about tackling the drivers, causes, and agents of deforestation and degradation. Without a coherent analysis of these elements, it will be difficult or impossible to define project interventions that can effectively lower emission rates and achieve lasting (permanent) success. Moreover, this analysis contributes too many other essential aspects of project development, starting with an assessment of on-the-ground project feasibility and designing project interventions. It is also necessary for the definition of the reference areas and leakage belt as well as for deciding on a baseline modeling approach (see Section 8) and monitoring baseline assumptions. Moreover, the definition of agents and drivers will have implications for the risk assessment. Finally, developing a causal model of drivers, causes, and agents—especially, understanding the motivations of agents and benefits derived from deforestation—is an integral part of assessing the social impacts of a project and engaging communities.
Geist and Lambin (2002) developed a framework to systemize possible proximate causes (the so-called “drivers”) and underlying driving forces (“underlying causes”). Within this framework, immediate human actions directly impacting forest cover (infrastructure extension, agricultural expansion, wood extraction, and other factors) are considered as drivers; while demographic, economic, technological, cultural, policy, and institution factors form a specific set of fundamental social processes considered as underlying causes, which a project could only partially control.
Page | 48

Figure ___From Geist and Lambin, (2002) Initially, a project developer will establish a hypothesis about the specific driver constellation and the relevant agents affecting the project’s forests. Project developers will frame the drivers and agents on the basis of available information and potentially identify data gaps and questions to be addressed ahead. The relative importance of underlying causes is far more difficult to assess at an early stage, as it requires knowledge of how certain causes frame the behavior of different agents. Ignoring them would, of course, lead to misconceptions. Thus, developers have to be conscious that their initial framework will certainly change. Consequently, VCS requires the baseline to be reassessed every 10 years. Under optimum conditions, project developers would be capable of quantifying the weight of different drivers and transform a fully understood driver and underlying causes constellation into a modeling and policy framework, which would provide a reliable business-as-usual (BAU) scenario and outline effective project interventions to reduce deforestation and forest degradation. This is rarely the case. In the initial phase of project design, developers have to rely mostly on preliminary deforestation and degradation assessments, published reports, or expert judgment. In most cases, reliable data is not readily available to track the importance of
Page | 49

certain drivers in the past. Furthermore, feedback patterns between drivers and underlying causes are usually not fully understood and/or subject to high uncertainties. Thus, developers are encouraged to start with the change detection analysis during the preliminary assessment to reduce uncertainties regarding the quantitative and structural aspects of deforestation. Once the information has been compiled, the analysis of the drivers and agents constellation could follow a two-step approach:
• Depending on the eligible activities, project developers may want to start with a description of the agents of deforestation (and degradation), either by doing a desktop review of available information, a visual analysis of the spatiotemporal deforestation pattern.
• Once the agents are identified, available information on drivers and underlying causes should be comprehensively documented. This could take the form of a matrix linking the drivers and their underlying causes with agents and available data sources; such documentation can be usefully integrated with the assessment of social impacts.
3.2.4 Defining project interventions Once the site, reference region, agents, drivers, and underlying causes have been identified, it is time to define realistic options for tackling the existing or projected causes of deforestation. Although it may seem obvious, measuring and monitoring carbon stocks is not what will make REDD succeed. As is frequently the case in drivers-and-agents analyses, many projects seem not to invest sufficient effort into working out realistic and effective interventions targeted towards the key deforestation drivers. Arguably, what has hampered efforts to tackle tropical deforestation to date is not just a lack of finance – which one hopes may be addressed through REDD – but, to a perhaps even larger degree, the lack of effective and pragmatic measures to counter complex socio-economic drivers on a policy and project level.
How does the project want to reduce deforestation? What options are technically, financially, politically, or legally feasible? Shall the program create new direct incentive schemes, improve forest governance, or stimulate poverty reduction? Will it involve all agents or only a subset of stakeholders? What are the low-hanging fruits that might provide the most beneficial mitigation potential on short-term? These are only some of the questions that need to be asked at the project assessment, design, and planning stage. It has to be clear whether a proposed subnational or project based intervention is worth the effort. Under certain conditions, reducing deforestation and forest degradation may simply be too expensive or politically unfeasible. There are also formal reasons for addressing these questions at an early stage. The VCS requires proponents to present conservative ex-ante estimations of the net anthropogenic GHG emissions reductions of the REDD project activity. It has to be clear how this emission reduction potential can be achieved. The development and natural resources management community
Page | 50
has developed many tools to support project developers in understanding the causal relationships between socioeconomic, environmental, or natural resources problems, development objectives, potential intervention strategies, and activities. Although the current reality of developing countries, unfortunately, cannot be considered resounding proof of success, these tools help to identify and assess potential intervention strategies upfront. The Community Engagement Guidance contains a specific discussion of these tools and strategies. Once the intervention strategy and the activities of the with-project scenario have been identified, they must pass the additionality test, and their emission reduction potential has to be conservatively estimated. It goes without saying that policy shifts and socioeconomic adjustments require time. It is advisable to conservatively underestimate the emission reduction potential to avoid a situation where a project becomes unviable because of overambitious targets or unrealistically tight planning.
3.2.5 Preliminary determination of project scale, area and boundaries At this stage, project proponents should aim to clearly identify the scale and location that will be subject to project interventions (reforestation, improved forest management, and/or REDD). Project boundaries are likely to be modified over the course of project development, landowner outreach, and land acquisition, but a preliminary and conservative estimate of project boundaries and size provides an essential starting point. Particular attention should be paid to specific standards and methodologies before engaging in additional outreach or land acquisition, since these can significantly impact the project size and boundaries (discussed in greater detail in Section 3.2 of this Overview and in the AR and REDD guidance documents of this series). Project areas need to be under the control of the project proponent to implement activities.
Existing forest carbon projects range from small – several hundred hectare reforestation efforts – to large – REDD projects covering hundreds of thousands of hectares or more. The voluntary market and carefully crafted partnerships may provide a niche for even tiny projects. It is important to consider, however, that transaction costs of project development (validation, monitoring, verification, and market engagement typically cost hundreds of thousands of dollars per project) will prove prohibitive for many small projects. While there is no fixed lower bound, most market intermediaries and investors look for projects offering 10,000-20,000 tons of CO2 emissions reductions per year, at a bare minimum. This means, for example, that it will be difficult for AR projects covering less than a few thousand hectares to be economically viable, especially if slow-growing tree species are used.
This size barrier might be overcome if areas form part of an aggregated set of projects, known as Grouped Projects under the VCS or a Programme of Activities (PoA) under the CDM.6PoAs have proven complex to implement to date (with only a handful of registered PoAs under the CDM, none of which are forestry). VCS Version 3 now provides full guidance for grouped projects allowing for the addition of new areas (new “project activity instances”) after
Page | 51
validation, if these meet defined baseline, additionality, and eligibility criteria as set out in the original Project Description (PD). Several Grouped Projects, and at least one methodology for grouped REDD projects, are now under development under these new VCS rules.
3.2.6 Identifying key project participants Projects are likely to involve multiple participants for different phases and activities. These include groups involved in implementing project activities (e.g., farmers engaged in improved agricultural practices, or an NGO introducing new techniques and coordinating training efforts) as well as land and/or forest owners. For many REDD+ projects, participants will also include neighboring populations benefiting from current land uses and deforestation. Project development prior to implementation typically involves a number of different entities. It is important to determine the leaders and partners for each aspect of project development (e.g., design, coordination, and implementation of strategies and activities) so that the most competent partners implement parts of the project that may be outside the core capacity of the project proponent or lead organization (e.g., certain forestry or agricultural activities).
3.3 Draft Project Idea Note A Project Idea Note (PIN) is a summary description of a proposed project. It is commonly used as an initial summing up of the project and is useful for engaging governments, investors, and technical support. It should be noted that developing a PIN is not a formal requirement under the VCS or CDM, and PINs do not have to follow any particular format. In some countries, however, a PIN is required by the Designated National Authority (DNA) for issuing the formal Letter of Approval required for CDM projects. A PIN can also be used to secure an early Letter of Endorsement, which may be useful to indicate conditional government support for a project when engaging with potential investors. A Letter of Endorsement may also provide additional credibility for voluntary market projects, which do not otherwise require any formal government approval. Writing the PIN should be considered a valuable opportunity for project proponents and others to review basic assumptions about the project. It should reflect all the elements highlighted above (project objectives, activities, and participants), as well as:
• Characterization of the baseline: What, realistically, would happen without the project?
Who are actors and what are the driving forces of land use and land-use change? For REDD: Is the process primarily one of degradation, deforestation, or a sequence of degradation leading to deforestation? To the extent possible, proponents should describe and substantiate this scenario with data on historical degradation or deforestation trends in the project area or its vicinity. Any recent changes in land-use trends should be noted (e.g., through a comparison of deforestation trends in the last
Page | 52
ten versus five years). Proponents should be careful to critically re-examine common perceptions of land-use and environmental degradation trends and should try to find objective evidence for such developments. See the REDD and AR guidance documents for detail on baseline characterization.
• Estimate of forest carbon stocks or sequestration potential: What are the carbon stocks of any existing forests on project lands (differentiating between intact forests and degraded forests, as well as different forest types)? What are carbon sequestration rates of planted trees or regenerating forests? This information should ideally be based on available data from the project site or similar forests or plantations. In the absence of local data, project developers should use default values from the Intergovernmental Panel on Climate Change (IPCC) and, for AR projects, potentially consult existing carbon calculators.
• Preliminary estimate of carbon benefits: This refers to the differential between baseline (without-project) and project scenario, i.e., net carbon losses or gains (see Section 3.3.4). What is the realistic impact of the proposed project activities in terms of reducing emissions? What is the time scale? How fast can planting activities be launched and scaled up? Project developers should be conservative and realistic in their assumptions here– overly optimistic calculations and inflated objectives are unlikely to convince investors, auditors, or other stakeholders; a cautious and well-documented argument is more likely to impress.
• Additionality: What are the arguments for claiming that comparable project activities or carbon benefits would not have happened in the absence of a carbon project? Is the expectation of generating carbon revenues truly vital for implementation of activities?
• Social and environmental impacts: What are likely key impacts on local populations, ecosystem services and biodiversity? How will potential adverse impacts be managed and mitigated? How will any financial benefits be allocated? These questions can be important arguments for convincing certain types of stakeholders and investors to become engaged in the project; project proponents should be brief and objective in laying out these aspects.
3.4 Conduct a Thorough Project Feasibility Assessment There are many challenges to preparing a feasible carbon project. Carbon prices remain generally low while no comprehensive international regulatory framework is in place for forest carbon activities, and thus only a subset of forest carbon projects are financially viable. Furthermore, forest carbon methodologies are written primarily for specific circumstances and may require such exacting accounting and monitoring approaches that they can only be implemented in certain situations. Most importantly, however, implementing sizeable reforestation activities and effectively tackling deforestation and degradation are ambitious objectives in and of themselves.
Page | 53
For these reasons, before embarking on the next steps in project design, it is essential to conduct an initial assessment of project potential. The feasibility assessment is not simply a formal step in the project cycle but rather a key decision point and an opportunity to take an open-minded, critical, and comprehensive look at the project. It has to be clear during the exercise that a positive outcome cannot be taken for granted, and that the project may have to be re-designed or abandoned. We suggest, where possible, involving an independent expert or entity for a (pre-) feasibility assessment, both to bring in additional technical and market expertise and to provide some valuable outside perspective. Many project proponents, seeking finance for rural development or conservation objectives at a specific site, see their project through the lens of their broader objectives, but may tend to downplay or ignore some of the particular requirements and constraints of forest carbon projects. This can be an important moment for a “reality check” to review whether a project is likely to be viable. If conducted in this way, the feasibility assessment can help to identify a project that will ultimately not be viable early on, thereby avoiding creating unrealistic stakeholder expectations and unnecessarily spending significant human, technical, political, and financial resources. Conversely, a solid feasibility analysis can also add value for project proponents, increasing investor and stakeholder confidence.
3.5 Project Design and Planning Over the course of preceding steps, project proponents should have developed a clear preliminary design for their project, identified key gaps, and made an informed decision to continue to invest (or not) in project development based on positive (or negative) results from feasibility analysis. They can now move on to the concrete and detailed phases of project planning and design. The following steps of project planning and design include the technical and procedural elements required to prepare a Project Design Document (PDD) or Project Description (PD) for external validation. In addition, they encompass a broader range of issues relating to project activities, legal matters, finance, and stakeholder engagement. This phase, leading up to securing project finance and validation – and achieving both of these is required for success – will demand significant resources and time, as well as patience and perseverance. Securing adequate finance for the planning and design phase is a challenge that must be addressed early on.
3.5.1 Define a Target Market or Standard Based on the project’s characteristics, projected scale of carbon benefits, location, and fit with available methodologies, project proponents need to define which standard to use, and in consequence, which market segment they are aiming for.
Page | 54
This overview and it accompanying guidance documents are primarily focused on the CDM, the VCS, and the CCB Standards as the predominant standards applied to forest and land-use projects in the developing world. The CDM allows projects in developing countries to produce credits for the Kyoto markets and has laid the groundwork for rigorous forestry methodologies, albeit limited to AR projects. The VCS is by far the most preferred carbon accounting standard by buyers in the voluntary and pre-compliance markets and captures the majority of all forest carbon transactions. The CCB Standards, which do not lead to the issuance of carbon credits, are the most prominent standard for ensuring social and biodiversity co-benefits.
3.5.2 Ensure Effective Community Engagement Not all forestry projects are community-based, but virtually all will need to incorporate local communities and landowners in some way, either as direct project participants, rights holders, stakeholders in forest and land resource use, and/or neighbors. These communities may be at very different levels of socio-economic development and lifestyles, poverty, and vulnerability, and projects may affect communities through different types of activities. Working with communities is far more than a “step” in the development of most projects. Rather, it will need to be an ongoing process that includes many of the activities over the course of the project development and implementation cycle. Different projects will require different levels and types of community engagement; for example, a commercial reforestation project on private lands will be different from a community-managed REDD project. It is recommended that all projects assess the appropriate degree and mechanisms for community involvement early and continuously in the project cycle.
Both CCB and VCS place emphasis on effective community involvement. The CCB Standards require projects to document how stakeholders have been involved in project design, including the stakeholder dialogue process, and to implement a plan for continuous communication and consultation between project managers and all community groups (Indicators G3.4 and G3.8). The VCS non-permanence risk analysis of AFOLU projects requires an assessment of “community engagement”– including, most notably, evidence that a significant portion of the population dependent on the project area has been consulted. Failure to fulfill these criteria increases overall VCS risk buffer ratings, directly affecting project financials. Free, prior, and informed consent (FPIC) has emerged as a key issue and as a guiding principle for REDD+. FPIC is based on the principle that a community has the right to give or withhold its consent to proposed projects that may affect the lands or resources they customarily own, occupy, or otherwise use. The critical importance of this principle is increasingly being recognized, mainly due to growing concerns about vulnerable communities potentially losing access to traditional lands or livelihoods through increased forest protection efforts. FPIC is not just a “one-off” exercise carried out at the end of planning project interventions; instead, it defines an entire way of engaging and planning with local stakeholders through a rights-based approach. Ensuring adequate understanding and engagement of stakeholders is important on ethical grounds, and it can also lay the groundwork for project performance and sustainability by
Page | 55
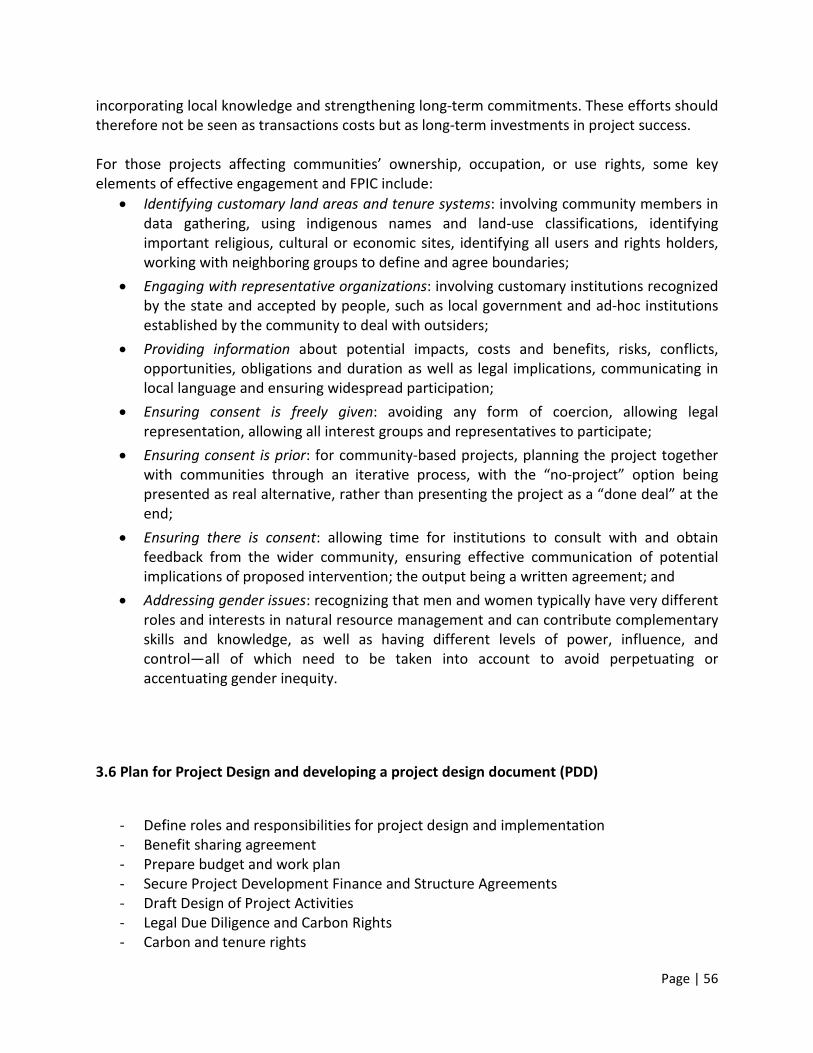
incorporating local knowledge and strengthening long-term commitments. These efforts should therefore not be seen as transactions costs but as long-term investments in project success. For those projects affecting communities’ ownership, occupation, or use rights, some key elements of effective engagement and FPIC include:
• Identifying customary land areas and tenure systems: involving community members in data gathering, using indigenous names and land-use classifications, identifying important religious, cultural or economic sites, identifying all users and rights holders, working with neighboring groups to define and agree boundaries;
• Engaging with representative organizations: involving customary institutions recognized by the state and accepted by people, such as local government and ad-hoc institutions established by the community to deal with outsiders;
• Providing information about potential impacts, costs and benefits, risks, conflicts, opportunities, obligations and duration as well as legal implications, communicating in local language and ensuring widespread participation;
• Ensuring consent is freely given: avoiding any form of coercion, allowing legal representation, allowing all interest groups and representatives to participate;
• Ensuring consent is prior: for community-based projects, planning the project together with communities through an iterative process, with the “no-project” option being presented as real alternative, rather than presenting the project as a “done deal” at the end;
• Ensuring there is consent: allowing time for institutions to consult with and obtain feedback from the wider community, ensuring effective communication of potential implications of proposed intervention; the output being a written agreement; and
• Addressing gender issues: recognizing that men and women typically have very different roles and interests in natural resource management and can contribute complementary skills and knowledge, as well as having different levels of power, influence, and control—all of which need to be taken into account to avoid perpetuating or accentuating gender inequity.
3.6 Plan for Project Design and developing a project design document (PDD)
- Define roles and responsibilities for project design and implementation - Benefit sharing agreement - Prepare budget and work plan - Secure Project Development Finance and Structure Agreements - Draft Design of Project Activities - Legal Due Diligence and Carbon Rights - Carbon and tenure rights
Page | 56

- Review local regulatory requirements - Social and Biodiversity Impact Assessment - Assess Non-Permanence Risks and Develop Mitigation Strategies - Maintain Ongoing Liaison with Regulators -
3.7 Developing a Project Design Document
A Project Design Document (PDD) is the key source of information and analysis that summarizes project characteristics, quantifies carbon benefits, and lays out a monitoring plan, thereby providing the basis for independent project validation and verification of its emission reductions or removals. PDDs are mostly based on specific project standards and methodologies. The content of the PDD depends on the standard and methodological requirements. It is strongly recommended that since the development an design of a REDD+ project is very technical, and given also that there has not been any project in Ghana that has gone through the developmet of a full PDD, expert consultation and involvement is very critical. Generally the content of a PDD and the processes leading up to the design of a REDD+ project are well explained in the project methodology of the standard and includes the following;
- Structuring the PDD Team - Choosing a Methodology and providing a guidance for the methodology - Conducting PDD Analyses - Spatial boundaries - Land eligibility - Additionality - Starting conditions, baseline and “with project” conditions - Quantification of emission removals and reductions - Leakage - Non-permanence risk assessment - Project start date - Project crediting period - Historical reference period - Monitoring period - Validation period
Upon completing the PDD, it is important to subject it to thorough review exercise, since many people would have written the various sections. Moving on, further engagements should be made of project partners to finalise the implementation;
- Review Project Activities and Develop Project Implementation Strategy - Finalizing Financing and Investment Arrangements - Approvals, Validation, and Registration - Implementation and Monitoring
Page | 57

- Verification and Issuance
BIBLIOGRAPHY
Asante, W. A and Tutu, D. B. 2013. Potential REDD+ Project Types in Off-Reserve Areas, Agroforests and Secondary Forests in Various Ecological Zones of Ghana. ITTO, SECO, FC, CSIR. Asare, R. A. and Kwakye, Y. 2013. A Guide to Implementing REDD+ in Ghana: Criteria and modalities for developing aREDD+ project. ITTO, SECO, FC, CSIR.
Olander, J and Ebeling, J. 2011. Building Forest Carbon Projects: Step-by –step overview and guide. In Building Forest Carbon Projects, Johannes Ebeling and Jacob Olander (eds.). Washington, DC: Forest Trends
Seifert-Granzin, J. 2011. REDD Guidance: Technical Project Design. In Building Forest Carbon Projects, Johannes Ebeling and Jacob Olander (eds.). Washington, DC: Forest Trends.
Page | 58
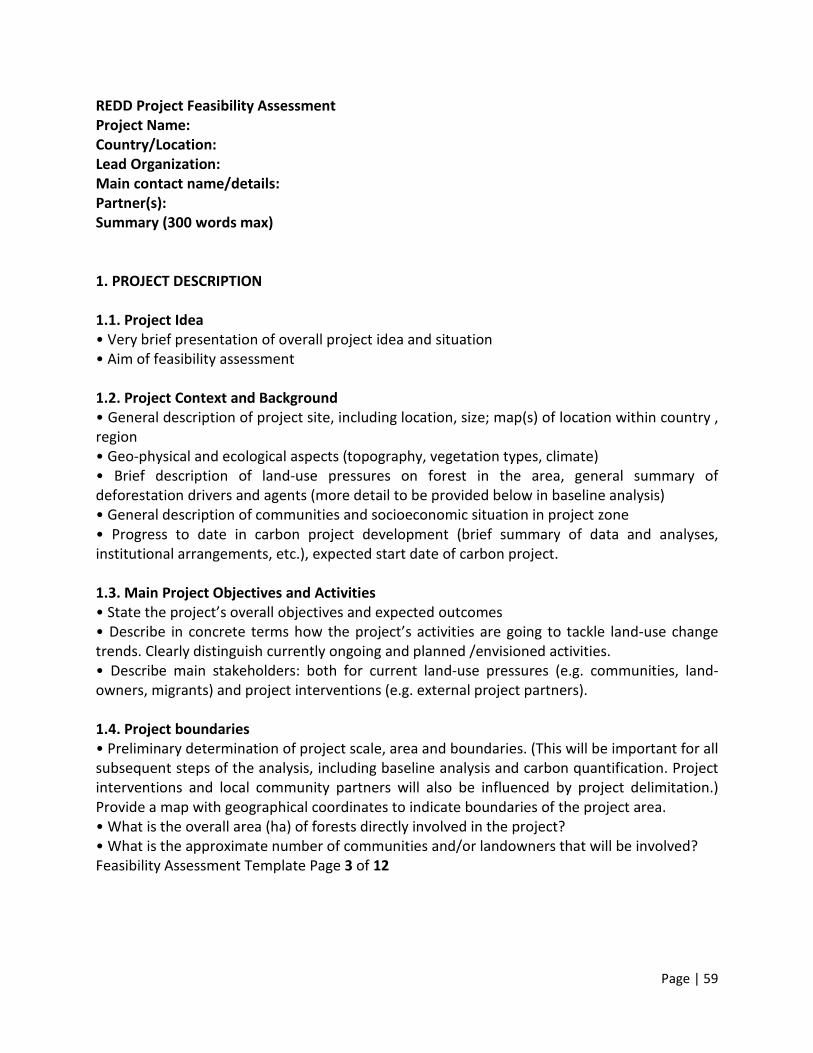
REDD Project Feasibility Assessment Project Name: Country/Location: Lead Organization: Main contact name/details: Partner(s): Summary (300 words max) 1. PROJECT DESCRIPTION 1.1. Project Idea • Very brief presentation of overall project idea and situation • Aim of feasibility assessment 1.2. Project Context and Background • General description of project site, including location, size; map(s) of location within country , region • Geo-physical and ecological aspects (topography, vegetation types, climate) • Brief description of land-use pressures on forest in the area, general summary of deforestation drivers and agents (more detail to be provided below in baseline analysis) • General description of communities and socioeconomic situation in project zone • Progress to date in carbon project development (brief summary of data and analyses, institutional arrangements, etc.), expected start date of carbon project. 1.3. Main Project Objectives and Activities • State the project’s overall objectives and expected outcomes • Describe in concrete terms how the project’s activities are going to tackle land-use change trends. Clearly distinguish currently ongoing and planned /envisioned activities. • Describe main stakeholders: both for current land-use pressures (e.g. communities, land-owners, migrants) and project interventions (e.g. external project partners). 1.4. Project boundaries • Preliminary determination of project scale, area and boundaries. (This will be important for all subsequent steps of the analysis, including baseline analysis and carbon quantification. Project interventions and local community partners will also be influenced by project delimitation.) Provide a map with geographical coordinates to indicate boundaries of the project area. • What is the overall area (ha) of forests directly involved in the project? • What is the approximate number of communities and/or landowners that will be involved? Feasibility Assessment Template Page 3 of 12
Page | 59

2. LAND TENURE AND REDD POLICY CONTEXT 2.1. Tenure regimes in project area and relevance for REDD • What is the legal regime of tenure rights for forest and agricultural land in the project area (incl. formal and customary titles)? Do project participants hold legal or customary land titles or could they realistically obtain them? This will be important to understand 1) carbon ownership aspects, 2) feasibility of specific project interventions linked to changed land uses, 3) needs for an incentive and compensation strategy to rights holders, and 4) risks to the permanence of carbon benefits. 2.2. National REDD+ policy context • What is the status of REDD+ strategy and policy at the national level? What are implications for the project area or project type proposed here (geographic location, types of interventions, etc.)? • What is the status of policy arrangements for sub-national activities (nested approaches, projects), and have accounting regulations been specified? Are there explicit restrictions or opportunities for crediting (or commercializing credits) on the project level? 2.3. Legal context of forest carbon rights • Have forest carbon ownership rights been legally defined in national legislation? Can certain rights (ownership, use) be inferred from existing forestry, natural resource, or land tenure legislation? 3. FIT WITH CARBON STANDARDS & METHODOLOGIES 3.1. Applicable carbon standards • Which carbon standards potentially apply to the project context (e.g. VCS, Plan Vivo)? 3.2. Availability of methodologies applicable and suited to project context • Are (approved) methodologies available under the chosen standard for this project type? Review applicability criteria and scope for existing methodologies. • Are there any challenges to applying standards and existing methodologies (e.g., baseline projections, applicability criteria, leakage requirements)? Feasibility Assessment Template Page 4 of 12
Page | 60
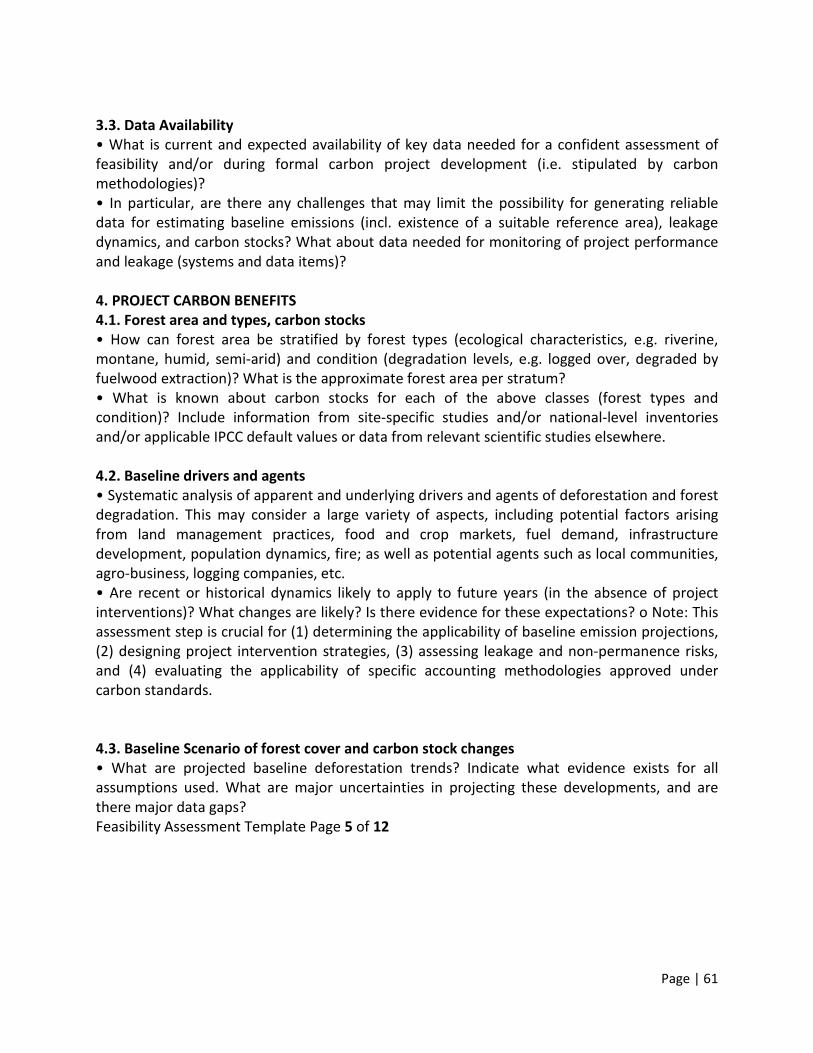
3.3. Data Availability • What is current and expected availability of key data needed for a confident assessment of feasibility and/or during formal carbon project development (i.e. stipulated by carbon methodologies)? • In particular, are there any challenges that may limit the possibility for generating reliable data for estimating baseline emissions (incl. existence of a suitable reference area), leakage dynamics, and carbon stocks? What about data needed for monitoring of project performance and leakage (systems and data items)? 4. PROJECT CARBON BENEFITS 4.1. Forest area and types, carbon stocks • How can forest area be stratified by forest types (ecological characteristics, e.g. riverine, montane, humid, semi-arid) and condition (degradation levels, e.g. logged over, degraded by fuelwood extraction)? What is the approximate forest area per stratum? • What is known about carbon stocks for each of the above classes (forest types and condition)? Include information from site-specific studies and/or national-level inventories and/or applicable IPCC default values or data from relevant scientific studies elsewhere. 4.2. Baseline drivers and agents • Systematic analysis of apparent and underlying drivers and agents of deforestation and forest degradation. This may consider a large variety of aspects, including potential factors arising from land management practices, food and crop markets, fuel demand, infrastructure development, population dynamics, fire; as well as potential agents such as local communities, agro-business, logging companies, etc. • Are recent or historical dynamics likely to apply to future years (in the absence of project interventions)? What changes are likely? Is there evidence for these expectations? o Note: This assessment step is crucial for (1) determining the applicability of baseline emission projections, (2) designing project intervention strategies, (3) assessing leakage and non-permanence risks, and (4) evaluating the applicability of specific accounting methodologies approved under carbon standards. 4.3. Baseline Scenario of forest cover and carbon stock changes • What are projected baseline deforestation trends? Indicate what evidence exists for all assumptions used. What are major uncertainties in projecting these developments, and are there major data gaps? Feasibility Assessment Template Page 5 of 12
Page | 61
• Can deforestation trends be derived from a suitable reference area (i.e. with similar biophysical, socio-economic, cultural and access conditions and of size at least as large as project area)? What is the size and location of this potential reference area? • What is the carbon stock of affected areas? What is the carbon stock after land-use change (e.g., in swidden agricultural systems or permanent croplands)? What carbon pools need to be considered for this calculation of emission factors (carbon stocks in forested and post-conversion areas)? • What are total baseline emissions? 4.4. Project Scenario & Net Carbon Benefits • By how much can the above baseline emissions be lowered – in theory, and in practice? I.e. what is a realistic assumption of the level of project intervention and effectiveness /performance? o Link this to assessment of non-permanence risks below (many of these may apply to immediate project performance) • Perform a quantified modeling exercise to develop scenarios for gross carbon benefit generation, i.e. project scenario compared to baseline emissions. (This will be the basis for carbon credit generation and financial revenue projections) 4.5. Additionality of Project Activities • Can additionality be demonstrated following requirements of the VCS or CDM additionality tools (small-scale, large-scale as applicable)? Which barriers exist (e.g., cultural, access to capital)? What is the case for financial additionality (IRRs etc.)? • Can these barriers or financial assumptions be documented in a credible and transparent way to convince external auditors? • What is the likely formal start date of additional project activities? 4.6. Leakage Risks & Project Emissions • What types of leakage are likely? o Consider in particular potential risks from activity shifting and timber market leakage o For projects reducing degradation (from legal or illegal wood harvest): what are leakage risks from displaced timber and woodfuel harvest? What are likely reductions in the harvested wood products pool? o What actors are likely to be involved in activity shifting leakage? E.g., local agents vs. immigrants (discounts may be required for leakage caused by immigrants) • What could a leakage belt look like, and can it be defined for this project? • What is the overall scale of potential emissions from leakage? Feasibility Assessment Template Page 6 of 12
Page | 62

• What activities are proposed to mitigate leakage risks? Are these likely to be effective (based on experiences in comparable project situations)? What percentage of leakage may be prevented? • Are any significant emissions likely to be created through project implementation (e.g., from fertilizer application, soil disturbance, burning of vegetation for tree planting)? o Note that emissions created outside the project boundary are considered as leakage. • What are net emission reductions after accounting for leakage and project emissions. Please build on the above modeling exercise (gross carbon benefits minus leakage and project emissions). o (Note: Non-permanence assessment is not carried out here but rather in the Risks section below.) 5. RISKS TO GENERATING CARBON BENEFITS 5.1. Risk assessment Frank analysis of the potential risks and uncertainties that may affect the viability of the proposed project (ideally based on VCS AFOLU Non-Permanence Risk Tool). Overall, how realistic is it to change current land-use trend, e.g., lower baseline deforestation in project area? How well do the currently envisioned activities match the underlying deforestation drivers? • Internal Risks o Project Management, including need for ongoing enforcement to protect carbon stocks and capacity of management team. o Financial viability o Opportunity costs and associated pressures of alternative land uses o Project longevity based on legal agreements or requirements • External risks o Land tenure, including ownership and resource access/use rights o Community engagement, consultation of households inside and within 20 kms of project boundaries o Political risk, based on World Bank Institute Worldwide Governance Indicators, adjusted if country is engaged in international REDD+ readiness initiatives • Natural risks o Significance and likelihood of fire, pest and disease outbreaks, extreme weather events such as hurricanes, and geological risk such as earthquakes and volcanoes
Page | 63

5.2. Risk mitigation and discounts • Are risk mitigation strategies planned? Are they feasible to implement? • What is the likely discount for risk buffer (VCS – please follow the AFOLU Non-Permanence Risk Tool according to guidelines) 6. FINANCIAL FEASIBILITY • This step should consider the overall financial feasibility of the project opportunity at a specific REDD site. Key is the carbon finance viability, i.e. net discounted carbon credit revenues (taking into account transaction costs) must be sufficient to cover implementation and/or opportunity costs. 6.1. Carbon revenue potential • What is the overall net carbon credit potential (carbon benefits after deducting leakage and non-permanence risks)? • What are gross revenues, considering different price scenarios in target market? • What transaction costs can be expected (baseline data collection, PDD, monitoring, validation & verification, government approvals and fees, registration, possibly brokerage fees)? o Note: It may be valuable to highlight cash flows during first 5-10 years considering likely horizon of project participants and discount rates o What are the overall carbon-cycle related upfront financing needs? • What is project’s potential tax liability from carbon and non-carbon revenues? • What are the main risks and sources of uncertainty (sensitivity analysis)? 6.2. Non-Carbon Revenues • Will project implementation lead to other revenues apart from carbon credit generation, e.g. from timber sales or agricultural production? On what scale and in which time-frame? • What are the main risks and sources of uncertainty (sensitivity analysis)? 6.3. Opportunity & Implementation Costs • What are the main costs of project implementation (taking into account mechanisms for compensation for opportunity costs)? Feasibility Assessment Template Page 8 of 12
Page | 64

• How do implementation costs compare to potential carbon revenues? How large is the revenue timing gap? Are there obvious sources to bridge it? • Does initial financial analysis indicate that basic costs and revenues, from carbon market revenues and other products, are potentially attractive to both investors and project participants? Are net carbon market and other revenues likely to be sufficient to justify changes in land use for landowners (e.g., versus opportunity costs)? 6.4. Attractiveness to Buyers and Markets • This step should assess the potential attractiveness of the particular project (site, activities, stakeholders; standard and methodology, carbon credit generation profile) to buyers in key markets. Including: Voluntary market buyers, pre-compliance value for REDD (post-2012 UNFCCC, US or other regional markets), interim non-market finance sources. • Also briefly refer to below social impacts and biodiversity benefits. 7. SOCIAL AND COMMUNITY IMPACTS • Key to project success, sustainability and marketability are the social and equity impacts of the project. What is the potential for poverty alleviation, what are mechanisms for stakeholder participation and capacity building, governance and potential effects on resource access and/or land tenure. • How will various project interventions impact socio-economic dynamics in project area? How can potential negative impacts be reduced and benefits created? • What is the strategy for benefit or revenue sharing, including financing of underlying activities (e.g. agricultural investments) and direct payments? • If feasible, an initial formal Social Impact Assessment will be carried out to determine key opportunities and risks and to inform project design from the outset. 8. IMPLEMENTATION CAPACITY & POTENTIAL PROJECT PARTICIPANTS 8.1. Description of Participating Organizations • What is the likely lead organization and who are critical partners in implementing the underlying project? • What are the respective roles and responsibilities of the various partners; what are their key strengths, capacity and track record? Feasibility Assessment Template Page 9 of 12
Page | 65
• NB: Make sure to match this to the implementation needs as defined by project intervention strategy 8.2. Human Resources Available to Work on the Project • Describe the key types of expertise that will need to be mobilized for project development, indicating resources available within the lead organization, from partners and/or those which will need to be secured from third parties. • Include consideration for technical experts, government liaison, community engagement, marketing partners, etc. 9. CONCLUSIONS & NEXT STEPS • Please outline the next steps necessary to make a decision on project continuation and strategy. This may include additional feasibility analysis steps, preparation of underlying project activities, marketing to buyers or co-investors, and/or formal project development under a carbon standard. • Alternatively, the feasibility assessment may indicate that the project may not be viable from a carbon market perspective. In this case, the below steps may be adjusted towards evaluating an alternative funding source, or towards shifting the focus to different project opportunities. 9.1. Summary of Feasibility and Risks • What is the overall picture of project feasibility? What are key risks and uncertainties that are apparent from this analysis? Please consider the following dimensions • Implementation and performance risks o Confidence (based on experience and analysis) of effectiveness of land-use incentive strategy and project interventions to reduce deforestation o Capacity to implement project interventions; potential time lags o Opposition of government or local stakeholders to certain project aspects • Methodological risks o Key apparent data challenges or applicability issues with existing methodologies o Key validation and verification risks • Legal Risks o What are potential issues with legal aspects of project implementation: land tenure and control over project area, legislation relevant to planned project interventions? o What are legal risks to carbon rights and carbon sales (including rights to commercialize credits)? • Financial and market risks
Page | 66

o In addition to general carbon market uncertainties, what factors are important specifically to this project (type, location, etc.)? o Particular funding gaps, delays in potential revenues versus upfront expenditures o Confidence in estimating implementation costs (can projected revenues finance necessary interventions? Is co-finance available?) • To what extent can the above risks be mitigated? Do strategies exist, or can they be developed? Please also consider impacts of engaging commercial and technical partners early on and their capacity to share in these risks. 9.2. Next Steps for Better Assessing Feasibility & Taking Decisions • The current assessment may reveal data insufficiencies that do not allow for a confident determination of project viability in the current carbon market context. If this is the case, and if there are strong indications that potential carbon benefits justify this, a decision may be made to invest into an expanded feasibility assessment. o E.g., to generate better baseline data, determine overall land area that could be brought into project; thorough screen against requirements of different methodologies, etc. • If methodological challenges create disproportionate risks for pursuing formal project development, but if substantial carbon benefits seem to exist, non-market or other innovative finance and project development options may be outlined. 9.3. Next Steps for Stakeholder Engagement and Underlying Project • If project is to be pursued, steps may be outlined for better determining the interest of main stakeholders; proposed process for stakeholder engagement • Key steps in designing and planning underlying project activities, including engagement /contracting of partner organizations with specific expertise (e.g. agriculture). 9.4. Next Steps for Formal Project Development • If decision is made to proceed with formal project development (based on a positive feasibility assessment), describe data items needed for potential PDD development (e.g., baseline study, leakage-driver assessment) • What would be a realistic (conservative) timeline for achieving key milestones in project development? Provide a graph or table. Will a commercial project developer be engaged? 9.5. Potential for replicating or up-scaling the project activities • What is the potential – assuming viability of project idea – for up-scaling the project, by expanding the area in the current project site, or designing similar projects in other parts of the country? Feasibility Assessment Template Page 11 of 12
Page | 67
• Would it be feasible to consider bundling or Programme of Activities approaches to reduce transaction costs? Could the project serve as a pilot to inform national strategies? 9.6. Near-term funding outlook / seed-funding • Please summarize briefly secured (or expected) counterpart co-financing for project development. • Are there any initial contacts with potential buyers or investors? Are upfront payments for potential forward-sales of carbon credits achievable and/or desirable (considering price discounts)?
Page | 68