operational event attribution - cgd · (stott, stone and allen, 2004) ggggfffff. using a threshold...
TRANSCRIPT

© Crown copyright Met Office
Operational event attributionPeter Stott, NCAR, 26 January, 2009

© Crown copyright Met Office
EventsAugust 2003
July 2007
January 2009
August 2003
July 2007
January 2009

© Crown copyright Met Office
Is global warming slowing down ?

© Crown copyright Met Office
Arctic Sea Ice
Climatesafety.orgHadISST
climatesafety.org
HadISST

© Crown copyright Met Office
f
TS-23HadCRUT3
Attribution
IPCC AR4
Attribution IPCC AR4
• Most of the observed increase in global average temperatures is very likely due to the observed increase in anthropogenic greenhouse gas concentrations

© Crown copyright Met Office
Patterns of observed change in land precipitation attributable to anthropogenic forcing are consistent with projected changes in precipitation in future
Drying of the sub-tropics and increases at high latitudes and near the equator.
Detection and attribution to determine observational constraints on predictions eg Detection of human influence on zonal mean precipitation changes (Zhang et al, Nature, 2007)

© Crown copyright Met Office
Events still leave us floundering !
• A particular event such as a heatwave, a flood or a drought can prompt the response
• “It’s consistent with expected effects of climate change”
• “It is not possible to attribute an individual event”

© Crown copyright Met Office
Is it possible to make an attribution statement about an individual weather event ?
1 2
Changed climate, P1
FAR = 1 – P0/P1
If the risk of a particular event has doubled as result of human influence
FAR = 1 - 1/2 = 0.5
Half the events can be blamed on human influence
Human influence has loaded the dice
Number of events per 100 years
Unchanged climate, P0
See Allen, 2003, Nature
Stone and Allen, 2005, Climatic Change

© Crown copyright Met Office
Fraction Attributable Risk (FAR)• Allen, 2003; Stone and Allen, 2005

© Crown copyright Met Office
Attribution of the European 2003 heatwaveStott, Stone, Allen, 2004, Nature

© Crown copyright Met Office1900 1950 2000
Attribution of the European 2003 heatwave

© Crown copyright Met Office1900 1950 2000
4
3
2
1
0
Tem
pera
ture
ano
mal
y (w
rt 1
961-
90)
C
Human influence has very likely at least doubled the risk of European summer temperatures as hot as 2003
Stott, Stone, Allen, Nature 2004

© Crown copyright Met Office
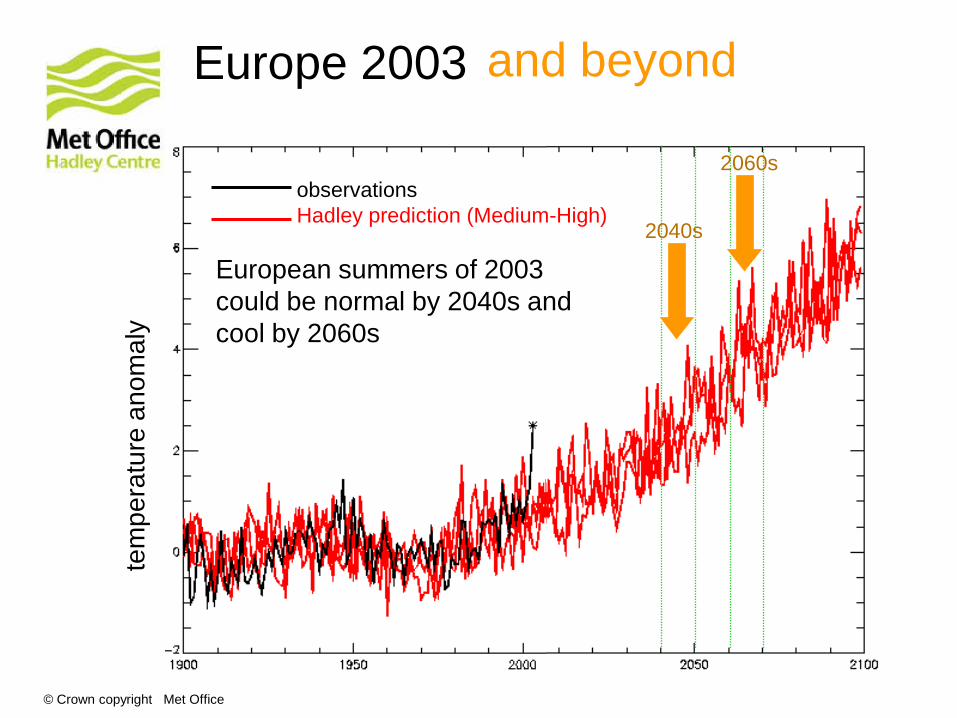
observationsHadley prediction (Medium-High)
2003
Europe 2003te
mpe
ratu
re a
nom
aly
France: 17 nuclear plants shut or reduced capacityEDF paid (€300m) 10 x normal rates to buy electricity on open market
estimated 900 people died in London35,000 deaths overall in Europe
photo: AP
…and £4.5bn missed retail sales
`
© Crown copyright Met Office
observationsHadley prediction (Medium-High)
2003
2040s
2060s
Europe 2003te
mpe
ratu
re a
nom
aly
and beyond
European summers of 2003 could be normal by 2040s and cool by 2060s

© Crown copyright Met Office
"global warming ... is not at the present time happening” Nigel Lawson

© Crown copyright Met Office
Human influence, particularly emission of greenhouse gases, has greatly increased the chance of having such warm years
Although 2008 was slightly cooler than we would expect given current climate conditions, there is still a greater than 1 in 10 chance of a colder year than 2008. However, without any human influence on climate, we would estimate the odds of having a year as warm as observed this year to be less than 1 in 100.
Although 2008 was slightly cooler than we would expect given current climate conditions, there is still a greater than 1 in 10 chance of a colder year than 2008. However, without human influence on climate, we would estimate the odds of having a year as warm as observed this year to be less than 1 in 100.
Human influence, particularly emissions of greenhouse gases, has greatly increased the chance of having such warm years

© Crown copyright Met Office
Central England Temperature2009 Anomaly so far is -1.42oC (relative to1961-1990 mean)1947 -2.97oC1963 -4.37oC
A winter as cold as this years so far is roughly a 1 in 20 year event but would have been roughly a 1 in 5 year event without human influence
A winter as cold as this year’s so far is roughly a 1 in 20 year event but would have been roughly a 1 in 5 year event without human influence

© Crown copyright Met Office
Operational event attribution
• There is a pressing requirement to improve how we put events in context of climate variability and change
• Eg Global temperatures, Arctic sea ice
• An event attribution system needs to be regular, objective, quantitative
• Pre-Agreed methodology, not post hoc
• Couched in probabilistic terms
• Considerable scientific challenges remain to quantify change of risk of events
• Eg very large uncertainties in influence of forcings at regional scales – aerosols, land use etc
• Need to account for model biases
• Need for robust statements in face of uncertainty
• Relative risks are likely to be easier to quantify than absolute risks

© Crown copyright Met Office
Need to better understand influence of forcings on climate response
Observations / T5max
HadGEM1 LU / T5max
T5max Timeseries

© Crown copyright Met Office
Quantifying change in risk could be easier than absolute risk

© Crown copyright Met Office
Robust statements in face of uncertainty
Using a threshold for mean summer temperature that was exceeded in 2003, but in no other year since the start of the instrumental record in 1851, we estimate it is very likely (confidence level > 90%) that human influence has at least doubled the risk of heatwave exceeding this threshold magnitude. (Stott, Stone and Allen, 2004)
ggggfffff
Using a threshold for mean summer temperature that was exceeded in 2003, but in no other year since the start of the instrumental record in 1851, we estimate it is very likely (confidence level > 90%) that human influence has at least doubled the risk of heatwaves exceeding this threshold magnitude. (Stott, Stone and Allen, 2004)

© Crown copyright Met Office
Extra slidesOperational attribution meeting, January 2009

© Crown copyright Met Office
Climate services
• Monitoring : What happened ?
• Attribution : Why did it happen ?
• What is likely to happen next ?

© Crown copyright Met Office
Seasonal forecasts : What is “normal” and how is “normal” changing ?• Winter 2008/9 (Released 22 December, 2008)
• Temperature
• UK mean temperatures are likely to be below average in January and nearer average in February. Mean temperatures for other parts of Europe during the rest of winter are more likely to be near average, but near or above average in south-east Europe.
• Rainfall
• Precipitation for the remainder of winter is more likely to be average, or below average over much of Europe, including the UK. However, above-average precipitation is favoured over parts of south-eastern Europe.
• Forecasts are expressed as variations from 1971-2000 averages.

© Crown copyright Met Office
BAMS proposal
• Abstract of < 250 words summarising article
• Additional paragraph of < 250 words explaining
• Intended purpose of article
• Set out why we need an operational attribution system
• Set out the research needs to deliver such a capability
• Factors making article timely/important for BAMS readers
• Operational attribution systems urgently required to underpin expensive adaptation decisions
• Length
• 4500 words (average length of articles)
• 6 illustrations

© Crown copyright Met Office
BAMS article• Why we need a system for timely and reliable attribution service• Core component of climate service; monitoring,attribution,prediction
• User needs – some examples meteorologically based, illustrat\ive
• 2003 heatwave, SW drought (Milly et al, Barnett et al), 2007 Arctic sea ice, Murray Darling basin,. Scale issue (Marty) to computing needs. People
• At end – strategy eg international annual assessment in state of climate. Persistent experimentation.
• EOS summary. Marty Kevin, Peter, Myles
• We need attribution service for adaptation agenda• Pace of system drives what we need to cope with
• Attribution of events
• Seasonal forecasting and predictability
• Understanding observed trends is complement to decadal forecasts
• MOHC glossy ?)
• Seasonal prediction angle – record tornados season 2008
• What do we mean by event by climate ?
• General principles• Consistent use of terminology; auhoritative voice
• Regular, for set of pre-defined events specified before they occur
• Robust
• Quantify changes in risks (likely to be easier than quantifying absolute risk)
• Modelling strategies• Ensembles of simulations with and without combinations of radiative forcings, SSTs to
quantify contributions of different components to observed changes
• Coupled model (eg Stott et al, 2004), Changes in Extreme value stats

© Crown copyright Met Office
BAMS article• Why we need a system for timely and reliable attribution service• Core component of climate service; monitoring,attribution,prediction
• User needs – some examples meteorologically based, illustrat\ive
• At end – strategy eg international annual assessment in state of climate. Persistent experimentation.
• Seasonal prediction angle – record tornados season 2008
• What do we mean by event by climate ?
• 2003 heatwave (Peter)• Couplde model
• Europe rainfall (Pall et al)
• SW drought (Milly et al, Barnett et al), Marty’s stuff
• 2007 Arctic sea ice (Clara), attribution when
• Murray Darling basin (david),.
• Scale issue (Marty) to computing needs. People
• General principles• Consistent use of terminology; auhoritative voice
• Regular, for set of pre-defined events specified before they occur
• Robust
• Quantify changes in risks (likely to be easier than quantifying absolute risk)
• Strategies; experimental design• Obsnal reqts
• Ensembles of simulations with and without combinations of radiative forcings, SSTs to quantify contributions of different components to observed changes
Cld dl ( Sttt t l 2004) Ch i Et l tt

© Crown copyright Met Office
The European summers of 2003 and 2006 could be normal by 2040 and cool by 2060
Source Gareth Jones, Hadley Centre
Black line – Observed temperaturesRed lines – Model forecast including human influenceBlue line – Model forecast without human influence
HadGEM1
© Crown copyright Met Office
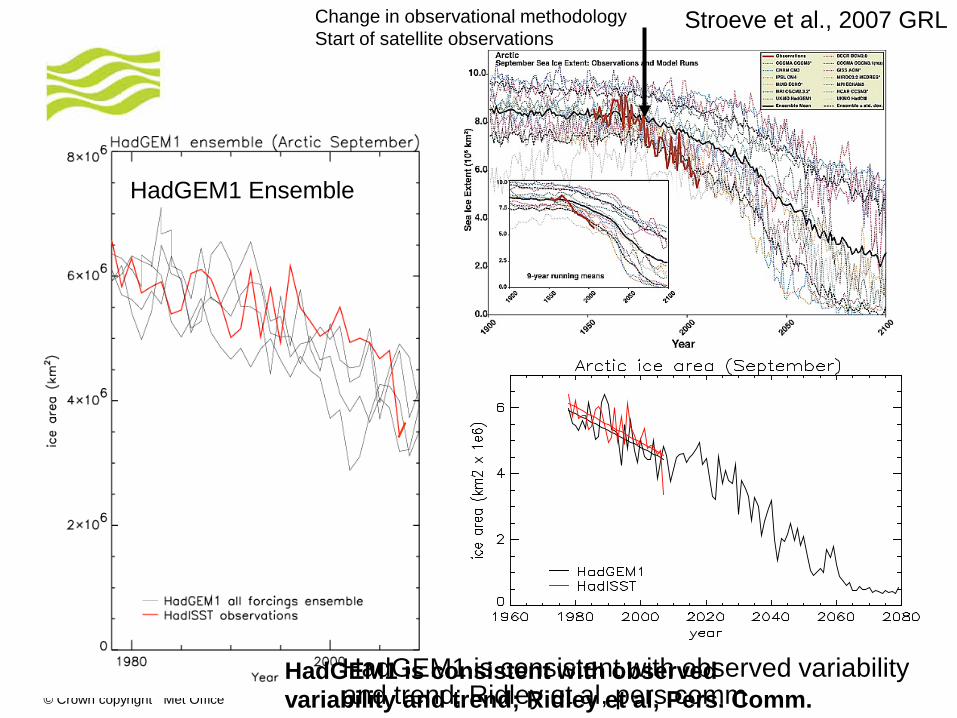
Change in observational methodologyStart of satellite observations
Stroeve et al., 2007 GRL
HadGEM1 Ensemble
HadGEM1 is consistent with observed variability and trend; Ridley et al, Pers. Comm.
HadGEM1 is consistent with observed variability and trend; Ridley et al, pers comm

© Crown copyright Met Office
Christidis et al, 2008, J. Climate Submitted

© Crown copyright Met Office
Risk based analysisSummer temperature changes in UK city
photo: Philip Wade
0 5 10 15
30
20
10
0
June / July / August temperature rise (deg C)
Rel
ativ
e lik
elih
ood
(%)
daily max
hottest day

© Crown copyright Met Office© Crown copyright Met Office
EUROSIP
© Crown copyright 2005
Climate forecasts for the near future
Sea Surface Temperature
Recent global atmospheric wind, rain, solar heating etc
Global Coupled Climate modelEnsembles
Ocean observationsIncluding ARGO floats
ObservationsModel
1998
Seasonal forecast
Decadal forecast
Development of 2005 weak La Niña predicted

© Crown copyright Met Office
Requirement to do more
• The Global Climate Observing System has prepared an action plan in response to a request of the Conference of the Parties to the UNFCCC “Without urgent action and clear commitment of additional resources…the Parties will lack the information necessary to effectively plan for and manage their response to Climate Change.”
• Better real-time information is required on the links between observed weather events and the effects of natural climate variability and anthropogenic climate change.

© Crown copyright Met Office
Climate services
• Monitoring : What happened ?
• Attribution : Why did it happen ?
• What is likely to happen next ?

© Crown copyright Met Office
Detection of human influence on zonal mean precipitation changes. Zhang et al, Nature, 2007
1925-1999
Global Historical Climatology Network