operating rules for improving the firm yield of an …
TRANSCRIPT

OPERATING RULES FOR IMPROVING THE FIRM YIELD OF AN OFF-STREAM
BLENDING RESERVOIR SYSTEM USED FOR REDUCING NITRATE IN DRINKING
WATER AND DROUGHT STORAGE
BY
JORY S. HECHT
THESIS
Submitted in partial fulfillment of the requirements
for the degree of Master of Science in Civil Engineering
in the Graduate College of the
University of Illinois at Urbana-Champaign, 2011
Urbana, Illinois
Adviser:
Associate Professor Ximing Cai

ii
Abstract
Community water supply systems dependent upon surface water sources susceptible to both low flows
contaminant concentrations exceeding drinking water quality standards can use off-stream blending
reservoirs (OSBR) to increase their water supply reliability and avoid investments in expensive treatment
technology. The water quality operating rules (WQOR) that water supply systems use to regulate inflow
into their OSBR affect their firm yield (i.e., the amount of water guaranteed for supply). The impacts of
three types of WQOR on firm yield are explored from a retrospective planning perspective using a
simulation model with a daily time step. The water supply system in Pontiac, Illinois, which utilizes its
OSBR to meet an internal nitrate-N concentration guideline of 8.0 mg/L through blending, is modeled as
a case study.
Using streamflow and nitrate-N data from May 1979 to April 1999, a firm yield of 2.21 mgd (million
gallons per day) is attained under its current WQOR in which the OSBR is only filled when the
concentration in the Vermilion River is less than or equal to 4 mg/L (River Concentration Rule). If the
rule is modified to allow the inflow of water of any concentration into the reservoir when the reservoir
concentration is at or below 4 mg/L, the yield rises to 2.32 mgd (Reservoir Concentration Rule). When a
constraint limiting the reservoir inflow to a concentration of 8 mg/L or lower is added to the Reservoir
Concentration Rule, the yield rises to 2.67 mgd (Hybrid Concentration Rule). This increase indicates that
limiting the inflow of high-nitrate water into the OSBR can increase the firm yield. Yet, in many cases, a
moderate relaxation of water quality constraints can elevate the firm yield as long as the system is
willing to invest in the additional algae control effort which may result from such a decision.
Under all three WQORs defined above, the critical period that limits the firm yield consists of a drought
in 1988 followed by a two- or three-year period of above-normal nitrate-N concentrations in the river.
The potential effects of reservoir nitrate sinks and nutrient management practices on the firm yield are
also quantified. When nitrate losses at a hypothetical first-order rate of just 0.02 ft/d at 20° C are
considered, the firm yields under the three WQORs increase to 2.39, 3.56 and 3.24 mgd, respectively.
Meanwhile, a uniform 20 percent decrease in the nitrate-N concentration in the Vermilion River leads to
43, 39 and 33 percent increases in the firm yield, respectively.
The firm yields attained with the three WQORs all exceed the system’s 2005-2009 average daily demand
of 1.95 mgd. Yet, a sensitivity analysis demonstrates that the firm yield can fall below this demand
when accounting for the uncertainty of low flows, net evaporation and the reduction of raw water
nitrate-N concentrations to less than 8.0 mg/L when blending takes place. A further assessment of the
system’s vulnerability to a water shortage, which should include an estimate of the nitrate loss rate in
the reservoir, is warranted.
Keywords: blending, denitrification, drought planning, firm yield, Illinois, nitrate, off-stream reservoir,
reservoir operation, simulation, water quality, water supply

iii
Acknowledgment
Many people supported this thesis effort through intellectual contributions, project management
guidance and camaraderie. My adviser, Associate Professor Ximing Cai in the Department of Civil and
Environmental Engineering, offered me the freedom to pursue this topic of my choice. He pushed me
to not only meet the basic requirements of a master’s thesis, but to excel and aim to make an
innovative, intellectual contribution that advances the field of water resources systems analysis. H.
Vernon Knapp, who supervised me as a professional hydrologist for two years at the Illinois State Water
Survey (ISWS) and for one and a half years as a graduate research assistant, introduced me to off-stream
reservoirs and reviewed parts of my work related to the development of the off-stream blending
reservoir simulation model used in this thesis. Professor Emeritus Wayland Eheart of the Department
of Civil and Environmental Engineering offered wonderful advice as an occasional reviewer of parts of
this work, inspired to me think about the engineering innovation that could stem from this research and
made it possible for me to study at the University of Illinois at Urbana-Champaign (UIUC) when I
expressed interest in taking his environmental systems analysis course as a part-time student in 2007.
My work experience at the ISWS also allowed me to conceive the off-stream blending reservoir analysis
idea as a thesis topic after I realized that the computation of the drought yield of the water system that
serves the community of Pontiac, Illinois would require an approach that also incorporated constraints
that high nitrate-N concentrations posed to the system. Representatives from the Illinois-American
Water Company, especially Timothy Tuley, the Operations Superintendent of the Pontiac system, were
instrumental in explaining the system’s operation and provided excellent information about its history
as well. Steve Wegman, Barry Suits and Elizabeth Doellman from the company’s office in Champaign
also provided information during a December 2010 meeting and follow-up e-mails. Professor Emeritus
Greg McIsaac in the Department of Agricultural and Biological Engineering at the University of Illinois

iv
relayed the daily river nitrate-N concentration data I used in my thesis to Dr. Momcilo Markus at the
ISWS. Prof. McIsaac also connected me with Mark Johnson, who managed the Pontiac system for the
Northern Illinois Water Company (predecessor to Illinois-American) when they put the off-stream
reservoir online in December 1991 in response to the hardships the system faced during a 1988 drought.
Many other colleagues at the ISWS and CEE supported this research. At the ISWS, Dr. Christopher
Lehmann of the National Atmospheric Deposition Program (NADP) gave me an orientation to wet and
dry deposition data sources. Dr. Momcilo Markus enthusiastically allowed me to bounce many ideas off
of him as I progressed through this endeavor. Dr. Alena Bartosova offered me my first professional
experience as a surface water quality analyst when I assisted her with assessing the impacts of
combined sewer overflows in the Aurora, Illinois area to the Fox River. William Gillespie helped me
attribute many of the patterns I observed in nitrate-N concentration data to common fertilizer
application practices in Illinois.
In the Department of Civil and Environmental Engineering, members of Prof. Ximing Cai’s research group
also offered their assistance throughout this process. In particular, Spencer Schnier willingly shared his
consulting experience with off-stream reservoirs and provided a sounding board for ideas while Aras
Zygas and Tze Ling Ng provided assistance with the nitrate mass balance model. I must recognize all of
my friends in the Environmental Hydrology and Hydraulic Engineering program within the department
for contributing to a very collaborative and familial learning and social environment. Finally, I must
acknowledge all my friends and family members who have offered their support through my progress
with this degree or along the road that led to my matriculation in the CEE program.

v
Table of Contents 1. Introduction .................................................................................................................................... 1
1.1 Off-Stream Blending Reservoirs ................................................................................................ 1
1.2 Nitrate Health Hazards, Contaminant Sources and Options for Removal from Drinking Water .. 6
1.3 Research Objectives and Novel Aspects .................................................................................. 19
1.4 Thesis Structure ..................................................................................................................... 24
Figures and Tables ............................................................................................................................. 25
2. Off-Stream Blending Reservoir System in Pontiac, Illinois ............................................................... 26
2.1 Introduction to Case Study ..................................................................................................... 26
2.2 Development of Simulation Model ......................................................................................... 29
Figures and Tables ............................................................................................................................. 46
3. Methods for Main Research Objectives.......................................................................................... 52
3.1 Water Quality Operating Rules ............................................................................................... 52
3.2 Limitations to the Firm Yield of Off-Stream Blending Reservoir Systems ................................. 55
Figures and Tables ............................................................................................................................. 68
4. Data ............................................................................................................................................... 69
4.1 Streamflow ............................................................................................................................ 69
4.2 Nitrate Concentrations ........................................................................................................... 83
4.3 Reservoir Water Temperature ................................................................................................ 86
4.4 Net Evaporation ..................................................................................................................... 88
4.5 Water Demand....................................................................................................................... 89
Figures and Tables ............................................................................................................................. 91
5. Results ........................................................................................................................................... 97
5.1 Comparison of Water Quality Operating Rules ....................................................................... 97
5.2 Evaluating Limitations to the Firm Yield ................................................................................ 101
Figures and Tables ........................................................................................................................... 119
6. Discussion .................................................................................................................................... 130
6.1. Decision-Making Perspectives .............................................................................................. 130
6.2 Blending Operations ............................................................................................................. 133
6.3 Reservoir Water Balance ...................................................................................................... 135
6.4 Reservoir Mixing .................................................................................................................. 137
6.5 Nitrogen Cycle and Algae ..................................................................................................... 138
vi
7. Conclusions ................................................................................................................................. 139
7.1 General Results on OSBR Operation ..................................................................................... 139
7.2 Vulnerability of Pontiac to Water Shortages – A Preliminary Assessment .............................. 144
7.3 Future Directions ................................................................................................................. 146
References .......................................................................................................................................... 151
Appendix A: Derivation of Numerical Expression for Reservoir Nitrate-N Concentration ..................... 158
Appendix B: Relationship Between Water Quality Constraints and Firm Yield under RivCR ................. 160
Figures and Tables ........................................................................................................................... 167
Author’s Biography .............................................................................................................................. 168
1
1. Introduction
1.1 Off-Stream Blending Reservoirs
Community water systems must provide their customers with water that fulfills their demand and is of
acceptable quality. Some water systems rely upon surface water sources of variable quantity and
quality and face the risk of both water shortages and providing their customers with water that violates
water quality standards. Off-stream blending reservoirs (OSBR), which are filled with water during
periods when the concentration of a contaminant in a water source are low, can be used to both dilute
water with contaminant concentrations above environmental standards and store water during
extended low flow periods (Figure 1.1). These reservoirs are used for blending a wide array of
contaminants, ranging from chloride reduction in northern California’s Sacramento-San Joaquin Delta
(Campbell et al., 2002) to nitrate in streams draining agricultural watersheds in the Midwest (e.g., Knapp
and Hecht, 2009). In many cases, they comprise a cheaper alternative to the purchase of treatment
technology, such as ion exchange reactors, especially for smaller community water systems.
More specifically, an OSBR contains the following basic features:
(1) A storage reservoir situated outside of the channel of the stream that provides the majority
of water supply to the reservoir via either pumping or gravity flow.
(2) A pipeline that conveys water directly from its river source to the treatment plant to avoid
depleting storage in the reservoir and take advantage of the water supply available in the
river.
(3) A pipeline that conveys water from the storage reservoir from water directly to the
treatment plant when it is necessary to dilute the concentration of a contaminant in the
2
river source or supplement water pumped from the river to the treatment plant during
drought conditions.
While the advocacy of off-stream reservoirs as an alternative to in-stream impoundments has increased
in recent years due to their reduced impacts on aquatic ecosystems, minimal sedimentation rates and a
lack of available sites for on-stream reservoir construction (Jiang et al., 2009), off-stream storage has
been used for thousands of years. Many civilizations throughout history have diverted water from rivers
with unreliable streamflow to basins, natural or artificial, in which it could be stored for agricultural and
domestic consumption. The 12th Dynasty of Ancient Egypt diverted water from the Nile River into the El
Fayyum Depression for water supply storage and flood control (Nace, 1972) while the Maya used
relatively impervious clay-lined ditches to divert water from intermittent streams. In fact, one of the
Maya’s largest urban centers, Tikal, located in present-day Guatemala, was constructed around off-
stream reservoirs (Scarborough and Gallopin, 1991).
In spite of the historic use and recent popularity of off-stream reservoirs, the design and operation of
off-stream reservoirs has not received the same research attention as in-stream impoundments
(McMahon and Adeloye, 2005). Nonetheless, literature on the design and operation of off-stream
reservoirs has begun to emerge (e.g., Knapp, 1982; Campbell et al., 2002; Jain et al., 2007).
Researching the historic use and operation of off-stream reservoirs requires familiarity with the
numerous other terms by which these reservoirs have been described, including “off-channel reservoirs”
(e.g., Hecht and Knapp, 2008; Schnier, 2009), “side-channel reservoirs” (e.g., Knapp, 1982; Koltun, 2001),
“offline reservoirs” (e.g., Cecil County Government, 2006), “upground reservoirs” (e.g., Ohio
Department of Natural Resources, 2009), off-channel containment pits (e.g., Wyoming State Engineer’s
Office, 2002) and simply “off-stream storage” (e.g., Nace, 1972). Off-stream reservoirs can be situated
in a variety of locations and serve a plethora of purposes. These reservoirs can be located in excavated

3
pits (a.k.a. cut-and-fill reservoirs) as well as impoundments on small streams in which runoff
supplements the inflow diverted into the reservoir (Knapp, 1982). In some cases, preexisting excavated
basins, such as abandoned rock quarries, can also be converted into reservoirs (Clifton, 2008; Tuley,
2008; Fang et al., 2009). Off-stream reservoirs can provide water storage and regulate the quality of
water used for many purposes, including domestic consumption (e.g., Knapp, 1982; Koltun, 2001;
Campbell et al., 2002; Nelson et al., 2006; Jain et al., 2007), irrigation (Sprague et al., 2002; Young et al.,
2004, Agüera et al., 2007; Dougherty et al., 2007; Merenlender et al., 2008), industrial (e.g., Butts et al.,
1995; Wyoming State Engineer’s Office, 2002), generating “pumped-storage” hydroelectricity (e.g.,
USBR and MWH, 2006), regulating downstream streamflow and water quality for water supply (e.g.,
Jiang et al., 2009), ecological (e.g., Tomasko et al.,2009; Ching et al., 2010) or wastewater assimilation
objectives (e.g., Chang et al., 2010) and detention storage for flood control (e.g., Nace, 1972; URS,
2008).
Jiang et al. (2009) identify site flexibility, potential for incremental development, selective withdrawal of
source water and mitigation of environmental disruption as benefits of off-stream reservoir storage for
water supply. Knapp (1982) notes that the lack of conflicting operational objectives, such as flood
control, fishery development and recreation, can allow the operation of off-stream reservoirs to be
more efficient for water supply purposes, although off-stream reservoirs can, in some cases, still provide
these benefits. Curtis et al. (2001) state that the seasonality of streamflow, land availability, distance
between reservoir and the demand site and the relative benefit-cost ratio in comparison to other water
supply options are key factors for determining the suitability of off-stream reservoirs. Knapp (1982) also
adds that the sedimentation rate in these reservoirs is usually low for three reasons: (i) the volume of
water that is directed into the reservoir is usually roughly equal to the system’s demand over a long
period and thus constitutes a small percentage of the streamflow and sediment load, (ii) most of the
annual sediment load transported by rivers occurs during a small number of events during which the
4
amount of water pumped will only constitute a very small percentage of that streamflow and(iii)
pumpage can be shut off entirely to prevent reservoir sedimentation and an increase in the turbidity of
the water it pumps to its treatment plant. Finally, off-stream reservoirs do not pose a large physical
barrier to the passage of aquatic organisms or alter downstream water quality to the same extent as on-
stream reservoirs, although system that use a low-head dam to raise the water elevation for pumping
and provide supplemental storage can impede their movement to a lesser extent.
In many situations, off-stream blending reservoirs (OSBR) are also preferable to many other types of
water sources for the same reasons as off-stream reservoirs used only for water supply. As previously
stated, the main distinguishing feature of an OSBR is its use of reservoir storage for diluting water that is
conveyed between its source river and treatment plant. In the Midwestern United States, there are at
least four communities that have implemented OSBR to both reduce the concentration of nitrate in
drinking water and drought storage. The Illinois-American Water Company has operated OSBR systems
in Streator and Pontiac, Illinois since 1988 and 1991, respectively, the latter of which is used as a case
study in this thesis. In 1992, the Environmental Protection Agency (EPA) instituted a 10 mg/L Maximum
Contaminant Level for nitrate-N. In response to this mandate, at least two small communities in Ohio
have also recently constructed new off-stream reservoirs (Braden, 2009; Flahill and Lamale, 2011).
OSBR have been used to regulate the concentration of other drinking water contaminants as well. In
California, the Contra Costa Water District uses the Los Vaqueros Reservoir to regulate the
concentration of chloride in its drinking water. In Florida, Jain et al. (2007) report that the City of Punta
Gorda (estimated 2007 population 16,000) has proposed an off-stream blending reservoir to provide
water for reducing the concentration of total dissolved solids (TDS) to 450 mg/L as water withdrawn
from its main river source (permitted withdrawals are 5.358 mgd), Shell Creek, and two supplementary
aquifer storage and recovery (ASR) wells (1 mgd) often exceeds this concentration. Furthermore, the

5
use of off-stream reservoir storage for water quality improvement has even fostered collaboration
between neighboring utilities (Knapp and Hecht, 2009). In Ohio, the system of Wauseon (population
~8,000) experienced water shortages during relatively mild droughts due to its reliance on an off-stream
reservoir in a small watershed. Meanwhile, the neighboring Napoleon system, which withdraws water
from a large river, regularly experiences nitrate-N concentration in excess of the 10 mg/L MCL, which
would be very costly for this small system (population 9,300) to reduce in a treatment plant process.
After an agreement between the two systems was forged, the Wauseon system was able to acquire
water from the Maumee River for drought storage in exchange for releasing water to Napoleon for
blending during periods of high nitrate-N concentrations in the river, which often occur during or
immediately following storms.
In addition, it should be noted that OSBR that do not possess blending capabilities can still improve the
quality of the source water by selectively withdrawing from it during periods when it is not excessively
degraded. However, systems operating these OSBR often must shut down pumping during prolonged
periods of degraded water quality. Wayne City, Illinois, which relies upon an off-stream reservoir into
which water from an intake with a 464 mi2 drainage area on the Skillet Fork of the Little Wabash River is
pumped, typically shuts off its pump during May and June when the atrazine concentration is high in the
river (Knapp and Hecht, 2009). This shutdown limits opportunities to store water in its reservoir and
increases its drought vulnerability.
Finally, costs of off-stream reservoir construction and operation are not explicitly incorporated into the
model used in this thesis because (1) the Pontiac system prioritizes filling its reservoir and delivering
water of acceptable quality over saving pumping costs (Tuley, 2010) and (2) its focus on improving the
operation of an existing system. Publications and reports in which issues of the cost of construction and
6
operating off-stream reservoirs can be found include Knapp (1982), Curtis et al. (2001), Richards (2001),
Agüera et al. (2007) and Ching et al. (2010).
1.2 Nitrate Health Hazards, Contaminant Sources and Options for Removal
from Drinking Water
Since nitrate is the primary contaminant that the OSBR in Pontiac, Illinois aims to reduce, an overview of
the health hazards it poses, sources of the contaminant in the environment and options for removing it
from drinking water is merited.
1.2.1 Health Hazards
While the concentration of nitrate in rivers and lakes has been monitored for over a century, including in
the Vermilion River1 (Keefer et al., 1996), nitrate emerged as a public health concern in the early 1950’s
after Comly (1945) attributed the incidence of methemoglobinemia, also known as blue baby syndrome,
in infants to contaminated well water and Walton (1951) linked the incidence of methemoglobinemia in
278 infants up to six months of age to drinking water with a nitrate-N (nitrate measured as nitrogen)
concentration exceeding 10 ppm (~10 mg/L.) Methemoglobinemia, also known as blue baby syndrome,
occurs when nitrate in drinking water increases the concentration of methemoglobin, normally less than
one percent in healthy individuals (Denshaw-Burke et al., 2010), to a concentration at which various
enzyme systems contained in red blood cells can no longer regulate it. In turn, the increased
concentration of methemoglobin impedes oxygen transport through the body, inducing hypoxia in
tissues. In some afflicted people, this hypoxia results in cyanosis, or the appearance of a bluish or
purplish tinge in their skin. This acute malady is often fatal if concentrations of methemoglobin in blood
exceed 70 percent before the administration of treatment, which most commonly includes a methylene
blue compound that restores iron in hemoglobin to its normal oxygen-carrying state (Denshaw-Burke et
1 Keefer et al. (1996) report that samples were collected from the river as early as 1906.
7
al., 2010). According to Cohen and Wiles (1996), an estimated seven to ten percent of
methemoglobinemia cases result in death.
The vast majority of registered methemoglobinemia cases have occurred in infants younger than six
months of age that have simultaneously undergone a gastrointestinal disturbance, possibly due to the
presence of microbial contaminants in water or food (Cohen and Wiles, 1996). However, pregnant
women (who also have elevated methemoglobin concentrations), dialysis patients and other immuno-
compromised individuals are also more vulnerable to this illness. Infants are most vulnerable because
their stomachs are less acidic, a condition which facilitates the conversion of nitrate to nitrite, and the
relative ease with which the hemoglobin in their blood can be converted into methemoglobin. The
National Academy of Sciences (1978) observed that diarrheal illnesses and other gastrointestinal
disturbances increase the incidence of methemoglobinemia since they can further increase the pH in the
stomachs of infants.
Methemoglobinemia incidence rates are often difficult to ascertain since many cases of the illness are
undocumented due to either a lack of proper reporting protocol or misdiagnosis (Cohen and Wiles,
1996). Meyer (1994, c.f. Cohen and Wiles, 1996) conducted a survey covering 12 counties dependent
upon groundwater from the Big Sioux aquifer in South Dakota, an area comprising just 0.28 percent of
the United States’ population in 1990, and noted that only two of the 80 cases that occurred between
1950 and 1980 had been previously reported. No information on the historic incidence of
methemoglobinemia in Livingston County, where the city of Pontiac is located, or the state of Illinois
was obtained for this research. Tuley (2011a) noted that cases of methemoglobinemia had been
reported in Pontiac, but did not know of any that had been associated with nitrate contamination of
drinking water. Finally, it should be noted that not all cases of methemoglobinemia can be attributed to
nitrate exposure through drinking water, as there is also a congenital form of the disease in which

8
individuals have cyanosis due to enzyme deficiencies (Denshaw-Burke et al., 2010) as well as other
sources of the acquired form, such as antibiotics, local anesthetics, and the accidental ingestion of
substances containing high concentrations of nitrate (Wikipedia, 2011).
In addition to methemoglobinemia, the presence of nitrate in drinking water has also been associated
with cancer, thyroid problems, hypertension and birth defects (Cohen and Wiles, 1996). Dietary intake
of nitrate through food or water leads to the formation of nitrite in the stomach which can, in turn, react
with a number of natural and synthetic substances and produce carcinogenic N-Nitroso compounds.
While many human epidemiological studies demonstrate links between nitrate-N and the incidence of
cancer, especially stomach cancer (e.g., Cuello, 1976; Jensen, 1982), the extent to which nitrate
contamination causes cancer is difficult to ascertain due to the complex multi-step pathways through
which cancerous cells may form. Van Maanen et al. (1994) linked thyroid hypertrophy, or enlargement,
to high concentrations of nitrate in drinking water. Several studies have correlated exposure to nitrate
in drinking water with birth defects (Cohen and Wiles, 1996), including one study in South Australia
(Dorsch et al., 1984) in which a group of participants that consumed water with a concentration greater
between just 1.1 ppm and 3.5 ppm demonstrated a birth defect rate that was three times higher than
rate of birth defects experienced among women consuming water from sources with a concentration of
less than 1.1 pm. Morton (1981) conducted a study of six watersheds in eastern Colorado and found
that the incidence of rate of hypertension in the watershed with the highest nitrate-N concentration in
drinking water (just 3.1 ppm) had a hypertension rate twice that of any of the other five watersheds.
Due to these documented associations between nitrate contamination of drinking water and disease
and the incidence of these illnesses, Cohen and Wiles (1996) advocate a stricter drinking water standard
than the current 10 mg/L (~10 ppm). One of the premises of their argument is that there is no safety
factor incorporated into the current standard based on Walton’s (1951) study, in which five infants who
9
had contracted methemoglobinemia had consumed water with a concentration between 10 ppm and 20
ppm, as well as the occurrence of the illness in infants who have been exposed to nitrate in drinking
water at a concentration less than 10 ppm (~10 mg/L) in international locales (Simon et al., 1962 c.f.
Cohen and Wiles, 1996; Sattelmacher, 1964 c.f. Cohen and Wiles, 1996). The incidence of negative
chronic health effects, associated with nitrate concentrations below 10 ppm is another foundation for
their argument. Observing that Germany and South Africa had standards of just 4.4 ppm (as of 1996),
they advocate at least two-fold reduction of the USEPA’s Maximum Contaminant Level (MCL) as well as
the establishment of a Maximum Contaminant Level Goal (MCLG), a non-enforceable standard, of 3
mg/L, which approximates a high-end value for the background nitrate-N concentration in some
aquifers.
On the other hand, some authors have questioned the links made between the presence of nitrate in
drinking water and food and the incidence of methemoglobinemia, or have stated that less conservative
standards be implemented. L’hirondel et al. (2006) challenge many of these assertions, citing two
extensive reviews (L’hirondel and L’hirondel, 2001; Addiscott, 2005)) of previous studies in which claims
linking nitrate with adverse health effects cannot be substantiated. They call for an increase in the
regulatory limit to 20 mg/L, citing the reduced water treatment costs that small systems would bear as a
benefit of this relaxation. Ward et al. (2005) echo these concerns in their review of the literature, as
they observe that the statistical correlations between nitrate exposure and health effects are weak at
best. Fewtrell (2004) cites eight separate studies that observed a correlation between gastrointestinal
illnesses and methemoglobinemia without any evidence of nitrate exposure, which suggests that some
previously made correlations between nitrate in drinking water and methemoglobinemia may have
actually been spurious. Avery (1999) hypothesizes that this correlation may be due to the effect that
nitrate in drinking water may have in exacerbating the production of methemoglobin in gastrointestinal
environments in which nitrites are being produce from nitric oxide due to infection and/or

10
inflammation. In this case, a high concentration of nitrate inhibits the conversion of nitrite to ammonia
with the bacterial enzyme nitrate reductase. Furthermore, L’hirondel et al. (2006) comment that the
nitrate content in many vegetables exceeds the regulatory standard for drinking water by at least a
factor of 50, and argue that, if drinking water with a nitrate concentration slightly above the regulatory
standard is considered toxic, then these vegetables should also be subject to the same declaration. The
The National Academy of Sciences (1985) has advocated nitrate intake standards that combine food and
water ingestion and limit the nitrate content of food marketed to infants.
Yet, in spite of this debate, the EPA Maximum Contaminant Level (MCL) standard has remained at 10
mg/L nitrate-N. In this thesis, it will be assumed that the provision of drinking water that does not
exceed this standard entirely eliminates the incidence of methemoglobinemia and other illnesses that
the contamination of drinking water with nitrate induces, an assumption that the Pontiac system also
follows (Wegman et al., 2010). In other words, the system has no added incentive to deliver finished
drinking water at a concentration even lower than the MCL. As a result, maximizing the firm yield of
the system is considered to be the objective function while water quality is merely considered as a
constraint, as described further in Section 2.2.
1.2.2 Sources, transport and fate of nitrate in the environment
Nitrate can enter lakes and reservoirs through a variety of mechanisms, including surface runoff,
groundwater discharge and atmospheric deposition. In the Midwestern United States, agriculture
runoff, much of which enters watercourses through tile drainage, contributes the majority of the nitrate
load in surface water sources (e.g., Li et al., 2010). Over the 20th century, the increased use of nitrogen-
based fertilizers has substantially elevated the nitrate-N concentrations measured in streams and rivers
throughout the region (e.g., Keefer, 1996), although Demissie et al. (1996) report that the rate of
fertilizer use has stabilized in the state of Illinois since 1980. Anthropogenic sources of nitrate that are

11
not of agricultural origin include sewage and urban runoff, but these fluxes are relatively minor in
upstream of the Pontiac intake, as farmland primarily consisting of corn and soybeans covers over 90
percent of the watershed area.
It is also important to understand the dynamics of nitrate within an OSBR. The concentration of nitrate
in a reservoir cannot simply be determined by measuring the nitrate load that enters and exits the
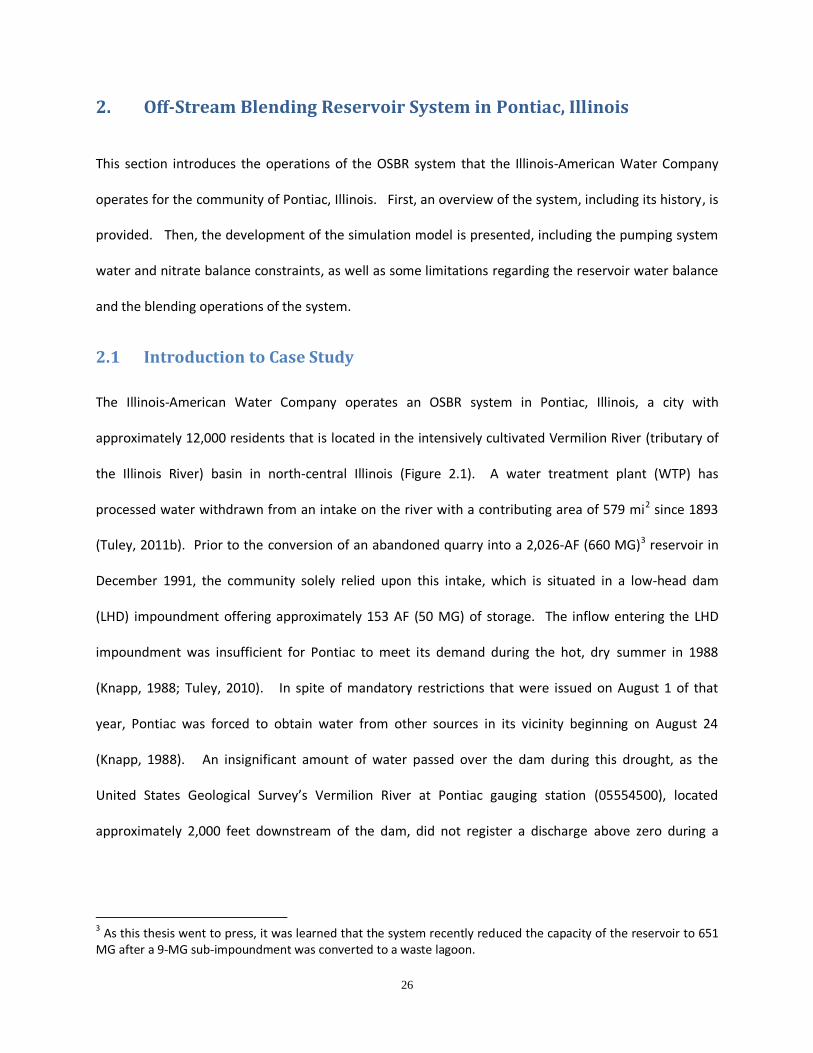
reservoir, as a number of chemical reactions can alter its concentration within a reservoir (Figure 1.5).
Therefore, it is also necessary to understand the fate of nitrogenous compounds that enter the
reservoir. First, nitrogen that enters the reservoir in the form of other nitrogenous compounds, namely
organic nitrogen (org-N) and ammonium (NH4+), can be converted into nitrate. Organic nitrogen enters
the reservoir through two pathways: (i) direct inflow through pumping and (ii) algal fixation of N2 gas,
the latter which occurs principally through cyanobacteria (blue-green algae) that contain heterocysts
(Wetzel, 2001). Organic nitrogen is subsequently converted into ammonium (NH4+) ions, usually
through the deamination of proteins, amino acids, urea and other nitrogenous compounds (Wetzel,
2001). Bacteria typically comprise the dominant source of these waste products, although higher-order
aquatic species also contribute to it. This ammonification process occurs both in the water column and
the benthic layer underlying it. Ammonia can also be transported down to the benthic layer through
adsorption on organic and inorganic particles. In addition to the ammonia that is formed from organic
nitrogen, ammonia may also enter the reservoir directly through inflow. While the ammonia
concentration in the Vermilion River typically lies below 1 mg/L, Tuley (2010) comments that releases
from hog farms upstream can cause occasional ammonia spikes in the Vermilion River that require the
system to depend on water pumped directly from the reservoir. To prevent excessive concentrations of
ammonia in drinking water, the Pontiac system currently takes thrice-daily samples of ammonia at the
same times that they sample nitrate in the river. (See Section 3.2 for more information on nitrate
sampling.)

12
There are also numerous pathways through which the concentration of ammonia in the off-stream
reservoir can be reduced. The first of these pathways is nitrification, a process which consists of a two-
stage chemical reaction that bacteria catalyze. In the first stage, Nitrosomonas bacteria convert
ammonium into nitrate:
While low concentrations of nitrate (NO2-) do exist in water bodies, usually the transformation of
ammonium into nitrite is an intermediate step, shortly after which most of the nitrite is subsequently
converted into nitrate in the following reaction that Nitrobacter bacteria typically catalyze:
A second pathway through which the concentration of ammonia can decline is biological assimilation.
Typically, bacteria can consume ammonia with less energy than they require for the ingestion of nitrate,
which, in turns requires even less energy than they need to fix N2. A third pathway is volatilization
under high pH conditions, in which NH4+ ions are transformed into zero-valent NH3, which is toxic to
aquatic organisms. Fourth, ammonium can decay through an anammox reaction (anaerobic ammonium
oxidation) in which ammonium and nitrate are directly converted into nitrogen gas (N2).
Next, nitrate, as previously discussed, can enter the reservoir directly through pumped inflow or
atmospheric deposition. As discussed in more detail in Section 4.2, nitrate can be deposited into the
reservoir through precipitation (wet deposition) or fallout (dry deposition), the latter through which
nitrate enters the reservoir in a particulate form (NO3-) or as nitric acid (HNO3), the latter which
dissociates after it enters the water. Major sinks of nitrate include denitrification, sedimentation and
biological assimilation (Saunders and Kalff, 2001). In this study, these three loss mechanisms are
collectively termed “nitrate sinks” or “nitrate losses” depending upon the context in which they are
(1.1)
(1.2)

13
discussed. First, denitrification is the biochemical reduction of oxidized nitrate that occurs
concomitantly with the oxidation of organic matter through the following sequence of reductions from
NO3- to N2 (Wetzel, 2001):
Many bacteria with nitrogen reductase enzymes can catalyze this reaction if a carbon source is available
and either anoxic or hypoxic conditions are present. The following two-step process illustrates the
reduction of NO3- to N2 using glucose as a carbon source, although this reaction can also take place with
many other types of carbon sources:
Denitrification can occur in the anoxic benthic layer of a body of water or hypoxic waters, especially the
hypolimnia of stratified lakes. Much of the nitrogen gas that results from nitrification escapes into the
atmosphere. However, cyanobacteria may fix some of it, resulting in another iteration of the nitrogen
cycle. Denitrification may also take place in the water column of a reservoir if anoxic conditions are
present, although it is likely minimal in the Pontiac reservoir since its shallow depth is not conductive to
anoxic conditions in the water column. In addition to denitrification, reservoirs can remove nitrate and
other nitrogenous compounds when they become immobilized in the sediment layer, a process that is
sometimes referred to as nitrate or nitrogen sedimentation. Nitrogenous compounds can enter the
sediment layer through adsorption to both organic and inorganic particles.
A third major pathway through which nitrate is consumed is biological assimilation. The extent to which
this assimilation occurs also depends upon the availability of phosphorus in a body of water. Chapra
(1997) notes that phosphorus is often a limiting nutrient when the nitrogen to phosphorus ratio is
(1.3)
(1.4)

14
greater than 7.2:1 while nitrogen is the limiting nutrient when the ratio is less than this value. In
addition, the rate at which nutrient assimilation occurs is highly seasonal, as algal growth typically peaks
during the spring and summer and can be especially high when algal blooms occur. This primary
productivity also reduces the concentration of ammonium in a water body. Plankton, along with
higher-order aquatic organisms, excrete the nitrogen they ingest in the form of organic nitrogen and
ammonium, which are often collectively referred to as Kjeldahl nitrogen. This process can reduce the
nitrate concentration in the reservoir in the spring and early summer (generally prior to mid-July) when
blending is often necessary due to high nitrate-N concentrations n the river. Therefore, algal growth
can elevate the firm yield of the system. However, algae also cause taste and odor problems in
drinking water and the system must apply algaecides to reduce their concentration in the reservoir.
Finally, it should be noted that the nitrogen in waste products that bacteria and higher-order animals
excrete may become nitrified again. In summary, while biological assimilation does not constitute a
true loss of nitrogen from the reservoir, its conversion of nitrate into other nitrogenous compounds can
seasonally reduce the nitrate concentration in a reservoir during the summer.
The rate at which nitrogen is removed through each of these pathways is often difficult to measure
(Saunders and Kalff, 2001; Groffman et al., 2005; Seitzenger et al., 2006), although many studies suggest
that denitrification is often the principal mechanism through which nitrate is lost (e.g., Admiraal et al.,
1988; Whitehead and Toms, 1993). Whitehead and Toms (1993) observe first-order denitrification
rates between 0.02 (0.066 ft/d) and 0.06 m/d (0.197 ft/d) at 20° C in five impounding reservoirs in
England. Furthermore, they identify five conditions that enhance denitrification in reservoirs:
(i) Shallow water produces a maximum mud surface area to water ratio.2
2 Shallow water conditions are favorable for denitrification in sediments provided that the shallow depth does not
result in a concentration of dissolved oxygen that is too high for denitrification to take place.

15
(ii) When there is no thermal stratification, the temperature of the water in contact with the
sediment is warmer, allowing for higher denitrification rate.
(iii) A long residence time extends the period during which denitrification can occur.
(iv) A high primary production rate increase the amount of biological assimilation (algal uptake)
if the zooplankton population that feeds off of the algae and phytoplankton is low.
(v) No exposure of sediments to air during drawdown.
However, while it is valuable to understand the specific process by which the concentration of nitrate
can change in a reservoir, the most important issue for this study is the overall rate at which the
concentration of nitrate can change in a reservoir over time. For this reason, a review of previous
studies on the overall rate at which the concentration can change over time, which is often referred to
as the removal or reduction rate in the literature, merits more attention. They also identify previous
studies that have shown that the “removal rate” is positively correlated with N loading rates and
residence time and is negatively associated with mean depth. Estimates of the global extent of nitrogen
removal through lentic (lake and reservoir) systems vary widely. Seitzenger et al. (2006) estimate an
annual removal rate of 11,000 kg N km-2 while Harrison et al., who include more small lakes in the
sample, generated an estimate of just 4,805 kg N km-2. Furthermore, Harrison et al. (2009) observe that
the nitrogen removal rate in temperate lakes and reservoirs ranges from 0 – 99 percent of influent
nitrogen, indicating that a wide array of factors govern the rates at which this substance can be removed
from a body of water. In central Illinois, David et al. (2006) observe that 58 percent of the nitrogen that
entered Lake Shelbyville, an 11,100-acre impounding reservoir operated by the United States Army
Corps of Engineer (USACE) on the Kaskaskia River, between 1981 and 2003 was retained.
Off-stream reservoirs, in particular, have also demonstrated to be capable of removing a large
percentage of their nitrogen loads. Sprague (2002) compared the nitrate removal rates of five off-

16
stream irrigation reservoirs in eastern Colorado and found that they removed between 49 and 88
percent of their nitrate loads during the spring filling season within a six-month period. Admiraal et al.
(1988) report that storage of water pumped from Germany’s Rhine River in a 0.6 km2 off-stream
reservoir reduced the nitrate concentration from 4 mg/L to 1 - 2 mg/L. Dougherty et al. (2007) observe
that the three-year mean of the total nitrogen concentration in a polyethylene-lined off-stream
reservoir in Alabama was 89 percent less (861.4 g/L to 96.4 g/L) than the mean concentration
sampled from its source, Limestone Creek, during the same period. However, the rate of nitrogen
losses, which occurred primarily through plankton due to the lack of an organic substrate, was unknown
because this reservoir was only filled during January and February when streamflow and water quality
conditions permitted. Furthermore, the influent concentration of nitrate is not reported in their article.
While this literature review provides an orientation to denitrification and nitrate loss rates, it is difficult
to directly apply these findings to the estimation of a plausible nitrate loss rate in Pontiac since the
sediment layer in Pontiac is unique due to its origin as a stone quarry. Unlike Lake Shelbyville, an
impounding reservoir situated above flooded farmland comprised of Mollisols with a high organic
content (David et al., 2006), the bottom of the quarry likely had very little sediment prior to its
conversion to a reservoir. While some sediment and organic matter in the form of detritus may have
accumulated since the reservoir came online in December 1991, the reservoir’s origin as a stone quarry
suggests that its denitrification rate is likely to be lower than it is in Lake Shelbyville and many other
reservoirs that flooded terrain with soils possessing a high organic content. Furthermore, the shallow
depth of the reservoir and the system’s use of algaecides likely prevent the formation of hypoxic
conditions in bottom waters in which significant quantities of nitrate can be denitrified.
Meanwhile, the algal uptake rate may be higher than in some reservoirs, as the relatively high influent
concentration of nitrate and other nitrogenous compounds trigger the growth of algae in the reservoir

17
to the extent that the system has a permit to apply algaecides. Yet, the application of these substances
likely prevents hypereutrophic conditions in which the algal uptake of nitrate would be much higher
than normal. Furthermore, the absence of a thick sediment layer on the bottom of this recently
converted quarry may limit the sedimentation rate of nitrate and other nitrogenous compounds.
However, the lack of a sediment sink for the Kjeldahl nitrogen (organic nitrogen and ammonia) that
these aquatic organisms secrete likely enhances the rate at which these compounds nitrify following the
death of these species.
1.2.3 Nitrate treatment of drinking water
Nitrate is a colorless, odorless and tasteless compound that cannot be easily removed from drinking
water through low-cost treatment methods, such as boiling, disinfection or filtration. As a result, its
removal can be quite expensive, especially for small community water systems (Washington
Department of Health, 2005; L’hirondel et al., 2006). Kapoor and Viraraghavan (1997) review numerous
methods through which nitrate can be removed from drinking water in a treatment plant, including ion
exchange (IX), reverse osmosis (RO), electrodialysis (ED), biological denitrification (with both
heterotrophic and autotrophic bacteria), chemical denitrification and combined ion exchange-biological
denitrification.
In the United States, IX is the treatment plant technology most commonly applied to reduce the
concentration of nitrate in drinking water as other technologies are either considerably more expensive,
e.g., RO, and/or less established, e.g., biological denitrification (Karoop and Viraraghavan, 1997).
Nevertheless, the capital and operation costs of IX systems are still often prohibitive for small water
systems (Washington Department of Health, 2005). IX costs can be especially high if the concentration
of sulfate in the source of water is high enough to require a nitrate-selective resin, as binding sites on
non-selective resins will preferentially attract sulfate ions over their nitrate counterparts. The operation

18
of an ion exchange plant also requires a large energy input. The disposal of the brine generated through
the treatment costs can be quite costly if the system is not located adjacent to the coast or a large
inland body of water. In addition to these high capital and operation costs, the investment in an ion
exchange facility is risky. For instance, the OSBR system that the Illinois-American Water Company
operates in Streator, Illinois, located approximately 30 river miles downstream from Pontiac on the
Vermilion River, invested in an IX facility after its small off-stream reservoir (240 MG) could not provide
enough water for blending in 1998. However, since then, the system has been able to rely entirely on its
blending reservoir without activating its IX facility once (Wegman et al., 2010). In the Midwestern United
States, community water systems serving populations reliant upon surface water sources with nitrate-N
concentrations greater than 10 mg/L at times that have purchased IX systems generally have a service
area population of at least 50,000. These systems include the Bloomington, Danville (Aqua Illinois),
Decatur and Springfield systems in Illinois as well as the utility serving Des Moines, Iowa.
The Washington Department of Health (2004) recommends blending – albeit with groundwater- as one
alternative for small water systems with nitrate contamination problems. In fact, a number of smaller
systems in the Midwest, including the Pontiac system (service area population of 12,000), have opted to
use OSBR instead of investing in IX or other treatment plant facilities. OSBR are best suited for systems
dependent upon surface water sources with nitrate-N concentrations that periodically exceed the
USEPA’s MCL of 10 mg/L and can also benefit from the storage that the reservoir offers in case low flow
conditions limit water supply provided that the benefit-cost ratio of constructing or developing a new
reservoir is greater than it is for the development or expansion of other sources.
As indicated in Section 1.2.2, OSBR can also function as pre-treatment basins in which the nitrate-N
concentration of influent water can be reduced through mechanisms such as denitrification and
biological assimilation (Admiraal et al., 1988; Sprague et al., 2002; Dougherty et al, 2007). In addition to

19
their ability to facilitate the removal of nitrate from drinking water, these reservoirs can also serve as
settling basins to reduce turbidity in drinking water, although most systems refrain from filling their
reservoirs during periods of high turbidity that often follow storms.
1.3 Research Objectives and Novel Aspects
While the review of off-stream reservoirs in Section 1.2 demonstrates the emergence of a literature on
off-stream reservoirs, few studies have thoroughly examined the operation of OSBRs. The research
contained in this thesis is conducted with two overarching objectives:
1. Simulate a simplified version of the OSBR serving Pontiac, Illinois to produce generalizable
findings about the operation of OSBR, in particular ones used to regulate the concentration of
nitrate, a non-conservative contaminant, in drinking water. (See Section 2 for a description of
the OSBR system that serves Pontiac and simplifications used in the simulation model and
Section 4 for a description of the data used in these simulations.)
2. Conduct a preliminary analysis of the drought vulnerability of the OSBR system serving Pontiac,
Illinois and identify further work needed for a reasonably accurate assessment.
This section focuses on the novel aspects addressed through the first objective. Previous literature on
OSBR was reviewed to identify opportunities for novel contributions that could advance the
understanding of OSBR operations. The main precursor to this research published in a peer-reviewed
journal is a study by Campbell et al. (2002) on the operation of the Los Vaqueros Reservoir, an off-
stream blending reservoir that serves the Contra Costa Water District in northern California, which had a
service area population (SAP) of approximately 450,000 people in 1996. They employ a linear
programming approach within a simulation model to manage the concentration of chloride, a
conservative contaminant, in its finished water. Using a 1922-1991 hydrologic record and modeled
20
chloride concentrations, they simulate the percentage of time the delivered water meets their internally
determined target (65 mg/L) and the average water quality of their deliveries to subjectively identify an
optimal reservoir inflow concentration limit. Although they mathematically characterize their problem
in a supply maximization formulation, the objective of the study is to determine the optimal range of
chloride concentrations in delivered water as opposed to determining the maximum firm yield under a
series of water quality constraints. This formulation suits their study well, as the main concern is the
water quality of delivered water while droughts constitute a secondary concern in the Sacramento-San
Joaquin Delta from which they obtain their water. Furthermore, since the salinity of water is an
aesthetic characteristic for which the tolerance of customers gradually becomes lower as the salinity
rises, there is no threshold value below which it must remain, which makes it more difficult to
incorporate it into an operations model as a constraint.
On the other hand, some OSBR also face considerable water shortage hazards due to low flow
conditions. Under these circumstances, the restriction of inflow into the reservoir due to water quality
concerns can have a substantial impact on the system’s firm yield. In addition, some systems may face
water quality problems with substances whose presence in source water is tolerable as long as their
concentration does not exceed a particular threshold. If these two conditions are present, it is better
to formulate the problem as a water supply maximization problem that incorporates water quality
management objectives as constraints. The Pontiac system has these two characteristics, as the system
must experience severe drought in 1988 when streamflow available from its Vermilion River source was
inadequate for sustaining the community’s demand. In addition to this basic difference in the
conceptualization of the primary system objectives from Campbell et al. (2002), this thesis expands the
research on the operation of OSBR in four principal ways:

21
1.3.1 Comparing the firm yield obtained under three types of water quality operating rules
Many water utilities (Campbell et al., 2002; Hecht and Knapp, 2008) that use OSBR to regulate
concentrations of both conservative and non-conservative contaminants control the influx of
contaminants into the reservoir by placing a limit on the source water concentration during which
diversions can occur. However, using only source water concentration as a criterion for diversion
decisions, may limit opportunities to refill the reservoir, especially when the concentration of a
contaminant in the reservoir is quite low. Therefore, the use of alternative reservoir concentration
rules in which the reservoir can be filled as long as it does not exceed a given threshold concentration is
also tested. Yet placing no restrictions on the quality of water diverted into a reservoir may cause
exceedingly high concentrations of a contaminant to enter a reservoir. Permitting this poor-quality
water to enter the reservoir may, in fact, cause more water to be released during blending. The impact
that these rules have on the firm yield are compared under a range of constraint values. In this thesis,
these three types of water quality constraints are often referred to as operating rules. See Section 3.3
for more information.
1.3.2 Identifying general considerations for the selection of water quality constraints
To maximize the firm yield of their systems, OSBR operators strive to divert as much as water as possible
into their reservoirs while also minimizing the amount of water released for blending. Unlike other
reservoirs, OSBR operators aim to minimize releases from the reservoir to the treatment plant because
their objective is to pump water directly from the river to the treatment plant as often as possible so
that they can maximize reservoir storage in preparation for drought. Campbell et al. (2002) explore this
tradeoff and observe that relaxing the maximum chloride concentration of water that can be pumped
into the Los Vaqueros Reservoir to increase storage has the consequence of increasing the average
chloride concentration in its finished water. While it is obvious that relaxing water quality constraints
will result in a higher concentration of a contaminant in a reservoir, one major question that was not

22
addressed in Campbell et al. (2002) is whether the relationship between the maximum inflow
concentration of a contaminant and the firm yield of a system is always monotonically increasing. In
particular, is there a maximum reservoir inflow concentration above which the firm yield begins to
decline due to an excessive blending demand? Under what circumstances can this type of relationship
occur? These questions are evaluated repeatedly in the interpretation of the results. An appendix is
also devoted to a numerical example of a hypothetical OSBR system that shows the effect that a
capacity constraint can have on this relationship.
1.3.3 Identifying factors that limit the firm yield of off-stream blending reservoir systems
To prescribe changes in operation rules that augment the firm yield of an off-stream reservoir, it is
necessary to be able to identify factors that constrain its firm yield. Four principal factors limit the firm
yield of an off-stream reservoir: water supply, diversion capacity, storage capacity and water quality.
The water supply available at a particular location, both streamflow and on surface precipitation, places
an upper bound on the amount of water that is available for use. However, unlike an on-stream
reservoir, an off-stream reservoir does not capture all of the streamflow generated in the watershed
upstream of its intake. As a result, the capacity to divert water – through pumping or a gravity flow
intake - places an additional constraint on an off-stream reservoir system’s water supply. Next, the
capacity of the reservoir itself limits the quantity of water that can be stored. Then, even if there is
ample flow and spare capacity, pumping still might not be possible due to water quality constraints.
Maintaining downstream flows for other downstream users, wastewater assimilation and aquatic
ecosystems also must be taken into account in most cases.
Previous research has examined these disparate limiting factors on the firm yield and reliability of off-
stream blending reservoir systems. In a study of the water system serving Punta Gorda, Florida, Jain et
al. (2007) evaluated the reliability of proposed off-stream reservoir and two existing aquifer storage and

23
recovery (ASR) wells under three scenarios: (i) water quantity constraints, (ii) water quality constraints
and (iii) both water quantity and quality constraints. This reliability-based assessment is appropriate
given that the reservoir is being used to dilute the concentration of total dissolved solids (TDS), a
contaminant whose impact on water conveyance infrastructure, home appliances and aesthetic quality
gradually declines as the concentration of TDS rises. On the other hand, nitrate is a contaminant that
poses an acute health hazard (methemoglobinemia) when present in concentrations above a given
threshold, which for all practical purposes is the 10 mg/L nitrate-N Maximum Contaminant Level (MCL)
that the Environmental Protection Agency has established. A single nitrate-N sample exceeding this
MCL constitutes a violation, which systems must report to the EPA and the public. Recurrent violations
can result in fines and other penalties. Thus, a different approach for assessing the extent to which
streamflow and water quality constraints limit the supply to a system is needed.
In addition, the interdependence between these limiting factors, especially streamflow and water
quality, is valuable given documented relationships between rainfall and water quality in the Midwest.
Li et al. (2010) observe that nitrogen tends to accumulate during dry years and is released into the
stream network during wet years in the Sangamon River, another watershed in central Illinois with a
predominant corn and soybean land cover and widespread tile drainage. In fact, Keefer et al. (1996)
limit the monitoring in the Vermilion watershed due its similarity to the Sangamon River watershed in
which a long-term monitoring program was already established. Yet, the implications of these temporal
correlations on the supply available to OSBR systems have received little attention.
1.3.4. Evaluating the sensitivity of the firm yield to contaminant decay rates
Campbell et al. (2002) study an OSBR used to regulate the concentration of chloride, a conservative
contaminant, in drinking water. Several studies (e.g., Admiraal et al., 1988; Sprague, 2002; Dougherty,
2007) that have quantified the extent to which nitrate sinks can reduce the concentration of nitrate-N in

24
an off-stream reservoir over time, by explicitly examining the sensitivity of the firm yield to the nitrate
loss rate. However, no other studies on the impact of the decay rates of contaminants on OSBR firm
yields could be found. This study investigates the extent to which contaminant decay rates may affect
the firm yield of a system under the three types of water quality constraints introduced in Section 1.4.3.
The sensitivity of storage-yield curves to nitrate loss rates are also explored to evaluate the extent to
which innovations in reservoir design that enhance nitrate losses could potentially reduce the storage
capacity required to achieve a given firm yield.
1.4 Thesis Structure
Section 2 describes the OSBR system that serves Pontiac, Illinois (service area population ~ 12,000) and
the water and nitrate balances that are used to track the storage and nitrate-N concentration in the
reservoir. Section 3 presents the methods used to address the four general OSBR research objectives as
well as conduct a preliminary assessment of the drought vulnerability of the system. Section 4 details
the data used to develop the simulation model. Section 5 contains the results of the analyses
presented in Section 3. Section 6 discusses the implications of the assumptions implicit in the model on
the estimates of firm yield. Finally, Section 7, summarize the main results of the research and identifies
future directions for research.
25
Figures and Tables
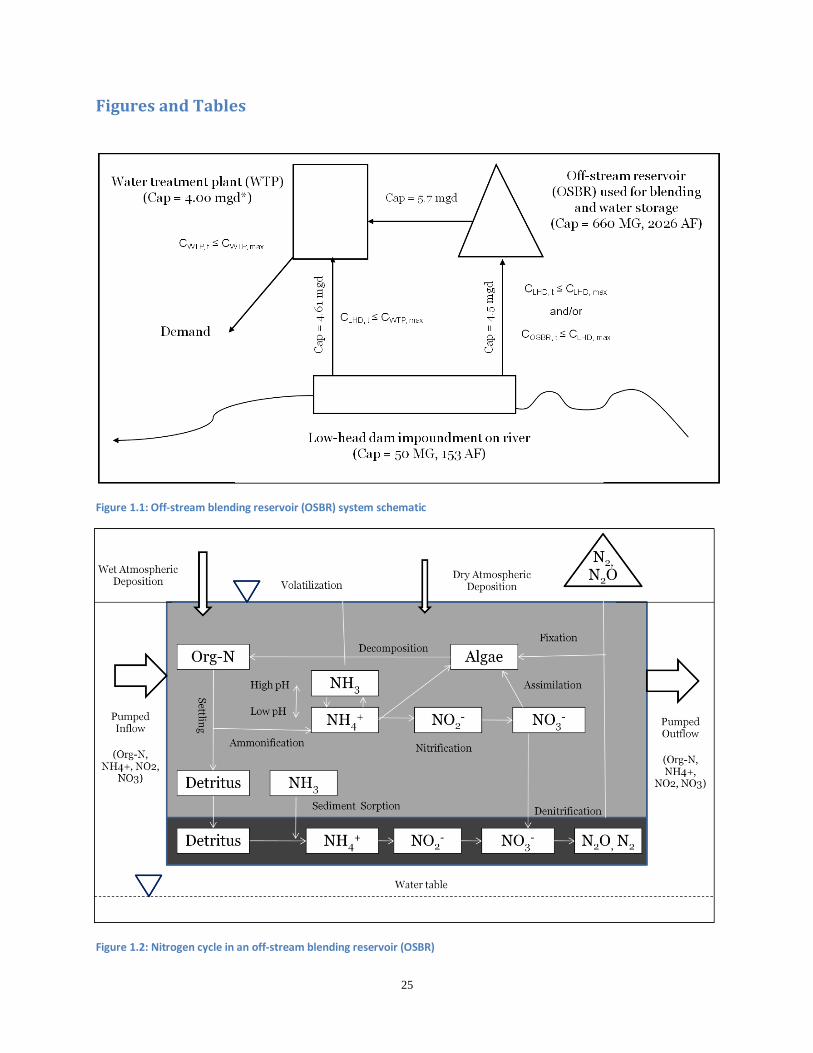
Figure 1.1: Off-stream blending reservoir (OSBR) system schematic
Figure 1.2: Nitrogen cycle in an off-stream blending reservoir (OSBR)
26
2. Off-Stream Blending Reservoir System in Pontiac, Illinois
This section introduces the operations of the OSBR system that the Illinois-American Water Company
operates for the community of Pontiac, Illinois. First, an overview of the system, including its history, is
provided. Then, the development of the simulation model is presented, including the pumping system
water and nitrate balance constraints, as well as some limitations regarding the reservoir water balance
and the blending operations of the system.
2.1 Introduction to Case Study
The Illinois-American Water Company operates an OSBR system in Pontiac, Illinois, a city with
approximately 12,000 residents that is located in the intensively cultivated Vermilion River (tributary of
the Illinois River) basin in north-central Illinois (Figure 2.1). A water treatment plant (WTP) has
processed water withdrawn from an intake on the river with a contributing area of 579 mi2 since 1893
(Tuley, 2011b). Prior to the conversion of an abandoned quarry into a 2,026-AF (660 MG)3 reservoir in
December 1991, the community solely relied upon this intake, which is situated in a low-head dam
(LHD) impoundment offering approximately 153 AF (50 MG) of storage. The inflow entering the LHD
impoundment was insufficient for Pontiac to meet its demand during the hot, dry summer in 1988
(Knapp, 1988; Tuley, 2010). In spite of mandatory restrictions that were issued on August 1 of that
year, Pontiac was forced to obtain water from other sources in its vicinity beginning on August 24
(Knapp, 1988). An insignificant amount of water passed over the dam during this drought, as the
United States Geological Survey’s Vermilion River at Pontiac gauging station (05554500), located
approximately 2,000 feet downstream of the dam, did not register a discharge above zero during a
3 As this thesis went to press, it was learned that the system recently reduced the capacity of the reservoir to 651
MG after a 9-MG sub-impoundment was converted to a waste lagoon.

27
period running from July 1 to November 10 of this year (Figure 2.2). Figure 2.2 contains a map of the
Pontiac system.
In response to this drought, Pontiac purchased a 325-acre plot of land containing an abandoned stone
quarry in 1990 (Tuley, 2010) to develop an off-stream reservoir. This reservoir also offered a way for
the system to reliably reduce the nitrate-N concentration in its drinking water below 10 mg/L, a
Maximum Contaminant Level (MCL) that the United States Environmental Protection Agency instituted
in 1992. Ever since the OSBR system was implemented, Pontiac has not faced any water shortages,
issued any mandatory water restrictions or had any water quality violations due to an impending water
shortage. However, low-flow conditions as severe as the ones experienced in 1988 have yet to recur
since 1992. (For more information on the historic streamflow at the Pontiac intake, please refer to
Section 4.1.)
The high nitrate concentrations in the Vermilion River that constrain the water supply available to
Pontiac originate from the widespread application of nitrogenous crop fertilizers in the watershed, more
than ninety percent of which is devoted to agricultural production (Keefer et al. 1996; Tuley, 2008). It
is also important to understand the seasonality of nitrate concentrations in the Vermilion River
watershed, especially their relationship with the timing of fertilizer applications. 54 percent of the
fertilizer applied in east-central Illinois between 1994 and 2003 was applied during the fall, as many
farmers apply the majority of the nitrogen-based fertilizer in their corn fields following the end of the
growing season (Illinois Department of Agriculture, c.f. Royer et al., 2006). The major impetus for this
practice is to have the field completely fertilized in preparation for the spring planting season, the dates
for which cannot be forecast far in advance. Also, laborers employed by large farms to apply fertilizer
following the harvest are also hired during the spring to help with planting (Gillespie, 2011). Another
disadvantage to spring application of fertilizer is the possibility of loss of nitrogen to denitrification in

28
wet soil conditions that are often present during this time of year. However, during the spring, many
farmers also apply additional fertilizer to individual plants that have already germinated through a
technique known as side-dressing.
The fall application of nitrate results in a sharp rise in the Vermilion nitrate-N concentration after it
experiences a mid- to late-summer minimum when crop uptake of fertilizer and soil-based
denitrification during the warm and wet conditions of summer limit the availability of nitrate that can be
transported into the local stream network during precipitation events (Figure 2.3). The average nitrate-
N concentration during the 20-year study period in November is 6.03 mg/L as compared to just 3.69
mg/L in October. The average monthly concentration rises further to 9.26 mg/L in December and 10.14
mg/L in January. The concentrations are the highest during the spring as nitrate that originates from
newly applied nitrogenous fertilizer in the spring is added to the load that has accumulated from the
previous fall and earlier periods. On average, April registers the highest nitrate-N concentration (12.7
mg/L) while May and June follow with concentrations of 11.8 and 11.5 mg/L, respectively. In addition
to the second round of fertilizer input, the spring is the season with the most rainfall (Figure 2.4), as the
average precipitation from April – June is 15.9 inches as opposed to the October- December average of
just 11.4 inches (Figure 1.3). The percentage of precipitation that enters streams as runoff during the
spring is higher than it is during the fall. Moreover, during the spring, the water table is highest, which
causes the tile drains that regulate the depth of the water table before fields to flow frequently. Also,
during the spring, snowmelt can produce saturated soil conditions that inhibit infiltration during the
spring while high evapotranspiration rates during summer create soil moisture storage capacity for fall
precipitation.
During the middle of the summer, the nitrate-N concentration in the Vermilion River declines rapidly
due to crop uptake and denitrification in the soil, although during years when summer storms mobilize

29
available nitrate, this drop takes place a bit later. The average concentration in July falls to 7.6 mg/L
while the average falls further to 4.0 mg/L in August and 2.7 mg/L in September. This abrupt decline is
not concurrent with one in precipitation, as the average July – September precipitation is 14.7 inches.
Rather, crops have already consumed some of the fertilizer applied in the fall and spring and water does
not run through tile drains, which are a major conduit for nitrate transport, as frequently during the
summer due to a decline in the water table elevation.
In addition, an annual cycle of nitrate-N concentrations in the Vermilion River is evident, the interannual
variability of precipitation, in particular the timing of storms, induces a large degree of interannual
variability in the nitrate-N concentrations encountered in the river (Figure 2.5). Moreover, nitrate
concentrations in rivers draining agricultural districts in the Midwestern United States are often higher
than normal in years following droughts because the amount of unused fertilizer that accumulates in the
soil during them (Li et al., 2010). The impact of this drought period – high nitrate concentration period
sequence on water storage in an OSBR is investigated in this thesis.
2.2 Development of Simulation Model
2.2.1 Model Objective
To assess the vulnerability of a community water system, it is necessary to compute the firm yield, the
maximum yield that can be sustained over a given period, often the available hydrologic record, without
the occurrence of any shortages (Archfield and Vogel, 2005). In an OSBR system, water quality
constraints on water availability must also be taken into account by prohibiting the occurrence of any
water quality violations as well. A simulation model with a daily time step was used to compute the
firm yield of the Pontiac water system given a record of daily streamflow and nitrate-N concentrations
spanning from May 1, 1979 and April 30, 1999. This period of record was chosen based on the
availability of streamflow, nitrate-N concentrations in the Vermilion River and wet atmospheric

30
deposition, dry deposition nitrate-N flux and water demand, the latter which is necessary for adjusting
the streamflow records for withdrawals from the Vermilion River. (More information about these data
can be found in Chapter 4.) It is assumed that the OSBR, which came online in December 1991, is in
place during the entire twenty-year simulation period since the motive of this investigation is to
evaluate the vulnerability of the current water supply system rather than simulate its historic operation.
Likewise, since the objective of this research is to compute the firm yield of a system under a given set
rules rather than to simulate historic pumping, there is no need to calibrate the model. Furthermore,
the reservoir did not come online until late 1991 and daily pumping records were not available.
Simulations commence with a full reservoir and a reservoir nitrate-N concentration set to 2 mg/L. Since
the most severe streamflow deficit (1988) and the two years with the highest nitrate-N concentrations
(1989, 1990) occur roughly a decade after the outset of the simulation in 1979, the firm yield is not
sensitive to these initial values. Daily streamflow data from the USGS Vermilion River at Pontiac
gauging station (05554500), located 2,000 ft downstream from the low-head dam (LHD) are adjusted for
upstream withdrawals at the Pontiac intake and the detention and evaporation that results from the
complete impoundment of inflow during extreme low-flow conditions. Daily nitrate-N concentrations
were measured using grab samples taken from shore on a weekly basis from May 1979 – February 1988,
and at least once a day from March 1988 – April 1999. Daily nitrate-N concentrations during the period
when only quasi-weekly sampling took place are estimated using a simple linear interpolation scheme.
The objective function of the model is to simply maximize the firm yield, or the demand, , that can be
fulfilled without the occurrence of any shortages due to either water supply deficits or water quality
violations:
(2.1)
31
In this thesis, the firm yield refers to the total volume of water pumped to the water treatment plant
(WTP) from the LHD impoundment, and OSBR, , rather than deliveries from the
reservoir alone:
Since this model is run with a daily time step, the objective is to find the highest average daily demand
rate at which water can be supplied to the community on a daily basis without any shortages. This rate
is modified by a pre-determined monthly demand function in which the daily demand in July is 112
percent of the average daily demand and the January demand is only 88 percent of the average daily
demand. The demand is measured in terms of the raw water supply needed to supply the community
and not metered water consumption. Therefore, water used in the WTP and unaccounted for losses,
are considered to be components of the water demand, even though customers do not actually use this
water. The monthly demand function and other aspects of demand data used in this investigation are
discussed in further detail in Section 4.5.
Drought-induced shortages take place when there is an insufficient supply of water that can be
conveyed to the WTP. Water cannot be pumped from the reservoir when its storage is below 20
percent (405.2 AF) of its total capacity (2,026 AF) whereas water in the low-head dam impoundment
cannot be pumped when its storage falls below 30 percent (45.6 AF) of its total capacity (153 AF).
Water quality-induced shortages occur when the concentration of water delivered to the treatment
plant exceeds a threshold value set below the 10 mg/L Maximum Contaminant Level for nitrate-N
henceforth referred to as . A safety factor must be incorporated into because the
nitrate-N concentrations in samples of finished water taken from a tap in the treatment plant are not
always identical to samples of influent water, which is monitored continuously. The Illinois-American
Water Company reported that is set to 8 mg/L under normal conditions, although they may
(2.2)

32
raise it to 9 mg/L under adverse conditions at their own discretion (Tuley, 2010). In this study, the value
of is 8 mg/L under normal conditions and rises to 9 mg/L when storage in the OSBR falls when
storage in the reservoir falls below a blending reserve requirement of 40 percent (25 percent of
available storage). The Pontiac system does not place any additional value on lowering the nitrate-N
concentration in drinking water below (Wegman et al., 2010), which justifies the
incorporation of water quality in the model as a constraint rather than a second objective. Scenarios in
which operators may want to increase the safety factor or incorporated their own opinion about the
health risk of nitrate can be implemented simply by lowering the value of .
Next, the decision variables are:
1. The volume of water pumped from the river to the reservoir, , on each day, .
2. The volume of water pumped from the river to the water treatment plant, , on each
day, .
3. The volume of water pumped from the reservoir to the treatment plant, ,on each
day, t.
The second and third decisions are dependent, as the total amount of water that arrives at the WTP
must equal the daily demand. The blending and drought shortage situations in which releases from the
reservoir are necessary are described further in the subsequent section.
Note that the Vermilion River is often used interchangeably with the LHD impoundment when
describing the location at which water is first withdrawn in the Pontiac system. Meanwhile, the OSBR
is commonly referred to as the reservoir. The term reservoir is never used to signify the low-head dam
impoundment.
33
2.2.2 Pumping System Operations
This section describes the pumping capacity, water quality and water supply constraints that guide
pumping decisions. It is assumed that operators respond instantaneously to water quality and water
supply conditions. As illustrated in Figure 1.1, water in the LHD impoundment in the river can be
pumped to (1) the off-stream blending reservoir or (2) directly to the treatment plant. One fixed-speed
pump with a capacity of 3,125 gpm (4.5 mgd, 13.82 AF/d) can transfer water from the river to the OSBR.
Four additional pumps, rated at 400 gpm, 700 gpm, 700 gpm and 1,400 gpm, respectively, convey water
directly from the river to the treatment plant (Figure 2.6).4 Since these pumping rates can be sustained
when all four pumps are simultaneously operated, the total volume that can be pumped to the
treatment plant from these four pumps in one day is 4.61 mgd (14.14 AF/d), which is more than twice as
much as the system’s 2005-2009 average daily demand of 1.95 mgd (IWIP, 2009; Tuley, 2010).5 Finally,
two 1,700-gpm pumps and one 500-gpm pump can transport water from the reservoir to the treatment
plant, allowing up to 5.61 mgd (17.21 AF/d) to be pumped to the treatment plant on each day if needed.
However, the capacity of the WTP limits the maximum daily to demand 4.00 mgd. Furthermore, in this
simulation model, the water demand in July is assumed to be 112 percent of the average daily demand
based on seasonal variation in demand that Tuley (2010) reported. Thus, the maximum average daily
demand that the system can supply is 3.57 mgd, which far exceeds the 2005-09 average of 1.95 mgd.
More information on the water demand of the system can be found in Section 4.5.
Since all of the pumps withdraw water from impoundments, the only condition necessary for operating
these pumps is that the water level in these bodies of water be high enough to submerge the pump
4 As shown in Figure 2.6, there is one variable frequency drive (VFD) that can be used on either one of the 700-gpm pumps that convey water from the LHD impoundment to the WTP. However, this flexibility does not affect the firm yield because the ability to pump is based on a minimum storage in the LHD impoundment rather than a minimum flow rate. 5 The pump that normally fills the OSBR can also be used to convey water to the treatment plant if needed.
However, this component of the system is not simulated in the analysis because it primarily fulfills water needs for short-term emergencies, such as fire flows.

34
intake. The use of a portable pump to deliver water to the WTP from the reservoir or river during a
drought is not considered in this study since it would only provide a short-term solution to the system’s
drought problem and does not constitute a situation for which the community would like to plan.6 The
only restrictions on pumping rates are the maximum daily pumping rates between the river, reservoir
and treatment plant, as the system prioritizes drought preparation over energy cost savings (Tuley,
2010). Otherwise, any amount of water less than the maximum daily pumping rates can be conveyed
because it is possible for pumps to only be operated during part of a day. In fact, the pumps that direct
water to the WTP do not typically operate at capacity given that the pumping capacity far exceeds the
current daily demand. In addition, routine maintenance and mechanical failures are not incorporated
into the analysis. Finally, the exchange of water between sub-basins in the OSBR through valves and
pumping is not modeled. A more detailed description of these exchanges can be found in Section
2.2.5.
Pumping decision rules are based upon a set of operational priorities that differ between periods during
which water is flowing over the low-head dam and ones during which it is not. When water is flowing
over the dam, the system operates under the following rules:
1. The reservoir is filled as much as possible if is below the maximum concentration of
nitrate-N in the river that can be pumped into the reservoir, , which is currently set to
4 mg/L. The maximum daily pumping rate is 13.82 AF (4.5 mgd). Operators will often pump for
24 hours when possible due to the uncertainty of the water supply (Tuley, 2008).
2. If , and water is still flowing over the LHD after the water pumped to the
reservoir has been accounted for, the entire daily demand is pumped from the river to the
6 Note that, in some cases, the relatively low cost of failure incurred through the use of a portable pump may be
taken into consideration when a system uses a drought vulnerability study to determine whether or not expanding a reservoir or acquiring new sources is necessary. In addition, Tuley (2011a) noted that the privately-owned quarry located immediately to the east of the OSBR could possibly provide an emergency source of water.

35
treatment plant. Otherwise, revert to the pumping priorities for situations in which water is not
flowing over the dam.
3. If , then blending is necessary. The amount of water pumped from the LHD
and OSBR is determined using the equations below. Under these circumstances, it is assumed
that the nitrate-N concentration of the blended water is exactly . The implications of
this assumption are discussed in Section 2.2.6 and then considered in the evaluation of the
uncertainty of the model results.
During an extended period of high nitrate-N concentrations, the reservoir may become seriously
depleted. To reduce the releases from the reservoir, the system may relax the constraint. To
acknowledge this adaptive behavior in the model, is raised to 9 mg/L when the storage in the
reservoir falls below 40 percent of total OSBR storage (25 percent of available storage). The sensitivity
of the firm yield to this parameter, henceforth termed the Blending Reserve Requirement (BRR), is
evaluated in Chapter 5.
On the other hand, when water ceases from flowing over the dam, the system places a priority on
maintaining water levels in the LHD impoundment. While there are no downstream flow requirements,
keeping the water level as high as possible enables the river to begin flowing over the dam again sooner.
This outflow is necessary for downstream water users, e.g., the Illinois-American Water Company
system serving the community of Streator 30 miles downstream, aquatic ecosystems and the
assimilation of wastewater discharges from the Pontiac wastewater treatment plant and other
downstream facilities. As a result, water is not typically pumped to fill the reservoir in order to maintain
(2.3a)
(2.3b)
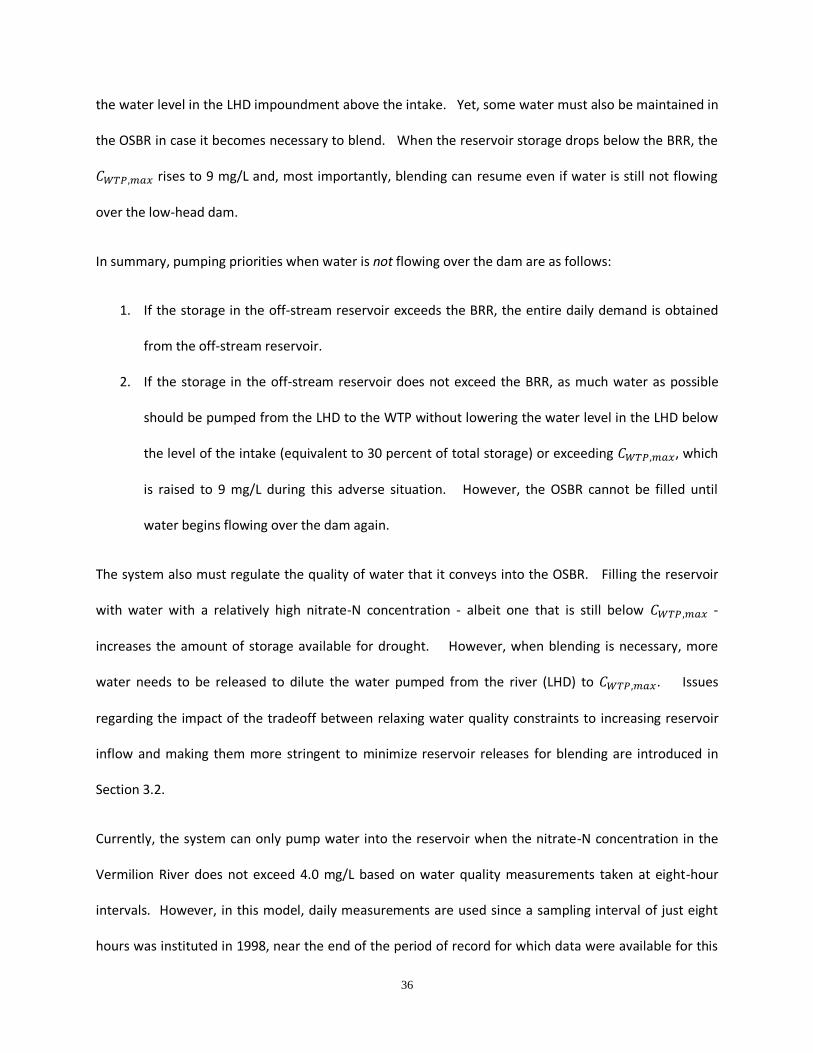
36
the water level in the LHD impoundment above the intake. Yet, some water must also be maintained in
the OSBR in case it becomes necessary to blend. When the reservoir storage drops below the BRR, the
rises to 9 mg/L and, most importantly, blending can resume even if water is still not flowing
over the low-head dam.
In summary, pumping priorities when water is not flowing over the dam are as follows:
1. If the storage in the off-stream reservoir exceeds the BRR, the entire daily demand is obtained
from the off-stream reservoir.
2. If the storage in the off-stream reservoir does not exceed the BRR, as much water as possible
should be pumped from the LHD to the WTP without lowering the water level in the LHD below
the level of the intake (equivalent to 30 percent of total storage) or exceeding , which
is raised to 9 mg/L during this adverse situation. However, the OSBR cannot be filled until
water begins flowing over the dam again.
The system also must regulate the quality of water that it conveys into the OSBR. Filling the reservoir
with water with a relatively high nitrate-N concentration - albeit one that is still below -
increases the amount of storage available for drought. However, when blending is necessary, more
water needs to be released to dilute the water pumped from the river (LHD) to . Issues
regarding the impact of the tradeoff between relaxing water quality constraints to increasing reservoir
inflow and making them more stringent to minimize reservoir releases for blending are introduced in
Section 3.2.
Currently, the system can only pump water into the reservoir when the nitrate-N concentration in the
Vermilion River does not exceed 4.0 mg/L based on water quality measurements taken at eight-hour
intervals. However, in this model, daily measurements are used since a sampling interval of just eight
hours was instituted in 1998, near the end of the period of record for which data were available for this

37
study.7 This maximum river nitrate-N concentration is henceforth referred to as . Alternative
operating rules in which inflows are regulated using a maximum reservoir nitrate-N concentration,
, or both a and a are also tested in this study. These operating rules are
described further in Section 3.3.
2.2.3 Water Balance Equations
Water balance equations are used to compute the change in storage in both the LHD impoundment
(LHD) and the (OSBR). The storage at the end of each day,
, in the LHD impoundment, which has a capacity, , of 153 AF and a surface area of 38 acres
when the water level is at the crest of the dam, is computed as follows:
where is the minimum of the water balance on day t and the storage capacity of the
impoundment, . represents the inflow into the impoundment, while and
indicate the volume of water pumped to the OSBR and WTP, respectively. The net
evaporation, , is assumed to be zero unless water is not flowing over the dam. The surface
area of the LHD (38 ac) is assumed to be constant regardless of the depth or storage in the
impoundment.
Next, Pontiac fills its reservoir with a single 13.82-AF (4.5 mgd, 3,125 gpm) fixed-speed pump. The
model assumes that this pump will operate for a full twenty-four hour day if there is sufficient water
available in the river and the river nitrate-N concentration is sufficiently low. Water pumped into and
out of the OSBR on each day can be tracked using the following equation:
7 Note that staff from the Illinois-American Water Company could not find records of nitrate-N samples during a
period between 1999 and 2002.
(2.4)
(2.5)

38
where is the storage in the OSBR at the beginning of day . Finally, the water pumped to the
treatment from both the river and reservoir must be equal to the demand on a given day, as stated in
Equation 2.2. The failure to meet this demand results in a shortage.
2.2.4 Nitrate Balance Equations
Nitrate balance equations were also created for the OSBR and WTP. The change in the nitrate
concentration, C, in the OSBR during a day, t, is computed as follows:
This equation states the rate of change of the mass of nitrate, , in the reservoir, where C is the
concentration of nitrate in the reservoir and S is the storage volume in the reservoir, is a function of
inflows and outflows of nitrate as well as nitrate sinks within the reservoir. Inflows of nitrate include
water pumped from the river to the reservoir, , as well as wet atmospheric
deposition, , and the load of the dry atmospheric deposition, . Water pumped to
the treatment plant, , constitutes the only outflow. Nitrate stored within the reservoir also
decays through denitrification and other mechanisms discussed in Section 1.2.2.
The decision to use a single first-order nitrate loss rate to examine the sensitivity of the firm yield to
nitrate losses is based upon the assumptions of (i) a reservoir with a homogeneous temperature and
uniform concentration of organic substrates and dissolved oxygen in its sediment discussed in Section
1.2.2 and that (ii) denitrification is a major mechanism through which nitrate decays in the reservoir.
The first-order areal decay rate, , is computed using the following equation (Whitehead and Toms,
1993):
(2.6)
(2.7)

39
corresponds to the first-order areal decay rate that occurs when the water temperature is 20° C and is
measured in units of ft/d. , is a temperature adjustment factor equal to 1.047, and represents the
temperature of the water at the bottom of the lake. No water temperature data were available for the
Pontiac reservoir (average depth 8.10 ft) or any other nearby lakes that are likely not to have a
substantial degree of stratification. To acknowledge seasonal temperature fluctuations, was
estimated using the method based on Kothandaraman and Evans (1970) discussed in more detail in
Section 4.3. Other environmental conditions that may influence the nitrate loss rate, such as pH, DO
concentration or the availability of a carbon substrate, are not taken into account nor are changes in
water temperature that may result from reservoir drawdown. Finally, is treated as a constant in
this study since bathymetric data for the reservoir have not been encountered. Equation 2.6 was
discretized using a simple Euler backwards differencing scheme to compute the nitrate-N concentration
in the reservoir at the end of each day. The calculations undertaken to convert this analytical
expression into a numerical one can be found in Appendix A. Meanwhile, the nitrate concentration of
the water that reaches the treatment plant is computed using a daily flow-weighted average of the river
and reservoir nitrate-N concentrations:
The concentration of nitrate in water that enters the treatment plant is assumed to be the same over
the course of an entire day. The system samples the nitrate-N concentrations at this location every
eight hours to make sure customers have water with a nitrate-N concentration below the 10 mg/L MCL.
The system also takes daily samples of finished water before it is directed into the distribution system.
2.2.5 Internal Reservoir Operations
In this thesis, the Pontiac OSBR is modeled as a fully-sealed contiguous basin with no contributing area
and a uniform depth of 8.10 ft equal to the ratio of the reservoir capacity (2,026 AF) and surface area
(2.8)

40
(250 ac). However, in reality, the reservoir into two major basins, each of which has its own water level
(Figure 2.2). The contributing watershed areas of these basins are negligible, as they are located in an
abandoned quarry. The southern basin is the main pool into which water from the Vermilion River is
pumped. Water first enters a small 3.5-acre sub-impoundment in the southeastern corner of the
reservoir and then into a small sub-impoundment in which the intake is located through a valve that is
typically kept open. A valve connects this sub-impoundment to a larger sub-impoundment to the west
that still lies within the southern basin of the reservoir through another 16-inch valve that is also
typically left open. A valve connecting the southern and northern pools is typically kept open during the
late-summer period and early fall period when the reservoir is filled rapidly during most years provided
that the water level in the southern pool remains high enough for pumping to the WTP (Figure 2.7).
The northern basin, which has a lower normal pool elevation lies than its southern counterpart, is
subdivided into a large northwest sub-impoundment into which water is conveyed from the southern
basin. It also contains five small sub-impoundments in the northeastern portion of the reservoir into
which water from the northwest pool passes through fractures in the limestone rock in the abandoned
quarry. There are no valves or pumps that can control the exchange of water between the northwest
and northeast sub-impoundments. When storage in the northwest basin approaches capacity, the valve
connecting the southern and northwestern basins is closed. Then, the water level in the northwestern
basin will gradually decline as water seeps through limestone fractures that connect the northwestern
basin with the sub-impoundments in the northeastern sub-impoundment. A floating pump can convey
water from the northwestern sub-impoundment to the southern basin when storage in the southern
basin has diminished (Figure 2.8). When pumping reduces the water level in the northwest basin below
the water level in the northeastern sub-impoundments, seepage from the northeastern sub-
impoundments refills the northwestern sub-impoundment. There are problems with pumping water
from the northwestern sub-impoundment to the southern basin under two circumstances: (i) when

41
there is ice cover in the northwestern sub-impoundment and (ii) the portion of the northwest basin that
is connected to the southern basin, which is only 4-5 feet deep, runs dry. While the second problem
has yet to occur, in the case that storage in this part of the northwestern sub-impoundment becomes
depleted to the extent that the floating pump is rendered inoperable, the system would construct a
temporary coffer dam to raise the water level in this portion of the basin and use another pump to
convey water over the dam.
This simulation model also neglects numerous components of the reservoir water balance. First, the
water table surrounding the reservoir lies at a reported average elevation of approximately four feet
below the surface (Johnson, 2011). Prior to its conversion to a reservoir, water was directed into a
trench in the northern basin and then pumped into a slough south of the reservoir. When the water
table is higher than the reservoir level, groundwater augments reservoir storage. In contrast, when the
water table is lower than the reservoir level, seepage from the reservoir may recharge the surrounding
aquifer. This seepage outflow could exacerbate drawdown during a drought. However, the mere fact
that the site is used as a reservoir suggests that seepage losses are not excessive, an impression that
Tuley (2011a) shared.
Second, the system recycles the discharge from its water treatment plant through the reservoir. Water
discharged from the plant is first conveyed into a sludge pond and then the supernatant water from the
sludge pond is relayed to the reservoir. Tuley (2011a) estimated that the daily discharge, which is not
reported to the National Pollution Discharge Elimination System (NPDES) due to its internal recycling, is
approximately 0.18 mgd, and primarily consists of filter backwash (0.15 mgd). The detention time of the
water in the sludge pond, which directly influences evaporation losses and the nitrate loss rate of
discharge that enters the reservoir, is unknown.

42
Third, while the system does not have a significant contributing area, excessive rainfall can raise the
water level in the reservoir above normal pool elevation and even floods roads that separate its
numerous sub-impoundments. In fact, Tuley (2011a) reported that the system opted to provide its
entire daily supply from the reservoir during a period in 2010 to prevent the reservoir from further
flooding access roads and spilling. The maximum storage capacity of the reservoir could not be
obtained.
2.2.6 Blending Operations
Another major assumption in the model is that the nitrate-N concentration of the raw water entering
the treatment plant is exactly 8.0 mg/L (or 9.0 mg/L when OSBR storage falls below the BRR) whenever
blending takes place. Numerous constraints in the operations of the system inhibit its ability to provide
the exact amount of water needed to achieve this concentration. First, the system only samples the
nitrate-N concentration of influent water every eight hours. During an eight-hour period, the
concentration of nitrate-N in the Vermilion River may rise considerably if there is any storm runoff.
Tuley (2011a) notes that the system only ceases to pump from the river due to turbidity and other
contaminants in storm runoff during roughly six periods per year, each of which may last up to several
days. Thus, the nitrate-N concentration is expected to rise in response to many other relatively minor
storms during which pumping from the river would continue. A clearwell that accommodates 225,000
gallons under normal operations can moderate the nitrate-N concentration of water system to the
distribution system. However, since its capacity is just over one-tenth of the average daily demand
(1.95 mgd), it has limited ability to buffer short-term spikes in nitrate-N concentrations in the Vermilion
River.
Second, the water quality in the reservoir is infrequently sampled. Therefore, in making decisions
regarding releases from the OSBR, the system often must deduce estimates of the nitrate-N

43
concentration in it based on the concentrations sampled in the Vermilion River and the finished water
tap. Third, the pumps that supply water from the reservoir to the WTP are not equipped with variable
frequency drives. While the total daily pumpage from the reservoir to the WTP can consist of any value
ranging from zero to the maximum total pumping capacity (5.7 mgd), the total volume of water
conveyed to the WTP at a given instance is limited by the fixed speeds of the two 1,700-gpm and one
500-gpm pumps that convey water along this route.
In theory, two things can happen in response to these uncertainties: (i) the system could release more
water than necessary from the OSBR to meet the 8-mg/L guideline that the Illinois-American Water
Company uses for nitrate-N in drinking water or (ii) the system could release less water than necessary
and the nitrate-N concentration could exceed the 8-mg/L guideline. In addition, blending is also carried
out to improve water quality of raw water when other contaminants, such as algae, are present in the
river provided that the reservoir water quality is able to ameliorate the problems.
Based on water quality records from the Illinois-American Water Company, blending took place during
approximately 50 percent of days between December 1, 1991 and August 31, 1998. Since information
on daily pumpage from the reservoir is unavailable, the number of days during which blending
happened can be estimated by computing the total number of days during which the nitrate-N
concentration in the Vermilion River exceeded 10 mg/L and then adding that to the number of
additional days during which the nitrate-N concentration in the river is less than 10 mg/L but the
concentration in the river is at least 2 mg/L higher than the concentration in the samples of finished
water taken at the WTP. This 2-mg/L difference is used due to (i) errors in the ion electrode and
cadmium reduction techniques used to estimate the nitrate-N concentration in water samples during
the 1979-1999 study period and (ii) lags in the transport of water from the raw water intake to the
finished water sampling tap in the plant. Note that the finished water tap samples are used because

44
nitrate-N measurements are not available for the blended water prior to its passage through the
treatment plant. Yet, in theory, the concentration should not change much because the nitrate is not
removed through the treatment processes in the plant. Samples of nitrate-N concentrations at an
undocumented location within the reservoir were only taken sporadically during this period and
therefore cannot be used to deduce an estimate of the quantities of water pumped from the river and
reservoir. The sampling of nitrate-N data from the LHD impoundment in the Vermilion River is further
discussed in Section 4.2.
Figure 2.9 displays a histogram of the nitrate-N concentration in finished water during days on which
blending is believed to have been done between December 1991 and August 1998. Most strikingly, the
histogram illustrates that the nitrate-N concentration in tap samples was less than 8.0 mg/L 77 percent
of the time and less than 5 mg/L 15 percent of the time. When the samples are less than 5 mg/L, it is
most likely that blending is being done to reduce the concentration of another contaminant. While
water quality data from the reservoir are sporadic, there are instances in which the system uses water
exclusively from the reservoir for short periods, such as those following storms. On the other hand,
many of the samples between 5 mg/L and 8 mg/L are likely due to the three factors that affect the
delivery of the exact volume of water needed to blend to exactly 8 mg/L. Meanwhile, the samples
between 8.0 mg/L and 10.0 mg/L can be attributed to both the uncertainty regarding the supply of
water needed from the OSBR as well as the intentional relaxation of the 8.0 mg/L guideline under
adverse circumstances.8 Overall, the average concentration of water sampled at treatment plant taps
on days during which blending appear to have been done was 6.74 mg/L. The implications of these
8 Note that data lists a nitrate-N tap samples above 10 mg/L on December 6, 1996 and June 17, 1997. The occurrence of these violations and their potential causes has not been verified. Furthermore, the Northern Illinois Water Company and Pontiac Water Treatment Plant Partnership (1999) states the system had been in full compliance with nitrate-N regulations for six years. The NIWC, the predecessor to the Illinois-American Water Company in Pontiac, was legally required to report any water quality violations to the public. More information is needed on these incidences, which currently do not affect the methods or results of this thesis.

45
blending operations on the firm yield estimates obtained with the simulation model are discussed in
Chapter 3.

46
Figures and Tables
Figure 2.1: Location of Pontiac in the Vermilion River watershed and Illinois.

47
Figure 2.2: Map of Pontiac water system. The water treatment plant is located adjacent to intake.

48
Figure 2.3: Average monthly nitrate-N concentration, May 1979 – April 1999
Figure 2.4: Average monthly watershed precipitation, May 1979 - April 1999
0.00
2.00
4.00
6.00
8.00
10.00
12.00
14.00
Jan Feb Mar Apr May Jun Jul Aug Sep Oct Nov Dec
Nit
rate
-N C
on
cen
tra
tio
n (m
g/L)
0.00
1.00
2.00
3.00
4.00
5.00
6.00
Jan Feb Mar Apr May Jun Jul Aug Sep Oct Nov Dec
Pre
cip
itat
ion
(in
)
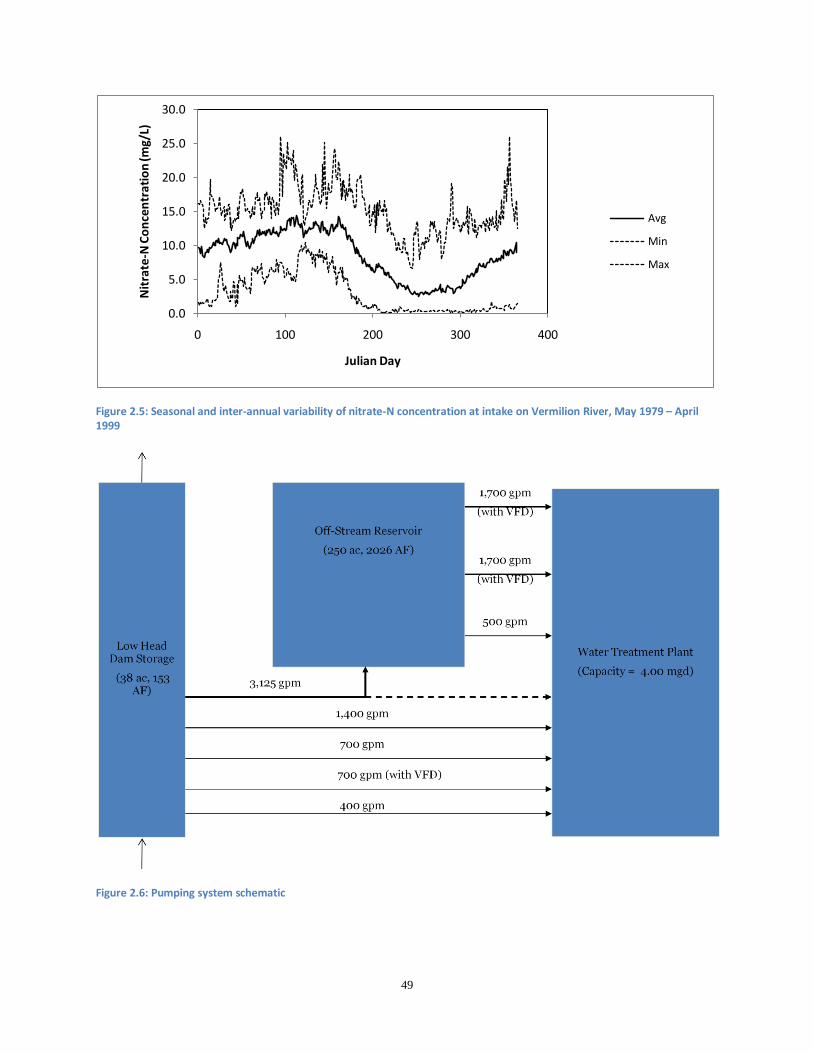
49
Figure 2.5: Seasonal and inter-annual variability of nitrate-N concentration at intake on Vermilion River, May 1979 – April 1999
Figure 2.6: Pumping system schematic
0.0
5.0
10.0
15.0
20.0
25.0
30.0
0 100 200 300 400
Nit
rate
-N C
on
cen
tra
tio
n (m
g/L)
Julian Day
Avg
Min
Max

50
Figure 2.7: Water from the northern is being pumped into the southern basin
Figure 2.8: A floating pump directs water from the northwest sub-impoundment in the northern basin to the southern basin

51
Figure 2.9: Nitrate-N concentration in tap samples on days when blending likely occurred, Dec 1991 - Aug 1998. See footnote about concentrations greater than 10 mg/L in Section 2.2.6.
0
50
100
150
200
250
300
<5 5-6 6-7 7-8 8-9 9-10 10-11 11-12
Nu
mb
er
of
Ble
nd
ing
Day
s
Nitrate-N Concentration in Tap Sample (mg/L)

52
3. Methods for Main Research Objectives
Section 2 introduced the Pontiac OSBR system and described the methods used to develop a simulation
model of its operations. This section describes the methods used to address the four main research
objectives posed in Section 1.3. Section 3.1 describes the three types of water quality operating rules
(WQOR) used in this thesis, including the current River Concentration Rule (RivCR) rule introduced in
Sections 1.3 and 2.2 as well as the alternative Reservoir Concentration Rule (ResCR) and Hybrid
Concentration Rule (HybCR). This section not only compares the three different rules but also assesses
the sensitivity of the firm yield to the values of water quality constraints required under each of them.
Next, the causes of water shortages in OSBR are investigated through three approaches: (i) relating the
time series of OSBR storage to hydrologic and nitrate-N concentration data, (ii) assessing the sensitivity
of the firm yield to various parameters and variable in the model and (iii) diagnosing the causes of
reservoir filling limitations.
3.1 Water Quality Operating Rules
3.1.1 Water Quality Operating Rules Tested
Under its current operating policy, the Pontiac system only fills its OSBR when the nitrate-N
concentration in the Vermilion River is less than or equal to 4 mg/L. Under this rule, water from the
Vermilion River with a concentration of 5 mg/L cannot be pumped into the reservoir even if the
reservoir has a concentration of just 1 mg/L. On the other hand, a rule in which water can be pumped
into the reservoir as long as its concentration does not exceed 4 mg/L, would allow for more water to be
pumped into the reservoir for storage. Yet, one disadvantage of a reservoir concentration-based rule is
that water with a nitrate-N concentration well above the MCL of 10 mg/L could be pumped into the
reservoir. This influx of high-nitrate water could significantly raise the blending demand during periods
of high nitrate-N concentrations. Thus, a third type of rule features both reservoir- and river-based
53
concentration constraints to allow for more filling opportunities while restricting water with a high
nitrate-N concentration from entering the reservoir. The operation of the system under each of the
three rules below is simulated assuming that there are no nitrate losses within the reservoir and that
there is a BRR (blending reserve requirement) of 40 percent of total storage (25 percent available
storage). All simulations in which these two parameters have these values are referred to as the Base
Case Scenario in this thesis.
1. River Concentration Rule (RivCR). This status quo rule sets the maximum nitrate-N
concentration in the LHD impoundment that can be pumped into the reservoir, , to 4.0
mg/L.
2. Reservoir Concentration Rule (ResCR). This rule permits water of any concentration to enter the
reservoir as long as the reservoir concentration does not exceed a maximum reservoir
concentration value, , of 4.0 mg/L. If the concentration rises above 4.0 mg/L due to
evaporation and/or atmospheric deposition, then the system reverts to RivCR to allow water in
the reservoir to become diluted when the opportunity to pump low nitrate-N water into the
reservoir presents itself.
3. Hybrid Concentration Rule (HybCR). A constraint that prohibits water from the LHD
impoundment with a nitrate-N concentration greater than 8 mg/L from entering the reservoir is
added to the ResCR. To determine the value of this constraint, simulations are run with values
ranging from 5 mg/L to 15 mg/L at intervals of 1 mg/L. The simulation with a river constraint of 8
mg/L produces the highest firm yield (Figure 5.3).
Considering the logic above, it is hypothesized that, when the operation of the system is simulated
under the Base Case Scenario, HybCR achieves the highest firm yield followed by ResCR and RivCR. The
54
time series of storage and the nitrate-N concentration in the reservoir under each of the three water
quality operating rules (WQOR) are also compared. Methods used to explore the causes of changes in
storage, such as streamflow deficits, nitrate-N concentrations in the Vermilion River and net evaporation
from the reservoir, are presented in Section 3.2.
3.1.2 Sensitivity of Water Quality Operation Rule Constraint Values
OSBR operators must devise rules regarding the river and/or reservoir nitrate-N concentrations under
which water can be pumped into their reservoir. Implementing a strict standard limits the inflow into
their reservoir and increases the risk of a shortage due to drought. In contrast, using a relaxed standard
increases the concentration of a contaminant in a reservoir, which, in turn, raises the risk of excessive
reservoir depletion during an extended blending period.
The implications of this decision are explored for the three WQORs introduced in Section 3.1.1, in which
these water quality constraints, i.e. the maximum river and reservoir concentrations, used in each of the
three WQORs each have a single value. This section examines the sensitivity of the firm yield to these
constraint values under given values of the maximum concentration of raw water permitted at the WTP,
. For instance, for RivCR, the firm yields obtained with integer values of ranging
from 3 mg/L and 9 mg/L are computed for a given value, e.g., 8 mg/L. This relationship
between and the firm yield is tested for integer values of ranging from 5 mg/L to 9
mg/L. Only pairs for which are tested since it is assumed that the system would
aim to prescribe a value that ensures that the nitrate-N concentration in its reservoir is less
than ,, as the reservoir cannot be used for blending when its concentration exceeds .
Meanwhile, for both ResCR and HybCR, the sensitivity of the firm yield to values of ranging
from 3 mg/L to 9 mg/L is also examined for values of ranging from 5 mg/L to 9 mg/L. Similarly,
only ( , ) pairs for which are examined.

55
Of particular interest is the monotonicity of the relationships between the reservoir inflow constraint
values, i.e., and , and the firm yield between 3 mg/L and . This
relationship is not necessarily monotonic for an OSBR system in which the capacity of the reservoir is a
binding constraint. (See Appendix B for a hypothetical example that proves this point.) If a relationship
is non-monotonic between 3 mg/L and , then setting the constraint values too high can
negatively affect the firm yield. On the contrary, if the relationship is monotonically increasing over
this range, then the highest firm yield will be attained when the constraint values are set equal to
. The implications of this decision with respect to the uncertainty of future nitrate-N
concentrations in the LHD impoundment and algae management in the OSBR are discussed further in
Chapter 6.
In addition, estimations of the firm yield obtained under values lower than 8 mg/L can be used
to assess the impact of the imperfect blending operations of the system described in Section 2.2.6 on
the firm yield. Since the reservoir storage volumes during the December 1991 – August 1998 period for
which these blending data are unknown, one cannot incorporate these decisions into the simulation
model. Furthermore, the available storage capacity of the OSBR was initially only 553 MG before an
additional portion of the former quarry was purchased at a later date.9 Yet, the firm yields obtained
with = 6 mg/L and = 7 mg/L can provide a reasonable range of values for estimating
what the firm yield may be under realistic blending conditions.
3.2 Limitations to the Firm Yield of Off-Stream Blending Reservoir Systems
Limitations to the firm yield of OSBR systems can be evaluated through the following three approaches:
1. Associating the change in storage in the reservoir that leads to water shortages with streamflow,
net evaporation from the reservoir and nitrate-N concentrations.
9 Additional capacity was purchased after March 1999.

56
2. Diagnosing the causes of pumping opportunity limitations (water supply, reservoir capacity,
water quality) and required releases for blending (water supply, water quality).
3. Assessing the sensitivity of the firm yield to key model parameters and variables.
3.2.1 Interpretation of Off-Stream Blending Reservoir Storage Time Series
First, the time series of OSBR storage and nitrate-N concentration generated under the Base Case
Scenario with RivCR, ResCR and HybCR operating rules are compared. Changes in OSBR storage are
associated with concurrent streamflow, nitrate-N concentrations in the river and reservoir, precipitation
and evaporation records. In particular, the hypothesis that the worst water shortages are the result of
a low flow – high nitrate concentration sequence described by Li et al. (2010) is evaluated.
3.2.2 Diagnosing Causes of Limited Pumping Opportunities and Reservoir Releases
Another method of analyzing the cause of shortages in an off-stream reservoir system is to identify the
reasons for which the reservoir cannot be filled on a given day as well as identify whether releases were
made for blending or drought supply. First, to analyze the factors that limit pumping opportunities, it is
necessary any limitations in pumping that resulting from streamflow deficits, or more precisely when
water is not flowing over the LHD. When the LHD impoundment is not full, the reservoir cannot be
filled even if there is spare capacity and the water quality is adequate. Next, the capacity of the
reservoir is the second factor that constrains storage, as water of adequate quality cannot be diverted
into the reservoir if there is no spare storage capacity. Third, water quality constraints also limit
opportunities to pump water into the reservoir, as described in more detail in Sections 2.2 and 3.1.
To determine the extent to which each of these limiting factors restricts pumpage into the reservoir,
days during which the maximum volume of water (4.5 mgd) was not pumped into the reservoir are
identified. The total volume of water that could not be pumped into the impoundment over the twenty-
year period of record is computed. Next, days during which the reservoir is less than 4.5 mgd (13.82 AF)
57
away from being filled are noted. The volume of water that could not be pumped into the reservoir
due to this constraint is then calculated. Next, the volume of water that could not be pumped into the
reservoir during days in which (i) the streamflow was sufficient and (ii) there was spare reservoir storage
capacity is then computed. The total volume of missed pumping opportunities attributable to each of
these limiting factors is then compared. The relative contributions of streamflow deficits and
inadequate water quality are of particular interest. This procedure is executed for the Base Case
Scenario under each of the three WQOR. While these results of this approach are limited to this
particular case study, this general approach can be used to identify causes of water shortages in other
OSBR systems.
Next, the causes of releases under the Base Case Scenario are also investigated for all three WQOR.
Since water must be released from the reservoir whenever the LHD impoundment is not full, all releases
that take place under these conditions are attributed to a streamflow deficit even if blending is also
necessary. All other releases are made only for blending and are thus associated with water quality
limitations. Finally, the volumes of releases and missed inflow opportunities are summed to evaluate
the overall impact that streamflow deficits and inadequate water quality have on reservoir storage
during the twenty-year study period.
3.2.3 Sensitivity of Firm Yield to Key Model Parameters and Variables
Next, the sensitivity of the firm yield to many model parameters and variables is tested. First, its
sensitivity to the following parameters is examined:
(a) OSBR Capacity (surface area to capacity ratio held constant)
(b) LHD Impoundment Capacity (surface area to capacity ratio held constant)
(c) OSBR Surface Area (capacity held constant)
(d) OSBR Pumping Capacity

58
(e) Blending Reserve Requirement (BRR)
The sensitivity of the firm yield to the OSBR capacity is tested at intervals of 250 AF ranging from 250 AF
to 5,000 AF under all three WQOR as well as a “no regulations” scenario to compare the relationships
between storage and the firm yield under the three WQOR to an OSBR system without any water quality
limitations.10 Next, the sensitivity of the firm yield to LHD impoundment capacity under RivCR is
examined with values ranging from less than one-tenth of its capacity of 153 AF to ten times its capacity.
These wide ranges of storage values were selected for both the OSBR and LHD to identify the points at
which constraints that may be binding, such as streamflow, impede the firm yield from increasing with
storage and improve the general understanding of the relationship between the storage available in
them and the firm yield of an OSBR system.
The sensitivity of the OSBR surface area is also investigated under RivCR to determine if there is a non-
monotonic relationship between the firm yield and surface area since a larger surface area may increase
the amount of rainfall that can augment storage during periods in which high nitrate-N concentrations in
the Vermilion River require blending. Next, the sensitivity of the firm yield to the capacity of the pump
that fills the reservoir under RivCR is examined to determine the extent to which boosting this capacity
could raise the firm yield of the system and identify the maximum increase in yield that investment in
additional pumps could produce. This analysis is conducted under the assumption that the new pumps
do not interfere with the operation of existing pumps, which can happen with multiple-pump
configurations feeding off-stream reservoirs (McConkey and Singh, 1996). Finally, the sensitivity of the
yield to the blending reserve requirement (BRR) under RivCR is assessed over a range of 20 percent of
total storage, the minimum storage volume at which water may be pumped from the reservoir, and 100
percent.
10
Even though this hypothetical OSBR does not have a true water quality function, having lines to the WTP and off-stream reservoir allow for water to simultaneously be pumped to the WTP and reservoir, which produces a higher yield than a system that routes all their water through their off-stream reservoir.

59
The sensitivities of the firm yield to the uncertainty and variability of the hydrologic and water quality
variables listed below are also investigated. Considerations for selecting the ranges of variability
examined are discussed in the ensuing paragraphs. More information about the data sources and the
work conducted to generate these estimates can be found in Chapter 4.
(a) Streamflow
(b) Gross lake evaporation
(c) River nitrate-N concentration
(d) Atmospheric deposition of nitrate-N
(e) Nitrate loss rate
(f) Storage-yield-nitrate loss curves
(g) Water temperature (through impact on nitrate loss rate)
Streamflow
First, the sensitivity of the firm yield to the uncertainty of streamflow is analyzed under all three WQOR.
An emphasis is placed on the estimation of inflow into the impoundment during periods in which water
is not passing over the dam since water cannot be pumped to the reservoir under these circumstances
and low inflow threatens to decrease the storage in the LHD impoundment below the 30 percent
minimum necessary for pumping to the WTP. Furthermore, estimates of inflow into the impoundment
during periods when water is not passing over the dam are subject to much more uncertainty since the
discharge recorded at the United States Geological Survey’s (USGS) Vermilion River at Pontiac gauging
station 2,000 feet downstream is zero. Estimates of inflow into the impoundment cannot simply be
made by adding withdrawals that the system makes to the discharged recorded at the gage. As
described in further detail in Section 4.1, the inflow entering the impoundment during the 133-day

60
period in 1988 during which zero discharge was registered at the gauging station was measured using
different methods for three distinct periods:
1. The inflow was assumed to be exactly equal to withdrawals and net evaporation during a period
from July 1 – 25, 1988 since the system reported that the first day when water stopped flowing
over the dam was July 26 (Knapp, 1988). This estimate is based on the assumption that any
discharge that passed over the dam infiltrated into the 2,000-foot long channel separating the
dam and the station or entered stagnant pools within the channel.
2. The inflow entering the impoundment between July 26 and August 23 is estimated through a
water balance approach that estimates of water withdrawals, water levels and depth-storage
relationships in the impoundment and net evaporation enables.
3. Beginning on August 24, an unknown quantity of water was pumped into the impoundment
from other sources. Since the river inflow into the impoundment can no longer be estimated
through a water balance approach, an estimate of the inflow is derived from the estimates from
the Illinois Streamflow Assessment Model for 50-year low flows of 61 and 91 days of duration
(Knapp and Russell, 2004).
Meanwhile, during others years in which there are short periods of zero discharge measurements at the
gauging station, the inflow into the impoundment is estimated using a master base flow recession curve,
the development of which is also described further in Section 4.1.
Discharge measurements taken during extreme low flow conditions often have an uncertainty of at least
50 percent (Knapp, 2007). Estimating the discharge at a site using a water balance approach, recession
curve or regional regression equation, such as the one included in the ILSAM model, introduces
additional error into the estimate. Knapp (2007) estimates that 9-month, 50-year flow estimates have
an uncertainty of 35-60 percent regardless of the flow magnitude. Given that the 81-day period for

61
which the ILSAM equation is used is considerably shorter than nine months, this uncertainty may be
even higher. Knapp and Russell (2004) provide an equation for estimating the standard error, , of
regression estimates of 50-year low flows of 61 and 91 days of duration in the Bloomington Ridged Plain
physiographic region:
is the coefficient of error and is the mean flow during the period of record, which in this case
runs from October 1942 – September 2001. Later years were not added to the calculation in order to
choose a period of record that matched the period of record on which this version of the ILSAM model
was calibrated. The values of for the 61- and 91-day low flow with a frequency of fifty years are
0.0034 and 0.0042. Using a weighted average based on the 81-day period from August 24 to November
10, 1988 during which a water balance calculation was impossible, the value of is estimated to be
0.0039. The mean annual flow between 1942 and 2001 was 413 cfs. Applying Equation 3.1, the
standard error of the ILSAM estimate of 2.4 cfs is 1.61 cfs. Therefore, a pessimistic estimate of the
average discharge during this 81-day period is just 0.79 cfs, which still lies above the estimated discharge
of 0.50 cfs from Fairbury expected to enter the impoundment during the drought. Finally, to assess the
consequence of the uncertainty of the LHD impoundment inflow estimate during the 1988 drought on
the firm yield, the five pessimistic scenarios described in Table 3.1 are evaluated.
Net Lake Evaporation
Next, the sensitivity of the firm yield to the net lake evaporation rate is analyzed. Errors in these
estimates originate from three general sources: (i) gross lake evaporation estimates, (ii) direct
precipitation estimates and (iii) reservoir surface area estimates (Knapp, 2007). First, the uncertainty of
gross lake evaporation estimates can be attributed to the following sources of error:
(3.1)

62
1. Errors in estimates of potential evapotranspiration based on solar radiation, relative humidity,
air temperature, wind speed and barometric pressure measurements collected at the Stelle and
Peoria Water and Atmospheric Resource Monitoring (WARM) program stations that the Illinois
State Water Survey has maintained since January 1989. These errors include errors in the
measurement of these other meteorological variables as well as errors in the methods that
Hollinger (1994) used to model potential evapotranspiration (Scott et al., 2010).
2. Errors in the use of average monthly potential evapotranspiration from 1989 – 1999 in
estimating the monthly potential evapotranspiration between 1979 and 1988.
3. Errors in the monthly pan evaporation measurements collected at Hennepin, Illinois between
May and September 1988. These measurements were used in lieu of the 1989 – 1999 monthly
averages from WARM stations used for all other months prior to January 1989 because the
summer of 1988 was abnormally hot and dry.
4. Differences in the evaporation rate at weather stations and in Pontiac, which are likely to be
minimal given the similar latitude of the stations used in this study and the flat topography of
central Illinois.
5. The monthly pan-to-lake coefficients in Roberts and Stall (1967) and the validity of these
coefficients, calibrated on data from 1911-1962, for the 1979-1999 study period.
Winter (1981) estimated that monthly pan-to-lake coefficients can induce up to a 50 percent error in
measurements of monthly gross lake evaporation. Knapp (2007) also notes that Winter (1995)
compared evaporation estimates computed with 11 empirical equations based on meteorological data
with estimates deduced through an energy balance approach at lakes at which detailed data collection
permitted the latter type of calculation. He found that the standard error ranged from 10-30 percent,
although Winter (2003) also notes that these energy balances can have their own errors of up to 10
percent. Based on this review, the sensitivity of the firm yield to evaporation estimates is tested with

63
rates ranging from 50 percent to 150 percent of gross lake evaporation estimates. However, it should
be noted that Winter (1981) also recommended that seasonal and annual evaporation estimates be
considered to have a 20-25 percent error, although he provided no further justification for this
seemingly ad hoc judgment (Knapp, 2007).
Next, Groisman and Legates (1994) stated that precipitation measurements in Illinois have an average
error ranging between 8 and 10 percent and typically underestimate precipitation due to wind. Since
the Pontiac weather station is located close to the reservoir, errors resulting from the application of this
measurements taken at this station to the precipitation that falls directly onto the reservoir surface
during a drought are likely minimal.
The sensitivity of the uncertainty of net lake evaporation was assessed by varying the gross lake
evaporation between 50 and 150 percent of the estimated value while increasing the on-surface
precipitation estimate by 10 percent to acknowledge the undercatching bias reported in Groisman and
Legates (1994). Since the surface area is assumed to be constant in this study, the impact of surface
area-depth-storage relationships on net lake evaporation estimates is not evaluated. While this
assumption results in the overestimation of net lake evaporation during a period in which evaporation
exceeds on-surface precipitation, it is considerably more valid for a quarry than it would be for an
impounding reservoir.
River Nitrate-N Concentration
Next, the sensitivity of the firm yield to nitrate-N concentrations in the Vermilion River is analyzed. Both
the impact of the measurement uncertainty due to sampling bias, instrument precision or laboratory
error, as well as the possibility of changes in fertilizer use rates or the institution of best management
practices (BMPs) to reduce nitrate loadings into the Vermilion River are of interest. Rather than
attempting to estimate the uncertainty of the nitrate-N measurements and the likelihood of changes in

64
the nitrate-N concentration through changes in fertilizer use or BMPs, the sensitivity of the firm yield to
the river nitrate-N concentration can be varied using a single adjustment factor. Furthermore, this
analysis can reveal the extent to which a reduction in nitrate loads could increase the firm yield, or
conversely, the extent to which an increase in fertilizer use could lower the firm yield. For this reason,
the time series of daily nitrate-N concentration is multiplied with adjustment factors ranging from 50
percent to 150 percent to account for a wide variety of potential agricultural management scenarios.
Changes in the seasonality of nitrate-N concentrations that could result from changes in fertilizer
application practices, as suggested by Royer et al. (2006), are not examined.
Atmospheric Nitrate-N Deposition
The importance of adding atmospheric nitrate-N deposition to the model is also examined. The firm
yield attained without the inclusion of atmospheric deposition is computed to assess the value of
incorporating this flux, which consists of both wet and dry deposition, into the model. The uncertainty
of the wet and dry deposition measurements themselves or the assumption that once-weekly
measurements are representative of the deposition during an entire week is not evaluated.
Nitrate Loss Rate
One of the novel aspects of this research identified in Section 1.3 is the analysis of the sensitivity of the
firm yield to the decay rate of a non-conservative contaminant. To examine this sensitivity, the firm
yield of the reservoir is simulated under the three WQOR, which are further described in Section 3.3, at
decay rates ranging from K = 0.00 ft/d to K = 0.05 ft/d at intervals of 0.01 ft/d and then from K = 0.05
ft/d to K = 0.20 ft/d.11 Whitehead and Toms (1993) observed a range of denitrification rates from K =
0.02 m/d (0.07 ft/d) up to K = 0.06 m/d (0.20 ft/d) in five reservoirs in England. The denitrification rate
in the Pontiac OSBR, however, may be lower since (i) there was likely little to no carbon substrate in the
11
Note that the upper-case letter K signifies the decay rate at 20° C rather than rate at which nitrate decays at the ambient water temperature, k.

65
quarry prior to the development of the reservoir and (ii) there is little inflow of sediments to which
organic material adheres since there is no contributing area from which sediment can be imported and
the system does not pump water into the reservoir when suspended sediment concentrations are high
in the Vermilion River due to turbidity concerns. Also, the firm yield is most sensitive to low values of K.
Storage-Yield-Nitrate Loss Curves
Next, to examine the value of developing reservoir design implications of the nitrate-N decay, or loss,
rate, the storage capacity of the reservoir is varied while its ratio with the surface area is held constant.
Storage-yield curves are produced for nitrate loss rates ranging from K = 0.00 ft/d to K = 0.05 ft/d at
intervals of 0.01 ft/d and then from K = 0.05 ft/d to K = 0.20 ft/d. The impact of storage on yield is
tested at 500 AF increments ranging from 500 AF to 5,000 AF.
Nitrate Loss Rate Sensitivity to Water Temperature
Since the nitrate-N loss rate is dependent upon temperature, the sensitivity of the firm yield to the
water temperature estimate is examined. The water temperature measurement made using the
empirical function from Kothanadaraman and Evans (1970) is subject to the following errors:
1. Errors in the water temperature measurements used in Kothanadaraman and Evans (1970).
2. Departure of daily values from the sinusoidal function used to estimate the daily water
temperature. This function is introduced in more detail in Section 4.3.
3. Neglect of inter-annual temperature variability when applying the sinusoidal function.
4. Differences in water temperature at an eight-foot depth in Lake Bloomington and the Pontiac
reservoir due to differences in circulation between two bodies of water, which are thermally
stratified and unstratified, respectively.
5. Differences in weather at the Pontiac reservoir and at Lake Bloomington. These differences are
believed to be insignificant since the two bodies of water are only 22 miles apart.

66
Since some of these sources of uncertainty could not be quantified easily, a very conservative
adjustment was made to the temperature data used to estimate the nitrate loss rate. The operation of
the system was simulated with the water temperatures 5° C lower and higher than the values estimated
using the equation from Kothandaraman and Evans (1970). When the temperatures were lowered,
the water temperature was not permitted to fall below the annual minimum of 2.7° C that the equation
from Kothandaraman and Evans (1970) predicted to prevent the occurrence of negative temperatures
or slightly positive that are unrealistically cold for water 8 ft below the surface.
Pessimistic Scenarios
In addition, the operation of the system was simulated under the following two pessimistic scenarios
that incorporate the uncertainty of multiple variables:
(a) Pessimistic hydrologic scenario
(b) Pessimistic hydrologic scenario considering realistic blending operations
(c) Pessimistic hydrologic and land management scenario
Table 3.1 summarizes the ranges of these values tested in the pessimistic hydrologic scenario. The
sources of uncertainty and the ranges of values tested for each of these variables are presented below.
A more detailed description of these data can be found in Chapter 4.
Pessimistic Hydrologic Scenario
Finally, in addition to analyzing the sensitivity of the firm yield to the uncertainty and variability of a
single parameter or variable in the simulation model, a pessimistic scenario that estimates the firm yield
considering the following sources of uncertainty was simulated:
a) Streamflow Uncertainty Scenario 1, in which inflow into the impoundment is just 0.79 cfs from
August 24 to November 10, 1988.

67
b) Gross lake evaporation is increased by 25 percent based on the ad hoc estimate for seasonal and
annual evaporation uncertainty estimate from Winter (1981) of 25 percent, but direct
precipitation is increased by 10 percent to reflect undercatching bias reported in Groisman and
Legates (1994).
Pessimistic Hydrologic and Land Management Scenario
The pessimistic scenario is also run with a 25 percent increase in the nitrate-N time series to simulate
the impact of an increase in nitrogen loads in the Vermillion River watershed. Such an increase is
relatively unlikely given recent efforts by the Vermilion Watershed Task Force (Northern Illinois Water
Company – Pontiac Water Treatment Plant Partnership, 1999) to reduce the concentration of nitrate in
the Vermilion River through the institution of land management practices, such as increasing the
percentage of fertilizer that is applied during the spring through side dressing. Nonetheless,
characterizing this sensitivity can demonstrate the vulnerability of the system to any relaxation of these
efforts.
Pessimistic Hydrologic Scenario Considering Realistic Blending Operations
The pessimistic hydrologic scenario is also evaluated with values of set to 6 mg/L and 7 mg/L
to estimate the firm yield with realistic blending operations as justified in Section 3.1. In Section 2.2.6, it
is shown that the average nitrate-N concentration at the WTP is estimated to be 6.74 mg/L on days
during which blending was likely to have occurred. Therefore, to assess the effect that these practices
may have on the firm yield, the operation of the system is simulated with all of the Base Case Scenario
parameters for each of the three systems intact except for the constraint.

68
Figures and Tables
Streamflow
Uncertainty
Scenario
Description
1 Reduce ILSAM-derived estimate of inflow into the impoundment between
August 24 and November 10 from 2.40 cfs to 0.79 cfs based the standard error
of the model.
2 Reduce the inflow into the impoundment between August 24 and November to
the discharge from 7Q10 effluent discharge from Fairbury of 0.50 cfs.
3 Assume no inflow enters the impoundment during the entire 133-day period
during which no flow passes over the dam in 1988 (July 26 – November 10).
4 Apply the percent standard error of the ILSAM estimate (67%) to the inflow
entering the impoundment during all days during the 20-year study period
during which water during which zero discharge estimates were recorded at the
USGS gauging station in Pontiac and all non-zero discharge measurements taken
at the station have an error of 10 percent.
5 Apply the percent standard error of the ILSAM estimate (67%) to the inflow
entering the impoundment during all days during the 20-year study period
during which water during which zero discharge estimates were recorded at the
USGS gauging station in Pontiac.
Table 3.1: Description of streamflow uncertainty scenarios
Variable Description
Streamflow Same as Streamflow Uncertainty Scenario 1
Gross Lake Evaporation Use Winter’s ad hoc estimate of a 25 percent error. Correct this
estimate for a 10 percent under-catchment bias for precipitation that
falls directly onto the lake surface.
Table 3.2: Variables evaluated in Pessimistic Hydrologic Scenario uncertainty analysis.
69
4. Data
Modeling the operation of off-stream blending reservoirs (OSBR) requires streamflow, water quality,
water temperature, net evaporation and water demand data. This section details the development of
these data prior to their insertion into the simulation model. See Section 2.2.1 for a brief discussion of
the criteria by which the study period was selected for this model.
4.1 Streamflow
4.1.1 Basic Considerations for Estimating Inflow into the Low-Head Dam Impoundment
Since 1943, the United States Geological Survey (USGS) has operated the Vermilion River at Pontiac
(05554500) continuous gauging station, which is located approximately 2,000 feet downstream of the
low-head dam (LHD) and has a contributing area of 579 mi2 (Figure 2.1). Corn and soybean cropland
cover over ninety percent of the watershed (Figure 2.2). No major impoundments or water systems
withdrawing more than 0.05 mgd lie upstream from Pontiac. According to the Illinois Streamflow
Assessment Model (ILSAM) for the Vermilion River watershed, the only effluent discharge that releases
more than 0.10 mgd (0.15 cfs) during seven-day ten-year (7Q10) low flow conditions is the town of
Fairbury, which discharges an estimated 0.50 cfs (0.32 mgd) into the river under these circumstances.
Since Pontiac pumps water to its OSBR and WTP from intakes located upstream of the low-head dam
(Figure 2.2), it is necessary to review changes in discharge between the intakes and the gauging station.
First, modifications to the discharge from withdrawals must be taken into account. Annual pumping
records from the Illinois State Water Survey’s Illinois Water Inventory Program (IWIP) dating back to
1979 can be used to estimate historic withdrawals (Figure 4.1). Prior to the filling of the OSBR in
December 1991, these withdrawals consist of water pumped directly to the treatment plant to fulfill
each day’s demand except during a period from August 24 to November 10 during the 1988 drought
70
when water from supplementary sources was pumped into the impoundment. After the inception of
the OSBR system, withdrawals from the river included both the portion of the daily demand pumped
directly from the river to the treatment plant and the volume pumped to fill the off-stream reservoir.
Unfortunately, records from the Illinois Water Inventory Program (IWIP), which archives annual
pumpage of community water systems in Illinois, do not distinguish between water pumped from the
river to the reservoir and water pumped from the river to the treatment plant (Figure 4.1). While water
quality records indicate that blending began in December 1991, the first year during which pumping
records from the OSBR were reported separately was 1993, when 2.13 mgd were withdrawn from the
river while an additional 0.65 mgd were conveyed from the OSBR to the treatment plant. Given that
the total volume pumped from the river in 1992 was just 2.06 mgd, it is unlikely that Pontiac’s average
daily demand rose from 2.06 mgd to 2.78 mgd in one year, especially given that 1993 was an extremely
wet year. In addition, this elevated demand continues through 1997, which eliminates leakage from
being considered as a cause of this anomaly. Instead, the total pumpage from the river likely includes
water that is pumped to both the reservoir and the plant. This pattern continues through to 1997 while
it appears that the river pumpage reported in 1998, just 1.59 mgd, only includes water that was pumped
directly from the river to the treatment plant. Given these data, daily withdrawal estimates were made
in the following manner:
1) From 1979 – 1992, daily withdrawals were estimated using the annual average daily pumpage
volumes reported from the river intake, the only one listed as active during this period. An
exception occurs in 1988, when a summer drought elevated the demand to 2.5 mgd prior to the
issuance of restrictions on August 1, which lowered the demand to 2.1 mgd. A water shortage
further reduced the demand to approximately 1.65 mgd that occurred between August 24 and
November 11, the date during which water began flowing over the dam again (Knapp, 1988).

71
2) From 1993-1997, annual average daily water withdrawals were estimated using reported
pumping values from the river intake only and did not include pumpage reported from the off-
stream reservoir to the treatment plant.
3) Finally, from 1998-1999, daily water withdrawals were estimated by computing the average of
the five values computed in (2). Water pumped from the river in 1998 appears to only include
pumpage from the river to the reservoir and not the water treatment plant.
4.1.2 Inflow During Normal and Drought Conditions
Second, the impact of the low-head dam on the difference between the discharge entering the low-head
dam impoundment and that observed at the gauging station must also be considered during periods
when water is flowing over its crest as well as ones during which it is not. The hydraulic impact of the
dam, which extends approximately 100 feet across the Vermilion River (Figure 2.2), on releases from the
impoundment, could be computed by treating the dam as a broad-crested weir. However, information
on the height of the dam above the thalweg could not be obtained from the Illinois-American Water
Company, the Illinois State Water Survey or the National Inventory of Dams (NID). Furthermore, these
hydraulic effects have little impact on the firm yield of the system, as only water quality and pump
capacity constrain the volume of water that can be withdrawn during periods when water is flowing
over the dam. For these reasons, the discharge passing over dam was assumed to be the spill from an
impoundment without any regard for the hydraulic effects of the dam. Changes in streamflow between
the dam and the gauging station due to base flow, effluent discharges and streambed infiltration are
considered to be negligible. Based on these assumptions, when water is flowing over the dam at the
beginning of the day, the inflow entering the impoundment can be modeled as follows:
(4.1)

72
Inflow estimates also need to be made during periods in which the discharge measured at the gauge
was zero. Naturally occurring streamflow, effluent discharges and streambed infiltration occurring along
the 2,000-foot stretch between the dam crest and the gauging station were considered to be negligible.
Therefore, any zero discharge observation at the gauging station was assumed to concur with a period in
which water was not passing over the dam unless supplementary information that suggested otherwise
was available. When water is not flowing over the dam, it is necessary to treat the low-head dam
impoundment as a water supply reservoir that is not spilling. The following water balance equation
applies on all days for which water is not flowing over the dam:
Note that the net evaporation, , from the low-head impoundment, which is neglected during
periods in which the river is flowing over the dam, must be taken into account under these
circumstances. During the study period, there were eight years (1983, 1984, 1986, 1987, 1988, 1989,
1990 and 1991) during which average daily discharges of zero were estimated at the USGS gage (Figure
4.2). However, the only year in which these zero-discharge periods were severe enough to cause a
water shortage was 1988, when the gage did not record any discharge for 133 days (July 1 – November
10). During the seven other years, there were not any periods during which zero discharge was
registered for more than ten consecutive days. In all of these years, only one zero-discharge period
occurred except for 1989, during which a ten-day zero-discharge period starting on August 9 followed a
two-day zero-discharge period that commenced on July 11.
Thus, most effort was placed on modeling the discharge entering the impoundment during the 133-day
period when water did not pass over the dam in 1988. The estimation of the inflow into the LHD
impoundment was divided into the following three distinct periods:
(4.2)
))

73
1. July 1 – July 25. A period during which the USGS gauging station did not record any discharge
(verified by field measurements taken during this period) but the Pontiac system reported
water passing over the LHD (Knapp, 1988).
2. July 26 – August 23. A period during which water no longer flowed over the crest of the dam
and the availability of water level, withdrawal and net evaporation estimates permit the
deduction of a streamflow estimate through a water balance approach.
3. August 24 – November 10. A period during which an unknown amount of water was pumped
from quarries and a farm pond to the LHD to raise the water level and enable pumping from
the impoundment (Tuley, 2010). Note that the system did not begin using its OSBR until
December 1991.
4.1.3 Estimating LHD Inflow: July 1 – July 25, 1988
Pontiac operators reported that water stopped passing over the dam on July 26, 1988 (Knapp, 1988)
while the USGS gauging station registered an average daily discharge of zero during a 133-day period
lasting from July 1, 1988 to November 10, 1988. A USGS field measurement taken on July 7, 1988
confirms that the absence of a measurable discharge was not an artifact of the stage-discharge curve
used at that time. This suggests that there may have been a small discharge passing over the dam
during these twenty-five days that resulted in the formation of intermittent pools in the 2,000-foot-long
channel immediately downstream of the dam in which the downstream velocity was negligible. Since
losses to streambed infiltration and evaporation from pools along this 2,000-foot channel during this 25-
day period cannot be easily estimated and are likely to be relatively small, the discharge entering the
impoundment is assumed to be exactly equal to the sum of the daily withdrawals and evaporation rate
from the LHD impoundment during this period.

74
4.1.4 Estimating LHD Inflow: July 26 – August 23, 1988
Knapp (1988) reports estimates of water withdrawals, evaporation and water levels in the low LHD
impoundment obtained from Pontiac operators, which can, in turn, be used to deduce an estimate of
the inflow into the impoundment between July 26 and August 23, 1988 (Table 4.1). As stated above,
this water balance approach can be used to estimate the inflow into the LHD impoundment through
August 24, after which the unknown rate at which supplementary sources, including quarries and farm
ponds, were pumped into the impoundment prohibits the use of this water balance approach. The
average daily discharge entering the impoundment between two water level measurements taken at
times t=0 and t=N was computed as follows:
The first term,
, represents the average daily inflow between t = 0 and t = N days.
and indicate the storage in the impoundment at these same two times, respectively.
Storage estimates could also be deduced from the measurements of the distance of the water level
below the impoundment. Following Knapp (1988), the surface area of the impoundment is assumed to
be constant with depth with a one-inch increase in water level corresponding to a storage increase of
one million gallons (1 MG). Pontiac also temporarily increased the height of the dam by approximately
one foot during the drought (Tuley, 2010). As a result, the storage in the impoundment on July 26
when the Pontiac system first observed a decline in water level is assumed to 190 AF (62 MG) based on
this established storage-depth ratio.
During the period over which the water balance analysis occurs, the evaporation from the impoundment
on each day, , consists of the monthly mean of daily pan evaporation measured at Hennepin, Illinois
(45 miles northwest of Pontiac, See Figure 4.3) multiplied by monthly pan-to-lake evaporation
coefficients for Peoria from Roberts and Stall (1967) listed in Table 4.2. In July and August 1988, the
(4.3)

75
monthly mean pan evaporation at Hennepin was 0.25 in/day and 0.20 in/day, respectively, while the
pan-to-lake coefficients during these two months were 0.73 and 0.72, respectively, resulting average
daily evaporation estimates of 0.19 in/day and 0.15 in/day. Finally, Knapp (1988) reported that the
water demand during this period, , was 2.5 mgd prior to August 1 and decreased to 2.1 mgd
once mandatory restrictions were instituted on August 1, 1988. Once supplementary sources began
being used on August 24, this abstraction rate declined to 1.6 – 1.7 mgd.
4.1.5 Estimating LHD Inflow: August 24 – November 10, 1988
Next, a means of estimating the inflow into the dam from August 24 through November 10 must be
devised. As previously mentioned, the water balance approach can no longer be employed during this
period since unknown quantities of water were pumped into the impoundment from supplemental
sources. A previous effort to simulate the streamflow of the Vermilion River at the Pontiac gauging
station between 1972 and 1996 using the HSPF model did not correct estimates for withdrawals at
Pontiac and overestimated streamflow under low flow conditions (Singh, 2004). In particular, this
model was calibrated using data from 1987-1995, including the 133-day zero-discharge period at the
gauging station during the 1988 drought. While the discharge at the gage was constant during this
period, the inflow into the impoundment was not. Therefore, using the model to estimate flows
upstream of the gauging station during this period is invalid. Developing a new process-based
hydrologic model to produce an estimate of the streamflow during this 79-day period lies outside the
scope of this investigation. Instead, two simpler empirical approaches are considered:
1. Estimating the daily streamflow using a recession curve.
2. Utilizing the 50-year frequency estimates of the 60- and 90-day low flows immediate upstream
of the Pontiac withdrawal from the Illinois Streamflow Assessment Model.

76
First, a baseflow recession curve can be employed to estimate streamflow during a drought if it can be
assumed that the runoff generated from precipitation comprises a relatively small percentage of the
total streamflow during this period. A Thiessen polygon computation of rainfall from five weather
stations reveals that a total of 5.04 inches of precipitation fell in Pontiac’s 579 mi2 watershed between
August 24 and November 8. (Another storm on November 9-10, featuring 1.4 inches of rain, elevated
the water level in the low-head dam impoundment above the crest of the dam again.) During these 79
days, there were two four-day periods during which nearly one inch of precipitation fell. While many
methods for estimating baseflow recession are available, (e.g., Vogel and Kroll, 1996), Tallaksen (1995)
cautions that estimating a recession curve is not a straightforward process, especially in regions in which
there is no true dry season, such as the Midwestern United States. In these regions, extreme low-flow
periods lasting several months are typically interspersed with minor increases in discharge due to
occasional storms. The treatment of these slight increases in streamflow in modeling recession
processes depends upon the modeling objective. If the objective is to estimate the base flow recession
constant, i.e., the rate at which streamflow comprised entirely of base flow recedes, then it is best to
limit the analysis to periods during which there are no storms capable of generating surface runoff or
use a “lower envelope” approach in which the base flow recession constant is estimated by graphing a
curve at the lower boundary of a cluster of points (e.g., Szilagyi et al., 2007). On the other hand, if the
goal is to predict the streamflow during a given period, which may include some minor storms, then it
becomes impractical to estimate the flow using merely an initial discharge value and a base flow
recession constant. In this case, a lower envelope approach should not be used, as it would result in a
negatively biased estimate of the inflow into the impoundment. Instead, a recession curve that fits the
observed data best should be developed.
One major decision involved in constructing a recession curve is determining if a master recession curve
should be developed or if the recession during different periods should be modeled separately

77
(Tallaksen, 1995). In addition to the difficulties associated with constructing recession curves in
watersheds in which there is no true dry season that were mentioned in the previous paragraph,
seasonal and inter-annual differences in evapotranspiration may induce additional variability in
recession processes. Figure 4.4 plots eight recession curves during the years in which zero discharge
measurements were recorded at the Vermilion River at Pontiac gauging station (05554500). These
curves clearly exhibit the influence of storms interspersed between dry periods as well as interannual
and seasonal differences in the recession rates.
To make this decision, it is necessary to determine the years during which low flows could have had an
effect on the water supply of the Pontiac system. In all years other than 1988, zero-discharge periods at
the gauging station did not exceed ten consecutive days. Since pumping from the LHD impoundment is
possible as long as its storage does not fall below 15 MG, or 30 percent of its capacity, a supply-induced
shortage would not even occur if no flow were to enter the impoundment for ten days and losses from
withdrawals and evaporation were to be 2.50 mgd (3.87 cfs), the daily demand during 1988 drought,
and 0.25 mgd (0.39 cfs), respectively. Therefore, effort to model the recession process was focused on
the 1988 drought.
To model the recession in 1988, the record of observed daily discharges at the Pontiac gauging station
was examined to identify any large storms. While small increases in runoff can be tolerated when
trying to develop a recession curve for predictive purposes, large ones should be avoided. The last
notable storm preceding the 1988 low flow season increased the mean daily discharge from 80 cfs on
May 24 to 214 cfs on May 26. To exclude this storm runoff from the recession curve, the recession
constant is estimated with an exponential function beginning on May 31 and ending on June 30, the last
day before the discharge at the Pontiac gauging station reaches zero (July 1). Figure 4.5 presents the
exponential recession curve that was fit to the data. One should note that there were only six days

78
during this recession period in which any rain was recorded at any of the five stations used to estimate
precipitation in the watershed and the maximum daily rainfall was just 0.04 inches. Therefore, the
exponential constant (-0.0717) in the equation below can be considered a base flow recession constant.
This recession rate, in turn, can be considered to be an upper bound for the rate at which streamflow
recedes in the watershed provided that the same antecedent soil moisture conditions and
evapotranspiration rates were present.
However, modifications to streamflow through effluent discharges, withdrawals and reservoir storage
can further complicate the development of a recession curve. Wang and Cai (2009) developed a method
to estimate these anthropogenic perturbations using an analytical approach. However, there are no
major reservoirs in the Vermilion River watershed upstream of Pontiac or withdrawals upstream of
Pontiac, and monthly effluent discharge rates are available from the National Pollution Discharge
Elimination System (NPDES). The main discharging facility upstream of Pontiac whose releases would
reach the Pontiac intake during a low-flow period is Fairbury, whose effluent discharge during a 7Q10
discharge was estimated to be 0.50 cfs (Illinois State Water Survey, 1984). The Illinois State Water
Survey (Knapp, 1988) has developed an empirical function to estimate effluent discharges during flows
of particular frequencies and durations as a percentage of the average daily effluent discharge from a
facility. This function, which is embedded in the Illinois Streamflow Assessment Model (ILSAM), states
7Q10, 61Q50 and 91Q50 low flows constitute 63, 68 and 64 percent of the average daily discharge rate.
The latter two rates are based on the 79-day duration of this drought period (August 24 – November 8)
and the roughly 50-year frequency that can be associated with this drought, which is the worst drought
of these durations at the Vermilion River at Pontiac gauging station (05554500). Since these estimates
fall within 10 percent of the 7Q10 effluent discharge estimate made in 1984, the 1984 7Q10 effluent
(4.4)

79
discharge estimate of 0.50 cfs was used as a lower bound for the recession curve without any further
adjustment. Therefore, Equation 4.4 changes to:
Next, this equation needs to be applied to estimate the LHD inflow rate on August 24, the end of the
water balance period. Using the water balance method, the average discharge during the period
spanning the water level measurements taken on August 18 and August 24 is 3.50 cfs, which is greater
than the average discharge of 2.84 cfs estimated for the period between August 10 and August 18.
However, this increase in the average discharge is likely due to the effects of a small storm on August
22-23 during which 0.52 inches of rain fell in the watershed. This miniature peak likely diminished soon
after the storm. Given that (i) the flow rate was likely relatively constant between August 10 and
August 18, a period during which there was not more than 0.10 inches of rain during a single day, and (ii)
August 24 is only six days after August 18, using 2.84 cfs as the initial discharge in Equation 4.5 seems
plausible.
Next, the amount of precipitation in the watershed between August 24 and November 11 was
investigated to examine the validity of Equation 4.5 for estimating the streamflow during this period.
The watershed received a total of 5.04 inches of precipitation between August 24 and November 8 while
another 1.40 inches fell during a storm on November 9 – 10 that caused water in the LHD to begin
spilling again on November 11. Other notable periods of rainy weather during this 81-day interval
include 0.96 inches between September 16 and 20 and 1.10 inches between October 16 and 19. Given
this amount of rain, along with lower evapotranspiration rates during the fall, it appears unlikely that
the streamflow would have actually receded at the rate suggested by Equation 4.5.
The Illinois Streamflow Assessment Model (ILSAM) offers another source of information for
corroborating this recession curve estimate. This statistical model predicts streamflow at ungauged
(4.5)

80
locations as a function of their watershed area, soil permeability and net excess precipitation and
adjusts estimates for water withdrawals, effluent discharges and reservoir effects (Knapp and Russell,
2004). These regional regression equations are calibrated on observed hydrologic data from a set of
gauging stations lying within a given region in which the surficial geology is relatively homogenous.
Much of the Vermilion watershed upstream of Pontiac lies within the Bloomington Ridged Till Plain
physiographic region that Leighton et al. (1948) defined. The regression equation used to estimate the
flow available at the Pontiac intake is calibrated on gauging stations in this physiographic region lying
both within and outside of the Vermilion River watershed. The flows registered at gauging stations
used for calibration had a period of record from 1942 to 2001. The flow statistics at stations that were
not operational during this entire period were adjusted using index stations following procedures
described in Knapp (1990). Meanwhile, adjustments to flow frequencies due to persistence, i.e.,
defined as the occurrence of low flows below a given threshold in consecutive years, were applied using
methods from Douglas et al. (2002).
Table 4.3 contains the flow frequency values for low flows of varying durations and frequencies at the
Pontiac intake location, of which the 50-year low flow estimates of 2.0 cfs and 2.6 cfs for 61- and 91-day
durations are most noteworthy for estimating the inflow into the LHD impoundment. An examination
of the flow record at the Pontiac gauging station reveals that 1988 was the only year during which
annual low flows of these durations were equal to zero. However, historic withdrawals must also be
considered when identifying the drought of record at this location. In 1953, a year when the average
daily withdrawal rate was reported to be 1.0 mgd (Knapp, 1988), or 1.55 cfs, the 61- and 91-day low
flows were just 0.25 cfs and 1.20 cfs, respectively. If water had been withdrawn at the 1988 drought
rate of approximately 2.5 mgd (3.87 cfs) in 1953, then zero flow conditions would have also occurred
during these periods. Even the reduced rates at which Pontiac consumed water following the institution
of restrictions (2.1 mgd, 3.25 cfs) on August 1 would have produced zero flow conditions in 1953 while

81
the even lower rate of abstraction (1.65 mgd, 2.55 cfs) that occurred after supplemental sources began
being used in 1988 would have resulted in a 61-day low flow of zero and a 91-day low flow of just 0.20
cfs. Therefore, one can conclude that the 1953 drought was almost as severe as its 1988 counterpart. If
the 1988 drought is considered to be the sole drought of record, then it has a recurrence interval of
approximately 68 years while if it is considered to be on par with the 1953 drought, it has an interval of
just 34 years. Given the uncertainty of the historic withdrawal rates and discharge measurements, it
can be argued that the severity of the 1988 drought may have fallen between these two recurrence
intervals.
Considering this logic, it is reasonable to assume that the low flows observed at Pontiac in 1988 have a
recurrence interval of approximately 50 years. Given that there were 81 days spanning the period
between August 24 and November 11, 1988, an estimate of the inflow into the LHD impoundment of 2.4
cfs can be linearly interpolated from the respective 61- and 91-day estimates of 2.0 cfs and 2.6 cfs
produced from the ILSAM model. On the other hand, the average inflow during this 81-day period
estimated using the recession curve is just 1.01 cfs, which is less than 50 percent of the estimate
obtained using the ILSAM model. Since the LHD functions as an impoundment, the sequence of these
flows does not have a major influence on the amount of water available to the community for storage,
as there are no losses due to spills during this 81-day period. Given these considerations, the daily
inflow into the LHD was assumed to have a constant value of 2.40 cfs during the 84-day period during
which the water balance approach could not be applied.
Furthermore, the estimate generated with the ILSAM model appears reasonable given the combination
of two other field discharge measurements. Knapp (1988) measured a discharge of 0.50 cfs at a location
on the Vermilion with 88 percent of the drainage area of the Pontiac’s intake on the Vermilion River
while Tuley (2011a) recalled a study that estimated that springs located immediately to the east of
82
Pontiac contributed 1.5 mgd (2.27 cfs) to the flow of the river, although the extent to which this flow
varies during droughts in unknown. Assuming a constant discharge from the spring and no other
sources of flow between the location where Knapp (1988) took his measurement, a low-flow discharge
of 2.77 cfs entered the impoundment on August 10, 1988, which is close to the ILSAM low-flow
estimate. In addition, since the low-flow period that the ILSAM estimate covers begins on August 24,
the inflow on August 10 should be a little higher.
While the recession curve calibrated on the May 31 – June 30, 1988 period is not used to estimate the
inflow into the impoundment during the 1988 drought, it can be retained to model the decline in inflow
into the LHD impoundment during the periods of less than ten days during which water ceased to pass
over the crest of the LHD during seven other years. Although the recession rates vary between events
due to difference in antecedent soil moisture conditions and evaporation rates, using the curve
developed for this period in 1988 in which less than 0.2 inches of rain fell in the watershed is
appropriate for modeling the decrease in inflow into the LHD impoundment during the other short
periods when no discharge was recorded at the gauging station. Furthermore, as discussed previously,
pumping from the LHD impoundment would still be possible after ten days of no inflow. Therefore,
further effort in modeling low flows in years other than 1988 is unwarranted given that they would
definitely be a non-binding constraint in the model. However, it is necessary to adjust Equation 4.5 to
reflect the change in the initial inflow value from which the recession is modeled. The simplest way to
do this is to set Q0 equal to the sum of the withdrawals and net evaporation from the LHD
impoundment.
(4.6)

83
Finally, given the uncertainties in both measuring low flows and estimating low flow frequency statistics,
it is worthwhile to conduct a sensitivity analysis of these estimates on the system’s firm yield. This
sensitivity analysis is described further in Section 3.1.2 and the results are presented in Section 5.1.2.
4.2 Nitrate Concentrations
Modeling the nitrate-N concentration in the raw water that is pumped to the WTP requires an estimate
of the nitrate-N concentrations in both the river (LHD impoundment) and the reservoir. Furthermore,
an estimate of the nitrate-N concentration in the reservoir must also take into account the rate at which
nutrient dynamics, such as denitrification, change the concentration of nitrate within the reservoir as
well as the deposition of airborne nitrate through precipitation (wet deposition) and fallout (dry
deposition). This section focuses on the data available for estimating the nitrate-N concentration in the
Vermilion River and the atmospheric deposition of nitrate directly onto the reservoir surface. The
method used to estimate the daily change in the nitrate-N concentration in the reservoir assuming a
simple first-order decay rate is described in Section 2.2 as are the processes through which the
concentration of nitrate-N changes within the reservoir. All concentrations used in this research
indicate the concentration of nitrate measured as nitrogen, a metric which is used in the USEPA’s
Maximum Contaminant Level (MCL) standard. To obtain the actual nitrate concentration, simply
multiply the nitrate-N concentration by a factor of 4.5.
4.2.1 River Nitrate-N Concentrations
Operators at the Pontiac water system have been concerned about the nitrate-N concentration in their
water for nearly a century, as grab samples were collected from their intake as early as 1913 (Keefer et
al., 1996). During the earlier part of the 20th century, nitrate concentrations in the Vermilion River
were much lower than they are today since the application of nitrogen-based fertilizers in the watershed
was not nearly as widespread. As fertilizer use increased during the second half of the 20th century,

84
nitrate-N concentrations in the Vermilion River rose accordingly (Keefer et al., 1996). In 1957, concerns
about the rising concentrations and new research linking high nitrate-N concentrations in drinking water
to methemoglobinemia (e.g., Comly, 1945; Walton, 1951) prompted the establishment of monthly
monitoring on the river. In 1973, sampling at Pontiac increased to weekly intervals with some
irregularities. In 1988, the monitoring frequency increased to daily and, in 1998, the system began
taking sampling at three designated times of day (1:00, 9:00 and 17:00 hours), a practice which
continues to date. All recorded data have consisted of a single grab sample taken from shore (McIsaac,
2010). Although these grab samples are not representative of the average area-integrated concentration
at the intake, they are probably more representative of the water that is pumped to the reservoir and
the treatment than an area-integrated sample would be. Prior to November 1995, samples were
analyzed using cadmium reduction while the samples collected thereafter were evaluated using an ion-
specific electrode (McIsaac, 2010).
From May 1, 1979 to February 29, 1988 nitrate-N concentrations were only measured on a quasi-weekly
basis. The consequence of modeling with a coarser than daily time step is that the number of days
during which pumping can occur within the period becomes either zero or the total number of days in a
period. To avoid this disadvantage, daily nitrate-N concentration values were estimated for days
between May 1, 1979 and March 1, 1988 during which samples were not collected using a linear
interpolation scheme. On the other hand, when more than one sample was collected during a day
(beginning in 1998) the daily mean of the samples was used in the model.
4.2.2 Atmospheric Nitrate-N Deposition
Atmospheric sources of nitrate supplement the influx of nitrate pumped into the OSBR. Atmospheric
nitrate deposition enters the reservoir through wet deposition, in which precipitation transports nitrate
into the reservoir, as well as dry deposition, in which nitrate enters the reservoir as wind-blown

85
particulate matter. Weekly wet nitrate concentration data are available from a weather station in
Bondville, located 91 miles south-southeast of Pontiac, for the entire duration of the study period while
dry deposition data were available from the same station beginning in 1988. Wet deposition data,
reported as concentrations of nitrate (as opposed to nitrate-N) in mg/L, were accessed through the
National Atmospheric Deposition Program’s (NADP) National Trends Network. Dry deposition data were
available from the USEPA’s Clean Air Status and Trends Network (CASTNET) and were reported as a flux
of nitrate (kg/ha) and subsequently converted into a concentration measured in mg/L based on the
storage volume in the reservoir at the beginning of a day. The dry deposition of nitrate is computed by
summing particulate nitrate (NO3-) and nitric acid (HNO3), as the latter dissociates into nitrate when it
goes into solution.
Since Bondville is located more than 90 miles south-southeast of Pontiac, atmospheric deposition data
from other stations was also evaluated. However, long-term wet deposition averages from the
Argonne Station in northern Illinois (68 miles northeast of Pontiac) showed that there was not a
substantial north-south gradient in wet atmospheric deposition. In addition, since dry deposition was
not recorded at the Argonne station, the Bondville data were assumed to be representative of the
deposition at Pontiac. Deposition in the low-head dam impoundment was not accounted for in the
model since this deposition was assumed to contribute to the concentration measured at the intake,
which is situated in the impoundment.
Weekly concentrations from both data sources were computed using weeks running from the Tuesday
of one calendar week through the Monday of the following calendar week. These weekly average
concentrations were also assumed to be the daily concentrations during all seven days of the week-long
sampling period. Missing wet deposition data that occurred during a week in which there was little to
no precipitation were assumed to be zero. In all other cases, the nitrate concentration during weeks

86
with missing data were assumed to be the average of the concentrations measured during the first week
prior to the week of missing data and the first one measured after it provided that there was significant
precipitation during each of these weeks. In the case that there was not any significant precipitation
during one of these two weeks, the concentration of nitrate-N in precipitation during the week with
missing data was assumed to be the same as the concentration during the week in which there was
precipitation. All nitrate concentrations were subsequently divided by a factor of 4.5 so that they could
be reported in terms of their nitrogen content (as nitrate-N).
Overall, atmospheric deposition contributes 10.2 percent of the total nitrate-N load that enters the
reservoir over the course of the study period when the system is simulated with the Base Case Scenario
and River Concentration Rule. The average daily load that enters the reservoir through pumpage into
the reservoir is 10.9 kg/d while the load from all sources of atmospheric deposition is 1.24 kg/d, the
latter which consists of 0.96 kg and 0.28 kg of wet and dry deposition, respectively. Meanwhile, their
respective maximum loads that enter the reservoir through each of these pathways are 62.1 kg and 2.48
kg while their minimum daily loads were both 0.00 kg. The maximum weekly wet deposition
concentration was 3.46 mg/L while the dry deposition can only be measured as a flux since it does not
enter the reservoir in solution.
4.3 Reservoir Water Temperature
The fate of nitrogenous compounds that enter the reservoir is dependent upon the temperature of the
water in it. Although nitrate losses can occur through a variety of mechanisms, denitrification
processes inspire the first-order decay rates employed in this study. To characterize denitrification,
estimating the water temperature at the water-sediment interface is most critical for estimating nitrate
losses since the anoxic conditions required for water column denitrification are not likely to be present
in this shallow body of water. For simplification purposes, the temperature at the sediment-water

87
interface is assumed to be homogenous and insensitive to any changes in depth that result from
reservoir drawdown.12
Both energy balance and empirical approaches can estimate the temperature of the water at the
sediment-water interface. However, the uncertainty of meteorological data from nearby stations (wind
speed, relative humidity, air temperature, dewpoint temperature) prevents the closure of an energy
balance, an empirical approach for estimating the temperature was sought. Kothandaraman and Evans
(1970) found that sinusoidal regression equations could explain 96 percent of the annual variation in
water temperature at two-foot depth intervals in Lake Bloomington, an on-stream reservoir in central
Illinois located approximately 22 miles southwest of Pontiac. While Lake Bloomington, with an average
depth of 12.9 ft and a maximum depth of approximately 35 ft (Raman and Twait, 1994), is likely much
more thermally stratified than the Pontiac reservoir, using the equation below for estimating the water
temperature at a depth of 8 ft in Lake Bloomington from Kothanadaraman and Evans (1970) is
reasonable given that this depth lies within the lake’s epilimnion. The epilimnion of stratified lake is
sensitive to air temperature similar to the water in a shallow and relatively unstratified lake.
where x represents the number of days since March 1. This equation, which expresses water
temperature as a function of seasonal temperature variability, explained 96 percent of the variability of
water temperature measurements taken at a depth of eight feet in Lake Bloomington in 1962
(Kothandaraman and Evans, 1970). Finally, a sensitivity analysis of the firm yield to the OSBR
temperature estimate is conducted to shed light on the importance of this variable.
12
Given that water can be pumped from the reservoir until it is 80 percent depleted, it is possible that the depth of the reservoir may drop below two feet, and even further if evaporation continues to reduce storage after pumping can no longer occur.
(4.7)

88
4.4 Net Evaporation
The net evaporation in both the off-stream reservoir and low-head dam impoundment were computed
in this study. Both of these estimates require three different sources of information:
a) Gross lake evaporation
b) Precipitation
c) Surface area
The daily gross evaporation rates from the reservoir and impoundment were estimated from a
combination of daily potential evaporation estimates and monthly pan-to-lake correction coefficients.
The Illinois State Water Survey’s Water and Atmospheric Resources Monitoring (WARM) program
collected meteorological data that were used to estimate potential evaporation between January 1,
1989 and April 30, 1999 at stations in Stelle, Illinois, located 25 miles east-northeast of Pontiac and
Peoria, Illinois, located 52 miles west-southwest of Pontiac (Figure 4.4). These estimates were averaged
arithmetically to obtain potential evaporation estimates for Pontiac given the imprecision of pan
evaporation data. During days when one station had missing data, the estimated pan evaporation at
Pontiac was assumed to be the value measured at the other station.
To estimate potential evaporation in years prior to 1989, average monthly values of daily potential
evaporation rates measured at the WARM stations are utilized except for the five-month period from
May to September, 1988 during which daily pan evaporation measurements that the Water Survey
collected at Hennepin, Illinois are used. Monthly pan-to-lake coefficients were computed using
estimates of monthly pan and lake evaporation based on air temperature, dewpoint temperature,
relative humidity, solar radiation and wind speeds observed at the Peoria weather station between 1911
and 1962 (Roberts and Stall, 1967). These monthly pan-to-lake coefficients were assumed to be the
same during each year of the study period and valid for current conditions (Table 4.1). The unavailability

89
of data between 1962 (Roberts and Stall, 1967) and 1988 and possible differences in measurement
techniques make it difficult to conduct a valid test for statistically significant long-term trends.
Precipitation on the surface of water bodies offsets evaporative losses. Daily precipitation data from
the Pontiac weather station (116910) were available from the Midwest Regional Climate Center
(MRCC).13 Finally, the surface area estimate of 250 acres was obtained through Environmental
Protection Agency reports (IEPA, 2004) verified as a reasonable estimate during telephone
conversations with operators (Tuley, 2010). To simplify the analysis and compensate for the lack of
bathymetric survey of the reservoir, the surface area was assumed to be constant with depth. Finally, a
review of the uncertainty of gross lake evaporation and precipitation can be found in Section 3.1.2.
4.5 Water Demand
Annual water demand data were obtained from the Illinois Water Inventory Program at the Illinois State
Water Survey (ISWS). Conversations with operators at the Pontiac Water System verified these data as
needed (Tuley 2008; Tuley 2010). The seasonal distribution of demand is also incorporated into the
model. Tuley (2010) reported that, in 2009, the highest daily demand was approximately 11 percent
greater than the system’s average daily demand and the lowest average daily demand was
approximately 13 percent less than the system’s average daily demand. To account for this seasonal
variability, a monthly demand function was developed, with the average daily demand in July equal to
112 percent of the annual average daily demand and the average daily demand in January equal to just
88 percent of the annual average daily demand (Figure 4.6). These monthly adjustment factors are
applied to the annual demand estimates for all years during the study period.
13
Missing data were replaced with values recorded at the Fairbury station situated approximately 12 miles southeast of Pontiac on four occasions.

90
Finally, one should note that the community water demand can increase during a drought. First, the
demand of a community water system can increase substantially during a drought, especially if the
drought takes place during hot summer months. On the contrary, water demand management
practices, in the form of either voluntary or mandatory conservation practices, may mitigate these
increases or even reduce demand if severe restrictions are in place and enforced. Although these
increases are not explicitly incorporated into the model, they should be taken into account when
assessing whether the estimated firm yield is indeed adequate for the community. In Pontiac, the
extent to which drought-induced changes in demand influences the firm yield depends upon the relative
impacts that low flow conditions and water quality impairment have on the firm yield. If low flow
conditions are the primary control on the firm yield, then the changes in the demand during droughts
merit particular attention.

91
Figures and Tables
Figure 4.1(a): Pontiac raw water withdrawals as reported to the Illinois Water Inventory Program.
Figure 4.1(b): Adjusted Pontiac raw water withdrawals
0.00
0.50
1.00
1.50
2.00
2.50
3.00
1980 1985 1990 1995 2000 2005
Ave
rage
Dai
ly D
em
and
LHD OSBR
0.00
0.50
1.00
1.50
2.00
2.50
1980 1985 1990 1995 2000 2005
Ave
rage
Dai
ly D
eman
d (
mgd
)
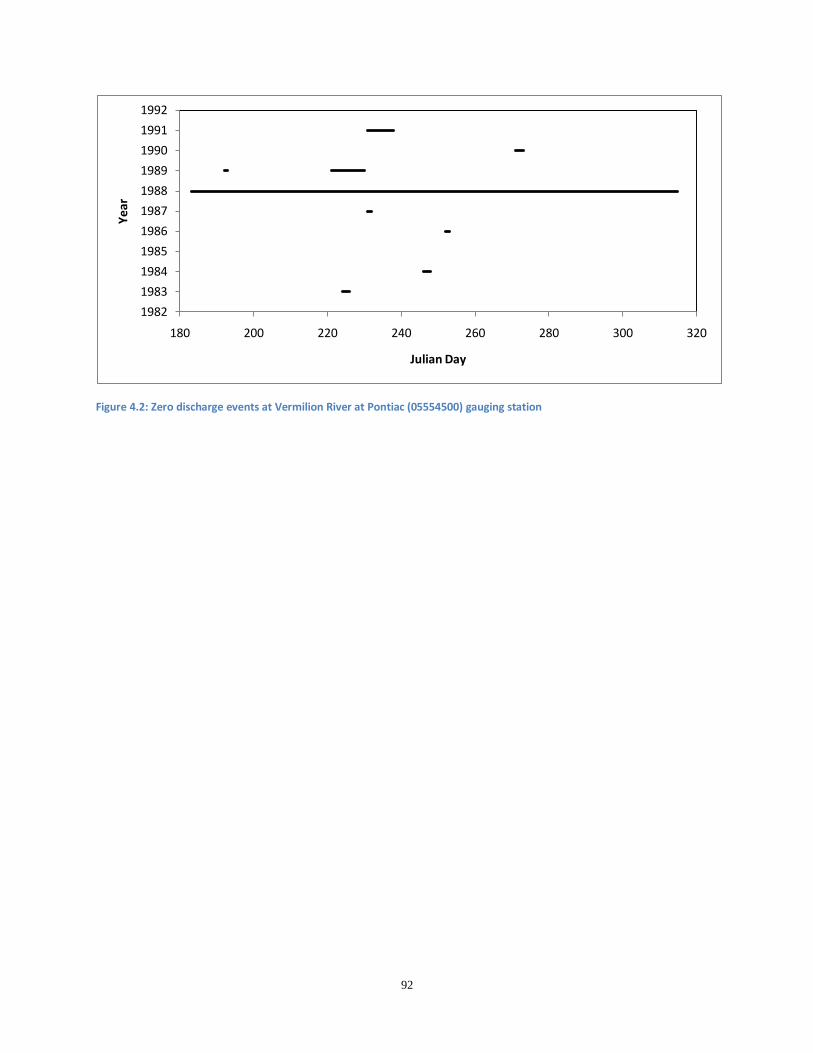
92
Figure 4.2: Zero discharge events at Vermilion River at Pontiac (05554500) gauging station
1982
1983
1984
1985
1986
1987
1988
1989
1990
1991
1992
180 200 220 240 260 280 300 320
Ye
ar
Julian Day

93
Figure 4.3: Location of meteorological and atmospheric deposition stations used in study.

94
Figure 4.4: Recession curves during years with zero discharge at USGS gauging station 05554500
Figure 4.5: Recession curve fit to 1988 discharge. Note: This curve ended up being used to estimate the inflow into the impoundment during all years but 1988, as additional water balance data are available for 1988. See Section 4.1 for an explanation.
0
20
40
60
80
100
120
140
160
0 10 20 30 40 50 60 70
Dsi
char
ge (c
fs)
Days Since Start of Recession
1983
1984
1986
1987
1988
1989
1990
1991
0
10
20
30
40
50
60
70
80
27-May 1-Jun 6-Jun 11-Jun 16-Jun 21-Jun 26-Jun 1-Jul 6-Jul
Average daily discharge
Modeled recession curve
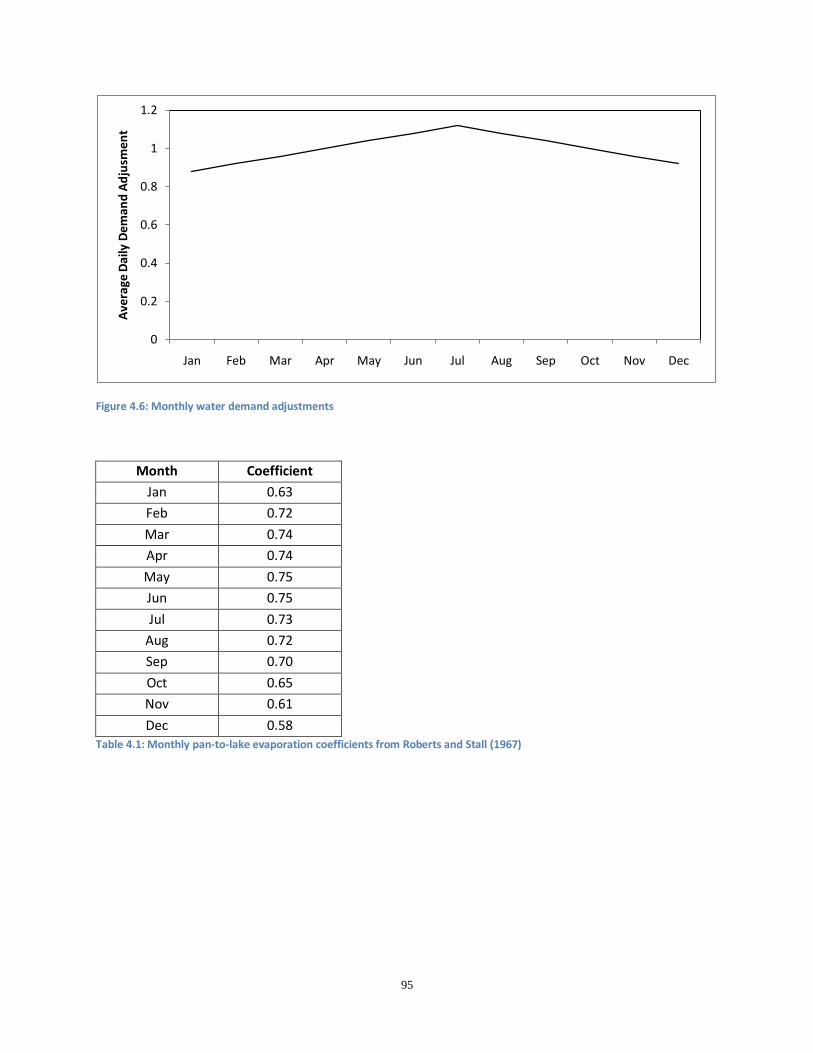
95
Figure 4.6: Monthly water demand adjustments
Month Coefficient
Jan 0.63
Feb 0.72
Mar 0.74
Apr 0.74
May 0.75
Jun 0.75
Jul 0.73
Aug 0.72
Sep 0.70
Oct 0.65
Nov 0.61
Dec 0.58 Table 4.1: Monthly pan-to-lake evaporation coefficients from Roberts and Stall (1967)
0
0.2
0.4
0.6
0.8
1
1.2
Jan Feb Mar Apr May Jun Jul Aug Sep Oct Nov Dec
Ave
rage
Dai
ly D
em
and
Ad
jusm
en
t

96
Date Drawdown
July 26 0 inches
August 4 5.5 inches
August 10 8.0 inches
August 18 11.0 inches
August 24 10.0 inches
September 2 11.5 inches
September 7 12.0 inches
October 25 7.5 inches Table 4.2: Observed drawdown in LHD impoundment during 1988 drought reported in Knapp (1988).
Flow Frequency (Recurrence interval in years)
Duration (days) 2 10 25 50
1 5.5 2.3 1.6 1.0
7 6.6 2.4 1.8 1.2
15 8.3 2.8 2.1 1.4
31 10.7 3.7 2.4 1.6
61 13.6 5.0 3.0 2.0
91 21.2 7.2 3.9 2.6 Table 4.3: Low-flow frequency estimates from ILSAM model. Data courtesy of Illinois State Water Survey.
97
5. Results
This section presents the results obtained with the methods described in Chapter 3.
5.1 Comparison of Water Quality Operating Rules
5.1.1 Base Case Scenario Results
When running the Base Case Scenario, the system has a firm yield of 2.21 mgd, 2.34 mgd and 2.67 mgd
under the RivCR, ResCR and HybCR water quality operating rules (WQOR), respectively. All three of
these yields exceed Pontiac’s 2005-2009 average daily demand of 1.95 mgd based on records from the
Illinois Water Inventory Program (IWIP). The change in reservoir storage over time among all three
scenarios in similar (Figure 5.1), but the trajectory of the nitrate-N concentration in the OSBR is notably
different (Figure 5.2).
The storage in the OSBR follows a similar trajectory under all three WQOR (Figure 5.1). However, there
are some notable differences. First, if the average daily demand is infinitesimally raised above the firm
yield, a shortage occurs on August 19, 1990 under RivCR and ResCR while one takes places one June 27,
1991 under HybCR. Under ResCR, the reservoir storage plummets to 405.9 AF on August 18, 1990 and
the reservoir nitrate-N concentration is 4.67 mg/L. On August 19, the nitrate-N concentration in the
LHD is 9.8 mg/L, which exceeds the of 9 mg/L that is in place since the storage in the reservoir is
less than the BRR on this day. The full amount of water needed to reduce the nitrate-N concentration
to 9 mg/L cannot be pumped from the reservoir because it would reduce the storage in the reservoir
below 20 percent of capacity. Since the reservoir is last full on December 28, 1987 under all three
scenarios, the critical period lasts approximately 32 months under RivCR and ResCR while its duration is
roughly 42 months under HybCR. There is a longer duration under HybCR since the reservoir storage
recovers the most in late 1989 under this scenario and just barely avoids running out of water in August
1990 during an extended blending period.

98
Some of the other minor differences in the change in storage between the scenarios run with each of
the three WQOR can also be attributed to different causes of reservoir depletion as well as the different
firm yields attained under each of the three simulations. When water quality blending is the primary
cause of reservoir depletion, e.g., 1981-82, the volume of storage in the reservoir drops the furthest
under HybCR because more water is being withdrawn from it due to the higher firm yield achieved
under this WQOR. However, when streamflow depletion is the primary cause of the loss of storage, as
in 1988, the reservoir storage diminishes the most under RivCR because there are fewer opportunities
to refill the reservoir under this rule. Conversely, the reservoir can be filled more quickly under ResCR
and HybCR because there are fewer restrictions on pumping. A detailed interpretation of the changes in
reservoir storage can be found in Section 5.2.
On the other hand, the change in nitrate-N concentration in the reservoir varies much more dramatically
between WQOR, especially between RivCR and the two rules with reservoir concentration-based inflow
constraints. Under RivCR, the concentration is often well below 4 mg/L because water from the river
cannot be pumped into the reservoir when its concentration exceeds 4 mg/L regardless of the
concentration of the reservoir. If the nitrate-N concentration of water that can be pumped into the
reservoir were uniformly distributed, then the average inflow concentration would just 2 mg/L,
disregarding the influence of atmospheric deposition and evaporation on the concentration in the
reservoir. On the other hand, under ResCR, the reservoir nitrate-N concentration quickly rises from 2.0
mg/L to 4.0 mg/L and then oscillates around the 4-mg/L line for the remainder of the simulation (Figure
5.2). When the concentration rises above 4 mg/L due to either evaporation or atmospheric deposition,
the system reverts to a RivCR under which river water can only be pumped into the reservoir if its
concentration is below 4 mg/L. During most years, a mid- to late-summer period during which nitrate-N
concentrations in the river are well below 4 mg/L allows for low-nitrate water to be pumped to the

99
reservoir and bring its concentration back below 4 mg/L. This allows for the ResCR rule to come into
effect again.
Next, the performance of the system under the HybCR is evaluated. However, before simulating the
system under this rule, it is necessary to determine the maximum concentration of nitrate-N in the river
under which water could be pumped into the reservoir. To do this, the firm yield of the system is
computed with river concentration thresholds at 1 mg/L intervals between 4 mg/L and 30 mg/L while
the reservoir concentration maximum remained set at 4 mg/L. The highest firm yield (2.67 mgd) is
obtained when the maximum river nitrate-N concentration is set to 8 mg/L (Figure 5.3). Non-integer
values are not tested due to the unlikelihood of their use in water quality operating rules.
The nitrate-N concentration in the reservoir under HybCR follows a similar trajectory to ResCR, although
the concentration is almost always lower due to the moderating effect of the constraint that
limits inflow to water with a nitrate-N concentration of 8 mg/L or lower. Evaporation, along with dry
atmospheric deposition, often elevates the concentration above the value of 4.0 mg/L. (Wet
deposition, on the other hand, has a diluting effect, as the maximum nitrate-N concentration in wet
deposition during the twenty-year study period is just 3.46 mg/L, which is less than the 5 mg/L, the
lowest value of tested in this sensitivity analysis.) Thus, instances in which the concentration
under HybCR exceeds that of ResCR are related to differences in releases from the reservoir under these
two WQORs.
5.1.2 Sensitivity to Water Quality Inflow Constraint Values
This section begins with a presentation of the results of the sensitivity of the firm yield to water quality
inflow constraint values for each WQOR. First, the relationship between and the firm yield
under RivCR is evaluated for values of 5 mg/L to 9 mg/L at 1-mg/L intervals for all values of
that are less than or equal to . For all five values of tested, the relationship

100
between and the firm yield is monotonically increasing between 3 mg/L and (Figure
5.4).
Next, the relationship between and the firm yield under ResCR is evaluated for
values of 5 mg/L to 9 mg/L at 1-mg/L intervals for all values of that are less than or equal to
(Figure 5.5). The relationship between and the firm yield is monotonically
increasing except that the firm yield abruptly drops to 0.00 mgd when approaches the value
of . For all five values of tested, a firm yield of 0.00 mgd is registered when
equals . The firm yield falls to 0.00 mgd when approaches
because the nitrate-N concentration in the reservoir rises above . If blending is necessary
when the reservoir concentration exceeds a shortage occurs. The nitrate-N concentration
value in the reservoir can rise above the value specified in the constraint because evaporation
elevates the concentration above this threshold.
In most cases, the firm yield under ResCR is slightly higher than the firm yield obtained under RivCR
when the firm yields obtained for a given value of are compared with those obtained for the
same value of . However, when very strict water quality constraints are applied, e.g.,
= 3 mg/L, = 5 mg/L, the firm yield is slightly lower than the one obtained under the
RivCR because the increase in the nitrate-N concentration of the reservoir causes more water to be
depleted through blending than is gained through additional storage opportunities. This relationship is
more likely to take place when stricter water quality constraints are instituted because river water must
be blended a higher percentage of the time.
Then, the relationship between and the firm yield under HybCR is evaluated for
values of 5 mg/L to 9 mg/L at 1-mg/L intervals for all values of that are less than or equal to
(Figure 5.7). The value of is set to 8 mg/L since it is shown in Section 5.1.1 that the
101
maximum firm yield is obtained under HybCR when is set to 8 mg/L. For values of
ranging from 5 mg/L to 6 mg/L, the relationship between and the firm yield is monotonically
increasing under each value until the value of approaches . The firm yield
is 0.00 mgd whenever equals for the same reasons as in ResCR. On the other
hand, when ranges from 7 mg/L to 9 mg/L, there is a monotonically increasing relationship
between and the firm yield up until = 5 mg/L. After reaches 5 mg/L,
the firm yield cannot increase any further because the set to 8 mg/L constrains further
pumpage into the reservoir. In fact, the firm yields attained with set to 7 mg/L (2.42 mgd), 8
mg/L (2.83 mgd) and 9 mg/L (3.37 mgd) precisely equal the firm yields attained under RivCR when
is set to 8 mg/L and values are set to 8 mg/L and 9 mg/L, respectively.
In Section 3.1, the relevance of this sensitivity analysis in reference to the realistic blending operations
of the system is acknowledged. Thus, a brief summary of the results for each of the three WQOR with
= 6 mg/L and 7 mg/L is warranted. Under = 7 mg/L, the firm yields under RivCR,
ResCR and HybCR are 1.92 mgd, 1.99 mgd and 2.29 mgd, respectively. The first two of these values
approximate the 2005-2009 average daily demand of 1.95. Meanwhile, these values diminish to just
1.66 mgd, 1.69 mgd and 1.98 mgd, respectively, when = 6 mg/L. These results demonstrate
the importance of properly characterizing the blending operations of the system in the simulation
model.
5.2 Evaluating Limitations to the Firm Yield
5.2.1 Interpretation of Base Case Scenario Reservoir Storage Time Series
Figure 5.1 demonstrates that the changes in reservoir storage under the three WQORs follow a similar
trajectory. As a result, the causes of change in reservoir storage, such as high nitrate-N concentrations,

102
streamflow deficits and net evaporation are reviewed in detail for the storage time series generated
with RivCR. Figure 5.7 illustrates the change in storage in the reservoir, which is divided into the
following five periods marked by distinct streamflow and water quality conditions in the Vermilion River
at the Pontiac intake:
1. Relatively normal conditions, 1979-1987.
2. Streamflow drought, 1988.
3. High nitrate-N concentrations, 1989-1991.
4. Recovery, 1991-1994.
5. Relatively normal conditions, 1994-1999.
In Period 1, which runs from May 1979 to December 1987, the reservoir storage typically decreases in
the spring due to the presence of high nitrate-N concentrations in the Vermilion River that require
blending. During most years, it becomes filled again during the latter part of each summer (typically
starting around mid-July) when nitrate-N concentrations rapidly diminish due to crop uptake and the
lack of outflow from tile drains (Tuley, 2010). However, in 1981, high nitrate-N concentrations prevent
the reservoir from being refilled completely while high nitrate-N concentrations during the subsequent
spring and summer reduce reservoir storage to a low of 1,059 AF on August 15, 1982. However, nitrate-
N concentrations decrease rapidly after this date and the reservoir becomes filled again on November
20 of that year. Also, although there are four years during Period 1 in which there are days during
which USGS discharge did not register discharge, all of these zero-discharge periods lasted fewer than
ten days and do not exert a significant influence on the firm yield of the system.
During Period 2 (1988), high nitrate-N concentrations first reduce the storage from capacity (2,026 AF)
on December 8, 1987 to 1,593 AF on June 30, 1988, the last day during which the estimated average
daily discharge was greater than zero at the Pontiac gauging station in 1988. Although water did not

103
pass over the LHD in significant quantities during the period spanning from July 1 to November 10, 1988,
during this period the system’s entire daily water supply was withdrawn entirely from the river and
pumped directly to the WTP. However, in this study, the system is being simulated as if there were an
OSBR in 1988. In this case, inflow into the LHD can accumulate while the system sustains itself through
releases from the OSBR. As a result, there are many instances during this period in which the system
withdraws water exclusively from the OSBR for three of four days, which allows the LHD to refill and
begin spilling over the crest of the dam again. Then, the system will pump water into the reservoir for
one day and, if the LHD impoundment is still spilling after the reservoir is filled, water can also be
directed to the WTP. However, pumping to the OSBR during the first day when it passes over the dam
again can also lower the water level in the LHD impoundment to the point that it ceases from spilling,
and the cycle repeats until streamflow changes substantially. Nonetheless, limits on pumping
opportunities available during this extended low-flow period drop the reservoir storage to just 1,154 AF
on November 9.
Next, in Period 3, poor water quality is the primary cause of reservoir drawdown. While there is brief
refilling period in November 1988 following the storm during which flow over the LHD resumed, the
nitrate-N concentrations are exceptionally high (see Figure 5.7) during the spring following the 1988
drought due to the accumulation of nitrate that occurred during the drought due to (i) the lack of storms
to transport the nitrate from cropland to streams and (ii) the lack of crop fertilizer uptake due to a
limited water input. During the summer of 1989, the recovery of storage in the OSBR is also limited due
to (i) two low-flow periods lasting a total of 11 days and (ii) a large storm on August 31 that raises the
nitrate-N concentration in the river substantially. In September, which is typically the month of the
year with the lowest average nitrate-N concentration, there is not a single day during which the nitrate-
N concentration in the river lies at or below 4.0 mg/L. As a result, the storage in the reservoir plummets
further until falling below the 20 percent threshold at which pumping to the water treatment is no

104
longer permitted on August 19.14 After the storage falls below this threshold, the system becomes
entirely dependent upon water pumped directly from the LHD to the WTP until the storage can rise
above this threshold again through either a pumping opportunity or direct rainfall. If the daily demand
cannot be fulfilled due to either insufficient flow or a nitrate-N concentration greater than ,,
then a shortage occurs.
If the firm yield is raised slightly above 2.21 mgd, then the first day on which there is a shortage is
August 19, 1990, the same day when withdrawals from the reservoir are prohibited since they would
reduce the storage to less than 20 percent of capacity. On that day, the nitrate-N concentration in the
Vermilion River is 9.4 mg/L, which exceeds the value of 9 mg/L that becomes instituted when
storage in the reservoir falls below the BRR. After a brief increase in storage due to direct precipitation,
the reservoir falls further below the 20 percent threshold (405 AF) and reaches a minimum of 393.9 AF
on September 7. However, during this decline, the nitrate-N concentration of the river has also fallen
below 9 mg/L, allowing the system to meet its daily demand through direct pumpage to the WTP. The
nitrate-N concentration in the river decreases further in September while the stream continues to flow
over the LHD. After attaining a peak in storage of 818 AF on February 9, 1991, in part due to the lack of
storm runoff during the winter, the storage falls again during a period in which the nitrate-N
concentration does not fall below the of 9.0 mg/L until June 28 just as the reservoir storage
(414 AF) approaches the 20 percent storage capacity threshold of 405 AF. The storage falls below the 20
percent pumping threshold to a minimum storage of 377 AF on July 9. However, the system can meet
its customer’s demand of 2.21 mgd through the pumpage of water directly from the LHD to the WTP
during the entire period when the storage in the reservoir is less than 20 percent, as the river nitrate-N
concentration remains below 9.0 mg/L until October 4.
14
Note that in a real-time management situation, the system could relax this threshold or even utilize a portable pump to siphon additional water. However, given the planning motivation of this problem, the objective of this study is to determine the firm yield that the system could have without subject to such adverse situations.

105
Then, during Period 4, the reservoir storage recovers from a low of 377 AF on July 9, 1991 until finally
becoming full again on September 28, 1994. During the summer of 1991, an extended low-nitrate
period occurs during which the nitrate-N concentration in the Vermilion River is below 4.0 mg/L on but
two days between July 9 and October 29. This permits the reservoir storage to recover to 1249 AF,
while direct rainfall boosts the storage to 1304 AF on December 3 of that year. High nitrate-N
concentrations reduce the storage to a minimum of 546 AF on August 27, 1992 and after peaking again
at 1136 AF on November 13, 1992, the storage declines to 740 AF on August 5, 1993.
The impact that the extreme rainfall of the summer of 1993 had on the recovery of reservoir storage is
particularly interesting. The Pontiac watershed received 29.1 inches of precipitation during a four-
month period running from June 1 to September 30 of that year and the net evaporation from the
reservoir during this period was -258 AF, i.e. the reservoir level rose by more than one foot due to net
evaporation alone. This rainfall also mobilized much of the excess nitrate in the watershed. As a
result, the average daily nitrate-N concentration of just 5.34 mg/L in 1994 was the lowest of all nineteen
full calendar years in the study period (Figure 5.8). This enabled the reservoir to be refilled rapidly, as
its storage rose from 958 AF on June 11, 1994 to 2,025 AF on September 28 of that year. Finally, Zone 5
consists of a period during which there are no droughts or extreme rainfall events that lead to
exceptionally high nitrate-N concentrations. As a result, the reservoir storage does not fall below 1,593
AF (July 16, 1997) after it becomes full for the first time in nearly seven years in 1994.
5.2.2 Causes of Pumped Reservoir Inflow Limitations and Required Releases
In addition, the extent to which streamflow, reservoir capacity and water quality limited pumping
impacted water shortages was explored. Under RivCR, only 10 percent of pumping limitations are a
result of low flow conditions (Table 5.1). On the other hand, reservoir capacity and water quality
constraints are responsible for 49 and 41 percent of the limitations, respectively. In addition, nearly 88

106
percent of all reservoir releases are for blending while just 12 percent of them to provide water to the
community when operating rules prevent pumping from the LHD to the WTP when water is not passing
over the dam (Table 5.2). Together, these findings corroborate the strong control that water quality has
on the firm yield of Pontiac.
Under ResCR and HybCR, water quality constraints have less of a relative impact on pumping
opportunities, as only 31 and 34 percent of limitations can be attributed to them under these two rules,
respectively. Conversely, capacity constraints are responsible for 61 and 57 percent of restrictions,
respectively. Meanwhile, less than ten percent of the limitation on reservoir filling is associated with
streamflow drought under these two rules (8 percent, ResCR; 9 percent, HybCR). Also, 89 percent of
all reservoir releases under these two rules are for blending while water shortages in the LHD trigger the
remaining 11 percent of them.
5.2.3 Sensitivity Analysis
This section contains the results of the analyses that examine the sensitivity of the firm yield to key
model parameters and variables introduced in Section 3.1. In some cases, the results of the sensitivity
analyses conducted with the same parameters and variables under ResCR and HybCR are also
presented.
OSBR Storage
The sensitivity of the firm yield to OSBR storage capacity with the surface area to capacity ratio (8.1)
held constant and the Base Case Scenario is computed for all three WQOR as well as a scenario under
which there are no water quality regulations (Figure 5.9). As expected, the relationship between
storage capacity and firm yield is monotonically increasing under all four water quality management
scenarios except when another binding constraint, in this case the treatment plant capacity of the
system, impedes a further increase. When there are no water quality regulations, the firm yield of the

107
system with a storage capacity of just 250 AF (2.71 mgd) exceeds the firm yield achieved under the Base
Case Scenario, which includes the reservoir capacity of 2,026 AF, and RivCR (2.21 mgd) by 0.50 mgd.
Under this “no regulations” scenario, a reservoir with only 1,250 AF of storage available is needed for
the firm yield reaches the maximum treatment plant capacity. The rate at which the firm yield increases
is relatively uniform up until it reaches the treatment plant capacity.
Next, the firm yield under HybCR is greater than that of RivCR and ResCR for all reservoir capacities
examined. This finding corroborates the hypothesis set forth in Section 3.1 that the yield attained
under HybCR is superior to the yield achieved under the other two WQOR. On the other hand, the
relationship between the firm yield under RivCR and ResCR is less consistent. When the storage
capacity is less than 3,500 AF, the firm yield is greater under ResCR except when the storage is set to 250
AF and 1,250 AF. Meanwhile, when it reaches 3,500 AF, the firm yield becomes consistently higher
under ResCR up until 5,000 AF, the highest storage capacity value examined in the sensitivity analysis.
By definition, inflows into the OSBR are always higher under ResCR than RivCR when is equal
to , as it is in this comparison, because the system reverts to RivCR when evaporation and/or
atmospheric deposition elevate the reservoir concentration above . Therefore, the higher
firm yield achieved under RivCR can be attributed to the increased blending demand under ResCR.
These results indicate that there are diminishing returns on firm yield as the reservoir capacity increases,
which indicates the limitations that other constraints, namely water quality and streamflow, pose to the
firm yield. Although the HybCR curve is higher than its two counterparts in Figure 5.9, its slope
between 2,000 AF and 5,000 AF is roughly parallel to the curves of the other two WQOR. In contrast,
there is less of a gradual decline in the marginal benefits of increased storage under the no regulations
simulation because the hard constraint of the system treatment plant capacity comes into play before

108
the gradual diminishing effect that water quality and streamflow constraints impose on the system firm
yield.
LHD Storage
Paradoxically, the firm yield decreased when the size of the impoundment was increased because
expanding the capacity of the impoundment also increased the number of days during which water did
not spill from it, as the operating rules of the system dictate that water cannot be pumped from the
impoundment to fill the reservoir when water is not passing over the crest of the dam (Figure 5.10).
When the LHD impoundment capacity was reduced by 80 percent, the firm yield only dropped less than
0.01 mgd. However, when the capacity is further reduced, the firm yield drops rapidly because the
operating rules dictate that the first 13.8 AF of water that pass through the impoundment should be
pumped to the OSBR.
OSBR Surface Area
Figure 5.11 demonstrates that the firm yield of the Pontiac OSBR system has a non-monotonic
relationship with surface area when the capacity of the reservoir is held constant and the system
employs RivCR under the Base Case Scenario. The firm yield slightly increases with surface area from
when the surface area is 25 acres (1/10 of the actual surface area of 250 ac) to 225 acres, and then
decreases with surface area thereafter. Two mechanisms explain the counterintuitive rise in firm yield
when the surface area increases from 25 to 200 acres. First, since water quality exerts a strong control
on the firm yield of the system and nitrate-N concentrations are highest in the Vermilion River following
storms, rainfall during these wet periods offsets depletion induced by blending. The net evaporation
during the 965-day period over which the shortage unfolds, which runs from the last day when the
reservoir was full (December 29, 1987) to the first day on which a shortage would occur if the demand
were raised slightly above the firm yield (August 19, 1990), is just 4.96 inches. Yet, this slightly positive

109
net evaporation value does not explain the increase in firm yield with surface area up to a surface area
of 225 ac. In addition to its storage augmentation effect, precipitation also dilutes the nitrate-N
concentration in the reservoir, as the average nitrate-N concentration in the precipitation that falls
directly onto the surface of the reservoir is just 0.37 mg/L. In contrast, the average nitrate-N
concentration of water pumped into the reservoir form the Vermilion River during the Base Case
Scenario simulation is 1.55 mg/L. Since more reservoir inflow originates from rainfall (15,243 AF) than
pumped inflow (11,188 AF) during the study period, this dilution is substantial and reduces the amount
of water that needs to be released for blending.
Meanwhile, the firm yield ceases to rise with the surface area after the surface area increases past 225
acres. Since (i) the net evaporation rate is the same regardless of the surface area, (ii) a further increase
is surface area only enhances the dilution effect of precipitation, another explanation is needed. The
date of the first water shortage when the firm yield is slightly raised is June 28, 1991 when the surface
area is 200 acres, as opposed to August 19, 1990, when the first shortage occurs when the reservoir has
a surface area of 250 ac. The firm yields attained under these two simulations are virtually identical
(2.21 mgd). Yet, there are some noteworthy differences in the change in storage between the two
simulations. The drawdown that took place between December 1987 and August 1990 resulted from a
combination of a streamflow deficit and degraded water quality following the drought. On the other
hand, the LHD impoundment remains full during the period between August 1990 and June 1991, as
high nitrate-N concentrations severely limit opportunities to fill the reservoir. When there is a surface
area of just 200 acres, the storage in the reservoir on November 9, 1988, the second to last of the
consecutive 133 days during which there was a zero-discharge estimate at the Pontiac gauging station
that year, the storage in the reservoir is 1,228 AF as opposed to 1,154 AF with a surface area of 250 ac.
This indicates that, when the surface area is reduced, the system is able to withstand the drought
through 1990. However, when the surface area is reduced, the system becomes more vulnerable to

110
extended periods of high nitrate-N concentrations since less rainfall can replenish storage and dilute the
reservoir.
Pumping Capacity
The sensitivity of the firm yield to increases in the capacity of the pump that fills the OSBR is also
explored under RivCR (Figure 5.12). When the capacity of the pump is doubled, the firm yield rises
from 2.21 mgd to 2.71 mgd. The rate at which yield increases with pumping capacity declines as the
pumping rate is increased further. These diminishing returns can be attributed to the decrease in the
number of days during which pumping is possible when a pump with a higher capacity is employed. For
instance, if the reservoir is already filled after one day of pumping, there is no reason to continue
pumping while, if a pump with a lower capacity is utilize, then the reservoir will be filled on the ensuing
day provided that streamflow and the nitrate-N concentration are adequate. Having an increased
fraction of inflow from pumping and less from precipitation also slightly increases the nitrate-N
concentration in the reservoir and consequently raises release requirements during blending periods.
When its capacity is increased by a factor of seven (96.7 AF/d), the firm yield (3.53 mgd) approaches the
maximum production capacity of the system (3.57 mgd). Yet, when the pumping capacity is increased
by a factor of eight to 110.6 AF/d, the firm yield decreases to 0.82 mgd. This drastic decline results from
the fact that only 107.1 AF of water stored in the LHD impoundment are available for pumping. When
water is not flowing over the dam, this limited storage is not a binding constraint since operating rules
dictate that the daily demand must be supplied from the reservoir unless reservoir storage falls below
the BRR. However, when water is passing over the dam, the reservoir can be filled. Therefore,
pumping when there is between 107.1 AF and 110.6 AF of water available – storage plus inflow – a
decision to fill the OSBR could deplete storage in the impoundment below the intake level since
decisions are made at a daily time scale in this model. The operating rules for the reservoir are not set

111
up to supply the remainder of the daily on days during which these shortfalls take place because the
operating rules only call for reservoir releases when blending is necessary or the LHD impoundment is
not full at the beginning of a day. When the pumping capacity is increased by a factor of nine (123.8
AF/d), filling the reservoir depletes the impoundment to the extent that no water remains for supplying
the system. The sensitivity of the firm yield to the height of the dam is examined indirectly through the
analysis of its sensitivity to the LHD impoundment capacity, as Knapp (1988) notes that a one-inch
change in water level is approximately equivalent to change in storage capacity of 1 MG.
Blending Reserve Requirement
Under RivCR, the firm yield increases with the BRR when it is set to values ranging from approximately
40 and 90 percent of total storage, reaching 2.36 mgd when a BRR of 90 percent is in place (Figure 5.13).
On the other hand, the firm yield is insensitive to this parameter when it is set to between 20 and 40
percent of total storage, as the firm yield was 2.21 mgd for this entire range of values. In addition,
when BRR values of 95 and 100 percent of total storage were tested, the firm yield decreased slightly to
2.35 mgd and 2.34 mgd, respectively. When there is a BRR of 95 percent, there are more days during
which water can be pumped from the LHD impoundment to the WTP when water is not flowing over the
dam than when the BRR is equal to 90 percent. These additional withdrawals further reduce storage in
the impoundment. As a result, it takes longer for water to begin spilling again and, thus, there are
fewer days during which the reservoir can be filled. While this phenomenon is not restricted to BRR
values in exceedance of 90 percent, at lower BRR values, the benefits of pumping water directly from
the impoundment to the WTP outweigh the negative effects of this phenomenon on the firm yield.
Finally, it is also important to note that raising the BRR to 100 percent does not amount to raising
to 9 mg/L because the BRR comes into effect only when water is not passing over the LHD.
Therefore, it is expected that the firm yield attained when the BRR is equal to 100 percent (2.34 mgd) is
less than the yield attained when is set to 9 mg/L (2.58 mgd).
112
Streamflow
Table 5.3 summarizes the results of the five streamflow uncertainty scenarios described in Section 3.1
that were run for each of three water quality operating rules. Refer to Table 3.1 for a description of the
five Streamflow Uncertainty Scenarios tested. Most importantly, this analysis reveals that the firm yield
is not extremely sensitive to the estimate of inflow entering the impoundment during the 1988 drought.
The firm yields attained with Streamflow Uncertainty Scenario 3, which assumes that there was
absolutely no inflow into the LHD impoundment between July 26 and November 10, are only 16, 17 and
18 percent less than the estimates that do not take uncertainty into account. When the most realistic
Scenario 1 is used, these percentages diminish to just 8, 7 and 8, respectively. In Scenario 4, in which
the standard error of the ILSAM low flow estimate (67%) is applied to the inflow estimates for all days
during the twenty-year study period during which zero discharge estimates were made at the USGS
gauging station downstream of the dam, the firm yields under RivCR, ResCR and HybCR are 1.87 mgd,
1.95 mgd and 2.22 mgd, respectively. These yields are only 15, 16 and 17 percent less than the Base
Case Scenario estimates of the yield under each of these three rules. Most notably, the estimates for
Scenario 5, which does not account for any uncertainty in the estimate of non-zero discharges at the
gauging station, are practically identical to the ones obtained under Scenario 4. This lack of sensitivity
demonstrates that streamflow is generally not a binding constraint during periods in which it passes
over the dam, as the volume of streamflow that can be conveyed into the reservoir is limited by the
capacity of the pumping system and, in some instances, the availability of spare storage capacity in the
reservoir.
Net Lake Evaporation
The firm yield was very sensitive to the gross lake evaporation rate, which is applied to the OSBR as well
as the LHD when water is not flowing over the dam (Figure 5.14). First, when the precipitation was
increased by 10 percent to account for an under-catchment bias in precipitation measurements, the
113
firm yield attained under RivCR rise from 2.21 mgd to 2.37 mgd. Meanwhile, the firm yields under
ResCR and HybCR rise from 2.32 mgd and 2.67 mgd to 2.49 mgd and 2.85 mgd, respectively. This bias
correction factor is applied to all estimates of firm yield in this sensitivity analysis.
Under RivCR, the firm yield is only 1.56 mgd when the gross lake evaporation estimate was increased by
50 percent while it rises to 3.11 mgd when the estimate is reduced by 50 percent. When the same
scenario was run under ResCR, the firm yield is only 1.46 mgd when the evaporation was increased by
50 percent and increases from 2.32 mgd to 3.29 mgd when it is reduced by the same fraction. The
estimates obtained under the ResCR are higher than the ones obtained under the RivCR except for the
ones in which the lake evaporation increases by 40 and 50 percent (Figure 5.8). High evaporation rates
elevate the nitrate-N concentration in the reservoir at a faster rate. When the nitrate-N concentration
rises more quickly, there are fewer opportunities to fill the reservoir under ResCR. On the other hand,
the evaporation rate from the reservoir does not have any effect on the inflow into the reservoir under
the RivCR due to two assumptions: (i) evaporation from the LHD does not increase the concentration of
nitrate in water that may be pumped to the treatment plant under the circumstances that the reservoir
storage falls below the BRR and (ii) in-stream denitrification, which could be significant in the warm,
shallow pool of water that forms behind the LHD during droughts, is not considered.
Yet, while the number of reservoir filling opportunities is reduced under ResCR, the number of filling
opportunities is still greater than the number of opportunities under RivCR because when the reservoir
concentration exceeds under ResCR, the system reverts to the RivCR. Therefore, the lower
yields obtained under the ResCR when evaporation is increased 40 and 50 percent can also be attributed
to the greater blending demand that occurs when the ResCR is in place. Finally, the sensitivity of the
firm yield to the same range of gross lake evaporation rates was also examined under the HybCR, whose
firm yield was consistently higher than the yields obtained under the other two rules.

114
River Nitrate-N Concentration
The firm yield exhibits a high degree of sensitivity to the river nitrate-N concentration under all three
operating rules (Figure 5.15). Most notably, there is a sharp, disproportionate increase in firm yield
when the nitrate-N concentration in the Vermilion River is uniformly reduced. When the daily nitrate-
N concentrations are reduced by exactly 10 percent, the firm yields increase by 19, 17 and 14 percent
under the RivCR, ResCR and HybCR, respectively. Meanwhile, when the concentrations are reduced by
20 percent, the yields increase by 43, 40 and 34 percent, respectively. In fact, the yield obtained under
HybCR reaches the maximum yield of 3.57 mgd when the daily nitrate concentrations are reduced by
this fraction. When a 30-percent reduction in nitrate-N concentrations is tested under the other two
operating rules, the maximum yield is also attained.
Atmospheric Deposition
The sensitivity of the firm yield to the inclusion of atmospheric deposition data was also examined.
Although atmospheric deposition comprised 10.2 percent of the total nitrate load when the Base Case
Scenario was run using the RivCR, the firm yield only increased from 2.21 to 2.29 mgd (4 percent) when
atmospheric deposition was excluded from the model. Similarly, the firm yield also registered a small
increase when the other two operating rules were run with the Base Case Scenario, as the firm yield
rose from 2.32 mgd to 2.40 mgd (3 percent) under ResCR and from 2.67 mgd to 2.79 mgd (4 percent)
under the HybCR. The atmospheric deposition of nitrate, 74 percent of which enters the reservoir
through precipitation, during periods in which the river and reservoir concentrations are already above
permitted thresholds may explain this mild increase.
Nitrate-N Loss Rates
The firm yield increases when nitrate losses in the reservoir are considered under all three types of
operating rules (Figure 5.16). Yet, the manner in which the firm yield increases under each of these
rules is distinct. Under RivCR, the firm yield registers the lowest rate of increase and reaches an

115
asymptote at 2.42 mgd when K = 0.05 ft/d, indicating that the yield cannot increase anymore without a
change in pumping rules. The gradual decrease in the rate at which the firm yield increases with the
nitrate loss rate is an artifact of the first-order kinetics assumed for nitrate losses in this model. The
firm yield is much more sensitive to the rate of increase when ResCR and HybCR are utilized. Under
ResCR, the firm yield rises from 2.32 mgd when K = 0.00 ft/d to 3.56 mgd when K = 0.02 ft/d, which is
just below the system’s maximum capacity of 3.57 mgd. Also, in spite of the first-order nitrate kinetics,
the rate at which the firm yield increases with the nitrate loss rate under ResCR is greater between K =
0.01 ft/d and K = 0.02 ft/d (0.67 mgd) than it is when the nitrate loss rate rises from K= 0.00 ft/d to K =
0.01 ft/d (0.56 mgd). Next, under HybCR, the firm yield increases from 2.67 mgd when k = 0.00 ft/d to
3.42 mgd when K = 0.05 ft/d. The rate at which the yield increases diminishes as the nitrate loss rate
rises, as the yield only rises to 3.54 mgd when K = 0.20 ft/d. , which, as in the case of RivCR, also reflects
the first-order kinetics of the nitrate loss rate.
The firm yield increases under all three rules because the decrease in the nitrate-N concentration in the
reservoir require less water to be released for blending. However, under the two rules that employ a
reservoir-based water quality constraint, the reduction of the nitrate-N concentration in the reservoir
also enables the reservoir to be filled more frequently because the nitrate-N concentration lies below
the reservoir water quality threshold, , more frequently. When the reservoir nitrate-N
concentration lies below this concentration, water with any nitrate-N concentration can be pumped into
the reservoir under ResCR while water with a nitrate-N concentration up to 8 mg/L can enter the
reservoir under HybCR as opposed to the maximum inflow concentration of just 4 mg/L that is
permitted when the reservoir concentration exceeds . Since there are no additional
constraints on inflow besides under ResCR, the firm yield rises more rapidly under this rule
than it does under HybCR. Also, at lower nitrate loss rates, permitting with very high nitrate-N
concentrations to enter the reservoir may increase the rate at which storage must be released during

116
blending periods to the extent that the increased releases completely offset the gains in storage.
However, the extent of these effects on the firm yield will be lower since the nitrate-N concentration in
the reservoir diminishes more rapidly. Finally, the increase in the rate at which yield increases with the
nitrate loss rate between K = 0.00 ft/d and K= 0.02 ft/d under ResCR can be attributed to the extent to
which pumping opportunities increase under this rule.
Storage-Yield-Nitrate Loss Rate Curves
The storage capacity required to attain a given yield is computed for nitrate loss rates ranging from K =
0.00 ft/d to K = 0.20 ft/d at intervals of K = 0.01 ft/d up to K= 0.05 ft/d and then at intervals of 0.05 ft/d
up to 0.20 ft/d (Figure 5.17). This relationship is only examined under ResCR because it exhibits the
greatest sensitivity to the nitrate loss rate, as shown in Figure 5.16. Under all values of K, the marginal
benefits of reservoir storage are reduced as the reservoir storage is increased at 500-AF increments. The
storage capacity required to attain a given yield is very sensitive to nitrate loss rates, especially for high
yields and low loss rates. For instance, when there are no nitrate losses, the yield with a reservoir
capacity of 2,026 AF is 2.32 mgd while the yield with K = 0.01 ft/d and just a 1,500-AF reservoir is 2.49
mgd. At a rate of just K= 0.02 ft/d, a 1,500-AF reservoir yields 2.91 mgd, which is nearly the yield of
3.02 mgd that a 4,000-AF produces when there are no nitrate losses. The pronounced sensitivity of the
yield to low nitrate loss rates demonstrates the importance of nutrient dynamics on the firm yield of
OSBR with relatively few nitrate sinks. Finally, Figure 5.17 also shows that there are diminishing
increases in yield after each 0.01 ft/d increase of K, which reflects the first-order decay rate as well as
other constraints to the firm yield.
Water Temperature
A sensitivity analysis of the firm yield to the temperature-dependent nitrate loss rate used in this study
demonstrates that the water temperature estimate uncertainty only exerts a minor effect on the firm

117
yield of the system when ResCR is employed. Figure 5.18 illustrates the sensitivity of the firm yield to
water temperature at different nitrate loss rates under ResCR.
Pessimistic Hydrologic Scenario
The pessimistic hydrologic scenario described in Section 3.1.2 generates firm yields of 1.80, 1.85 and
2.13 mgd under RivCR, ResCR and HybCR, respectively. For RivCR and ResCR, the critical duration of the
water shortage event is the same 32-month period as the Base Case Scenario. Likewise, for HybCR, the
critical duration of the water shortage event is the same 42-month period as the Base Case Scenario.
Pessimistic Hydrologic and Land Management Scenario
When a uniform 25 percent increase in nitrate-N concentrations in the Vermilion River is added to the
Pessimistic Hydrologic Scenario, the firm yields decline to 1.40, 1.34, and 1.59 mgd, respectively (Table
5.4). The firm yield obtained with ResCR is lower than the one obtained with RivCR because the
increase in nitrate-N concentration requires more reservoir storage to be released for blending,
particularly during the three years of high nitrate-N concentrations that followed the 1988 drought.
Under RivCR, there are shortages on both August 28, 1990 and June 30, 1991 when the average daily
demand is raised infinitesimally above the firm yield. Meanwhile, for HybCR, the water shortage event
has the same 42-month critical duration as in the Base Case Scenario. However, the critical duration for
ResCR is also 42 months. The critical duration under this pessimistic scenario is longer, in part, because
the firm yield is lower and, thus, the reservoir does not become depleted as rapidly. This finding further
demonstrates that the relationship between the firm yield obtained under RivCR and ResCR is sensitive
to water quality conditions in the Vermilion River.
Pessimistic Hydrologic Scenario Considering Realistic Blending Operations
In Chapter 3, the relevance of the results of the simulations with values set to 6 mg/L and 7
mg/L with respect to blending operations of the system is introduced. When is set to 7 mg/L,

118
the firm yields for RivCR, ResCR and HybCR are 1.57, 1.53 and 1.82 mgd, respectively. When
is set to 6 mg/L, these yields dwindle to just 1.39, 1.31 and 1.60 mgd. All of these values are lower than
the 2005-2009 average daily demand (HybCR when is set to 7 mg/L). Figure 5.19 compares
these six values to the ones obtained when is set to 8 mg/L and the 2005-2009 average daily
demand. In addition, the ResCR yield becomes lower than the RivCR yield when is reduced to
6 and 7 mg/L.
5.2.4 Summary of Limitations to Firm Yield
Section 5.2 explores the limitations to the firm yield. While the 1988 drought has a notable impact on
the firm yield, high nitrate-N concentrations in the Vermilion River along with the relatively small
storage capacity of the reservoir both exert relatively stronger limitations on the firm yield of the
system, as evidenced by the fact that only 10 percent of all limitations to filling the reservoir are due to
streamflow deficits. In Chapter 3, it is hypothesized that the sequence of a streamflow deficit followed
by a period of high nitrate concentrations that results from the accumulation of nitrate during the
drought leads to the worst water shortage in Pontiac. The critical period for water shortage events
generally begins in December 1987 and ends in either August 1990 or late June or July 1991. In fact, the
longest period during which the Vermilion River ceases from passing over the dam during the study
period is in 1988 while the years with the two highest average nitrate-N concentrations are 1989 and
1990.
The sensitivity of the firm yield to many variables and parameters is also tested. Most notably, when
the uncertainty of low flows, net evaporation and blending operations is taken into consideration, the
firm yield often drops below the 2005-2009 average daily demand. A worst case scenario in which
nitrate loads to the Vermilion River increase in the future could further increase the risk of a shortage.

119
Figures and Tables
Figure 5.1: Base case scenario reservoir storage time series under RivCR, ResCR and HybCR.
Figure 5.2: Nitrate-N concentration in OSBR under RivCR, ResCR and HybCR.
0
500
1000
1500
2000
2500
1979 1984 1989 1994 1999
Sto
rage
(AF)
Year
BC_RivCR
BC_ResCR
BC_HybCR
MinStorage
0.0
1.0
2.0
3.0
4.0
5.0
6.0
1979 1984 1989 1994 1999
OSB
R N
itra
e-N
Co
nc.
(mg/
L)
Year
RivCR
ResCR
HybCR

120
Figure 5.3: Firm yield under different values of CLHD,Max under HybCR.
Figure 5.4: Firm yield sensitivity to maximum reservoir inflow concentration, , under values ranging from 5 mg/L to 9 mg/L.
2.00
2.10
2.20
2.30
2.40
2.50
2.60
2.70
2.80
0 5 10 15 20 25 30
Firm
Yie
ld (
mgd
)
C(LHD,Max) under HybCR
0.00
0.50
1.00
1.50
2.00
2.50
3.00
3.50
4.00
3 4 5 6 7 8 9 10
Firm
Yie
ld (
mgd
)
C(LHD, Max)
5 mg/L
6 mg/L
7 mg/L
8 mg/L
9 mg/L

121
Figure 5.5: Firm yield sensitivity to maximum reservoir concentration, , under values ranging from 5 mg/L to 9 mg/L.
Figure 5.6: Firm yield sensitivity to maximum reservoir inflow concentration, , under values ranging from 5 mg/L to 9 mg/L. is set to 8 mg/L in all simulations.
0.00
0.50
1.00
1.50
2.00
2.50
3.00
3.50
4.00
3 4 5 6 7 8 9 10
Firm
Yie
ld (
mgd
)
C(OSBR, Max)
5 mg/L
6 mg/L
7 mg/L
8 mg/L
9 mg/L
0.00
0.50
1.00
1.50
2.00
2.50
3.00
3.50
4.00
3 4 5 6 7 8 9 10
Firm
Yie
ld (
mgd
)
C(OSBR, Max)
5 mg/L
6 mg/L
7 mg/L
8 mg/L
9 mg/L

122
Figure 5.7: Change in storage in reservoir under Base Case Scenario and RivCR.
Figure 5.8: Average annual nitrate-N concentration
0.0
2.0
4.0
6.0
8.0
10.0
12.0
14.0
1979 1981 1983 1985 1987 1989 1991 1993 1995 1997 1999
Avg
. Nit
rate
-N C
on
c. (
mg/
L)
Year

123
Figure 5.9: Sensitivity to firm yield to storage capacity under different WQOR
Figure 5.10: Sensitivity of firm yield to low-head dam impoundment storage capacity.
0.00
0.50
1.00
1.50
2.00
2.50
3.00
3.50
4.00
0 1000 2000 3000 4000 5000
Firm
Yie
ld (
mgd
)
OSBR Capacity (AF)
No WQ Rules
RivCR
ResCR
HybCR
WTP Cap
0.00
0.50
1.00
1.50
2.00
2.50
0 1 2 3 4 5 6 7 8 9 10
Firm
Yie
ld (
mgd
)
Low-Head Dam Storage Adjustment Factor, 1 = Current Capacity

124
Figure 5.11: Sensitivity of firm yield to OSBR surface area
Figure 5.12: Sensitivity of firm yield to capacity of pump that fills OSBR
2.08
2.10
2.12
2.14
2.16
2.18
2.20
2.22
2.24
0.00 0.20 0.40 0.60 0.80 1.00 1.20 1.40 1.60 1.80 2.00
Firm
Yie
ld (
mgd
)
OSBR Surface Area Adjustment Factor, 1 = Actual Surface Area (250 ac)
0.00
0.50
1.00
1.50
2.00
2.50
3.00
3.50
4.00
0 1 2 3 4 5 6 7 8 9 10
Firm
Yie
ld (
mgd
)
Pump Capacity Adjustment Factor, 1= Current Capacity (13.82 AF/d)

125
Figure 5.13: Sensitivity of firm yield to blending reserve requirement (BRR)
Figure 5.14: Sensitivity of firm yield to gross lake evaporation rate and 10 percent increase in precipitation directly onto the lake surface to correct bias in precipitation measurements as reported in Groisman and Legates (1994).
2.20
2.24
2.28
2.32
2.36
2.40
0 0.1 0.2 0.3 0.4 0.5 0.6 0.7 0.8 0.9 1
Firm
Yie
ld (
mgd
)
Blending Reserve Requirement (fraction)
0.00
0.50
1.00
1.50
2.00
2.50
3.00
3.50
4.00
-0.5 -0.3 -0.1 0.1 0.3 0.5
Firm
Yie
ld (
mgd
)
Adjustment Factor, 0 = Estimated Gross Lake Evaporation
RivCR
ResCR
HybCR

126
Figure 5.15: Sensitivity of firm yield to nitrate-N concentration in Vermilion River
Figure 5.16: Firm yields under different nitrate-N loss rates and water quality operating rules.
0.00
0.50
1.00
1.50
2.00
2.50
3.00
3.50
4.00
-50% 0% 50%
Firm
Yie
ld (
mgd
)
Change in River Nitrate-N Concentration
RivCR
ResCR
HybCR
Capacity
2.00
2.20
2.40
2.60
2.80
3.00
3.20
3.40
3.60
3.80
0 0.05 0.1 0.15 0.2
Firm
Yie
ld (
mgd
)
Nitrate-N Loss Rate (ft/d)
RivCR
ResCR
HybCR
WTP Cap.

127
Figure 5.17 Storage-yield-nitrate loss rate curves
Figure 5.18: Sensitivity of firm yield to water temperature at different nitrate loss rates.
0.00
0.50
1.00
1.50
2.00
2.50
3.00
3.50
4.00
0 1000 2000 3000 4000 5000
Firm
Yie
ld (
mgd
)
Storage Capacity (AF)
0.00
0.01
0.02
0.03
0.04
0.05
0.10
0.20
WTP Cap.
2.00
2.20
2.40
2.60
2.80
3.00
3.20
3.40
3.60
3.80
0 0.01 0.02 0.03 0.04 0.05 0.06
Firm
Yie
ld (
mgd
)
Nitrate Loss Rate (d-1) at 20° C
Low Estimate
Estimated Yield
High Estimate
WTPCap

128
Figure 5.19: Pessimistic Hydrologic Scenario considering realistic blending opportunities
Limiting Factor (%) RivCR ResCR HybCR
Drought 10 8 9
Capacity 49 61 57
Water Quality 41 31 34 Table 5.1: Factors limiting pumping to OSBR (percentage of total possible pumpage)
OSBR Releases (%) RivCR ResCR HybCR
Drought 12 11 11
Water Quality 88 89 89 Table 5.2: Causes of releases from OSBR to WTP (percentage of total releases)
Firm Yield (mgd)
Scenario RivCR ResCR HybCR
Base Case Estimate 2.21 2.32 2.67
Uncertainty Scenario 1 2.04 2.16 2.45
Uncertainty Scenario 2 1.92 2.01 2.29
Uncertainty Scenario 3 1.85 1.93 2.19
Uncertainty Scenario 4 1.87 1.96 2.22
Uncertainty Scenario 5 1.87 1.95 2.22
Table 5.3: Firm yield under different streamflow uncertainty scenarios
1.00
1.20
1.40
1.60
1.80
2.00
2.20
6 7 8
Frim
Yie
ld (
mgd
)
C(WTP,Max)
RivCR
ResCR
HybCR
Demand

129
Firm Yield (mgd)
Scenario RivCR ResCR HybCR
Pessimistic Hydrologic
Scenario
1.80 1.85 2.13
Pessimistic Hydrologic
and Land Management
Scenario
1.40 1.34 1.59
Table 5.4: Results of two pessimistic scenarios
130
6. Discussion
This section discusses limitations of assumptions implicit in the simulation model and their implications
to the estimates of the firm yield generated with the simulation model. These assumptions can be
grouped into the following three categories: (i) Decision-Making Perspectives, (ii) Blending Operations
(iii) Reservoir Water Balance, (iv) Reservoir Mixing, and (v) Nitrogen Cycle and Algae in the Reservoir.
6.1. Decision-Making Perspectives
Numerous decision rules in the simulation model do not incorporate the perspectives of typical water
system operators. Most notably, the WQORs are based on a priori knowledge and are predetermined
before the outset of simulations. While some knowledge of the operation of the system was used to
incorporate adaptive behavior into these rules, such as the blending reserve requirement (BRR), these
fixed rules do not allow for operators to take future streamflow and water quality conditions into
account or make real-time adjustments based on present conditions. For instance, when reservoir
storage becomes seriously depleted, it is pragmatic for an operator to relax water quality rules that
dictate when the reservoir can be filled, especially if there is not any rain in a weekly weather forecast.
The simulations tested in this study do not acknowledge this pragmatism.
OSBR operators also must determine the water quality constraints to manage the nitrate-N
concentration in their reservoir. This decision can be broken down into two components: (i)
determining the value of a water quality constraint for a particular WQOR and (ii) determining which
WQOR to use. The effects that these constraint values have on the firm yield are explored through a
sensitivity analysis of the yield to different values of these constraints, i.e., and
under each of the three WQOR. Of particular interest is the question regarding the monotonicity of the
relationship between the value of a constraint and the firm yield. The results from Section 5.1.2 also
suggest that there is a monotonically increasing relationship between reservoir inflow constraints and

131
the firm yield between a constraint value of 3 mg/L and unless (i) approaches
and evaporation and atmospheric deposition combine to elevate the nitrate-N concentration
in the reservoir above and prevent the reservoir from fulfilling its blending purpose or (ii)
there is another binding constraint that further limits the increase of the yield.
Meanwhile, the relationship between and the firm yield under RivCR with values of
between 3 mg/L and 9 mg/L is completely monotonic when it is examined for values between
5 mg/L and 9 mg/L. However, this relationship does not examine the response of the system to values
of greater than 9 mg/L. Since inflow into the OSBR under RivCR is strictly governed by the
LHD nitrate-N concentration, it follows that the average inflow into the reservoir would be 4.5 mg/L if
= 9 mg/L and the nitrate-N concentration of water during all days when is less than 9
mg/L were uniformly distributed. This indicates that the firm yield could potentially continue to
increase if is raised above 9 mg/L even though values in excess of 9 mg/L are not tested in this
thesis given the unlikelihood of their real-world implementation. Yet, when the constraint
for HybCR is determined, the value of is permitted to rise above 9 mg/L because there is also a
constraint the aims to keep the nitrate-N concentration in the reservoir from rising above 4
mg/L. Since HybCR also has a constraint, one cannot make any judgments about the optimal
value of for RivCR. Nonetheless, Figure 5.3 demonstrates that pumping an excessive amount
of high-nitrate water into the reservoir can have a negative effect on the firm yield, as the maximum
yield for = 4 mg/L is obtained when is set to 8 mg/L.
However, a comparison of the results between different rules offers additional evidence of a tradeoff
between increased pumping opportunities and increased blending demand as water quality inflow
regulations are relaxed. First, the firm yield under HybCR is consistently higher than that of ResCR
under all comparisons made that do not incorporate a nitrate loss rate. By definition, HybCR is a more
132
conservative water quality regulation than ResCR, as it is designed to limit the inflow of high-nitrate
water into the reservoir. Therefore, if the firm yield is higher under HybCR than ResCR, the savings in
blending demand achieved under HybCR must offset the benefits of additional reservoir inflow that
ResCR offers. Similarly, ResCR is also, by definition, a less restrictive constraint than RivCR. Yet, there
are many analyses conducted in this thesis in which the yield obtained with ResCR is inferior to the yield
obtained with RivCR. Again, the additional blending demand that the use of ResCR incurs offsets the
benefits that its relaxed constraints have on reservoir filling.
The synthesis of these results corroborates the existence of a tradeoff between relaxing water quality
constraints to increase reservoir inflow and strengthening them to prevent releases for blending. While
the findings do suggest that low constraint values, such as the of 4 mg/L that Pontiac currently
uses, may unnecessarily limit the firm yield of the system, they also show that unchecked increases of
water quality standards may result in dire consequences, namely the occurrence of nitrate-N
concentrations in the OSBR that exceed . This risk is important to recognize, as operators have
little knowledge of future nitrate-N concentrations in the Vermilion River and may not want to risk
having their reservoir nitrate-N concentration rise above . The model used in this thesis solves
for the firm yield based on perfect knowledge of future water quality conditions and does not account
for risk averse behavior to uncertain future water quality conditions.
The nitrate loss rate also influences decisions regarding the type of WQOR to apply. In Section 5.2, it is
shown that ResCR is superior to HybCR when there is a high first-order nitrate loss rate because the
consequences of filling a reservoir with high-nitrate water become less severe when the influent nitrate
decays at a faster rate. Thus, knowledge of the rate at which nitrate decays in a reservoir is critical for
prescribing an appropriate WQOR. Issues regarding the modeling of nitrate loss rates are discussed in
Section 6.5.
133
Another factor that is completely neglected in the characterization of this decision in the model is the
potential impact that relaxing the inflow concentration standards may have on the concentration of
algae in the reservoir. During an informal conversation with the author, Tuley (2011a) expressed
hesitance to the idea of raising above 4 mg/L due to concerns about having to increase the
frequency with which the system applies algaecides to avoid taste and odor problems in their drinking
water. During a typical year, the system must allocate approximately five man-hours of labor to the
application of these chemicals in the reservoir about 4-5 times during the growing season. According to
Tuley (2011a), the nuisance and labor cost of administering these chemicals is more of a motive to
restrict the import of nitrogen into the reservoir through pumping than the cost of the algaecides is.
The impact of the application of algaecides on the nitrate concentration in the reservoir is discussed in
Section 6.5.
6.2 Blending Operations
The Base Case Scenario simulated in this thesis assumes that the blending target of 8 mg/L is perfectly
during each day on which the system blends. In Section 2.2.6, some reasons for which the actual
nitrate-N concentration in blended water varies are presented. Of particular concern is that the
average nitrate-N concentration in blended water during a period of nearly seven years (December 1991
– August 1998) is just 6.74 mg/L, especially since the firm yield under RivCR, the current WQOR, is less
than the 2005-2009 average daily demand when is set to 6 mg/L and 7 mg/L.
While these simulations under lower values offer a glimpse at the potential overestimation of
firm yield due to the assumption of perfect blending operations, there are some limitations to the use of
these results to characterize the impact of this assumption on the firm yield estimates. Figure 2.9
demonstrates that there is a wide range of nitrate-N concentrations in blended water. Assuming an
average value does not mimic real-time blending decisions that may be made. For instance, if storage in
134
the reservoir is low, the system may tend to underestimate the volume of water that needs to be
pumped to the WTP where they may be willing to use more water for blending when the water level in
the reservoir is near normal pool elevation. Also, setting to 7 mg/L is not equivalent to an
average concentration of 7 mg/L when blending is performed with set to 8 mg/L. For
instance, if the Vermilion River concentration is 7.5 mg/L, blending is not necessary unless there is
another contaminant of concern.
In Section 2.2.6, it is shown that the water at the WTP had a nitrate-N concentration below 5 mg/L on 15
percent of the days on which blending likely occurred. This activity corroborates the use of blending to
improve drinking water quality for reasons other than regulating the nitrate-N concentration. In some
cases, poor water quality in the river prompts the system to exclusively use reservoir water during
periods typically lasting up to several days. First, the Pontiac water system also uses its off-stream
reservoir as a settling basin to reduce turbidity in drinking water. In addition, following storms, Pontiac
often does not fill its reservoir to ensure that the turbidity of the water in it remains low, although it is
likely that the nitrate-N concentration is also too high for the reservoir to be filled under the current
WQOR. Although there is no specific threshold value for turbidity as there is for nitrate-N
concentration, Tuley (2010) reports that the system refrains from pumping water into the reservoir due
to turbidity about six times per year. Ammonia, in particular occasional releases from hog farms
upstream, occasionally impedes pumping activities and the system currently monitors the ammonia
concentration in the river three times per day (Tuley, 2010). Algal growth in the river also may inhibit
pumping during the summer.

135
6.3 Reservoir Water Balance
In Section 2.2.5, reservoir inflows and outflows that are not included in the model are described,
including (i) groundwater-surface water interactions, (ii) situations when storage exceeds the capacity at
normal pool elevation after storms, (iii) the recycling of WTP effluent through the reservoir and (iv)
exchanges of water between the reservoir’s sub-impoundments. Since the water table typically lies
above the bottom of the quarry, groundwater maintains a minimum water level in the reservoir under
normal weather conditions. Of greater concern is the decline in groundwater levels during drought
events. The droughts that limit pumping into the reservoir, such as the 1988 drought are very severe.
During a mild drought, the streamflow in the Vermilion River is not a binding constraint on the inflow
into the reservoir as water would likely continue flow over the LHD during such an event, or would cease
from flowing over it for just a few days. Furthermore, the nitrate-N concentrations in the Vermilion
River are quite low during extended dry periods, especially in the summer. These low concentrations
combined with low but adequate streamflow enable the reservoir to be filled rapidly. The head
differential that could result between the relatively high reservoir level and the low adjacent aquifer
could generate significant seepage losses from the reservoir, especially given the limestone geology and
the presence of fracture flow in the limestone barriers that separate the northwest sub-impoundment
from the five small sub-impoundments in the northeastern portion of the reservoir. However, Tuley
(2011a) did not express concern about seepage losses from the quarry. No prior field reconnaissance of
the surface water-groundwater interactions around the quarry could be acquired.
Second, while the reservoir has had a listed capacity of 2,026 AF (660 MG) based on its normal pool
elevation, water does not spill from the reservoir when rainfall raises the water above normal elevation.
An aerial photograph (Figure 2.2) and a field visit to the reservoir (Figure 2.7) indicate that there are
roads that there is excess storage capacity in the reservoir. As a result, the firm yield may be slightly
underestimated since it cannot account for this extra storage as well as the additional dilution that
136
excess rainwater provides. However, given the frequency with which the reservoir is used for blending,
the maintenance of the water level above the normal pool elevation is likely temporary. Furthermore,
Tuley (2011a) reports that the system had to pump excess rainwater from the reservoir in 2010 since it
was flooding access roads on the ridges of the divides between the sub-impoundments.
Third, the neglect of recycled water that enters the reservoir after passing through the sludge lagoon
limits an estimated average daily discharge of 0.18 mgd from being incorporated into the reservoir
water balance. An unknown fraction of this discharge is likely to evaporate during its detention in the
waste lagoon or infiltrate into the sludge. Also, the extent of nitrate losses in the lagoon prior to the
discharge of the supernatant water in the reservoir is unknown.
Fourth, the internal cycling of water among the sub-impoundments does not appear to have a major
effect on the yield because operators tend to react to any imbalanced distribution of water among the
sub-impoundments and there is excess storage capacity above normal pool elevation that can prevent
spills. The challenge of pumping water from the northern basin to the southern basin during the
winter, when ice forms, has never actually caused a shortage in the southern basin.
Fifth, since the reservoir is assumed to have vertical walls, differences in evaporation rates due to the
distribution of water among the sub-impoundments are likely to be minimal. However, this assumption
likely results in a small overestimation of evaporative losses, although it is not as a critical as it would be
for an on-stream reservoir. The impacts of reservoir drawdown on water temperature and nitrate loss
rates also merits further consideration, but the firm yield does not exhibit a large amount of sensitivity
to the temperature under ResCR, the WQOR under which it was most sensitive.

137
6.4 Reservoir Mixing
Another major assumption made in this model is that the reservoir is perfectly mixed. Since the
residence time of water varies substantially between basins, the nitrate-N concentration is likely quite
variable. In particular, water from the northern basin has a much longer residence time and therefore
can be expected to have a lower nitrate-N concentration assuming that the nitrate loss rates are equal
in each basin. The system currently does not pump water from the northern basin back into the
southern basin merely for blending. Conversely, water near the inlet, which is located relatively close
to the intake (Figure 2.2), often has a higher nitrate-N concentration except during days in the late-
summer filling period during which the nitrate-N concentration in the Vermilion River can be less than
1.0 mg/L.
Currently, ResCR cannot be feasibly implemented due to the poor circulation in the reservoir. The
Illinois-American Water Company is evaluating means of improving circulation of water through the
reservoir to remedy other problems associated with the stagnation of water, e.g., algae (Wegman et al.,
2010). Improving the circulation of water would boost the average residence time of water at the
intake, which they are considering moving to the northwestern sub-impoundment. While the multi-
basin nature of the reservoir invalidates the assumption of perfect mixing, the improved firm yields
attained under ResCR still demonstrate the value of improving circulation for the water shortage
vulnerability of the system. An alternative operating rule in which the concentration of the southern
basin or that of the water in the immediately vicinity of the intake is used in lieu of the average
concentration of the entire reservoir may be more feasible, especially if the intake remains in its current
location next to the sub-impoundment in which the inlet is located.

138
6.5 Nitrogen Cycle and Algae
The import of nitrogen into the reservoir fosters the growth of algae assuming a sufficient concurrent
supply of phosphorus. The first-order rates used to characterize the nitrate loss rate are inspired by
documented denitrification processes in reservoirs (e.g., Whitehead and Toms, 1993). This kinetic
formulation does not incorporate the biological assimilation of nitrate. Tuley (2011b) anecdotally notes
that nitrate-N is often barely detectable in the reservoir during the summer, which suggests that
biological assimilation is inadequately represented in the model. Information on the concentration of
phosphorus in the reservoir, which can also limit algal growth, could not be obtained.
While biological assimilation does not reduce the mass of nitrogenous compounds in the reservoir, the
uptake of nitrate does indeed reduce the concentration of nitrate. Moreover, this uptake starts to take
place during the growing season prior to the beginning of the late-summer filling period when storage in
the reservoir is often lowest. Also, neglecting to include this assimilation causes the releases required
for blending during the high nitrate-N concentrations frequently experienced during the spring and early
summer to be overestimated. The impacts of algae on reservoir operation decisions are discussed in
Section 6.1
139
7. Conclusions
This chapter first summarizes the key findings that are relevant for general OSBR operations research in
Section 7.1 and then discusses the implications of the results for the vulnerability of the Pontiac system
to water shortages in Section 7.2. It concludes with some future directions for research on both the
general operation of OSBR systems and the vulnerability of the Pontiac OSBR to water shortages in
Section 7.3.
7.1 General Results on OSBR Operation
Many communities have recently developed OSBR systems as an alternative to investing in expensive
technology to remove nitrate and other contaminants (e.g., Campbell et al, 2002). To understand the
extent to which these reservoirs can benefit community water supply systems, generalizable research
on the operation of OSBR systems is needed. This thesis attempts to use a case study on the OSBR
system serving Pontiac, Illinois to extract general knowledge about OSBRs through simulations of its
operation under different WQOR and examine the sensitivity of these systems to key parameters and
variables. This work also highlights limitations in the modeling of OSBRs and identifies directions for
future research on general dynamics of off-stream reservoir operation. This particular section
summarizes the research conducted in this thesis in light of the main research objectives introduced in
Section 1.3.
First, this study aims to compare the firm yield under three different types of WQOR. Many
generalizable characteristics of these types of WQOR are uncovered through an analysis of the
sensitivity of the firm yield to water quality inflow constraints required under each of these rules.
When the sensitivity of the firm yield to water quality constraints is tested with integer constraint
values, i.e., and , ranging from 3 mg/L to 9 mg/L and constraints ranging
from 5 mg/L to 9 mg/L, the firm yield increases with the water quality constraint unless (i) there is
140
another binding constraint that impedes a further increase or (ii) in the case of an constraint,
the reservoir concentration rises above during a period when blending is necessary. Yet,
these results are obtained with a limited range of constraint values for a particular WQOR and with data
specific to a particular system.
However, the consequences of excessively relaxing water quality constraints become evident when the
firm yields obtained with a given value of under ResCr and HybCR are compared. Under
ResCR, there are no restrictions on the concentration of water pumped into the reservoir as long as the
reservoir concentration does not exceed . On the other hand, HybCR restricts the inflow to
concentrations of 8 mg/L or less at all times. A higher firm yield is attained under HybCR (2.67 mgd)
than ResCR (2.32 mgd) because the lack of an inflow constraint permits water with a concentration as
high as 19 mg/L to enter the reservoir.15 The import of this high-nitrate water, 18 percent of which is
greater than 10 mg/L, increases the blending demand to the point that it reduces the firm yield of the
system. Thus, operators should be aware of the consequences of excessively relaxing water quality
constraints.
While this synthesis of results among the three WQOR corroborates the potential existence of a non-
monotonic relationship between water quality constraints and the firm yield, it does not consider the
real-time decisions that operators make with limited knowledge about future water quality conditions.
Operators may not wish to take the risk of having a situation in which evaporation and dry atmospheric
deposition elevate the nitrate-N concentration in the OSBR above . In addition, the impact of
a constraint decision on other water quality management issues, namely algae, must be considered.
15
Note that the daily nitrate-N concentration in the study period is 26.0 mg/L. However, this concentration occurred when the reservoir concentration had already exceeded its maximum concentration of 4 mg/L under ResCR.

141
Another aspect of water quality decision-making that is not properly captured in the model is blending,
as it is assumed that a concentration of exactly 8 mg/L is attained during each day when blending takes
place. A crude estimate of the average nitrate-N concentration in finished water during blending days
(6.74 mg/L) is made from historic water quality from December 1991 – August 1998. The eight-hour
sampling frequency of river nitrate-N concentrations, fixed-speed operational limitations of pumps that
convey water from the OSBR to WTP, imperfect decisions about the amount of water needed for
blending given uncertain knowledge of water quality in the river and the need for blending releases for
other water quality problems contribute to this discrepancy, which has major implications in evaluating
the vulnerability of an OSBR system as discussed further in Section 7.2.
This study also strives to characterize the causes of water shortages in OSBR systems, particularly ones
used to regulate the concentration of nitrate-N in drinking water in watersheds where intensive
agriculture is prevalent. In these regions, a reservoir can become depleted through a two-stage process
in which an extreme low-flow period first reduces storage and then a post-drought period featuring
higher than normal nitrate concentrations further draws a reservoir down, as hypothesized in Chapter 3.
In addition, precipitation directly onto the surface of the reservoir plays a vital role in offsetting releases
for blending during wet periods featuring high nitrate concentrations and diluting the concentration of
nitrate in a reservoir. Simulations also show that, in most years, there is a period lasting from the
middle of summer to the post-harvest application of fertilizer in which nitrate concentrations in the
Vermilion River are well below the 4 mg/L threshold above which pumping into the OSBR is prohibited
under the current operating policy. Large storms during this period, most notably the extreme rainfall
during the summer of 1993, can mobilize nitrate that previous storms during the growing season have
not mobilized and consequently reduce pumping opportunities. However, the flushing effect of these
extreme events reduces the terrestrial storage of nitrate and reduces the load of nitrate into streams

142
during subsequent precipitation events. The influence of these inter-annual carryover effects on the
Pontiac OSBR system motivates the development of long-lead time nitrate-N forecasting models.
While limited reservoir filling opportunities were much more frequently attributed to water quality and
reservoir capacity than streamflow under the three WQOR run with Base Case Scenario of the Pontiac
system, the extent to which streamflow and water quality each constrain the firm yield of an OSBR
system is system-specific and is a function of the climate and land management practices in a given
watershed. Yet, the sensitivity of the firm yield to surface area demonstrates the general importance of
characterizing the extent to which streamflow and water quality limit the firm yield. When high
nitrate concentrations in an agricultural watershed are the principal limiting factor, a reservoir with a
relatively large surface area is preferable because it (i) increases the amount of precipitation that can
offset the losses from blending releases and (ii) dilutes the concentration of nitrate-N in the reservoir,
which, in turn, reduces the blending demand. In contrast, when streamflow is the principal limiting
factor, a smaller surface area is preferable for reducing evaporative losses, which are often highest
during the droughts that produce extreme low flow conditions.
Another novel aspect of this research is the examination of the extent to which a contaminant decay
rate can boost the firm yield of an OSBR system. The firm yield for each of the three water quality
operating rules is computed with nitrate-N loss rates ranging from K = 0.00 ft/d to K = 0.20 ft/d (Figure
5.2). RivCR demonstrates the lowest increase in firm yield, as it asymptotes at K = 0.05 ft/d with a yield
of 2.42 mgd due to the limited number of pumping opportunities available under this WQOR. On the
other hand, ResCR demonstrates a pronounced sensitivity to the nitrate loss rate, as its firm yield
increases from 2.32 mgd without any nitrate losses to 3.56 mgd at K = 0.02 ft/d. There is a contrast
between these two WQOR because the RivCR yield only increases due to the reduced blending demand
that results from nitrate losses. On the other hand, the ResCR yield rises much more rapidly when there

143
are nitrate losses because they lower the concentration of the reservoir below 4 mg/L often, allowing
the system to refill the reservoir more frequently. In addition, given the first-order decay rate, the
percent rate at which nitrate-N is removed from the reservoir increases with the reservoir
concentration, which is the highest under ResCR.
The crossover between the firm yields obtained under ResCR and HybCR between K = 0.01 ft/d and K =
0.02 ft/d in Figure 5.16 shows that, as nitrate loss rates increase, a system can relax its WQOR
constraints more easily. These results also elucidate the importance of taking nitrate losses into
account even when they are low, as they likely are in a former limestone quarry. In fact, the marginal
benefits of increasing K 0.01 ft/d in terms of firm yield are greatest when K increases from 0.00 ft/d to
0.01 ft/d under the specified first-order rate. This can be seen in Figure 5.17, which contains a set of
storage-yield-nitrate loss rate curves developed from simulations run with ResCR, the WQOR that is
most sensitive to nitrate losses. Inflow concentration-based standards, i.e., , curtail increases
in firm yield under RivCR and HybCR. When the reservoir capacity is the listed value of 2,026 AF, the
RivCR yield stops increasing when K = 0.05 ft/d while the HybCR yield barely increases between K = 0.15
ft/d and K = 0.20 ft/d. However, to properly model nitrate in an OSBR used for drinking water supply,
algal growth and treatment must also be considered. Additionally, the strong sensitivity of the firm
yield to nitrate losses highlights the importance that the location of an intake in an OSBR can have on
the firm yield in reservoirs with imperfect mixing.
Finally, while this research focuses on raising the firm yield of an existing OSBR system through
improvements to its operation rules, many of the findings also offer valuable guidance for OSBR design.
Of particular interest is the difference in the optimal surface area to capacity ratio between systems
whose firm yields are primarily limited by streamflow deficits and those whose yields are primarily
constrained by poor water quality. The extent to which the firm yield increases with nitrate loss rates

144
encourages the innovation of new reservoir designs that enhance denitrification and other nitrate loss
mechanisms, general ideas for which are offered in Section 7.3. In recent years, OSBR systems have
emerged as a preferred alternative to investments in expensive treatment technology and led to
substantial savings for utilities. Advancing research on the operation and design of these reservoirs is
imperative for their continued consideration as a water supply alternative, especially in regions in which
high nitrate-N concentrations may pose a health hazard and prompt community water systems to invest
in expensive treatment technology.
7.2 Vulnerability of Pontiac to Water Shortages – A Preliminary Assessment
Although this thesis employs a simplified version of the Illinois-American Water Company system that
serves the city of Pontiac, Illinois, many findings from this thesis are relevant for improving the firm yield
of the system. Under the current water quality operation rules (RivCR with = 4 mg/L) and Base
Case Scenario, Pontiac has a firm yield of 2.21 mgd, which exceeds its 2005-2009 average daily demand
of 1.95 mgd by 13 percent. If ResCR and HybCR could be applied with = 4 mg/L, the firm
yield would rise to 2.32 mgd and 2.67 mgd, respectively. While the imperfect mixing in the Pontiac
reservoir makes it difficult to apply these reservoir-concentration based rules, the improved yield under
these two rules nonetheless demonstrates the potential that a pending relocation of the intake to the
northwestern sub-impoundment has for increasing the firm yield of the system. This relocation would
increase the residence time of water at the intake. In addition, a reservoir concentration-based rule
could be developed for the southern basin or just the sub-impoundment in which the intake is located.
Explorations of the sensitivity of the firm yield to water quality constraint values suggest that the yield
could be improved through by relaxing the constraints. As the average reservoir nitrate-N
concentration under RivCR is just 2.07 mg/L, it is unlikely that the reservoir could ever rise above 8.0
mg/L under a moderate relaxation of this constraint. Nonetheless, the increased costs and effort

145
devoted to algal treatment in the reservoir under a relaxed constraint would also have to be evaluated.
Options for a flexible seasonal or drought-trigger relaxation of the constraint could also be incorporated
into operating rules. Such possibilities are discussed further in Section 7.3.
Next, while the firm yield under RivCR (2.21 mgd) exceeds the 2005-2009 average raw water demand of
1.95 mgd, there are numerous reasons for which this system cannot be considered to have an adequate
water supply. First, when the impact of uncertainty of hydrologic data is incorporated into the
Pessimistic Hydrologic Scenario, the firm yield falls to 1.80 mgd under RivCR. When the operation of
the system under the Pessimistic Hydrologic Scenario is tested under RivCR with = 6 mg/L and
7 mg/L, the firm yield declines to just 1.39 mgd and 1.57 mgd. These yields both fall well short of its
2005-2009 average daily demand of 1.95 mgd. The extent to the demand increases during the critical
period of shortage depends upon the extent to which a drought, and not the high nitrate-N
concentrations that may follow it, contributes to the depletion of the reservoir. In addition, one should
not exclude the possibility of a sequence of streamflow drought and high post-drought nitrate
concentrations with water supply consequences more severe than the 1979-1999 period of record used
in this study. However, results from this study encourage recent efforts to reduce nitrogen loads into
the Vermilion River, as the firm yield rises 43 percent under RivCR when the nitrate-N time series is
uniformly reduced by 20 percent.
A major weakness that causes the firm yield to be underestimated is that nitrate loss rates are not
included in the Base Case Scenario because there are insufficient data on nitrate-N concentrations in the
reservoir. Given the sensitivity that the firm yield exhibits to low nitrate-N loss rates that do not even
acknowledge the temporary conversion of nitrate to other nitrogenous compounds that occur through
biological assimilation, it is imperative to improve the quantification of these collective losses. Further
146
information on these losses coupled with studies of reservoir hydrodynamics could further justify the
movement of the intake to the northwestern sub-impoundment.
7.3 Future Directions
The findings and challenges encountered in this research identify numerous future directions in which
this work can be developed. Benefits for both general research on OSBR and a vulnerability assessment
for Pontiac are identified for each of the directions described below:
7.3.1 Incorporation of Real-Time Decision-Making
This thesis computes the firm yield using fixed operating rules based a priori knowledge of the system.
While some aspects of the rules are designed to grant the system flexibility during a drought, such as the
BRR, operators do not have the ability to make reactive decisions based on existing or forecasted
streamflow and water quality conditions. Ultimately, it would be great to have decision variables that
determine the optimal value of water quality constraints under a given operating rule. Yet
implementing an optimization model that can optimize these constraint values for each day requires an
extraordinary amount of computational power. Instead, it may be more feasible to identify distinct
periods for which a single water quality operating rule could be prescribed. These periods could each
have the same duration or preliminary simulations could allow the user to identify specific periods of
interest, e.g., late summer low-flow periods.
In addition, the fixed-rule simulation approach based on a priori knowledge could also be enhanced
through the development of seasonal, drought trigger and hedging rules. Seasonal rules could feature a
relaxed water quality constraint prior to late summer low-flow periods to ensure ample storage.
Relaxing inflow standards during the fall and winter may also be beneficial if nitrate losses are
substantial. This practice could help guarantee a sufficient supply in anticipation for the spring blending
season and summer low flow season. Drought trigger rules could call for a relaxation of water quality

147
constraints when reservoir storage falls below a given threshold. This way, the system could keep the
concentration of nitrate-N in the reservoir low to curtail algal growth and then relax the WQOR if a
drought is anticipated. Fittingly, a trigger-based would be especially beneficial if there were a quality
streamflow and water quality forecasting with a long-lead time. Otherwise, operators may
unnecessarily fill the reservoir with high-nitrate water and cause algae problems and raise the blending
demand or they pass up opportunities to fill the reservoir in anticipation for the summer low flow
season. Hedging rules may also improve the yield of the system, especially if customers can be
convinced to conserve water during extended blending periods. Finally, improvements to the blending
operations should also be considered. A study of hourly nitrate-N variability in the Vermilion River,
especially following storms could enhance the decisions made about reservoir releases.
7.3.2 Streamflow and Nitrate-N Forecast Models
The development of a streamflow and nitrate-N forecast model, especially with a long lead time, would
enable the system to know when to fill its reservoir. As shown in Section 3.2, filling a reservoir during a
period with a relatively high nitrate-N concentration in the source river can prevent the system from
filling its reservoir during an ensuing period in which the river concentration has diminished.
Conversely, a forecast calling for high nitrate-N concentrations can prompt a system to relax its water
quality constraints. Markus et al. (2010) have developed nitrate-N forecasting models with weekly lead-
times in the Sangamon River basin in central Illinois. Yet, relationships between streamflow and
nitrate-N concentration on an inter-annual time scale have been identified in other research (e.g., Li et
al., 2010). If these findings can be incorporated into a long-lead time nitrate-N forecasting model, then
the extent to which they improve the firm yield of the reservoir could be quantified.
On the other hand, an ability to reliably forecast nitrate-N on a sub-daily timescale following storms
would enhance the ability of the system to make better decisions regarding the use of water from the
148
OSBR for blending. Verma (2010) explored the optimal combinations of flow conditions and sampling
frequency for estimating annual nitrate-N loads at Pontiac. Adapting these types of methods to sub-
daily time scales, along with collection of hourly data, could enhance this capacity.
7.3.3 Reservoir Nutrient Dynamics
The sensitivity that the firm yield exhibits to the nitrate-N concentration in the Pontiac OSBR
demonstrates a need for further research on the nutrient dynamics of the reservoir. A companion
monitoring effort would be necessary to characterize these dynamics. This model does not necessarily
have to be process-based, as a statistical model based on correlations between nitrate-N concentrations
observed in the reservoir could be used to improve water supply. For instance, the concentration at the
intake forecast for a given day could be predicted as a function of the concentration of pumped influent,
precipitation and other key points throughout the reservoir. A new operating rule that makes pumping
decisions based on the nitrate-N concentration at the intake and the routing of water through the
reservoir could even be developed, and this rule would not require the assumption of perfect mixing,
which is not so valid in the Pontiac reservoir given the numerous sub-impoundments into which it is
divided as well as the close proximity of the inlet and intake. Meanwhile, a physically-based model
would elucidate much more information about the individual processes within the reservoir, but would
also be much more data intensive.
In addition, regulating the concentration of algae in the reservoir to allow for biological assimilation of
nitrate without having the algae proliferate and cause taste and odor problems is another management
challenge that needs to be incorporated into a model of the system. The system typically releases
copper sulfate into the reservoir 4-5 times per year, a task that requires approximately five man-hours
of labor, to prevent these taste and odor problems (Tuley, 2011). Characterizing the tradeoff between
administering algaecides and improvements in firm yield could allow the system to reassess the value of

149
their algae treatment efforts. Most likely, it could possibly substantiate the relaxation of the water
quality constraints that dictate the circumstances under which inflow into the reservoir is permitted.
7.3.4 Designing OSBRs that Enhance Nitrate Loss Rates
The sensitivity of storage-yield curves to the nitrate loss rate demonstrates the need for reservoir
designs that enhance the rate at which denitrification and other nitrate loss mechanisms remove nitrate
from influent water. Three major types of design enhancements come to mind:
Optimizing Inlet and Intake Locations
Locating the inlet through which water diverted from the river enters the reservoir far from the intake
that conveys water to the treatment plant increases the residence time of water in the reservoir. In
turn, a longer residence time increases the amount of time for denitrification to take place while
increasing the distance between the inlet and intake can increase the frequency with which nitrate and
other nitrogenous compounds in the water column settle into the benthic layer. Likewise, a longer
residence time will provide more opportunities for biological assimilation assuming that are no other
factors limiting algal growth, namely phosphorus availability. Enhanced biological assimilation will boost
the firm yield of the system provided that the system is willing to invest in additional algae removal to
avoid taste and odor problems in their drinking water.
Creating an Organic Substrate for the Reservoir Bottom
In reservoirs, denitrification occurs through bacteria that reside in sediments in which anoxic conditions
and an organic carbon source are present. Some OSBRs are located in excavated basins or abandoned
quarries, such as the one in Pontiac, which have little to no organic matter. For reservoirs are used for
drinking water storage, turbidity concerns bar systems from pumping water into their reservoirs during
storms in which there are high concentrations of organic matter in river water. Also, many off-stream
reservoirs are equipped with liners to prevent seepage losses (Curtis et al., 2001). Designing a liner that

150
contains an organic material could facilitate denitrification. The sensitivity analysis conducted in this
study demonstrates that even a small decrease in the denitrification, e.g., from K = 0.01 ft/d to 0.02 =
ft/d, can result in a substantial improvement in the firm yield.
Developing an Inlet Structure That Contains a Treatment Wetland
Many studies document the nutrient removal benefits of artificial wetlands (e.g., Kadlec and Knight,
1995). However, these systems have not been combined with off-stream reservoirs. One common
with treatment wetlands in central Illinois is that tend to export nutrients during the winter. A system
in which there is an option route influent through a treatment wetland or bypass it with a pipeline could
circumvent problems with wintertime nutrient export or other contaminants if it is not cost-prohibitive.

151
References
Adiscott, T.M. 2005. Nitrate, Agriculture and the Environment. Wallingford, UK: CABI Publishing.
Admiraal, W. and J.C. van der Vlugt. 1988. High rates of denitrification in a storage reservoir fed with water of the river Rhine. Archiv fur Hydrobiologie Stuttgart (Arch. Hydrobiol), 113(4), 593-605.
Agüera, F., Aguilar, F.J., Aguilar, M.A. and F. Carvajal. 2007. Minimising the Earthwork Cost in the Construction of Irrigation Offstream Reservoirs. Water Resources Management, 21, 375-397.
Archfield, S.A. and R.M. Vogel. 2005. Reliability of reservoir yield as determined by the drought of record. EWRI 2005 World Water and Environmental Resources Congress, Anchorage, Alas., 2005.
Avery, A.A. 1999. Infantile Methemoglobinemia: Reexamining the Role of Drinking Water Nitrates. Environmental Health Perspectives, 107(7), 583-586.
Braden, K. 2009. Inflatable dam helps Marysville, Ohio, meet project schedule and budget. American Public Works Association Reporter, September 2009. Accessed at http://www.hrgray.com/documents/11691-web.pdf on Feb 24, 2011.
Butts, T.A., Shackleford, D.B. and R.S. Larson. 1995. Illinois Power Company – Baldwin Power Plant Ash-pond Effluent Boron Mixing with the Kaskaskia River. Illinois State Water Survey Contract Report 588 (CR-588).
Campbell, J.E., Briggs, D.A., Denton, R.A. and G. Gartrell. 2002. Water Quality Operation with a Blending Reservoir and Variable Sources. Journal of Water Resources Planning and Management. 128(4) 288-302.
Cecil County Government (Maryland). 2006. Reservoir Feasibility Study. Accessed at www.ccgov.org/uploads/PublicWorks/Rt40_WaterStudies/SurfaceWaterStudy on Feb 20, 2011.
Chang, N-B., Chen, H-W., Ning, S-K., Hsu, H-Y., Shao, K-T. and T-C. Hung. 2010. Sizing an Off-stream Reservoir with Respect to Water Availability, Water Quality, and Biological Integrity. Environmental Model Assessment, PAGES. DOI 10.1007/s10666-009-9215-5.
Chapra, S.C. 1997. Surface Water-Quality Modeling. Boulder, Colo: McGraw-Hill.
Cohen, B. and R. Wiles, EWG. 1996. Nitrate Contamination of Drinking Water.
Comly, H.H. 1945. Cyanosis in infants caused by nitrates in well water. Journal of the American Medical Association, 129, 112-116.
Cuello, C., et al., 1976. Gastric cancer in Colombia I. Cancer risk and suspect environmental agents. Journal of the National Cancer Institute, 57(5), 1015-1020.
Curtis, L.M., Nelson, M.M. and P.L. Oakes. 2001. Estimating Costs of Off-Stream Irrigation Storage Reservoirs. Bulletin 647, September 2001, Alabama Agricultural Experiment Station, Auburn University.
David, M.B., Wall, L.G., Royer, T.V. and J.L. Tank. 2006. Denitrification and the Nitrogen Budget of a Reservoir in an Agricultural Landscape. Ecological Applications, 16(6), 2177-2190.

152
Denshaw-Burke, M., Curran, A.L., Savior, D.C. and J. Schoffstall. 2010. Methemoglobinemia. Medscape Reference. Accessed at http://emedicine.medscape.com/article/204178-overview on April 23, 2011.
Dorsch, M.M., Scragg, R.K.R., McMichael, A.J., Baghurst, P.A. and K.F. Dyer. 1984. Congenital Malformations and Maternal Drinking Water Supply in Rural South Australia: A Case-Control Study. American Journal of Epidemiology, 119(4), 473-486.
Dougherty, M., Bayne, D., Curtis, L., Reutebuch, E. and W. Seesock. 2007. Water quality in a non-traditional off-stream polyethylene-lined reservoir. Journal of Environmental Management, 85, 1015-1023.
Douglas, E.M., R.M. Vogel, and C.N. Kroll. 2002. Impact of Streamflow Persistence on Hydrologic Design. Journal of Hydrologic Engineering 7(3):220-227.
Fang, X., Chang, N-B., Lee, M-K and L. Wolf. 2009. Environmental Impacts on Surface Water and
Groundwater for Expanding Urban Water Supply Capacity Using Stone Quarries. World Environmental and Water Resources Congress. Kansas City, Mo., May 2009.
Fewtrell, L. 2004. Drinking-Water Nitrate, Methemoglobinemia, and Global Burden of Disease: A Discussion. Environmental Health Perspectives, 112(14), 1371-74.
Flahill, J.M. and S.E. Lamale, City of Fremont (Ohio) Water Treatment Plant. 2009. Questions and Answers about the Reservoir and Rate Increases. Accessed at http://www.fremontohio.org/rates/images/q&a.pdf on February 24, 2011.
Gillespie, W. 2011. Personal Communication, informal conversation, April 12, 2011.
Groffman, P.M., Davidson, E.A., and S. Seitzinger. 2009. New approaches to modeling denitrification. Biogeochemistry, 93, 1-5. DOI 10.1007/s10533-009-9285-0.
Groisman, P.Y. and D.R. Legates. 1994. The Accuracy of United States Precipitation Data. Bulletin of the American Meteorological Society, 75(2), 215-227.
Harrison, J.A., Maranger, R.J., Alexander, R.B.., Giblin, A.E., Jacinthe, P-A., Mayorga, E., Seitzinger, S.P., Sobota, D.J. and W.M. Wollheim. 2009. The regional and global significance of nitrogen removal in lakes and reservoirs. Biogeochemistry, 93, 143-157. DOI: 10.10007/s10533-008-9272-x.
Hecht, J.S. and H.V. Knapp. 2008. Data for Assessing Drought Vulnerability of Illinois’ Community Surface Water Systems. Illinois State Water Survey Contract Report 2008-02, University of Illinois at Urbana-Champaign, Champaign, Ill.
Hollinger, S.E., Reinke, B.C. and R.A. Peppler. 1994. Illinois Climate Network: Site Descriptions, Instrumentation and Data Management. Illinois State Water Survey Circular 178, Champaign, Ill.
Holtcamp, W. 2007. Dams on the Side: Off-stream reservoirs can help meet water needs while causing less environmental impact than dams that halt a river’s flow. Texas Parks & Wildlife Magazine, July 2007. Accessed at http://www.tpwmagazine.com/archive/2007/jul/ed_4/ on February 24, 2011.

153
H.R. Gray, Inc. 2009. New City of Marysville Upground Reservoir. Accessed at http://www.hrgray.com/portfolio/water-wastewater/construction-management_marysville-upgroundreservoir.cfm on October 22, 2009.
Illinois Department of Agriculture. 1993-2003. Illinois Commercial Fertilizer Tonnage Report; Illinois Agricultural Statistics Service, Illinois Department of Agriculture: Springfield, lll.
Illinois Environmental Protection Agency, Division of Public Water Supplies. 2004. Public Water Supply
Data Sheet: Livingston County – Illinois-American Water Company Pontiac District.
Illinois State Water Survey. 1984. 7Q10 Low Flow Map. Vermilion River watershed.
Jain, S., Baumberger, L., Adams, S., Jackson, T. and B. Fuller. 2007. Off-stream Reservoir: A Tool for Improving Yield and Water Quality Reliability. Florida Water Resources Journal. February 2007, 22-25.
Jensen, O.M. 1982. Nitrate in drinking water and cancer in Northern Jutland, Denmark, with special reference to stomach cancer. Ecotoxicology and Environmental Safety, 6, 258-267.
Jiang, F., Murray, T. and W. Zeng. 2009. Development of HEC-5 Model for Off-Stream Reservoir Planning. Proceedings of the 2009 Georgia Water Resources Conference, April 27-29, 2009, Athens, Geor.
Johsnon, K. 2011. Personal communication, site visit to Pontiac, April 20, 2011.
Kadlec, R. and R. Knight. 1995. Treatment Wetlands. New York: Lewis.
Kapoor, A. and T. Viraraghavan. 1997. Nitrate Removal from Drinking Water – A Review. Journal of Environmental Engineering, 123(4), 371-380.
Keefer, L., Demissie, M., Mayer, D., Nichols, K. and S. Shaw. 1996. Watershed Monitoring and Land Use Evaluation for the Vermilion River Watershed. ISWS MP-176, Illinois State Water Survey, Champaign, Ill.
Knapp, H.V. and J.S. Hecht. 2009. Evaluating Drought Vulnerability of Small Community Water Supply Systems in the Midwest, Illinois State Water Survey, Champaign, Ill., Contract Report 2009-10, 80 p.
Knapp, H.V. 2007. Uncertainties and Data Needs in Evaluating the Adequacy of Community Surface Water Supply Systems in Illinois. Illinois State Water Survey, Champaign, Ill.
Knapp, H.V. and A.M. Russell. 2004. Rock River Basin Streamflow Assessment Model. Illinois State Water Survey Contract Report 2004-02. Illinois State Water Survey, Champaign, Ill.
Knapp, H.V. 1990. Kaskaskia River Basin Streamflow Assessment Model: Hydrologic Analysis. Illinois State Water Survey Contract Report 499. Illinois State Water Survey, Champaign, Ill.
Knapp, H.V. 1988. Summary of the Pontiac Water Supply situation. Unpublished Memorandum.
Illinois State Water Survey. Illinois State Water Survey, Champaign, Ill.
Knapp, H.V. 1982. Hydrologic Design of Side-Channel Reservoirs in Illinois. Illinois State Water Survey Bulletin 66. Illinois State Water Survey, Champaign, Ill.
154
Koltun, G.F. 2001. Hydrologic considerations for estimation of storage-capacity requirements of impounding and side-channel reservoirs for water supply in Ohio. Water Resources Investigation Report WRIR 01-4256, U.S. Geological Survey, Columbus, Ohio.
L’hirondel, J. and J-L. L’hirondel. 2001. Nitrate and Man, Toxic, Harmless or Beneficial? Wallingford, UK: CABI Publishing.
L’hirondel, J-L., Avery, A.A. and T. Addiscott. 2006. Dietary Nitrate: Where is the Risk? Environmental Health Perspectives, 114(8), 458-459.
Leighton, M.M., Ekblaw, G.E. and C.L. Horberg. 1948. Physiographic Divisions of Illinois. Illinois State Geological Survey Report of Investigation 129.
Li, H., Sivapalan, M., Tian, F. and D. Liu. 2010. Water and nutrient balance in a large tile-drained agricultural catchment: a distributed modeling study. Hydrology and Earth System Sciences. 14, 2259-2275.
Markus, M., Hejazi, M.I., Bajcsy, P., Giustolisi, O. and D.A. Savic. 2010. Prediction of weekly nitrate-N fluctuations in a small agricultural watershed in Illinois. Journal of Hydroinformatics, 1-12.
McConkey, S. and K.P. Singh. 1996. Analysis of Drought Yields from the Charleston Side-Channel Reservoir. Illinois State Water Survey Contract Report 596, Champaign, Ill.
McMahon, T.A. and A.J. Adeloye. 2005. Water Resources Yield. Highlands Ranch, Colo.: Water Resources Publications, LLC.
Merenlender, A.M., Deitch, M.J. and S. Feirer. 2008. Decision support tool seeks to aid stream-flow recovery and enhance water security. California Agriculture. Oct – Dec 2008, 62(4), 148-155.
Meyer, M. 1994. How common is methemoglobinemia from nitrate contaminated wells? A South Dakota perspective. 39th Annual Midwest Ground Water Conference. Bismarck, N. Dak. October, 1994.
Montgomery et al. 2009. The Use of Off-Stream Reservoirs Combined with Percent Flow Withdrawal
Schedules to Reduce Downstream Estuarine Impacts. Workshop on Watershed Reservoirs: Locations,
Effects and Solutions. April 13-15, 2009, Punta Gorda, Fla.
Morton, W.E. 1981. Hypertension and Drinking Water Constituents in Colorado. American Journal of Public Health, 6(7), 1371-1378.
Nace, R.L. 1972. Water problems and developments of the past. Journal of the American Water Resources Association, 8(1), 101-109.
National Academy of Sciences. 1995. Board on Environmental Studies and Toxicology. Nitrate and Nitrite in Drinking Water. Washington, DC.
National Academy of Sciences, Environmental Studies Board. 1978. Nitrates: An Environmental Assessment. Washington, DC.

155
Nelson, K., Shih, L. and D. Huey. 2006. Source Water Quality Forecasting and Tactical Management of Los Vaqueros Reservoir. Proceedings of American Society of Civil Engineers (ASCE) Operations Management Conference. August 14-16, 2006, Sacramento, Calif.
Northern Illinois Water Company – Pontiac Water Treatment Plant Partnership. 1999. Phase III Completion Report. March 1999.
Ohio Department of Natural Resources, Division of Water. 2009. Cooperative Upground Reservoirs. Accessed at http://www.ohiodnr.com/water/planing/coopresv/tabid/4034/Default.aspx on October 20, 2009.
Raman, R.K. and R.M. Twait. 1994. Water Quality Characteristics of Lake Bloomington and Lake Evergreen. Illinois State Water Survey Contract Report 569. Illinois State Water Survey, Champaign, Ill.
Roberts, W.J. and J.B. Stall. 1967. Lake Evaporation in Illinois. RI-57, Illinois State Water Survey, Champaign, Ill.
Royer, T.V., David, M.B. and L.E. Gentry. 2006. Timing of Riverine Export of Nitrate and Phosphorus from Agricultural Watersheds in Illinois: Implications for Reducing Nutrient Loading to the Mississippi River. Environmental Science & Technology, 40(13), 4126-4131.
Sattelmacher P.G. 1962. Methemoglobinemia from nitrates in drinking water. Schriftenreiche des Vererins fur Wassar Boden und Lufthygiene, 21.
Saunders, D.L. and J. Kalff. 2001. Nitrogen retention in wetlands, lakes and rivers. Hydrobiologia, 443(1-3), 205-212.
Scarborough, V.L. and G. Gallopin. 1991. A water storage adaptation in the Maya Lowlands. Science, 251 (4), 658-662. DOI: 10.1126/science.251.4994.658.
Scott, R.W., LeFaivre, M. and M. Demissie. 2010. Quality Assurance Plan for the Water and Atmospheric Resources Monitoring (WARM) Program. Illinois State Water Survey, Champaign, Ill.
Schnier, S. 2009. Modeling of Proposed Off-Channel Reservoir for the Lavaca-Navidad Water Authority. Unpublished Draft Memorandum, Freese and Nichols, Inc.
Seitzinger, S., Harrison, J.A., Böhlke, J.K., Bouwman, A.F., Lowrance, R., Peterson, B., Tobias, C. and G. van Drecht. 2006. Denitrification across Landscapes and Waterscapes: A Synthesis. Ecological Applications, 16(6), 2064-2090.
Simon, C., Manzke, H., Kay, H. and G. Mrovetz. 1964. Uber vorkommen, pathogenese, und moglichkeiten zur prophylaxe der durch nitrit verursachten methamoglobinamie. Zeitschrift fur Kinderheilkunde, 91, 124-138.
Singh, J. 2004. Hydrologic Model of the Vermilion River Watershed for Streamflow Simulations. Illinois State Water Survey Contract Report 2004-10. Illinois State Water Survey, Champaign, Ill.
Sprague, L.A. 2002. Nutrient dynamics in five offstream reservoirs in the Lower South Platte River Basin, March - September 1995: U.S. Geological Survey Water-Resources Investigations Report 02-4142.

156
Szilagyi, J., Gribalszki, Z. and P. Kalicz. 2007. Estimation of catchment-scale evapotranspiration from baseflow recession data: Numerical model and practical application results. Journal of Hydrology (336), 206-217.
Tallaksen, L.M. 1995. A review of baseflow recession analysis. Journal of Hydrology, 165, 349-370.
Tomasko, D., Montgomery, R., Latham, P. and M. Coates. 2009. Linking Ecological Restoration with
Water Supply Development using Off-Stream Reservoirs in Southwest Florida. Workshop on
Watershed Reservoirs: Locations, Effects and Solutions. April 13-15, 2009, Punta Gorda, Fla.
Tuley, T. 2011a. Personal communication, site visit to Pontiac, April 20, 2011.
Tuley T. 2011b. Personal communication, telephone interview, April 4, 2010.
Tuley, T. 2010. Personal communication, telephone interview, September 29, 2010.
Tuley, T. 2008. Personal communication, telephone interview, date unknown.
United States Bureau of Reclamation (USBR), Mid-Pacific Region and Montgomery, Watson and Harza,
Inc (MWH). 2006. San Luis Reservoir Low Point Improvement Project Final Appraisal Report.
Accessed at http://www.usbr.gov/mp/sllpp/docs/app_rpt_final.pdf on February 25, 2011.
URS Corporation. 2008. North-of-the-Delta Offstream Storage Investigation: Plan Formulation Report.
Prepared for the U.S. Bureau of Reclamation under Contract No. 06CS204097A.
Van Maanen, J.. 1994. Consumption of drinking water with high nitrate levels causes hypertrophy of the
thyroid. Toxicology Letters. 72, 365-374.
Verma, S. 2010. Development of Error Correction Techniques for Nitrate-N Load Estimation Models.
Master’s Thesis, Department of Agricultural and Biological Engineering, University of Illinois at
Urbana-Champaign.
Vogel, R.M. and C.N. Kroll. 1996. Estimation of Baseflow Recession Constants. Water Resources
Management, 10, 303-320.
Walton, B. 1951. Survey of the literature relating to infant methemoglobinemia due to nitrate
contaminated water. American Journal of Public Health, 41, 986-996.
Wang. D and X. Cai. 2009. Detecting human interferences to low flows through baseflow recession analysis. Water Resources Research, 45, W07426, doi:10.1029/2009WR007819.
Ward, M.H., de Kok, T.M., Levallois, P., Brender, J., Gulis, G., Nolan, B.T., et al. 2005. Workgroup report: drinking-water nitrate and health – recent findings and research needs. Environmental Health Perspectives, 113, 1607-1614.
Washington Department of Health, 2005. Nitrate Treatment Alternatives for Small Water Systems. Washington State Department of Health. Olympia, Wash.
Wetzel, R. 2001. Limnology: Lake and River Ecosystems, 3rd Edition. San Diego: Academic Press.

157
Whitehead, P.G. and I.P. Toms. 1993. Dynamic Modelling of Nitrate in Reservoirs and Lakes. Wat. Res., 27(8), 1377-1384.
Wikipedia. 2011. Methemoglobinemia. Accessed at http://en.wikipedia.org/wiki/Methemoglobinemia on April 23, 2011.
Winter, T.C. 1981. Uncertainties in estimating the water balance of lakes. Water Resources Bulletin, 17(1), 82-115.
Wyoming State Engineer’s Office. 2002. Permitting Requirements Associated with Off-Channel Containment Pits. Accessed at http://seo.state.wy.us/PDF/OffChannelContainReq.pdf on February 24, 2011.
Young, K.B. Wailes, E.J., Popp, J.H. and J. Smartt. 2004. Value of Water Conservation Improvements on Arkansas Farms. Journal of the American Society of Farm Managers and Rural Appraisers, 119-126.

158
Appendix A: Derivation of Numerical Expression for Reservoir Nitrate-N
Concentration
This appendix details the derivation of a numerical expression for the nitrate-N concentration in the
reservoir using a Euler’s backwards differencing scheme. A general formulation for Euler’s problem is:
where the rate of change over time, is a function of both time, , and the change in
concentration as a function time, . The initial value of at is .
Applying the backwards difference scheme:
Where h represents the value of y at h time steps prior to t. This equation can be discretized as follows:
If , the mass of nitrate in the reservoir, then Eq. 2.6 can be rewritten as follows:
All variables in this equation are time-dependent except for the surface area of the reservoir, .
Defining the time step h as Δt and n as the time step index:
(A.1)
(A.2)
(A.3)
(A.4)
(A.5)
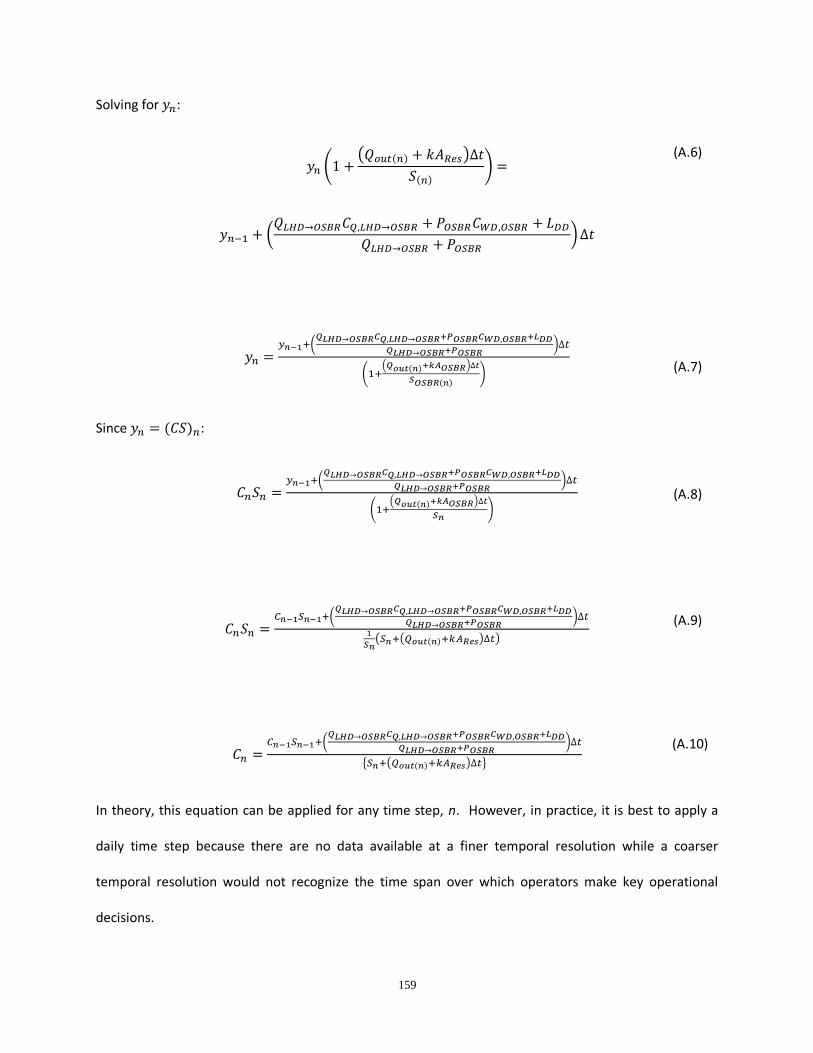
159
Solving for :
Since :
In theory, this equation can be applied for any time step, n. However, in practice, it is best to apply a
daily time step because there are no data available at a finer temporal resolution while a coarser
temporal resolution would not recognize the time span over which operators make key operational
decisions.
(A.6)
(A.7)
(A.8)
(A.9)
(A.10)

160
Appendix B: Relationship Between Water Quality Constraints and Firm Yield under RivCR
To demonstrate that there can be a non-monotonic relationship between and the firm yield
when there is a capacity constraint, a simple simulation model of a hypothetical OSBR system was
created. To illustrate the impact that a capacity constraint has on this relationship, cases with a given
sequence of water quality data and (i) a non-binding reservoir capacity and (ii) a binding reservoir
capacity are considered. However, first, it is necessary to describe the simulation model used to assess
the monotonicity of the relationship between and the firm yield. During each simulation, the
reservoir starts out empty. There is a filling period in which on each day, t, of the
period followed by a blending period in which on each day. The maximum
pumping capacity is 10 arbitrary units of water per day. Evaporation and direct precipitation onto the
reservoir surface are ignored to simplify these hypothetical cases. Streamflow is assumed to not
constrain the filling of the reservoir under any circumstance. The objective is to avoid having the
reservoir return to a completely empty state under a constant daily demand of 5 units of water per day.
The performance of the system is compared under values of 4 mg/L and 8 mg/L, respectively
with is set to a constant value of 8 mg/L for both constraints. This hypothetical
system has a maximum pumping capacity of 10 units per day.
Since during the filling period, the entire daily water supply can come from the
LHD impoundment provided that there is ample streamflow for pumping to both the reservoir (first
priority) and the LHD impoundment (second priority). In addition, since no blending takes place during
a filling period, it follows that the total inflow during the filling period under = 8 mg/L must
equal or exceed the inflow under = 4 mg/L. Conversely, during the blending period that

161
follows, the blending demand, , i.e., the release required for blending, under = 8 mg/L must
exceed or equal the releases under = 4 mg/L.16
Next, it is necessary to determine whether the additional inflow under = 8 mg/L exceeds the
additional releases required for blending under this rule. One way of comparing the performance of
the system under these two rules is to simply identify the rule under which the reservoir becomes
empty first. Since the system demand of 5 units per day is identical under = 4 mg/L and
= 8 mg/L, the value under which the reservoir becomes empty first has a lower firm
yield.
Figure B.1 illustrates the general relationship between the storage in an OSBR under two values
of under a relatively higher and lower constraints, henceforth referred to as
and , respectively. Referring to the example in this case, could equal 8
mg/L and could be 4 mg/L. In any case, since the concentration of a contaminant in the
reservoir at the end of the filling period is higher under , it follows that the blending demand,
under exceeds the demand that takes place under . Since the rate at which storage
in the reservoir decreases under exceeds that of , the storage in the reservoir under
and will have the same value again at some point during the blending period,
provided that (i) the blending period does not end and (ii) that the storage in the reservoir is not
emptied under . In Figure B.1, there are two downward sloping lines from the storage
maximum that occurs at the end of the filling period under . The steeper indicates a higher
blending demand while the line with a gentler slope has a lower blending demand. If the storage in the
reservoir becomes empty under first, then it follows that produces a higher yield,
i.e., . On the other hand, if the storage volumes in the reservoir under and
16
The only circumstance under which these releases are equivalent is when 4 mg/L during the entire filling period.

162
converge before either reservoir is depleted, then it can be said that has a higher
firm yield due to the fact that the reservoir would be depleted first under if the blending
period were to continue, i.e. . In this latter case, there is a non-monotonic relationship
between and the firm yield.
Next, the possibility of a non-monotonic relationship in a system without a binding capacity constraint is
investigated. To search for cases in which the relationship may be non-monotonic, the changes in
storage when = 4 mg/L and = 8 mg/L are compared over the course of the filling and
blending periods. Assume the following ten-day sequence of nitrate-N concentrations in mg/L takes
place during the filling period in which corresponds to the nitrate-N concentration in the LHD
impoundment on day, t:
When = 4 mg/L is instituted, only 50 units of storage are added to the reservoir since it cannot
be filled on days when equals 8 mg/L. On the other hand, the reservoir storage after ten days
is 100 units when = 8 mg/L, as the reservoir can be filled on all ten days of the filling period.
Next, it is necessary to compute the blending demand from the reservoir using Equation 2.3. The water
quality values in Equation B.1 above were chosen to create the maximum difference in reservoir nitrate-
N concentration between = 4 mg/L and = 8 mg/L given a series of values for
which pumping is possible during 50 percent and 100 percent of the days in the filling period under the
two water quality operating rules, respectively Drawing from the formula for computing the blending
release from Equation 2.3, the blending demands under the 4 mg/L rule, , and the 8 mg/L rule,
are computed as fractions of the average daily demand, , which is 5 units of water. For demonstration
purposes, it is assumed that = 20 mg/L during the entire blending period.
(B.1)

163
Under = 4 mg/L, releases for blending constitute 60 percent of the daily demand while the
releases under = 8 mg/L amount to 75 percent of the daily demand during the blending period.
The point at which the storage volumes under the two constraints converge can be deduced
algebraically. First, it is necessary to determine the number of days, d, after the start of the blending
period that this convergence takes place.
and indicate the storage in the reservoir at the outset of the blending period under the
= 4 mg/L and = 8 mg/L water quality constraints, respectively. The following
calculations illustrate the solution of the hypothetical system using Equation B.3.
The storage volume at which the convergence happens can be computed by plugging this value into
either side of the equation. Using the left-hand side of the equation as an example:
Since the storage volume at the point of convergence is negative, it can be concluded that, in this case,
the firm yield is higher under = 8 mg/L than = 4 mg/L.
(B.2a)
(B.2b)
(B.3)

164
Next, the impact that a reservoir capacity constraint has on the monotonicity of this relationship is
examined using the same hypothetical water quality data set in Equation B.1. In this case, the reservoir
capacity is 60 units of water and the initial storage is 0 units as in the previous example. The storage
volume under = 4 mg/L rises from 0 to 50 units, as it does in the example with a non-binding
reservoir capacity. In contrast, the capacity of the reservoir limits the storage to 60 units under
= 8 mg/L. Due to the relaxed water quality constraint, the system fills water with a nitrate-N
concentration of 8 mg/L on Days 2, 4 and 6 of the simulation and, once the reservoir reaches capacity
after it is filled on Day 6, the system cannot fill the reservoir with water with a nitrate-N concentration
of 0 mg/L on Days 7 and 9 of the filling period. As with the example with an unlimited capacity, the
blending demands under = 4 mg/L and = 8 mg/L are:
Next, the number of days of blending it takes for the storage volumes to equal each other is calculated:
Plugging the value of d back into the left-hand side of Equation 3.4:

165
In this case, the storage volumes in the two reservoirs converge at a volume of 10 units. If the blending
period continues, the reservoir becomes empty first under = 8 mg/L. Thus, the firm yield
under = 4 mg/L is greater and there is a non-monotonic relationship between and
the firm yield.
It is also worthwhile to show the effect that the sequence of nitrate-N concentrations in a river during a
period has on this relationship. To illustrate this concept, shuffle the order of the water quality in
Equation B.1, such that:
Under this case, the average nitrate-N concentrations under = 4 mg/L and = 8 mg/L
are 0 mg/L and 1.33 mg/L, respectively. Next, the blending demand under each rule is computed using
the same procedure as above:
Next, the number of days of blending it takes for the storage volumes to equal each other is calculated:
Plugging the value of d back into the left-hand side of the equation:
(B.4)

166
When the lowest nitrate-N concentrations are distributed toward the beginning of the filling period, it is
less likely that there will be a non-monotonic relationship between and the firm yield.

167
Figures and Tables
Figure B.1: Conceptual diagram of tradeoff between the additional inflow and releases required when relaxing reservoir water quality standards.

168
Author’s Biography
Jory S. Hecht was born in 1979 and spent his entire childhood in Albany, California, a small city of about
17,000 people that lies immediately northwest of Berkeley. He matriculated at Clark University in
Worcester, Massachusetts, for his undergraduate studies and graduated with Bachelor of Arts degrees
in both Geography and International Development in 2002. After spending a year in rural Guatemala
and another year helping refugee and immigrants from Latin America in Oakland, he enrolled in
graduate school in the Department of Geography at the University of California – Santa Barbara. At
Santa Barbara, he obtained a Master’s of Arts degree with a thesis on the causes of dry season flow
variability within Central America’s Lempa watershed. This foray into hydrology led him to a two-year
stint as an Assistant Professional Scientist with the Illinois State Water Survey, where he conceived the
idea for this thesis. After completing one class on a part-time basis, Jory enrolled in the Department of
Civil and Environmental Engineering full-time to obtain a Master’s of Science in Civil Engineering. He
will continue his education in the doctoral program in Environmental and Water Resources Engineering
at Tufts University, where he will start with a two-year Integrative Graduate Education and Research
Traineeship (IGERT) fellowship in water diplomacy. He hopes to continue researching alternative water
supply and treatment options for community drinking water supplies through his doctoral studies.