opennebulaconf 2016 - measuring and tuning vm performance by boyan krosnov, storpool
TRANSCRIPT

Measuring and tuning VM performance
Boyan KrosnovStorPool Storage

1. Measuring performance and evaluating changes to settings or infrastructure which can affect performance positively
2. Best current practice for architecture for high performance clouds
Agenda

● Better application performance -- e.g. time to load a page, time to rebuild, time to execute specific query
● Happier customers (in cloud / multi-tenant environments)● Lower cost per delivered resource (per VM)
○ through higher density
Why

“For every fact there is an infinity of hypotheses.”
“The real purpose of the scientific method is to make sure nature hasn’t misled you into thinking you know something you actually don’t know.”
Robert M. Pirsig, Zen and the Art of Motorcycle Maintenance
Mandatory inspirational quote

What to measure
Application performance
Proxies for application performance
Common synthetic workloads
Throughput vs latency
2000kg of X per day (cost/efficiency) vs
10 seconds to first X (what user cares about)
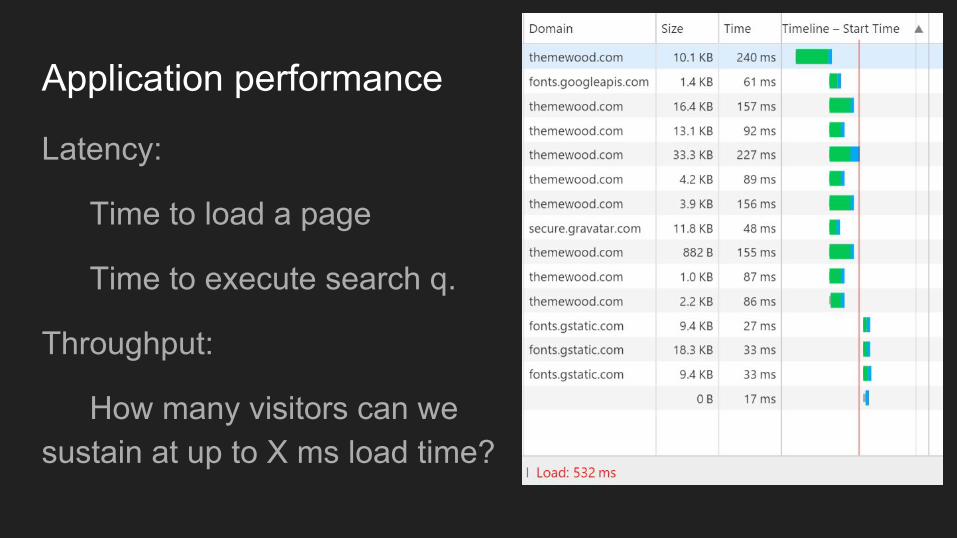
Application performance
Latency:
Time to load a page
Time to execute search q.
Throughput:
How many visitors can we sustain at up to X ms load time?

Application performance
Latency:
Time to load a page
Time to execute search q.
Throughput:
How many visitors can we sustain at up to X ms load time?

Proxies for app performance
Latency:
Break down total latency to components
Throughput:
Identify bottlenecks
Measure just the largest contributors. E.g. database insert.

Common synthetic workloads
Throughput:
- 4k random read, iodepth 32 or ∞- 4k random write, iodepth 32 or ∞- 4k random read/write 50/50, iodepth 32 or ∞- Sequential read- Sequential write
Word of advice: real workloads don’t look like this at all!

Common synthetic workloads
Latency:
- random read 4k, iodepth 1- random write 4k, iodepth 1
Latency under load:
- Same as throughput but look at latency
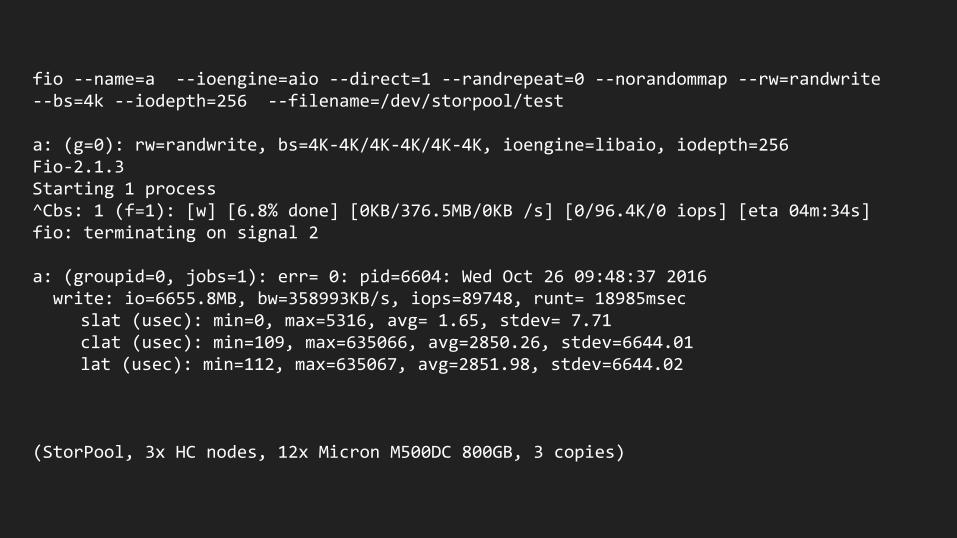
fio --name=a --ioengine=aio --direct=1 --randrepeat=0 --norandommap --rw=randwrite --bs=4k --iodepth=256 --filename=/dev/storpool/test
a: (g=0): rw=randwrite, bs=4K-4K/4K-4K/4K-4K, ioengine=libaio, iodepth=256Fio-2.1.3Starting 1 process^Cbs: 1 (f=1): [w] [6.8% done] [0KB/376.5MB/0KB /s] [0/96.4K/0 iops] [eta 04m:34s]fio: terminating on signal 2
a: (groupid=0, jobs=1): err= 0: pid=6604: Wed Oct 26 09:48:37 2016 write: io=6655.8MB, bw=358993KB/s, iops=89748, runt= 18985msec
slat (usec): min=0, max=5316, avg= 1.65, stdev= 7.71clat (usec): min=109, max=635066, avg=2850.26, stdev=6644.01lat (usec): min=112, max=635067, avg=2851.98, stdev=6644.02
(StorPool, 3x HC nodes, 12x Micron M500DC 800GB, 3 copies)

fio --name=a --ioengine=aio --direct=1 --randrepeat=0 --norandommap --rw=randwrite --bs=4k --iodepth=1 --filename=/dev/storpool/test
a: (g=0): rw=randwrite, bs=4K-4K/4K-4K/4K-4K, ioengine=libaio, iodepth=1Fio-2.1.3Starting 1 process^Cbs: 1 (f=1): [w] [0.1% done] [0KB/25224KB/0KB /s] [0/6306/0 iops] [eta 01h:08m:38s]fio: terminating on signal 2
a: (groupid=0, jobs=1): err= 0: pid=9141: Wed Oct 26 09:52:05 2016 write: io=119580KB, bw=26086KB/s, iops=6521, runt= 4584msec
slat (usec): min=1, max=42, avg= 2.61, stdev= 1.30clat (usec): min=105, max=12543, avg=150.07, stdev=190.67lat (usec): min=107, max=12545, avg=152.76, stdev=190.69
(StorPool, 3x HC node, 12x Micron M500DC 800GB, 3 copies)

● Compute platform○ Hardware selection○ HW tuning○ OS / hypervisor tuning
● Network● Storage system
Best practices

Typically
- 2x E5-2690v4 -- 28 cores, 56 threads, @3.2 GHz all-cores turbo
- 256-384-512 GB RAM- 10/40 GbE NICs, optionally with RDMA
- firmware versions and BIOS settings- Understand power management -- esp. C-states, P-states and “bias”- Think of rack level optimization - how do we get the lowest total cost per
delivered resource.
Host hardware

RHEL7 Virtualization_Tuning_and_Optimization_Guide
Also
https://pve.proxmox.com/wiki/Performance_Tweakshttp://events.linuxfoundation.org/sites/events/files/slides/CloudOpen2013_Khoa_Huynh_v3.pdfhttp://www.linux-kvm.org/images/f/f9/2012-forum-virtio-blk-performance-improvement.pdfhttp://www.slideshare.net/janghoonsim/kvm-performance-optimization-for-ubuntu
… but don’t trust everything you read. Perform your own benchmarking!
Good references

Recent Linux kernel, KVM and QEMU… but beware of the bleeding edge
E.g. qemu-kvm-ev from RHEV (repackaged by CentOS)
tuned-adm virtual-host
tuned-adm virtual-guest
Host OS, guest OS

● Use virtio-net driver● regular virtio vs vhost_net● SR-IOV (PCIe pass-through)
Networking

● cache=none -- direct IO, bypass host buffer cache● io=native -- use Linux Native AIO, not POSIX AIO (threads)
● virtio-blk -> dataplane● virtio-scsi -> multiqueue
● in guest virtio_blk.queue_depth 128 -> 256
Block I/O

- balloon- KSM (RAM dedup)
- huge pages, THP- NUMA
- use local-node memory if you can- route IRQs of network and storage adapters to a core on the node they
are on
Compute - Memory

(heavy) oversubscription, because VMs are mostly idling
CPU Pinning
HT
NUMA
Compute - CPU

Typically 4x 10GE per hypervisor, 2 for storage, 2 for inter-VM/internet
Typical cluster has just 2 switches. Up to 128x 10GE ports at low cost.
40/56 GbE and 25G
VLANs, Jumbo frames, flow control.
RDMA
Networks

● Lots of snake oil out there!
● performance numbers from hardware configurations totally unlike what you’d use in production
● synthetic tests with high iodepth - 10 nodes, 10 workloads * iodepth 256 each. (because why not)
● testing with ramdisk backend
● synthetic workloads don’t work to approximate real world (example)
Storage

Performance matters for your users.
Work with partners who understand this and help you with it.
Conclustion

Boyan Krosnov
b k @ storool.com@bkrosnov
https://storpool.com/