open service innovation and the firm's search for external ...for business research and...
TRANSCRIPT

Oe
AC
a
ARRAA
JOLL
KOSEBB
1
odavcooemsk
E(
0h
Research Policy 43 (2014) 853–866
Contents lists available at ScienceDirect
Research Policy
jo ur nal ho me page: www.elsev ier .com/ locate / respol
pen service innovation and the firm’s search forxternal knowledge
ndrea Mina ∗, Elif Bascavusoglu-Moreau1, Alan Hughes2
entre for Business Research and UK∼IRC, Judge Business School, University of Cambridge, Trumpington Street, Cambridge CB2 1AG, United Kingdom
r t i c l e i n f o
rticle history:eceived 27 September 2012eceived in revised form 26 June 2013ccepted 11 July 2013vailable online 22 August 2013
EL classification:3284
eywords:
a b s t r a c t
The concept of open innovation captures the increasing propensity of firms to work across their traditionalboundaries of operation. This phenomenon has largely been studied from the viewpoint of manufactur-ing businesses while services have received much less attention despite the predominant role they playin advanced economies. This paper focuses on open innovation in services, both as a subsector of theeconomy and as a component of the activities of manufacturing firms. We study the open innovationpractices of business services firms and then consider the implications for open innovation of the adop-tion of a service inclusive business model by manufacturing firms. Our analyses are based on a uniquedataset with information on open innovation activities amongst UK firms. Overall, engagement in openinnovation increases with firm size and R&D expenditure. Business services are more active open innova-tors than manufacturers; they are more engaged in informal relative to formal open innovation practices
pen innovationervice innovationxternal knowledgeusiness servicesusiness model
than manufacturers; and they attach more importance to scientific and technical knowledge than tomarket knowledge compared to manufacturing firms. Open innovation practices are also associatedwith the adoption of a service inclusive business model in manufacturing firms and service-integratedmanufacturers engage in more informal knowledge-exchange activities. The paper contributes towards areconceptualisation of open innovation in service businesses and a deeper evidence-based understanding
of the service economy.. Introduction
Firms are increasingly looking for knowledge outside theirrganisational boundaries (Chesbrough, 2003a, 2006) and areeveloping more outward-looking strategic approaches to researchnd development to source at least some knowledge of potentialalue from the broader environment in which they operate. Verti-al disintegration pressures (Langlois, 2003), modularisation andutsourcing (Prencipe et al., 2003; Sturgeon, 2002), the growthf specialised technology markets (Arora et al., 2001; Brusonit al., 2001) and difficulties in appropriating internal invest-ents in intangibles (Chesbrough, 2003b) would appear to have
trengthened firms’ incentives to increase their reliance on externalnowledge for innovation.
∗ Corresponding author. Tel.: +44 (0) 1223 765330.E-mail addresses: [email protected] (A. Mina),
[email protected] (E. Bascavusoglu-Moreau), [email protected]. Hughes).
1 Tel.: +44 (0) 1223 765332.2 Tel.: +44 (0) 1223 765320.
048-7333 © 2013 The Authors. Published by Elsevier B.V.
ttp://dx.doi.org/10.1016/j.respol.2013.07.004Open access under CC BY license.
© 2013 The Authors. Published by Elsevier B.V.
The importance of external knowledge has been discussed atlength in the innovation literature,3 but interest in open inno-vation (OI) has been growing very fast especially in the last fewyears (Gassmann, 2006; Dahlander and Gann, 2010; Huizingh,2010). Crucially, however, most of the theoretical developmentsand empirical evidence relate to manufacturing businesses. Thisis surprising given the predominant role of the service sector inadvanced economies. The available evidence shows that servicesare no less innovative than manufacturing firms, but might, in fact,innovate in different ways (Metcalfe and Miles, 2000; Tether, 2003,2005). Some quantitative evidence exists that reveals the impor-tance of external linkages for service firms’ innovative performance(Leiponen, 2005, 2012; Love and Mansury, 2007; Love et al., 2010)while the link between openness and the adoption of a servicebusiness model in manufacturing firms is also coming to the fore(Chesbrough, 2011). Despite these significant contributions, how-ever, studies that analyse OI in services are still scarce. Open service
Open access under CC BY license.
innovation is a relatively unexplored area of research where noveltheoretical and empirical investigations can shed new light on thestrategic search behaviours of firms.
3 This is arguably one of the most important messages to emerge from the rel-atively long tradition of research on innovation systems (Lundvall, 1992; Nelson,1993; Freeman, 1995; Malerba, 2004).

8 h Poli
tiadaswsg
bscsadptiacCcsStBesravbtas
sibfiicIrab
ststpeatoavi
2011) will display innovation behaviours similar to those of high-technology manufacturing firms (Hollenstein, 2003; Rodriguezand Ballesta, 2010).8 Yet, some uncertainties persist. There are,
54 A. Mina et al. / Researc
In this paper, firstly we focus on business services, a segment ofhe service sector characterised by high growth, productivity andnnovation rates (Rubalcaba and Kox, 2007). Business services are
diverse group of businesses which include IT support services,esign, architecture and engineering consultancies, R&D services,dvertising, marketing and other traditional professional servicesuch as legal services and management consultancy. Amongst theme find prominent examples of business models structured to
earch broadly for external knowledge and to leverage internallyenerated knowledge.
IDEO is a well-known case of a company whose knowledge-rokering activities are key to its business model and a fundamentalource of competitive advantage. Born as a product developmentompany, IDEO now offers a much broader range of consultingervices for applications as diverse as health and medical devicesnd services, energy, food and beverage, education, mobile andigital technologies, and innovation in the public sector. The com-any thrives on knowledge exchanges with clients, suppliers andhe science base in the search for innovative solutions.4 Activentermediation between users and developers of new knowledgelso characterises the operation, for example, of the technologyonsultancies that have greatly contributed to the growth of theambridge (UK) cluster, arguably the most successful technologyluster in Europe. Service companies such as Cambridge Con-ultants, the Technology Partnership (TTP), PA Technology andagentia engage in intense, and typically highly focused, interac-ions with their local and international clients and research base.5
ut interactions between services and specialist external knowl-dge sources are found at the cutting edge in many differentubsectors, including more traditional businesses such as restau-ants. The Catalan restaurant El Bulli, named for several yearsmongst the world best restaurants and famed as a radical inno-ator in the sector, developed over time as one component of aroader platform of activities which included upstream collabora-ions with the science base as well as downstream interactions,mongst others, with food manufacturers and the hospitalityector.6
Interestingly, a service approach to business is not limited toubsectors of the economy that are classified as services in standardndustry statistics. Services are also economic activities that cane performed by product-based businesses. Several manufacturingrms are significantly expanding the range of services they provide
n combination with their core products as a way to enhance valuereation and customer retention opportunities. Companies such asBM, Xerox, and Rolls Royce now derive growing shares of their totalevenues from service activities, although they are not considereds service businesses, and they often develop their service profiley partnering with external knowledge sources.
In this paper we study the open innovation practices of businesservices and show to what extent and in what way these differ fromhose in manufacturing sectors. Secondly, we take into account theervice offer of manufacturing firms and we explore the implica-ions of adopting a service business model for the open innovationrofiles of manufacturing firms. We analyse a unique dataset gen-rated through an original survey of open innovation practicesmongst UK firms conducted at the UK Innovation Research Cen-re in 2010. We find that business services are more open usersf external knowledge than manufacturers. We show that they
re more intensive users of informal relative to formal open inno-ation practices than manufacturers. In addition, we uncover themportance of scientific knowledge vis-à-vis market knowledge in4 Hargadon and Sutton (1997), Kelley and Littman (2001) and Hargadon (2003).5 Probert et al. (2013), Kirk and Cotton (2012).6 Chesbrough (2011).
cy 43 (2014) 853–866
business services relative to manufacturing firms. When we con-sider the service activities of manufacturing firms we find that ahigher degree of openness, enabling the search and recombinationof more diverse knowledge inputs, is associated with the adoptionof a service inclusive business model. Finally, and consistently withour prior findings, we show that the degree of service integrationis positively associated with engagement in informal knowledge-exchange activities. Overall, the paper contributes to the theoryof open innovation by postulating new aspects of the sectoral andfirm-specific characteristics of external knowledge searches.
2. Exploring open service innovation: theory and evidence
2.1. How does service innovation differ from manufacturing?
Traditional industrial economics and technologist approaches toinnovation used to fundamentally underestimate the role, extentand effects of innovation in services (Metcalfe and Miles, 2000).The service sector is no longer seen as a technologically backward,‘unprogressive’ and passive adopter of technology, but both theorydevelopment and empirical evidence on the dynamics of the serviceeconomy are still lagging behind manufacturing. The introductionof the European Community Innovation Survey (CIS), where indi-vidual service sectors were included in the early 1990s, greatlycontributed to the growth of scholarly work on services partlybecause it enabled the collection of observations on innovation thatwere not limited to R&D or patenting.
A number of stylised facts distinguish service from manufactur-ing innovation.
Quantitative analyses based on CIS data show for example thatoverall R&D plays a less important role in services, even thoughthis does not hold true for all services (Evangelista, 2000; Tether,2003).7 The traditional distinction between product and processinnovations becomes weaker in a service context since servicesoften consist of processes that are hardly separable from the out-comes they produce. In addition, service innovation tends to implygreater emphasis on organisational and human capital factors rel-ative to more tangible assets (Gallouj and Savona, 2009; Sirilli andEvangelista, 1998; Hipp and Grupp, 2005).
Service firms have been found to rely heavily on information andcommunication technologies and non-R&D innovation expendi-tures and seem to use more external knowledge sources thanmanufacturing (Cainelli et al., 2006; Tether and Tajar, 2008; Hipp,2010). They also appear to collaborate more frequently with theircustomers and suppliers (Tether, 2005). There is some evidencethat this practice has positive effects on firm innovation perfor-mance (Leiponen, 2005; Mansury and Love, 2008; Love et al., 2010).One striking feature of the service economy certainly is the vari-ety existing between and within individual service sectors. Thisencompasses a broad range of activities with different characteris-tics (Miles, 2005; Tether, 2002; Rubalcaba and Kox, 2007), althoughsome studies indicate that the degree of similarity between servicesand manufacturing increases with the level of knowledge-intensity,so that knowledge-intensive services (Leiponen, 2005; Love et al.,
for example, conflicting results on the role of specific types of
7 With the exception of the recent paper by Leiponen (2012), who finds that R&Dactivities play a similar role in both service and manufacturing innovation.
8 In a cluster analysis of the innovation activities of Finnish and Danish firms,Leiponen and Drejer (2007) show that the differences between manufacturing andservice firms within clusters are a matter of degree as service firms do not tend tocluster together but alongside manufacturing firms.

h Polic
kdkce
2
ttalptTitoHs
alituvfiocWbdcnarmdi(
cplbmTineafi
sirtet2amw
A. Mina et al. / Researc
nowledge and collaboration partners and the need remains toeepen our understanding of whether the search for externalnowledge may indeed have different drivers and present differentharacteristics across the manufacturing and service sectors of theconomy.
.2. Open innovation in business services
Business services are an extremely important component ofhe service economy (Rubalcaba and Kox, 2007) and are intensiveraders of knowledge inputs (Metcalfe and Miles, 2000; den Hertognd Bilderbeek, 2000; Gallouj, 2002). They tend to add value byeveraging human capital, as opposed to physical capital, and dis-lay rates of innovation not inferior to manufacturing businesses,ypically the highest recorded in the service sector (Tether andajar, 2008). They have been described in the literature as keynnovation intermediaries, or ‘brokers’, that excel at connectingogether innovative ideas developed by different individuals andrganisations (Bessant and Rush, 1995; Hargadon and Sutton, 1997;owells, 2006), and at translating new knowledge generated by the
cience base into commercialisable inputs (Tether and Tajar, 2008).The highly interactive and relational nature of their economic
ctivities suggests that the open innovation model may be particu-arly important for these firms. Firms can choose between engagingn contractual arrangements as a formal framework for coopera-ion, or they can engage in informal exchanges. These include directnstructured interaction with collaborators, participation in inno-ation networks, or sharing of un-codified know-how with otherrms. In these types of activities collaboration tends to be basedn mutual trust and moral obligations rather than legally bindingontracts (Appleyard, 1996; Liebeskind et al., 1996; Van Aken and
eggeman, 2000). We therefore provide evidence on the choiceetween formal and informal governance mechanisms. These mayiffer between businesses services and manufacturing firms. Wean expect, for example, that the intangible nature of services doesot favour highly formalised contractual solutions (Fitzsimmonsnd Fitzsimmons, 2000). Instead, their interactive nature can giveise to relational solutions (Vargo et al., 2008), favouring infor-al over formal arrangements. Business services may also be more
ifficult to control and monitor on delivery, given the intangibil-ty, simultaneity and people-oriented character of many activitiesBrouthers and Brouthers, 2003).
Resource based theory suggests that the choice of partners forollaboration depends on their potential to provide additional com-lementary inputs (Miotti and Sachwald, 2003). On this basis the
iterature has distinguished between science-based and market-ased partners as sources of scientific/technical knowledge andarket knowledge respectively (Danneels, 2002; Du et al., 2012).
he order of preference with which firms might engage in opennnovation activities is relevant also because the search for exter-al knowledge is not costless. Firms make strategic decisions thatxplicitly or implicitly take into account the opportunity costs ofny choice of partners relative to available alternatives. We there-ore examine the important issue of the choice of type of opennnovation partner.
Engaging with market-based partners such as customers anduppliers can help to better specify the market requirement fornnovated goods, services or processes and to spread the costs andisks of the innovation process. Interaction with customers, andhe co-creation of the firm’s output with its customers, has beenmphasised as the most important channel of information suppor-ing the adoption of an open service innovation model (Chesbrough,
011), while prior literature has highlighted the benefits of inter-ction with lead users (von Hippel, 1976; Hagedoorn, 1993). Firmsight, instead or in addition, engage in collaborative arrangementsith universities and research institutions in order to gain accessy 43 (2014) 853–866 855
to basic knowledge, either to better exploit their existing capa-bilities across a wide range of functional management domains,including HR, finance and marketing (Hughes and Kitson, 2012),or to explore new avenues for innovation and growth (Bercovitzand Feldman, 2007; Veugelers and Cassiman, 2005). Furthermore,growing interactions with the public research base are compati-ble with the expectations that are placed in the management andpolicy literatures on the economic potential of ‘the entrepreneurialuniversity’ (Etzkowitz, 2002; Audretsch and Phillips, 2007) andmight have become easier over time through the implementationof policies aimed at facilitating access and simplifying negotiationprocesses (Perkmann and Walsh, 2007).
Engaging with market-based partners can be especially usefulfor services by virtue of their intangible nature, their process-basedbusiness model and the often theorised co-production of their out-put with customers (Brouthers and Brouthers, 2003; Chesbrough,2011; Miles, 2005). On the other hand, universities and publicresearch institutes may be more suitable partners for manufactur-ing firms rather than services because they can extract the mostvalue from their R&D activities whilst services will typically relymore on investments in human capital. Previous research based onCIS data has indeed found that providers of scientific knowledgeare on average less important as a source of information for serviceinnovators than for manufacturing innovators (Arundel et al., 2007;Tether, 2005).
2.3. Open service innovation in manufacturing firms
Firms are typically classified as being either in services or inmanufacturing, but evidence is growing that service provision isbecoming an increasingly important dimension of the offer of man-ufacturing firms, who are expanding the service component of theiroutput (Chesbrough, 2011). Seen in this light, services are no longerthe remit of specialist service providers, but become instead char-acteristics of a broader business model adopted by manufacturingfirms to capture additional value or retain their customer base.It has been reported that the share of service sales is as high as31% for an average manufacturing firm (Fang et al., 2008) while arecent survey of UK businesses has found that 80% of manufacturingfirms are offering some type of services (Tether and Bascavusoglu-Moreau, 2011).
The growing literature on business model innovation (seefor example Teece, 2010; Chesbrough, 2010; Gambardella andMcGahan, 2010; Zott et al., 2011) emphasises the need to inves-tigate how firms develop, deliver and appropriate value and howfirms can change the architecture of their businesses to adapt tonew environments, and sustain competitive advantages or gener-ate extra profits. Teece (2010) argues that changes in the firm’sorganisational and financial design aimed to improve the capabilityof firms to turn customer needs into profits are at least as importantas technological innovation. The integration of a service componentinto the firms’ range of activities can be a powerful mechanism ofvalue creation (Wise and Baumgartner, 1999): advocates of ‘servi-tisation’ strategies argue that services enable manufacturers toget closer to their customers, enhancing understanding of users’needs, strengthening relationships and increasing customer loy-alty (Vandermerwe and Rada, 1988). The offer of complex bundlesof products, processes and services, however, poses specific chal-lenges to the organisation of the knowledge base of the firms. It islikely to demand the recombination of different resources (Kogutand Zander, 1992) including knowledge inputs, coming from dif-ferent sources and this can push firms to intensify the search for
external knowledge that may be necessary to sustain an integratedbusiness model (Chesbrough, 2011). It is therefore important toexplore whether the adoption of a service business model by man-ufacturing firms is associated with a higher degree of openness.
8 h Poli
3
3
IstpBcstptwcfryfc2
uSLtfqitwbiptta
8oaawuais
kt
o
acwdtcomsac
56 A. Mina et al. / Researc
. Data and methods
.1. The survey
The data we use in this paper are drawn from the UK∼IRC Opennnovation Survey, specifically designed and launched in 2010 totudy the open innovation practices of UK companies. The researcheam used systematic random sampling measures to draw a sam-le of 12,000 firms, with between 5 and 999 employees, fromureau van Dijk’s FAME Database, which contains detailed finan-ial company-level information on UK and Irish businesses. Theampling proportions in terms of sector were 65% for manufac-uring and 35% for services, plus two additional samples from theharmaceuticals and clean energy sectors. After carrying out pilotests in different size groups and sectors, 5 waves of questionnairesere sent out by post between June and November.9 1202 firms
ompleted the survey, leading to a 10% response rate. To checkor non-response bias, FAME Data were used again to compareespondents with non-respondents in terms of size, turnover, andear of firm formation. No significant difference was found exceptor low-tech business services, where respondents had a signifi-antly smaller turnover than non-respondents (Cosh and Zhang,011).
In the European Community Innovation Survey (CIS), widelysed in the majority of prior quantitative studies (Laursen andalter, 2006; Leiponen and Helfat, 2010; Leiponen and Drejer, 2007;eiponen, 2012; Tether, 2002, among others), firms are asked abouthe importance of different sources of information/cooperationor their innovation related activities. While also including theseuestions, the survey we use collected information on firms’ open
nnovation practices. Data on such activities are not obtained inhe CIS datasets. The term ‘open innovation’ was not used any-here in the survey in order to avoid potential respondent bias,
ut firms were specifically asked about the different types ofnformal and formal activities they had engaged in with externalarties to accelerate innovation. Therefore, while comparable tohe previous empirical literature, this paper uses a richer dataseto directly explore the firms’ open innovation activities and theirntecedents.
The sample size we use in this study varies between 788 and19 across estimations, due to missing values. Exclusion becausef missing values resulted in our final sample having a slight over-ll bias towards more open firms, with higher R&D expendituresnd human capital. However, and crucially for our purposes, thereere no differences in this respect between our services and man-facturing subsamples and no other differences between our initialnd final samples. The latter shows a reasonable spread acrossndustries with shares of manufacturing 67% (vs. 63% in the originalample) and services 33% (vs. 37% in the original sample).10
Table 1 displays the industry distribution of our sample. Ineeping with prior studies we also report as descriptive statis-ics measures of the breadth and depth of open innovation across
9 For waves 1–3, the original 12-pages long questionnaire was sent out; then inrder to increase the response rate, shorter versions were used in subsequent waves.10 We further explore the risk of response bias in our data by performing a wavenalysis of responses. Those requiring more prompts may be hypothesised to beloser in characteristics to non-respondents than early respondents. Since our dataere collected in five waves it is possible for us to test whether there are systematicifferences in our variables across waves and whether these are associated with theiming of response. One-way ANOVA analyses and post hoc tests with Bonferroniorrection revealed no significant differences between survey waves in any of ourpen innovation variables. In line with the sample attrition tests already reported,ultinomial logistic regressions of dependent and independent variables against the
urvey wave only revealed a significant difference in human capital for waves fournd five (but with discordant signs), and R&D expenditure for wave one. These testsonfirm that non-respondent bias is not a major cause for concern in our analyses.
cy 43 (2014) 853–866
sectors.11 OI breadth is defined as the number of open innovationactivities firms engage in. OI depth is defined as the extent to whichfirms make intensive use of the different activities. Overall, we findthat firms engage in four open innovation activities on average.R&D services (n = 50) exhibit a higher level of openness, as wellas scoring OI activities as highly important, followed by chemicalsand chemical products (n = 84), indicating that firms in knowledgeintensive services and medium-high technology manufacturing aremore engaged in open innovation activities.12 Although there issome variation within the business service sector, manufacturingfirms are more heterogeneous in terms of the breadth and depth ofopenness. Given this heterogeneity, in what follows, we distinguishthe high-tech manufacturing sub-sample within the whole sampleof manufacturing businesses.
3.2. Variables and descriptive statistics
3.2.1. Dependent variableThe dependent variable in our study is the extent of firms’ OI
activities. In the survey, firms were asked to indicate the degree ofimportance of various activities conducted with external parties inorder to accelerate innovation. Our measures of open innovationare therefore based on qualitatively different and wider informa-tion than previous empirical studies of CIS survey data. The latterare based on observations of the importance of different part-ners (customers, suppliers, universities, etc.) as sources of externalknowledge. We, instead, are able to observe the number, partnersand type of open innovation activities performed by firms. The fulllist of 15 activities is reported in Appendix A (Table A1). Thesetake into account both formal (contractual) and informal (non-contractual) activities. The importance of each activity is evaluatedby means of a Likert Scale (0 = not used, to 3 = highly important). Inthe first instance we measure the scope of open innovation activi-ties by adding up the normalised scores for all activities and dividethem by the total number of activities.13 Firms that did not engagein any activity get a score of 0. Firms with higher scores are consid-ered to be more open. Hypothetically a score of 1 is given to firmsthat have engaged in all types of activities and that have scoredthose activities as highly important, although no such firm existsin our sample.
The resulting open innovation variable has a high degree ofinternal consistency with a Cronbach’s alpha of 0.84. In order toidentify the firms’ preferences for formal or informal activities wethen construct two separate measures for informal (Cronbach’salpha = 0.68) and formal practices (Cronbach’s alpha = 0.80). Table 2presents the use of OI activities for the whole sample, as well asbusiness services, manufacturing, and high-tech manufacturingsub-samples.14 The most widely used open innovation activity inour sample (both in the original and the final sample) is engagingdirectly with lead users. 61% of the firms in our final samplereported to have engaged directly with lead users in the last
three years, and 24% scored this engagement as highly important.This is followed by joint R&D activities (34% of the final sample),sharing facilities (30%) and joint marketing/co-branding and11 The concepts of breadth and depth have been widely used in the previous lit-erature with regard to firms’ search activities (Laursen and Salter, 2006; Leiponenand Helfat, 2010, amongst others).
12 As we prove in our econometric analyses and related robustness checks, theinclusion of these R&D services is not a source of bias for the results.
13 To normalise the scores of each item we divide each score by 3 (maximumpossible value) to bring the scores within a 0–1 range.
14 The classification of sectors is based on the most detailed information level avail-able in the dataset and reflects the FAME standard classification of firms. High-Techmanufacturing includes classes: 33.3, 32.1, 32.3, 33.1, 24.41, 33.2, 32.2, 30.02, 33.4,35.3, 30.01, 24.42.

A. Mina et al. / Research Policy 43 (2014) 853–866 857
Table 1Sectoral distribution of the sample.
NACE Industry N Share (%) OI breadth OI depth
21–22 Mnf. of pulp, paper, printing and publishing 3 0.38 3.75 1.0024 Mnf. of chemicals, chemical products and man-made fibres 84 10.66 4.88 0.9725 Mnf. of rubber and plastic products 4 0.51 5.25 0.2526 Mnf. of other non-metallic mineral products 19 2.41 3.37 0.3727 Mnf. of basic metals 28 3.55 3.11 0.3228 Mnf. of fabricated metal products, except machinery and equipment 93 11.8 2.97 0.4229 Mnf. of machinery and equipment n.e.c. 58 7.36 3.02 0.4730 Mnf. of office machinery and computers 17 2.16 3.94 1.1231 Mnf. of electrical machinery and app. n.e.c. 81 10.28 3.79 0.7232 Mnf. of radio, television and communication equip. and app. 26 3.3 4.50 0.6233 Mnf. of medical, precision and optical inst., watches and clocks 69 8.76 4.34 0.7734 Mnf. of motor vehicules, trailers and semi-trailers 18 2.28 3.33 0.3935 Mnf. of other transport equipment 21 2.66 3.76 0.2936 Mnf. of furniture, manufacturing n.e.c. 3 0.38 2.33 0.0037 Recycling 4 0.51 3.25 1.0064 Post and communication 26 3.3 4.50 0.9272 Computer and related activities 71 9.01 4.48 0.7973 R&D 50 6.35 6.71 1.7674 Other business activities 113 14.34 3.58 0.89
Total 788 100 3.91 0.73
Table 2Open innovation practices by sector groups.
Use of OI activities (0/1) Whole sample B. Services Manufacturing High-tech manuf
Mean sd Count Mean sd Mean sd Mean sd
Engaging directly with lead users and early adopters 0.61 0.49 788 0.7 0.46 0.57 0.5 0.68 0.47Participating in open source software development 0.22 0.42 788 0.29 0.45 0.19 0.39 0.2 0.4Exchanging ideas through submission websites and idea “jams”, idea competitions 0.16 0.36 788 0.23 0.42 0.12 0.32 0.16 0.36Participating in or setting up innovation networks/hubs with other firms 0.24 0.43 788 0.33 0.47 0.2 0.4 0.22 0.42Sharing facilities with other organisations, inventors, researchers, etc. 0.30 0.46 788 0.32 0.47 0.30 0.46 0.37 0.48Joint R&D 0.34 0.47 788 0.30 0.46 0.36 0.48 0.37 0.49Joint purchasing of materials or inputs 0.17 0.38 788 0.13 0.34 0.19 0.39 0.14 0.34Joint production of goods or services 0.24 0.43 788 0.22 0.41 0.25 0.43 0.21 0.41Joint marketing/co-branding 0.29 0.45 788 0.37 0.48 0.26 0.44 0.25 0.43Participating in research consortia 0.22 0.42 788 0.28 0.45 0.20 0.4 0.27 0.45Joint university research 0.25 0.44 788 0.25 0.43 0.26 0.44 0.32 0.47Licensing in externally developed technologies 0.23 0.42 788 0.29 0.46 0.2 0.4 0.27 0.45
000
ouo
matpwnthtmrm
re
t
n
Outsourcing or contracting out R&D projects
Providing contract research to others
Joint ventures, acquisitions and incubations
utsourcing/contracting out R&D (29% of the sample). The leastsed open innovation practice is informally exchanging ideas, withnly 16% of the firms in our final sample reporting it.
When we look at the differences between business services andanufacturing, descriptive statistics reveal that business services
re more engaged in non-contractual open innovation activitieshan manufacturing firms.15 However, these differences disap-ear when we restrict our sample to high-tech manufacturing,ith the exception of participating in or setting up innovationetworks with other firms. Regarding contractual open innova-ion activities, we see that business services are more similar toigh-tech manufacturers in their formal search activities, than tohe whole manufacturing sample. High-tech manufacturing firms
ore often participate in joint R&D projects and joint universityesearch, whereas business services firms seem to privilege joint-arketing/co-branding activities.16
We also look at the characteristics of firms depending on theelative importance of formal and informal OI activities they arengaged in. For descriptive purposes, we classify firms in four
15 t-Test results (not reported but available from the authors upon request) showshat these differences are statistically significant at a 95 percent level.16 Based on t-tests (not reported, but available from the authors upon request)one of these differences between the two subsamples are statistically significant.
.29 0.45 788 0.3 0.46 0.29 0.45 0.44 0.50
.18 0.38 788 0.21 0.41 0.16 0.37 0.22 0.42
.27 0.44 788 0.31 0.46 0.24 0.43 0.27 0.44
groups (Table 3): low informal/low formal activities (48.1% offirms), low informal/high formal activities (8%), high informal/lowformal activities (10.8%), and high informal/high formal activi-ties (12.3%). 170 firms in our sample do not engage in any openinnovation activities. Although statistically different, the averagefirm size is rather similar amongst the different categories. Theaverage firm age is around 21–23 years in all categories exceptthe low formal/high informal group, where the average firm ageis around 18 years, and this difference is not statistically signifi-cant across categories. Younger firms are more likely to engage ininformal OI activities. R&D expenditures and human capital varyconsiderably. As it is reasonable to expect, firms with relativelyhigher R&D expenditures and shares of highly skilled human capi-tal belong to high informal/high formal category, followed by lowinformal/high formal (Table 3).
3.2.2. Independent variablesOur estimations contain indicators for a broad set of firm char-
acteristics, including indicators for the firm being a business servicefirm, the sources of knowledge, and the adoption of a service busi-ness model. Descriptive statistics are presented in Table 4, again for
the whole sample, business services, manufacturing and high-techmanufacturing sub-samples.Regarding the different sources of information, we are particu-larly interested in the importance of market-based partners relative

858 A. Mina et al. / Research Policy 43 (2014) 853–866
Table 3Distribution of firms by their engagement in formal and informal OI.
Firm type Obs. (%) Size Age R&D exp. Human capital
No OI 170 20.76 3.09 22.51 1.03 25.91Low formal and low informal 394 48.11 3.49 22.33 2.74 26.31Low informal and high formal 65 7.94 3.66 21.81 4.39 38.2Low formal and high informal 89 10.87 3.48 18.12 3.23 32.97High informal and high formal 101 12.33 3.97 23.52 4.67 43.09
*The differences between categories are significant at the 99% level, except for the Age variable.
Table 4Descriptive statistics.
Whole sample B. Services Manufacturing High-tech. manuf.
Mean sd Min Max Mean sd Mean sd Mean sd
OI activities 0.16 0.15 0 0.87 0.20 0.17 0.15 0.14 0.18 0.14Informal OI activities 0.18 0.18 0 1 0.23 0.20 0.16 0.16 0.19 0.16Formal OI activities 0.14 0.17 0 0.97 0.16 0.18 0.13 0.16 0.16 0.17Size 3.50 1.39 0 10.24 3.06 1.6 3.71 1.22 3.59 1.22Age 22.13 19.27 1 125 13.93 14.15 26.16 20.17 23.81 16.63Largest market 3.32 0.72 1 4 3.27 0.76 3.35 0.7 3.60 0.56Competition intensity 1.54 0.88 0 4 1.57 0.95 1.53 0.84 1.44 0.81R&D expenditures 2.84 2.82 0 11.62 2.59 2.93 2.97 2.76 3.99 2.76Human capital 29.44 33.47 0 100 55.43 37.03 16.65 22.40 26.89 26.71Effectiveness of IP protection 2.14 0.48 1.59 4 1.92 0.54 2.25 0.4 2.51 0.24Service innovation integration 0.9 1.43 0 5 0.94 1.29 0.88 1.5 0.88 1.5
0
3
3
tnacekaMtTsh
aotoptseoosr1f
tr
htoh2
Share of service in total revenue 33.44 40.86 0 10Market-based knowledge 1.86 0.98 0
Science-based knowledge 0.53 0.71 0
o science-based partners. In order to test their effect on open-ess we use the score of the importance of ‘customers and users’nd the score of the importance of ‘universities, other higher edu-ation and research organizations’, as perceived by the firms. Asxpected, customers and users represent the most widely usednowledge sources, with 91% of our sample confirming them as
source of information, and 31% scoring them as highly important.eanwhile, only 45% of our sample report having used universi-
ies and higher education institutions as a source of information.hese shares are very similar between manufacturing and businesservices sectors, although high-tech manufacturing firms show aigher score for both knowledge sources.
In order to test for the effect on open innovation activities of thedoption of a service business model by manufacturing firms, weperationalise the service integration concept by using two indica-ors: the first measures the share of services in the total revenuef the firm; the second measures the integration of a service com-onent in the firm’s innovation output (the ‘innovation types’ usedo construct this variable are listed in Appendix A, Table A2).17 Theurvey questionnaire asks about the percentage of firms’ total rev-nue accounted for goods, services and others. Overall, the sharef product sales is around 63% and the share of services sales 33%n average. Indeed, we find considerable heterogeneity at the sub-ector level. The share of service revenues accounts for 69% of totalevenues in business services, whereas it accounts respectively for
0% and 15% of the total revenue in low-tech and high-tech manu-acturing firms.1817 Note that these innovation types encompass a broader set of characteristics thathe CIS. This also explains the higher percentage of innovative firms in our sampleelative to the latest available CIS survey results (2011).18 Low-tech manufacturing firms seem to rely more on service revenues thanigh-tech manufacturing firms. This may signal the kind of services offered byhe manufacturing businesses: recent surveys have indicated that the most widelyffered services by manufacturing firms are training, delivery, spare parts, customerelpdesks, and installation (Tether and Bascavusoglu-Moreau, 2011; Baines et al.,009).
69.63 39.02 14.10 25.99 10.92 20.951.87 1 1.85 0.96 1.96 10.58 0.8 0.5 0.67 0.63 0.72
We then take into account the composition of firms’ innovationoutput. The variable we construct ranges from 0 to 5, accordingto the number of different types of innovation launched in thelast three years, conditional on having introduced new or signif-icantly improved service product and/or new method to produceand deliver the service product. 80% of our final sample has beenengaged in some kind of innovative activities, however only 8%report more than 4 types of innovation. Although a slightly highershare of manufacturers report innovation, we do not find any sta-tistical difference between the two sectors, either for the numberof innovations, or for the complexity of innovation.
We include in the estimations an indicator for R&D activities,measured as the logarithm of firms’ internal R&D expenditureand an indicator of human capital, measured by the percentageof employees with a first and/or higher degree. Although businessservices and manufacturing as a whole display very similar levelsof R&D expenditures, high-tech manufacturing firms are more R&Dintensive, as expected. On the other hand, business services havethe most highly trained human capital, as should also be expected.Firm size and age may affect openness; we thus include the log-arithm of number of employees, and firm age and its square termto account for potential non-linearities.19 Overall, manufacturingfirms are larger and older than business services. We also takeinto account a firms’ largest market in terms of its sales revenueand the intensity of competition as perceived by the firm. Firms inboth sectors operate mainly at the national and international level(with respectively 46% and 44% of the firms), and the geographicaldistribution of their largest market does not differ significantlybetween the sectors. The intensity of competition also shows avery similar pattern.
Finally we test for the effectiveness of the IP appropriationregime. The ability to capture external knowledge flows is con-ditioned by knowledge appropriation mechanisms, because firms
19 We also introduced this latter variable as categories of age (not reported), inorder to assess any potential effect of a particular age group on engaging in openinnovation activities. Results did not differ significantly.

A. Mina et al. / Research Policy 43 (2014) 853–866 859
Table 5Total, informal and formal OI activities.
Total OIactivities
Total OIactivities
Informal OIactivities
Formal OIactivities
Informal OIactivities
Formal OIactivities
(1) (2) (3) (4) (5) (6)
Size 0.008* 0.008* 0.007 0.01** 0.006 0.010**
(0.00) (0.00) (0.01) (0.00) (0.01) (0.00)Age −0.001 −0.0004 −0.001 −0.0008 −0.0005 −0.0004
(0.00) (0.00) (0.00) (0.00) (0.00) (0.00)Age squared 0.0000 0.0000 0.0000 0.0000 0.0000 0.0000
(0.00) (0.00) (0.00) (0.00) (0.00) (0.00)Largest market −0.0002 0.002 −0.010 0.009 −0.006 0.01
(0.01) (0.01) (0.01) (0.01) (0.01) (0.01)Competition intensity −0.0009 −0.002 −0.0001 −0.002 −0.002 −0.003
(0.01) (0.01) (0.01) (0.01) (0.01) (0.01)R&D expenditures 0.02*** 0.02*** 0.02*** 0.02*** 0.02*** 0.02***
(0.00) (0.00) (0.00) (0.00) (0.00) (0.00)Human capital 0.0007*** 0.0004* 0.0007*** 0.0007*** 0.0002 0.0005*
(0.00) (0.00) (0.00) (0.00) (0.00) (0.00)Effectiveness of IP protection 0.01 0.03** −0.02 0.05*** 0.0003 0.06***
(0.01) (0.01) (0.01) (0.01) (0.01) (0.01)Bus. service dummy (BSD) 0.05*** 0.06*** 0.04**
(0.01) (0.02) (0.02)Constant 0.04 −0.008 0.2*** −0.08** 0.10** −0.1***
(0.04) (0.04) (0.04) (0.04) (0.04) (0.04)
Number of observation 819 819 819 819 819 819R-squared 0.20 0.21 0.15 0.19 0.16 0.19F 26.66 25.60 18.46 23.06 18.11 21.19Log-likelihood 473.53 480.19 311.25 394.12 318.35 397.13AIC −929.05 −940.39 −604.50 −770.24 −616.69 −774.27
One-tailed tests were conducted for the main variables and two-tailed tests for the other effects. Standard errors (robust to heteroskedasticity) are in parentheses.
mvaaepdmu(ttifisc
3
sbdsdnvwnTA
smb
* p < 0.10.** p < 0.05.
*** p < 0.01.
ay be willing to share knowledge only if they can protect thealue of their investments (Cassiman and Veugelers, 2002; Laursennd Salter, 2012). In addition, the effectiveness of IP protection canlso reflect technological opportunities available to firms whoseffects need to be taken into account in our estimation. The appro-riability regime enters the regression at the sectoral level (SIC 2igit). The survey asked firms about the importance of differentethods to protect their innovations, using a Likert Scale (0 = not
sed, to 3 = highly important). Following Cassiman and Veugelers2006), we measure the effectiveness of IP protection as the indus-ry average of the firm-level scores of importance. On average, firmshat engage in open innovation activities score both formal andnformal methods of protection as more important, compared torms that do not engage in open innovation. As expected, businesservice sectors exhibit a lower score of importance of IP protectionompared to manufacturing sectors.
.3. Modelling and estimation strategy
We conduct our empirical analyses by means of ordinary leastquares (OLS) estimations. In order to evaluate the differenceetween business services and manufacturing sectors, we intro-uce a dummy variable which is equal to 1 if the firm is a businesservice firm and 0 otherwise. By interacting key variables with theummy variable, we are able to assess the specificity of our busi-ess service firms. We tested for multicolinearity by calculating theariance inflation factors (VIFs). The VIF values for all variables areell below the threshold criterion of 10, suggesting that there iso excessive multicolinearity in the data (Kleinbaum et al., 1988).he definition of variables and correlation table are reported inppendix A (Tables A3 and A4).
Because our data are self-reported and collected via a cross-ectional research design through a single questionnaire, commonethod variance may cause systematic measurement error and
ias the estimates. We performed Harman’s one-factor test to verify
the risk of common method effect. The unrotated principal com-ponent factor analysis and the principal component analysis withvarimax rotation revealed the presence of five distinct factors witheigenvalue greater than 1.0, rather than a single factor. The threefactors together accounted for 73 percent of the total variance; thefirst (largest) factor did not account for a majority of the variance(24%). Thus, no general factor is apparent and we conclude that ourresults are not affected by this problem.
4. Results
Table 4 shows the set of OLS models we use to analyse the busi-ness services’ degree of engagement in open innovation, and theirreliance on formal vs. informal activities, relative to manufactur-ing businesses. Table 5 reports results of the analysis of the effectsof market vs. science based knowledge. Table 6 shows the resultsof the analysis of the role of service-integration in manufactur-ing businesses. We adopt a hierarchical estimation strategy. In thefirst table (Table 5), under Model 1we present the baseline estima-tion’s results. The second model introduces the dummy variable‘Business service’. Models 3 and 4 distinguish between informal (3)and formal (4) open innovation activities. Models 5 and 6 intro-duce the business service dummy. Table A5 in Appendix A presentsthe same results for the sample of business services and high-techmanufacturing firms.
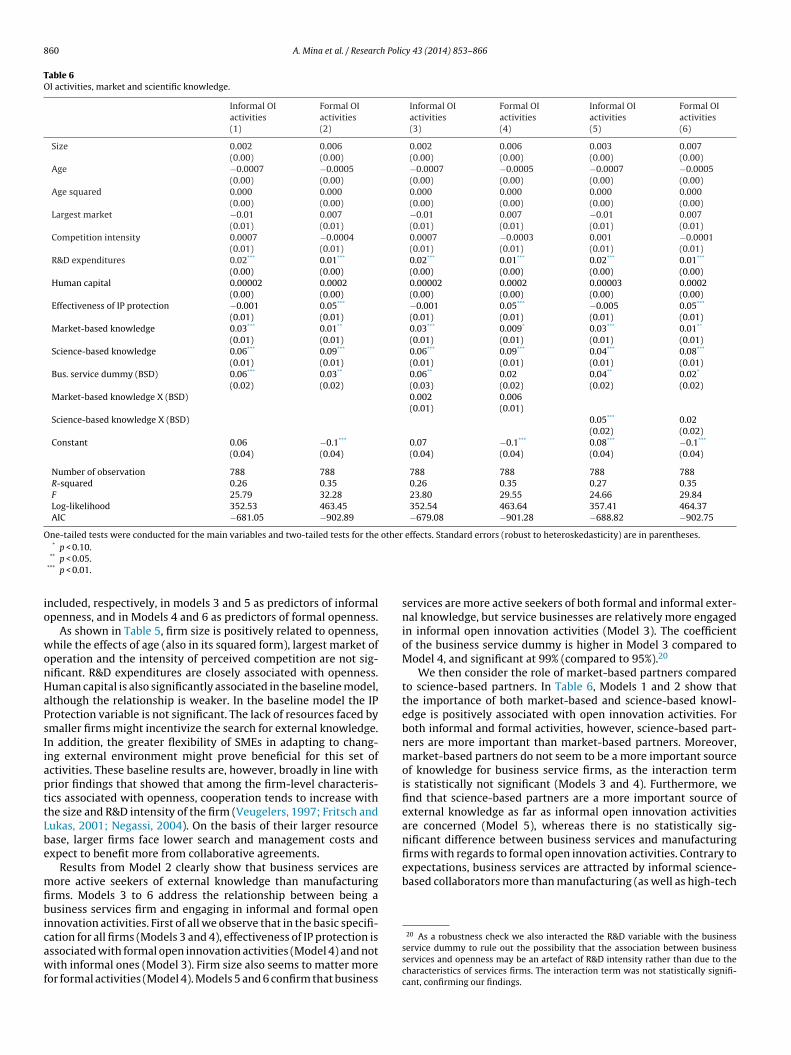
In Table 6, Models 1 and 2 introduce market and science-based sources of knowledge. Interactions between the roles of eachknowledge source with the business sector dummy are includedin Models 3, 4, 5 and 6. In Table A6 in Appendix A we restrictour sample to high-tech manufacturing firms alongside businessservices.
In the first two columns (Models 1 and 2) of Table 7 we presentthe baseline model for the manufacturing sample, respectively forinformal (Model 1) and formal (Model 2) open innovation activi-ties. Service integration in the sales and in the innovative output is
860 A. Mina et al. / Research Policy 43 (2014) 853–866
Table 6OI activities, market and scientific knowledge.
Informal OIactivities
Formal OIactivities
Informal OIactivities
Formal OIactivities
Informal OIactivities
Formal OIactivities
(1) (2) (3) (4) (5) (6)
Size 0.002 0.006 0.002 0.006 0.003 0.007(0.00) (0.00) (0.00) (0.00) (0.00) (0.00)
Age −0.0007 −0.0005 −0.0007 −0.0005 −0.0007 −0.0005(0.00) (0.00) (0.00) (0.00) (0.00) (0.00)
Age squared 0.000 0.000 0.000 0.000 0.000 0.000(0.00) (0.00) (0.00) (0.00) (0.00) (0.00)
Largest market −0.01 0.007 −0.01 0.007 −0.01 0.007(0.01) (0.01) (0.01) (0.01) (0.01) (0.01)
Competition intensity 0.0007 −0.0004 0.0007 −0.0003 0.001 −0.0001(0.01) (0.01) (0.01) (0.01) (0.01) (0.01)
R&D expenditures 0.02*** 0.01*** 0.02*** 0.01*** 0.02*** 0.01***
(0.00) (0.00) (0.00) (0.00) (0.00) (0.00)Human capital 0.00002 0.0002 0.00002 0.0002 0.00003 0.0002
(0.00) (0.00) (0.00) (0.00) (0.00) (0.00)Effectiveness of IP protection −0.001 0.05*** −0.001 0.05*** −0.005 0.05***
(0.01) (0.01) (0.01) (0.01) (0.01) (0.01)Market-based knowledge 0.03*** 0.01** 0.03*** 0.009* 0.03*** 0.01**
(0.01) (0.01) (0.01) (0.01) (0.01) (0.01)Science-based knowledge 0.06*** 0.09*** 0.06*** 0.09*** 0.04*** 0.08***
(0.01) (0.01) (0.01) (0.01) (0.01) (0.01)Bus. service dummy (BSD) 0.06*** 0.03** 0.06** 0.02 0.04** 0.02*
(0.02) (0.02) (0.03) (0.02) (0.02) (0.02)Market-based knowledge X (BSD) 0.002 0.006
(0.01) (0.01)Science-based knowledge X (BSD) 0.05*** 0.02
(0.02) (0.02)Constant 0.06 −0.1*** 0.07 −0.1*** 0.08*** −0.1***
(0.04) (0.04) (0.04) (0.04) (0.04) (0.04)
Number of observation 788 788 788 788 788 788R-squared 0.26 0.35 0.26 0.35 0.27 0.35F 25.79 32.28 23.80 29.55 24.66 29.84Log-likelihood 352.53 463.45 352.54 463.64 357.41 464.37AIC −681.05 −902.89 −679.08 −901.28 −688.82 −902.75
One-tailed tests were conducted for the main variables and two-tailed tests for the other effects. Standard errors (robust to heteroskedasticity) are in parentheses.*
io
wonHaPsIiapttLbe
mfibicawf
firms with regards to formal open innovation activities. Contrary toexpectations, business services are attracted by informal science-based collaborators more than manufacturing (as well as high-tech
p < 0.10.** p < 0.05.
*** p < 0.01.
ncluded, respectively, in models 3 and 5 as predictors of informalpenness, and in Models 4 and 6 as predictors of formal openness.
As shown in Table 5, firm size is positively related to openness,hile the effects of age (also in its squared form), largest market of
peration and the intensity of perceived competition are not sig-ificant. R&D expenditures are closely associated with openness.uman capital is also significantly associated in the baseline model,lthough the relationship is weaker. In the baseline model the IProtection variable is not significant. The lack of resources faced bymaller firms might incentivize the search for external knowledge.n addition, the greater flexibility of SMEs in adapting to chang-ng external environment might prove beneficial for this set ofctivities. These baseline results are, however, broadly in line withrior findings that showed that among the firm-level characteris-ics associated with openness, cooperation tends to increase withhe size and R&D intensity of the firm (Veugelers, 1997; Fritsch andukas, 2001; Negassi, 2004). On the basis of their larger resourcease, larger firms face lower search and management costs andxpect to benefit more from collaborative agreements.
Results from Model 2 clearly show that business services areore active seekers of external knowledge than manufacturing
rms. Models 3 to 6 address the relationship between being ausiness services firm and engaging in informal and formal open
nnovation activities. First of all we observe that in the basic specifi-
ation for all firms (Models 3 and 4), effectiveness of IP protection isssociated with formal open innovation activities (Model 4) and notith informal ones (Model 3). Firm size also seems to matter moreor formal activities (Model 4). Models 5 and 6 confirm that business
services are more active seekers of both formal and informal exter-nal knowledge, but service businesses are relatively more engagedin informal open innovation activities (Model 3). The coefficientof the business service dummy is higher in Model 3 compared toModel 4, and significant at 99% (compared to 95%).20
We then consider the role of market-based partners comparedto science-based partners. In Table 6, Models 1 and 2 show thatthe importance of both market-based and science-based knowl-edge is positively associated with open innovation activities. Forboth informal and formal activities, however, science-based part-ners are more important than market-based partners. Moreover,market-based partners do not seem to be a more important sourceof knowledge for business service firms, as the interaction termis statistically not significant (Models 3 and 4). Furthermore, wefind that science-based partners are a more important source ofexternal knowledge as far as informal open innovation activitiesare concerned (Model 5), whereas there is no statistically sig-nificant difference between business services and manufacturing
20 As a robustness check we also interacted the R&D variable with the businessservice dummy to rule out the possibility that the association between businessservices and openness may be an artefact of R&D intensity rather than due to thecharacteristics of services firms. The interaction term was not statistically signifi-cant, confirming our findings.

A. Mina et al. / Research Policy 43 (2014) 853–866 861
Table 7Determinants of OI activities and service integration.
Informal OIactivities
Formal OIactivities
Informal OIactivities
Formal OIactivities
Informal OIactivities
Formal OIactivities
(1) (2) (3) (4) (5) (6)
Size −0.006 −0.002 −0.006 −0.002 −0.007 −0.003(0.01) (0.01) (0.01) (0.01) (0.01) (0.01)
Age −0.0008 0.00002 −0.0007 0.00009 −0.0007 0.0001(0.00) (0.00) (0.00) (0.00) (0.00) (0.00)
Age squared 0.000 0.000 0.000 0.000 0.000 0.000(0.00) (0.00) (0.00) (0.00) (0.00) (0.00)
Largest market 0.003 0.0004 0.008 0.004 0.01 0.005(0.01) (0.01) (0.01) (0.01) (0.01) (0.01)
Competition intensity 0.009 0.004 0.008 0.003 0.005 0.002(0.01) (0.01) (0.01) (0.01) (0.01) (0.01)
R&D expenditure 0.02*** 0.01*** 0.02*** 0.01*** 0.02*** 0.01***
(0.00) (0.00) (0.00) (0.00) (0.00) (0.00)Human capital 0.0003 0.0005 0.00009 0.0004 0.0002 0.0004
(0.00) (0.00) (0.00) (0.00) (0.00) (0.00)Effectiveness of IP protection −0.02 0.04** −0.006 0.05*** −0.007 0.05***
(0.02) (0.02) (0.02) (0.02) (0.02) (0.02)Market-based knowledge 0.04*** 0.01** 0.04*** 0.01** 0.04*** 0.01**
(0.01) (0.01) (0.01) (0.01) (0.01) (0.01)Science-based knowledge 0.03*** 0.08*** 0.03*** 0.08*** 0.03** 0.08***
(0.01) (0.01) (0.01) (0.01) (0.01) (0.01)Share of service in total revenue 0.0008*** 0.0005** 0.0007** 0.0004*
(0.00) (0.00) (0.00) (0.00)Service integration 0.01*** 0.008**
(0.01) (0.00)Constant 0.06 −0.07 0.01 −0.1** 0.0007 −0.1**
(0.06) (0.05) (0.06) (0.06) (0.06) (0.06)
Number of observation 409 409 409 409 409 409R-squared 0.26 0.34 0.27 0.35 0.29 0.35F 15.80 19.48 15.07 18.18 14.90 16.90Log-likelihood 225.80 287.30 229.53 289.15 234.36 291.21AIC −429.60 −552.59 −435.06 −554.29 −442.72 −556.42
One-tailed tests were conducted for the main variables and two-tailed tests for the other effects. Standard errors (robust to heteroskedasticity) are in parentheses.* p < 0.10.
msflist
sspgaisivr(mepit
c
whether our findings are unduly affected by the presence and char-
** p < 0.05.*** p < 0.01.
anufacturing)21 firms. Corroborating evidence is emerging thatervices firms can benefit from the diversity of external knowledgeows as much as manufacturing firms (Leiponen, 2012). This may
ndicate that in an advanced service economy firms increasinglyeek basic knowledge as a source of competitive advantage andend to do so informally rather than formally.
With regards to the relationship between open innovation andervice integration amongst manufacturing businesses, we findtrong evidence that the adoption of a service business model isositively related to firm openness. This may relate to the need toather and recombine different knowledge inputs acquired through
broader set of search activities (Table 7: Models 3 and 4). Thenclusion of a service element in the firm’s offer is positively andignificantly associated with openness. But the clearest evidences found for our measure of service integration in the firm’s inno-ative output. In line with our finding on the service businesses’elative preference for informal knowledge exchange mechanismsModels 5 and 6), we also show that adoption of a service business
odel in product-based firms is more closely associated with theirngagement in informal practices compared to formal ones. Thisrovides further evidence of the strong link existing between the
ntegration of service activities in manufacturing businesses andhe characteristics of open service innovation.
21 Table A6 in Appendix A shows that these results hold when we restrict theomparison to business services and high-tech manufacturing firms.
4.1. Robustness checks
We performed several robustness checks.22 Firstly, we testedthe robustness of our results to the choice of the econometric spec-ification. As our dependent variable has values ranging between 0and 1, we can treat it as a double censored dependent variable andrun estimations using Tobit (Greene, 2000), or we can treat it as aproportional dependent variable and use a fractional logit model(Papke and Wooldridge, 1996). The results of these two estima-tion methods are very similar to the results shown in the paper. Inthe interest of clarity, and given the complexities associated withthe interpretation of interaction terms in non-linear models, wepresent and discuss the OLS model.
The second robustness check focused on the dependent variable.We computed a breadth measure for open innovation, similar inconstruction to the one used in well-known prior studies (Laursenand Salter, 2006; Leiponen and Helfat, 2010; Leiponen, 2012),but different in its components, which are our activities-basedmeasures rather than measures based on knowledge sources. Theresults obtained with this new dependent variable are very similarto our main results. Final robustness checks have been performedby removing the R&D services sector from our sample to test
acteristics of these businesses (e.g. high R&D expenditures). Asexpected since these factors are always systematically controlled
22 These are all available from the authors upon request.

8 h Poli
ffit
5
tIekafn
evtooaspwewto
ttofideaofn2rn
qtFanosiamebe
pstsbeet
62 A. Mina et al. / Researc
or in our prior estimations, there are no major changes in the mainndings.23 Results hold also when we exclude from the sample theop quartile of the distribution of firms by R&D spending.
. Discussion and conclusion
Successful innovation is increasingly dependent on the effec-ive recombination of knowledge inputs across firm boundaries.nter-firm knowledge flows have the potential to improve the firm’sxisting output or production processes, for example, by disclosingnowledge to partners, users or suppliers and incorporating valu-ble feedback (Henkel, 2006); or they can generate direct returnsrom underutilised intangible resources that can be traded on tech-ology markets (Arora et al., 2001; Fosfuri, 2006).
There are, however, important differences across sectors of theconomy in the extent to and the way in which firms use open inno-ation strategies to gain or maintain competitive advantages andhese differences have important implications for the strategic usef external knowledge sources. In this paper we extend our the-retical understanding of the open innovation model to take intoccount macro-sectoral specificities. In particular, we make a sub-tantial contribution to the development of an emergent researchrogramme on open service innovation (Chesbrough, 2011). Firstly,e do so by focusing on business services, where access, use and
xchange of knowledge play a key role in value creation. Secondly,e consider the adoption of a service business model by manufac-
uring firms and look at its association with the degree of opennessf firms.
Existing analyses of innovation survey data have revealed thathere is considerable variation in the way in which different sec-ors innovate. Typically, studies based on the CIS work with thebservation of how many and what types of collaborators/sourcesrms use. However, they cannot address the questions which ourata can of what open innovation activities they engage in, to whatxtent and in what way. As to the empirical evidence that is avail-ble on the open innovation paradigm, the number of case studiesn the topic has been growing considerably, but these typicallyocus on manufacturing firms, with an emphasis on large compa-ies in high-tech sectors. Only recent contributions (Love et al.,010, 2011; Chesbrough, 2011) constitute rare exceptions that helpedirect the necessary attention to services, a fundamental compo-ent of advanced economies by both value added and employment.
From a methodological viewpoint, this study provides noveluantitative evidence which is an essential complement tohe emergent case study work on open service innovation.urthermore, our evidence is comparative and we are able to lookt the same time at the characteristics of manufacturing and busi-ess service sectors, and then also focus on the product vs. serviceutput of firms. The study has, of course, limitations. It is an inten-ive study of services – business services – characterised by highnnovation rates. This choice is appropriate because these firms arerguably the most active open service innovators. This does notean that traditional services cannot and should not derive consid-
rable advantages from the adoption of open innovation solutions,ut these are very unlikely to be the same solutions adopted, forxample, by R&D-intensive firms. Secondly, the study is based
23 The R&D service sector plays an important role in open innovation, and mayresent analytical challenges in a comparative setting. The exclusion of our R&Dervice firms (n = 50) from our sample does not, however, fundamentally changehe story. The only notable difference is a lack of association between the businesservice dummy and formal OI practices and a significant effect in the interactionetween market-based knowledge and the business service dummy, as we wouldxpect. Importantly, business services remain more active open innovators, morengaged in non-contractual practices, and with a preference for informal collabora-ions with the university baserelative to manufacturing firms.
cy 43 (2014) 853–866
on cross-sectional data, an aspect which cautions against makingstrong claims on causality without the assistance of panel data. Butdespite these limitations, this study provides a unique opportunityto observe the conduct of open innovation activities in a fairly largesample of businesses. It includes novel and original evidence on animportant characteristic of advanced economies: their service pro-file. Finally, its results are robust to different specifications of bothour dependent variable and estimation technique.
Among the firm-level characteristics associated with openness,our results confirm that cooperation tends to increase with R&Dintensity (Fritsch and Lukas, 2001; Negassi, 2004; Veugelers, 1997).Human capital intensity is also positively associated with openness,as expected by both innovation theory and resource-based perspec-tives. Effectiveness of IP protection is positively associated withformal, but not informal, open innovation practices. The relationalnature of services is reflected in their higher degree of openness rel-ative to manufacturing firms, with a preference for informal overformal practices relative to manufacturers. The literature on ser-vices often emphasises interactions, or co-creation of output, withcustomers (Bettencourt et al., 2002; Vargo et al., 2008). Interest-ingly, however, we find that although customers remain a veryimportant source of knowledge, as far as innovation is concernedand on a comparative basis, business services seem to be sensitiveto potentially higher marginal benefits generated from engagingwith universities and the public research base. Compared to priorempirical studies, our results might indicate a development overtime in the patterns of collaboration of UK firms. On the one hand,this may be facilitated by the growing institutional expectationthat universities improve the impact of their research by inten-sifying their collaboration with industry. On the other hand, thismay reflect the dynamism of a sector that is among the most pro-ductive and internationally competitive of the whole UK economy.Or to look at this from a different angle, the importance of inter-actions with customers may still be under-emphasised in analysesof manufacturing sectors where market knowledge could be moreimportant because manufacturing innovation may be, on average,more expensive and errors more costly.24 In any event our findingssuggest that further theoretical work on the purpose and natureof activities with different partners is a potentially fruitful area forresearch. So too is the nature of the link between open innovationactivities and the choice between informal and formal modes ofmediating such activities. They also suggest that new theorising isrequired on the form and nature of the knowledge exchanges firmsmay undertake with the science base, with possible extensions ofconceptual models that are not limited to purely technological andscientific knowledge (Hughes and Kitson, 2012).
When we consider services as economic activities instead ofgroups of firms identified by standard industry classifications, thedata are consistent with the view that manufacturing firms arealso part of the service economy. In line with Chesbrough (2011)we find that in manufacturing businesses open innovation prac-tices are associated with the adoption of a service business model,as indicated by service sales revenues and the integration of aservice component in the firm’s innovation output. The more com-plex the innovation, and the broader the knowledge input that isrequired, the more likely that firms will seek external knowledge(Bayona et al., 2001; Piga and Vivarelli, 2004; Tether, 2002). Thesefindings are also compatible with the view that service innova-tion tends to be recombinative or ‘architectural’ rather than purely
technological in nature (De Vries, 2006). In addition, and consis-tently with our prior finding, the association of service integrationamongst manufacturing businesses is stronger with the degree of24 We thank an anonymous referee for this observation.

h Polic
ea
nwaautpii
A
oN2At2aTfRTB
TD
TC
A. Mina et al. / Researc
ngagement in informal activities than with engagement in formalctivities.
Of course, an important question remains as to whether open-ess translates into superior market performance and whether,here and under what circumstances in the service economy. This
nalysis is outside the scope of this contribution. It is of course primary avenue for further research, but one that cannot bendertaken without an in-depth understanding of the ex ante dis-ribution of open innovation behaviours across firms. Our findingsrovide solid foundations for further reconceptualisations of open
nnovation in service businesses and for new analyses of the chang-ng boundaries of the firm in the service economy.
cknowledgments
The authors would like to thank their CBR colleagues, therganisers, discussants and participants of the ‘Open Innovation:ew insights and evidence’ Conference, Imperial College London,5–26 June 2012, Guest Editor Henry Chesbrough, Editor Ashishrora and two anonymous referees. The paper also benefited from
he feedback received from participants and discussants at the012 AoM Annual Meeting and 2012 DRUID Summer Conferencend the Open Innovation workshop at Queens College Cambridge.he authors gratefully acknowledge funding from the Departmentor Business Innovation and Skills (BIS), the Economic and Social
esearch Council (ESRC), the National Endowment for Science,echnology and the Arts (NESTA) and the Technology Strategyoard, through the UK Innovation Research Centre.able A3escription of variables.
Size Logarithm oAge Firm ageLargest market Largest mar
internationaCompetition intensity Number of sR&D expenditures Log of internHuman capital Proportion oEffectiveness of IP protection Means of sc
digit industMarket-based knowledge Importance
firmScience-based knowledge Importance
research orgService integration in innovation Number of d
having intromethods to
Service integration in output Share of tot
able A4orrelation table.
1 2 3 4
1 OI activity2 Size 0.153 Age −0.03 0.264 Largest market 0.22 0.11 0.025 Competition intensity 0.01 0.14 0.02 −0.056 R&D expenditures 0.44 0.37 0.11 0.41
7 Human capital 0.24 −0.33 −0.25 0.20
8 IP protection 0.16 0.06 0.17 0.25
9 Market-based knowledge 0.29 0.15 0.04 0.11
10 Science-based knowledge 0.49 0.07 0.00 0.17
11 Service integration in innovation 0.19 0.15 −0.02 −0.03
12 Service integration in output 0.09 −0.22 −0.26 −0.16
13 Bus. service dummy 0.16 −0.24 −0.30 −0.05
y 43 (2014) 853–866 863
Appendix A.
See Tables A1–A6.
Table A1Open innovation practices as listed in the OI survey.
Informal (non-contractual) activities:Engaging directly with lead users and early adoptersParticipating in open source software developmentExchanging ideas through submission websites and idea “jams”, ideacompetitionsParticipating in or setting up innovation networks/hubs with other firmsSharing facilities with other organisations, inventors, researchers, etc.
Formal (contractual) activities:Joint R&DJoint purchasing of materials or inputsJoint production of goods or servicesJoint marketing/co-brandingParticipating in research consortiaJoint university researchLicensing in externally developed technologiesOutsourcing or contracting out R&D projectsProviding contract research to othersJoint ventures, acquisitions and incubations
Table A2Innovation types as listed in the OI survey.
Technologically new or significantly improved manufactured product
Technologically new or significantly improved methods of producingmanufactured productTechnological improvements in supply, storage or distribution systems for
manufactured productNew or significantly improved service productNew method to produce and deliver your service product
f number of employees
ket in terms of revenue: 1 – local; 2 – regional; 3 – national; 4 –lerious competitors as perceived by the firmal R&D expenditures (+1)f the firm’s employees that were educated to degree level or above
ores of importance of patent protection’ use among the firms in 2ry
of customers and users as source of knowledge as scored by the
of universities, higher education institutes and public sectoranisations as source of knowledge as scored by the firmifferent types of innovation introduced by the firm, conditional onduced a new or significantly improved service product and/or newproduce and/or deliver the serviceal revenue accounted for the services
5 6 7 8 9 10 11 12
−0.08−0.05 0.12−0.02 0.29 0.00
0.04 0.20 0.00 0.02−0.02 0.30 0.19 0.16 0.17
0.12 0.08 −0.04 0.01 0.07 0.040.07 −0.17 0.44 −0.31 −0.03 0.03 0.020.01 −0.07 0.57 −0.32 −0.01 0.07 0.00 0.65

864 A. Mina et al. / Research Policy 43 (2014) 853–866
Table A5Determinants of OI activities – high-tech manufacturing sample.
Total OI activities Total OI activities Informal OI activities Formal OI activities Informal OI activities Formal OI activities(1) (2) (3) (4) (5) (6)
Size 0.02** 0.01** 0.02** 0.01** 0.01** 0.01**
(0.01) (0.01) (0.01) (0.01) (0.01) (0.01)Age −0.001 −0.0003 −0.001 −0.001 −0.0002 −0.0003
(0.00) (0.00) (0.00) (0.00) (0.00) (0.00)Age squared 0.000 0.000 0.000 0.000 0.000 0.000
(0.00) (0.00) (0.00) (0.00) (0.00) (0.00)Largest market 0.004 0.010 −0.006 0.01 −0.001 0.02***
(0.01) (0.01) (0.01) (0.01) (0.01) (0.01)Competition intensity −0.006 −0.008 −0.006 −0.005 −0.008 −0.007
(0.01) (0.01) (0.01) (0.01) (0.01) (0.01)R&D expenditures 0.02*** 0.02*** 0.02*** 0.01*** 0.02*** 0.01***
(0.00) (0.00) (0.00) (0.00) (0.00) (0.00)Human capital 0.0006*** 0.0004 0.0005*** 0.0007*** 0.0003 0.0004
(0.00) (0.00) (0.00) (0.00) (0.00) (0.00)Effectiveness of IP protection 0.02 0.04** −0.02 0.05*** 0.005 0.08***
(0.02) (0.02) (0.02) (0.02) (0.02) (0.02)Bus. service dummy (BSD) 0.06*** 0.06*** 0.07***
(0.02) (0.02) (0.02)Constant 0.03 −0.08 0.2*** −0.1* 0.06 −0.2***
(0.05) (0.06) (0.06) (0.05) (0.07) (0.07)
Number of observation 419 419 419 419 419 419R-squared 0.16 0.18 0.12 0.17 0.13 0.18F 10.79 11.24 7.03 10.28 6.87 10.30Log-likelihood 211.89 216.65 129.82 173.03 132.67 177.43AIC −405.79 −413.30 −241.64 −328.06 −245.34 −334.85
One-tailed tests were conducted for the main variables and two-tailed tests for the other effects. Standard errors (robust to heteroskedasticity) are in parentheses.* p < 0.10.
** p < 0.05.*** p < 0.01.
Table A6OI activities, market and scientific knowledge – high-tech manufacturing sample.
Informal OI activities Formal OI activities Informal OI activities Formal OI activities Informal OI activities Formal OI activities(1) (2) (3) (4) (5) (6)
Size 0.01 0.01** 0.01 0.01*** 0.01*** 0.01**
(0.01) (0.01) (0.01) (0.01) (0.01) (0.01)Age −0.0006 −0.0005 −0.0006 −0.0005 −0.0006 −0.0005
(0.00) (0.00) (0.00) (0.00) (0.00) (0.00)Age squared 0.000 0.000 0.000 0.000 0.000 0.000
(0.00) (0.00) (0.00) (0.00) (0.00) (0.00)Largest market −0.008 0.01 −0.008 0.01 −0.008 0.01
(0.01) (0.01) (0.01) (0.01) (0.01) (0.01)Competition intensity −0.002 −0.002 −0.002 −0.002 0.0001 −0.001
(0.01) (0.01) (0.01) (0.01) (0.01) (0.01)R&D expenditures 0.02*** 0.010*** 0.02*** 0.010*** 0.02*** 0.010***
(0.00) (0.00) (0.00) (0.00) (0.00) (0.00)Human capital 0.0000 0.0002 0.0000 0.0002 0.0000 0.0002
(0.00) (0.00) (0.00) (0.00) (0.00) (0.00)Effectiveness of IP protection −0.002 0.06*** −0.002 0.06*** −0.008 0.06***
(0.02) (0.02) (0.02) (0.02) (0.02) (0.02)Market-based knowledge 0.03*** 0.02*** 0.03*** 0.03*** 0.03*** 0.02***
(0.01) (0.01) (0.01) (0.01) (0.01) (0.01)Science-based knowledge 0.07*** 0.09*** 0.07*** 0.09*** 0.03 0.07***
(0.01) (0.01) (0.01) (0.01) (0.02) (0.02)Bus. service dummy (BSD) 0.06*** 0.07*** 0.07** 0.09*** 0.02 0.05**
(0.02) (0.02) (0.03) (0.03) (0.03) (0.02)Market-based knowledge X (BSD) −0.003 −0.01
(0.02) (0.01)Science-based knowledge X (BSD) 0.06*** 0.03
(0.03) (0.02)Constant 0.03 −0.2*** 0.03 −0.2*** 0.07 −0.2***
(0.07) (0.06) (0.07) (0.07) (0.07) (0.07)
Number of observation 399 399 399 399 399 399R-squared 0.25 0.36 0.25 0.36 0.26 0.36F 13.25 19.25 12.23 17.83 13.07 17.39Log-likelihood 156.52 215.02 156.54 215.40 159.97 216.00AIC −289.04 −406.04 −287.07 −404.80 −293.95 −406.01
One-tailed tests were conducted for the main variables and two-tailed tests for the other effects. Standard errors (robust to heteroskedasticity) are in parentheses.*p < 0.10.
** p < 0.05.*** p < 0.01.

h Polic
R
A
A
A
A
B
B
B
B
B
B
B
C
C
C
C
C
C
C
C
C
D
D
D
d
D
EE
F
F
F
F
F
G
G
A. Mina et al. / Researc
eferences
ppleyard, M.M., 1996. How does knowledge flow? Interfirm patterns in the semi-conductor industry. Strategic Management Journal 17, 137–154.
rora, A., Fosfuri, A., Gambardella, A., 2001. Markets for Technology: The Economicsof Innovation and Corporate Strategy. The MIT Press, Cambridge, MA.
rundel, A., Kanerva, M., Kruysen, A.V., Hollanders, H., 2007. Innovation Statisticsfor the European Service Sector. Research Report. UNU-MERIT, Maastricht.
udretsch, D., Phillips, R.J., 2007. Entrepreneurship, State Economic DevelopmentPolicy, and the Entrepreneurial University. Max Planck Institute of Economics,Papers on Entrepreneurships, Growth and Public Policy no. 1107.
ayona, C., Garcia-Marco, T., Huerta, E., 2001. Firms’ motivation for cooperative R&D:an empirical analysis of Spanish firms. Research Policy (30), 1289–1307.
aines, T.S., Lightfoot, H.W., Benedettini, O., Kay, J.M., 2009. The servitisation of man-ufacturing: a review of literature and reflections on future challenges. Journalof Manufacturing Technology Management 20 (5), 547–567.
ercovitz, L., Feldman, M., 2007. Fishing upstream: firm innovation strategy anduniversity research alliances. Research Policy 36 (7), 930–948.
essant, J., Rush, H., 1995. Building bridges for innovation: the role of consultants intechnology transfer. Research Policy 24 (1), 97–114.
ettencourt, L.A., Ostrom, A.L., Brown, S.W., Roundtree, R.I., 2002. Client co-production in knowledge-intensive business services. California ManagementReview 44 (4), 100–128.
routhers, K.D., Brouthers, L.E., 2003. Why service and manufacturing entry modechoices differ: the influence of transaction cost factors, risk and trust. Journal ofManagement Studies 40 (5), 1179–1204.
rusoni, S., Prencipe, A., Pavitt, K., 2001. Knowledge specialisation, organizationalcoupling and the boundaries of the firm: why firms know more than they make?Administrative Science Quarterly 46 (4), 597–621.
assiman, B., Veugelers, R., 2002. R&D cooperation and spillovers: some empiricalevidence from Belgium. American Economic Review 92 (4), 1169–1184.
assiman, B., Veugelers, R., 2006. in search of complementarity in the innovationstrategy: internal R&D and external knowledge acquisition. Management Sci-ence 52 (1), 68–82.
ainelli, G., Evangelista, R., Savona, M., 2006. Innovation and economic perfor-mance in services: a firm-level analysis. Cambridge Journal of Economics 30,435–458.
hesbrough, H., 2003a. Open Innovation: The New Imperative for Creating and Prof-iting from Technology. Harvard Business School Press, Boston.
hesbrough, H., 2003b. The logic of open innovation: managing intellectual property.California Management Review 45 (3), 33.
hesbrough, H., 2006. Open Business Models: How to Thrive in the New InnovationLandscape. Harvard Business School Press, Boston.
hesbrough, H., 2010. Business model innovation: opportunities and barriers. LongRange Planning 43, 354–363.
hesbrough, H., 2011. Open Service Innovation: Rethinking Your Business to Growand Compete in a New Era. Jossey Bass, San Francisco, CA.
osh, A., Zhang, J.J., 2011. Open Innovation Choices: What is British Enterprise Doing?UK Innovation Research Centre, University of Cambridge, June.
ahlander, L., Gann, D.M., 2010. How open is innovation? Research Policy 39 (6),699–709.
anneels, E., 2002. The dynamics of product innovation and firm competences.Strategic Management Journal 23 (12), 1095–1121.
e Vries, 2006. Innovation in services in networks of organizations and in the dis-tribution of services. Research Policy 35, 1037–1051.
en Hertog, P., Bilderbeek, R., 2000. The new knowledge-infrastructure: the roleof technology-based knowledge-intensive business services in national innova-tion systems. In: Boden, M., Miles, I. (Eds.), Services and the Knowledge-BasedEconomy. Continuum, London and New York, pp. 223–246.
u, J., Leten, B., Vanhaverbeke, W., 2012. Does Open Innovation Improve the Per-formance of R&D Projects? In: Paper Presented at the ‘Open Innovation: NewInsights and Evidence’ UK-IRC Conference, Imperial College London, London,25–26 June.
tzkowitz, H., 2002. MIT and the Rise of Entrepreneurial Science. Routledge, London.vangelista, R., 2000. Sectoral patterns of technological change in services. Eco-
nomics of Innovation and New Technology 9, 183–221.ang, E., Palmatier, R.W., Steenkamp, J.B.E.M., 2008. Effect of service transition strate-
gies on firm value. Journal of Marketing 72, 1–14.itzsimmons, J.A., Fitzsimmons, M.J., 2000. New Service Development – Creating
Memorable Experiences. Sage Publications, Thousand Oaks, CA.osfuri, A., 2006. The licensing dilemma: understanding the determinants of the
rate of technology licensing. Strategic Management Journal 27 (12), 1141–1158.
reeman, C., 1995. The national systems of innovation in historical perspective.Cambridge Journal of Economics 19 (1), 5–24.
ritsch, M., Lukas, R., 2001. Who cooperates on R&D? Research Policy 30 (2),297–312.
allouj, F., 2002. Knowledge-intensive business services: processing knowledge andproducing innovation. In: Gadrey, J., Gallouj, F. (Eds.), Productivity, Innovationand Knowledge in Service: New Economic and Socio-Economic Approaches.Edward Elgar, Cheltenham and Northampton, pp. 256–284.
allouj, F., Savona, M., 2009. Innovation in services: a review of the debate and aresearch agenda. Journal of Evolutionary Economics 19 (2), 149–172.
y 43 (2014) 853–866 865
Gambardella, A., McGahan, A.M., 2010. Business model innovation: general purposetechnologies and their implications for industry structure. Long Range Planning43, 262–271.
Gassmann, O., 2006. Opening up the innovation process: towards an agenda. R&DManagement 36 (3), 223–226.
Greene, W.H., 2000. Econometric Analysis, 4th ed. Prentice-Hall, Upper Saddle River,NJ.
Hagedoorn, J., 1993. Understanding the rationale of strategic technology partnering:inter-organizational modes of cooperation and sectoral differences. StrategicManagement Journal 14, 371–385.
Hargadon, A., Sutton, R.I., 1997. Technology brokering and innovation in a productdevelopment firm. Administrative Science Quarterly 42 (4), 716–749.
Hargadon, A., 2003. How Breakthroughs Happen: The Surprising Truth About HowCompanies Innovate. Harvard Business School Press, Boston.
Henkel, J., 2006. Selective revealing in open innovation processes: the case of embed-ded Linux. Research Policy 35 (7), 953–969.
Hipp, C., Grupp, H., 2005. Innovation in the service sector: the demand for service-specific innovation measurement concepts and typologies. Research Policy 34,517–535.
Hipp, C., 2010. Collaborative innovation in services. In: Gallouj, F., Djellal, F. (Eds.),The Handbook of Innovation and Services: A Multi-Disciplinary Perspective.Edward Elgar, Cheltenham, pp. 318–341.
Hollenstein, H., 2003. Innovation modes in the Swiss service sector: a cluster analysisbased on firm-level data. Research Policy 32 (5), 845–863.
Howells, J., 2006. Intermediation and the role of intermediaries in innovation.Research Policy 35, 715–728.
Hughes, A., Kitson, M., 2012. Pathways to impact and the strategic role of universi-ties: new evidence on the breadth and depth of university knowledge exchangein the UK and the factors constraining its development. Cambridge Journal ofEconomics 36, 723–750.
Huizingh, E.K.R.E., 2010. Open innovation: state of the art and future perspectives.Technovation 31 (1), 2–9.
Kelley, T., Littman, J., 2001. The Art of Innovation: Lessons in Creativity from IDEO,America’s Leading Design Firm. Currency Doubleday, New York.
Kirk, K., Cotton, C., 2012. The Cambridge Phenomenon. Third Millennium Publishing,London.
Kleinbaum, D.G., Kupper, L.L., Muller, K.E., 1988. Applied Regression Analysis andOther Multivariate Method, 2nd ed. PWS-Kent, Boston, MA.
Kogut, B., Zander, U., 1992. Knowledge of the firm, combinative capabilities, and thereplication of technology. Organization Science 3, 383–397.
Langlois, R.N., 2003. The vanishing hand: the changing dynamics of industrial capi-talism. Industrial and Corporate Change 12 (2), 351–385.
Laursen, K., Salter, A., 2006. Open for innovation: the role of openness in explaininginnovation performance among UK manufacturing firms. Strategic ManagementJournal 27, 131–150.
Laursen, K., Salter, A., 2012. The paradox of openness: appropriability and the use ofexternal sources of knowledge for innovation. In: Paper Presented at the ‘OpenInnovation: New Insights and Evidence’ UK-IRC Conference, Imperial CollegeLondon, London, 25–26 June.
Leiponen, A., 2012. The benefits of R&D and breadth in innovation strategies: a com-parison of Finnish service and manufacturing firms. Industrial and CorporateChange 21 (5), 1255–1281.
Leiponen, A., Helfat, C.E., 2010. Location, decentralization, and knowledge sourcesfor innovation. Organization Science 22 (3), 641–658.
Leiponen, A., Drejer, I., 2007. What exactly are technological regimes? Intra-industryheterogeneity in the organization of innovation activities. Research Policy 36,1221–1238.
Leiponen, A., 2005. Organization of knowledge and innovation: the case of Finnishbusiness services. Industry and Innovation 12, 185–203.
Liebeskind, J.P., Lumerman, O.A., Zucker, L., Brewer, M., 1996. Social networks, learn-ing, and flexibility: sourcing scientific knowledge in new biotechnology firms.Organization Science 7, 428–443.
Love, J.H., Mansury, M.A., 2007. External linkages, R&D and innovation performancein US business services. Industry and Innovation 14, 477–496.
Love, J.H., Roper, S., Hewitt-Dundas, N., 2010. Service innovation, embeddednessand business performance: evidence from Northern Ireland. Regional Studies44, 983–1004.
Love, J.H., Roper, S., Bryson, J.R., 2011. Openness, knowledge, innovation and growthin UK business services. Research Policy 40 (10), 1438–1452.
Lundvall, B.Å. (Ed.), 1992. National System of Innovation. Towards a Theory of Inno-vation and Inter-active Learning. Pinter, London.
Malerba, F. (Ed.), 2004. Sectoral Systems of Innovation. Cambridge University Press,Cambridge, UK.
Mansury, M.A., Love, J.H., 2008. Innovation, productivity and growth in US businessservices: a firm-level analysis. Technovation 28 (1–2), 52–62.
Metcalfe, J.S., Miles, I. (Eds.), 2000. Innovation Systems in the Service Economy.Kluwer, Dordrecht.
Miles, I., 2005. Innovation in services. In: Fagerberg, I., Mowery, D.C., Nelson, R.R.(Eds.), Oxford Handbook of Innovation. Oxford University Press, Oxford and NewYork, pp. 433–458.
Miotti, L., Sachwald, F., 2003. Co-operative R&D: why and with whom? Research
Policy 32 (8), 1481–1499.Negassi, S., 2004. R&D cooperation and innovation: a microeconometric study onFrench firms. Research Policy 33 (3), 365–384.
Nelson, R. (Ed.), 1993. National Systems of Innovations. Oxford University Press,Oxford.

8 h Poli
P
P
P
P
P
R
R
S
S
T
T
T
vation process. Research Policy 5 (3), 212–239.Wise, R., Baumgartner, P., 1999. Go downstream: the new profit imperative in man-
ufacturing. Harward Business Review 77 (5), 133–141.
66 A. Mina et al. / Researc
apke, L.E., Wooldridge, J.M., 1996. Econometric methods for fractional responsevariables with an application to 401 (K) plan participation rates. Journal ofApplied Econometrics 11, 619–632.
erkmann, M., Walsh, K., 2007. University–industry relationships and open innova-tion: towards a research agenda. International Journal of Management Reviews9, 259–280.
iga, C.A., Vivarelli, M., 2004. Internal and external R&D: a sample selectionapproach. Oxford Bulletin of Economics and Statistics 66 (4), 457–482.
rencipe, A., Davies, A., Hobday, M. (Eds.), 2003. The Business of Systems Integration.Oxford University Press, Oxford.
robert, J., Connell, D., Mina, A., 2013. R&D service firms: the hidden engine of thehigh-tech economy? Research Policy 42 (6–7), 1274–1285.
odriguez, M., Ballesta, J.A.C., 2010. Are knowledge-intensive business services so‘hard’ innovators? Some insights using Spanish microdata. Journal of InnovationEconomics 1 (5), 41–65.
ubalcaba, L., Kox, H., 2007. Business Services in European Economic Growth. Pal-grave Macmillan, Basingstoke and New York.
irilli, G., Evangelista, R., 1998. Technological innovation in services and manufac-turing: results from Italian surveys. Research Policy 27, 881–889.
turgeon, T.J., 2002. Modular production networks: a new American model of indus-trial organization. Industrial and Corporate Change 11 (3), 451–496.
eece, D.J., 2010. Business models, business strategy and innovation. Long RangePlanning 43, 172–194.
ether, B.S., 2002. Who co-operates for innovation, and why: an empirical analysis.Research Policy 31, 947–967.
ether, B.S., 2003. The sources and aims of innovation in services: varietybetween and within sectors. Economics of Innovation and New Technology 12,481–505.
cy 43 (2014) 853–866
Tether, B.S., 2005. Do services innovate (differently)? Insights from the EuropeanInnobarometer Survey. Industry and Innovation 12, 153–184.
Tether, B.S., Tajar, A., 2008. Beyond industry–university links: sourcing of specialistknowledge for innovation from consultants, private research organisations andthe public science base. Research Policy 37 (6-7), 1079–1095.
Tether, B.S., Bascavusoglu-Moreau, E., 2011. Servitisation: The Extent and Motiva-tions for Service Provision amongst UK Manufacturers. Mimeo.
Vargo, S.L., Maglio, P.P., Akaka, M.A., 2008. On value and value co-creation: a servicesystems and service logic perspective? European Management Journal 26 (3),145–152.
Van Aken, J.E., Weggeman, P., 2000. Managing learning in informal innovationnetworks. R&D Management 30 (2), 139–149.
Vandermerwe, S., Rada, J., 1988. Servitisation of business: adding value by addingservices. European Management Journal 6 (4), 314–324.
Veugelers, R., 1997. Internal R&D expenditures and external technology sourcing.Research Policy 26 (3), 303–315.
Veugelers, R., Cassiman, B., 2005. R&D cooperation between firms and universities:some empirical evidence from Belgian manufacturing. International Journal ofIndustrial Organization 23 (5-6), 355L 379.
von Hippel, E., 1976. The dominant role of users in the scientific instrument inno-
Zott, C., Amit, R., Massa, L., 2011. The business model: recent developments andfuture research. Journal of Management 37, 1019–1042.