open-file report 2021-1000
TRANSCRIPT
Scott Ausbrooks, Director and State Geologist
OPEN-FILE REPORT 2021-1000
ARKANSAS FOSSIL FUELS ACTIVITY UPDATE FOR 2020
Peng Li, Senior Petroleum Geologist
North Little Rock, Arkansas
2021

i
STATE OF ARKANSAS Asa Hutchinson, Governor
DEPARTMENT OF ENERGY AND ENVIRONMENT
Becky Keogh, Secretary
ARKANSAS GEOLOGICAL SURVEY Scott Ausbrooks, Director and State Geologist
Commissioners
William Willis, Chairman…………………………….………………………..Hot Springs
Quin Baber III, Vice Chairman..……………………………………………………Benton
Bill Cains…………………………………………………………………………….Lamar
Ken Fritsche……………………………………………………………………Greenwood
David Lumbert…………………………………………………………………...Maumelle
Mandy McFall…………………………………………………………………...Leachville
Dr. Jason Patton………….………………………………………………..…...Russellville

ii
iii
Table of Contents
South Arkansas Oil and Associated Gas ......................................................................................... 1
North Arkansas Conventional Gas ................................................................................................. 1
Fayetteville Shale Gas Play ............................................................................................................ 3
Lithium From Smackover Formation ............................................................................................. 6
Coalbed Methane ............................................................................................................................ 8
Coal ................................................................................................................................................. 9
References ....................................................................................................................................... 9
Figures
Figure 1. Annual oil production of south Arkansas (1970-2020). .................................................. 1
Figure 2. Annual gas production of south Arkansas (1970-2020). ................................................. 2
Figure 3. Annual conventional gas production of north Arkansas (2010-2020). ........................... 2
Figure 4. Annual gas production of north Arkansas (1970-2020). ................................................. 3
Figure 5. Primary area of the Fayetteville Shale exploration and development in Arkansas. ........ 4
Figure 6. Annual and cumulative gas productions of the Fayetteville Shale gas play. ................. 5
Figure 7. Weekly drill rig numbers in the Fayetteville Shale gas play (2011-2020). ..................... 5
Figure 8. Fayetteville Shale well completion numbers. ................................................................. 6
Figure 9. South Arkansas brine leases. ........................................................................................... 7
Figure 10. Annual coalbed methane production of Arkansas. ........................................................ 8
Figure 11. Annual coal production of Arkansas. ............................................................................ 9

1
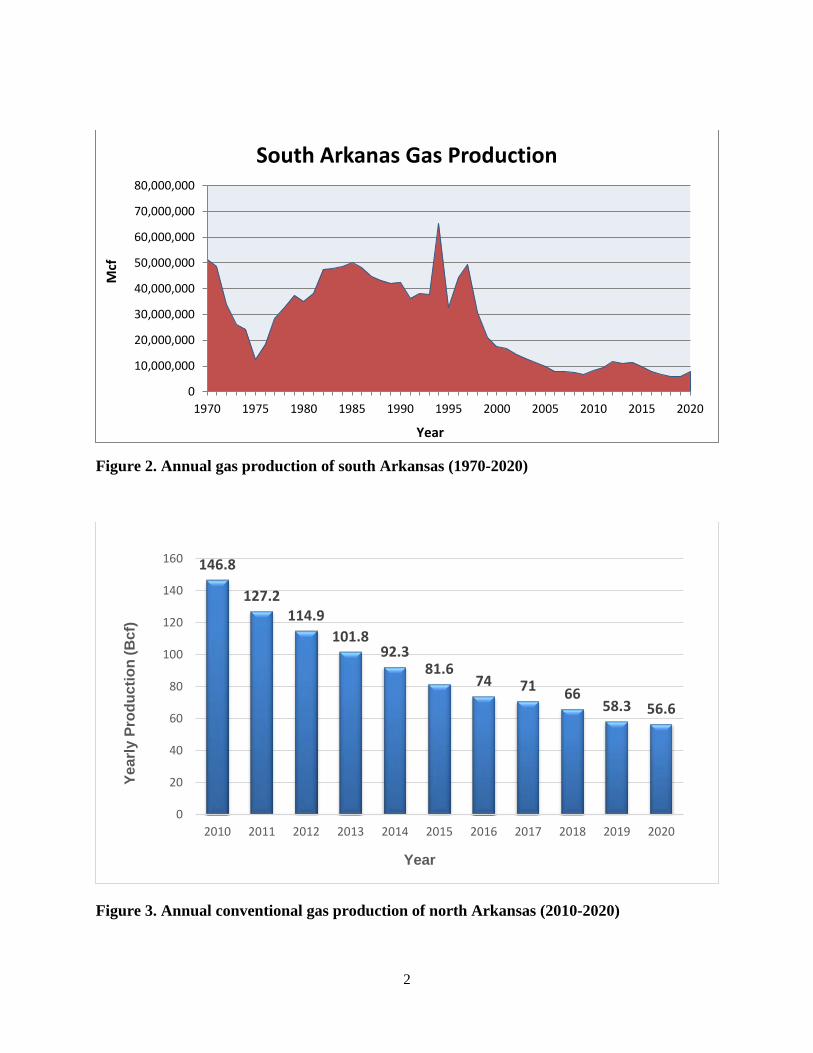
South Arkansas Oil and Associated Gas South Arkansas crude oil production was 2,655,429 bbls in 2020, down 45% from last year, marking the largest annual decline in five decades (Figure 1). Crude oil prices decreased in 2020 due to the sudden drop in petroleum demand that resulted from the global response to the coronavirus (COVID-19) pandemic. The declining prices led crude oil operators to shut in wells and limit the drilling of new wells. In 2020, only 15 drilling permits were issued, and 16 wells completed in south Arkansas, both decreased by half compared to 2019. In addition, 45 wells were plugged and abandoned. Associated gas production in this region was 7,693,389 Mcf in 2020, up 9% from 2019 (Figure 2). Cumulative oil production in south Arkansas as of the end of 2020 was 1,906,748,584 bbls.
Figure 1. Annual oil production of south Arkansas (1970-2020)
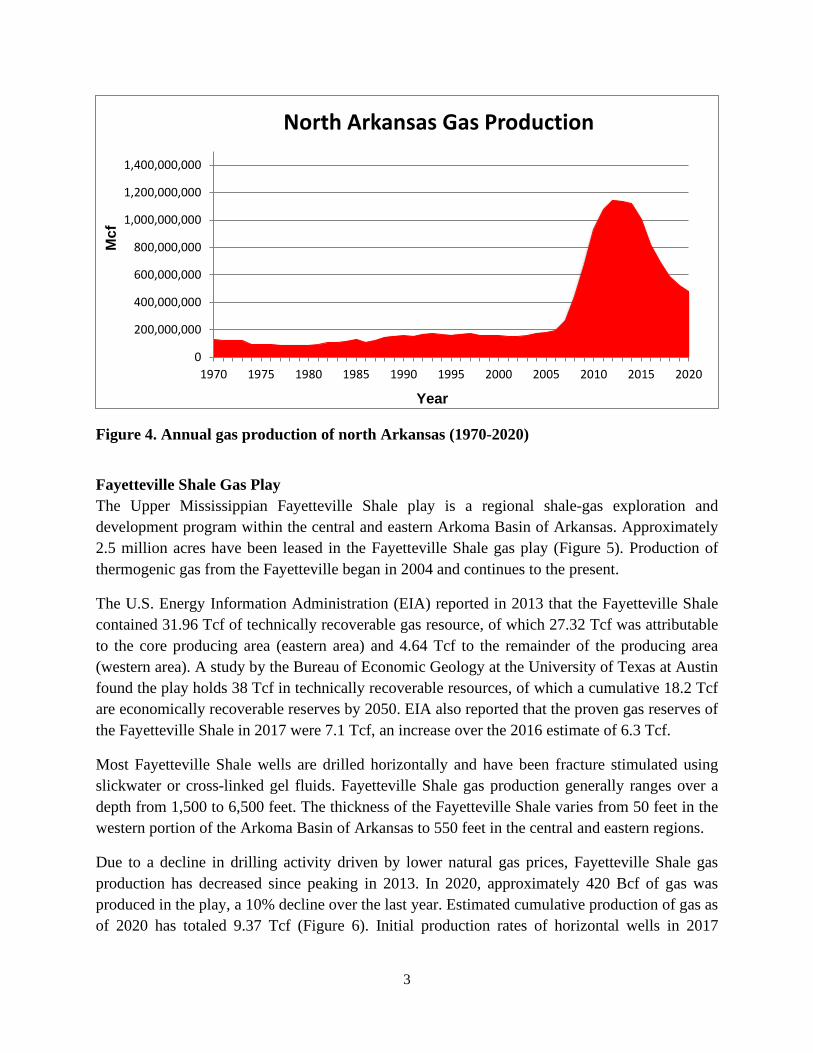
North Arkansas Conventional Gas The western Arkoma Basin of Arkansas has long been a gas producing province with the bulk of the production coming from a stacked succession of Pennsylvanian sandstone reservoirs. Production of conventional gas for 2020 has declined by 3% to 56.6 Bcf (Figure 3). Cumulative production in the Arkoma Basin for all conventional gas wells and tight gas sands of the B-44 gas field producing region was approximately 7.39 Tcf as of the end of 2020. Ten drilling permits were issued, and four gas wells were completed, while 71 gas wells were plugged and abandoned in 2020. Figure 4 illustrates that gas production in north Arkansas has had some modest increases since the mid-1980s, with a sharp increase in 2005 mostly associated with development of the Fayetteville Shale gas play.
0
5,000,000
10,000,000
15,000,000
20,000,000
25,000,000
1970 1975 1980 1985 1990 1995 2000 2005 2010 2015 2020
Bbls
Year
South Arkansas Oil Production
2
Figure 2. Annual gas production of south Arkansas (1970-2020)
Figure 3. Annual conventional gas production of north Arkansas (2010-2020)
0
10,000,000
20,000,000
30,000,000
40,000,000
50,000,000
60,000,000
70,000,000
80,000,000
1970 1975 1980 1985 1990 1995 2000 2005 2010 2015 2020
Mcf
Year
South Arkanas Gas Production
146.8
127.2114.9
101.892.3
81.674 71 66
58.3 56.6
0
20
40
60
80
100
120
140
160
2010 2011 2012 2013 2014 2015 2016 2017 2018 2019 2020
Year
ly P
rodu
ctio
n (B
cf)
Year
3
Figure 4. Annual gas production of north Arkansas (1970-2020)
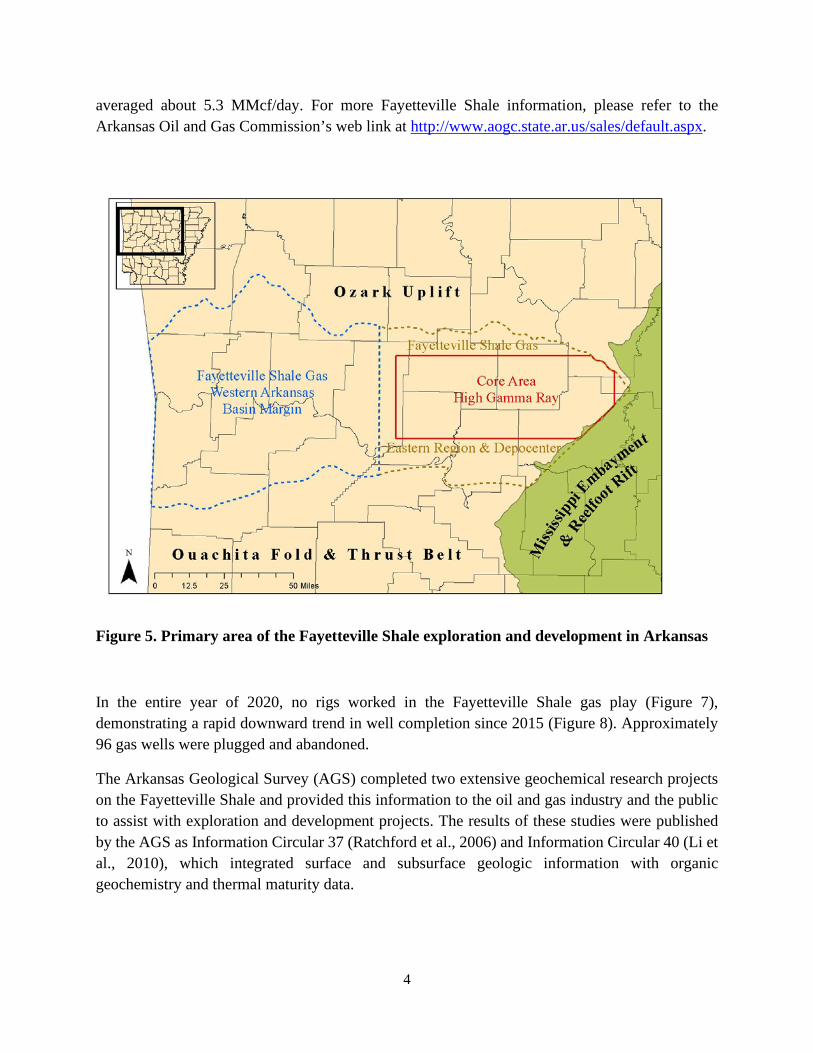
Fayetteville Shale Gas Play The Upper Mississippian Fayetteville Shale play is a regional shale-gas exploration and development program within the central and eastern Arkoma Basin of Arkansas. Approximately 2.5 million acres have been leased in the Fayetteville Shale gas play (Figure 5). Production of thermogenic gas from the Fayetteville began in 2004 and continues to the present.
The U.S. Energy Information Administration (EIA) reported in 2013 that the Fayetteville Shale contained 31.96 Tcf of technically recoverable gas resource, of which 27.32 Tcf was attributable to the core producing area (eastern area) and 4.64 Tcf to the remainder of the producing area (western area). A study by the Bureau of Economic Geology at the University of Texas at Austin found the play holds 38 Tcf in technically recoverable resources, of which a cumulative 18.2 Tcf are economically recoverable reserves by 2050. EIA also reported that the proven gas reserves of the Fayetteville Shale in 2017 were 7.1 Tcf, an increase over the 2016 estimate of 6.3 Tcf.
Most Fayetteville Shale wells are drilled horizontally and have been fracture stimulated using slickwater or cross-linked gel fluids. Fayetteville Shale gas production generally ranges over a depth from 1,500 to 6,500 feet. The thickness of the Fayetteville Shale varies from 50 feet in the western portion of the Arkoma Basin of Arkansas to 550 feet in the central and eastern regions.
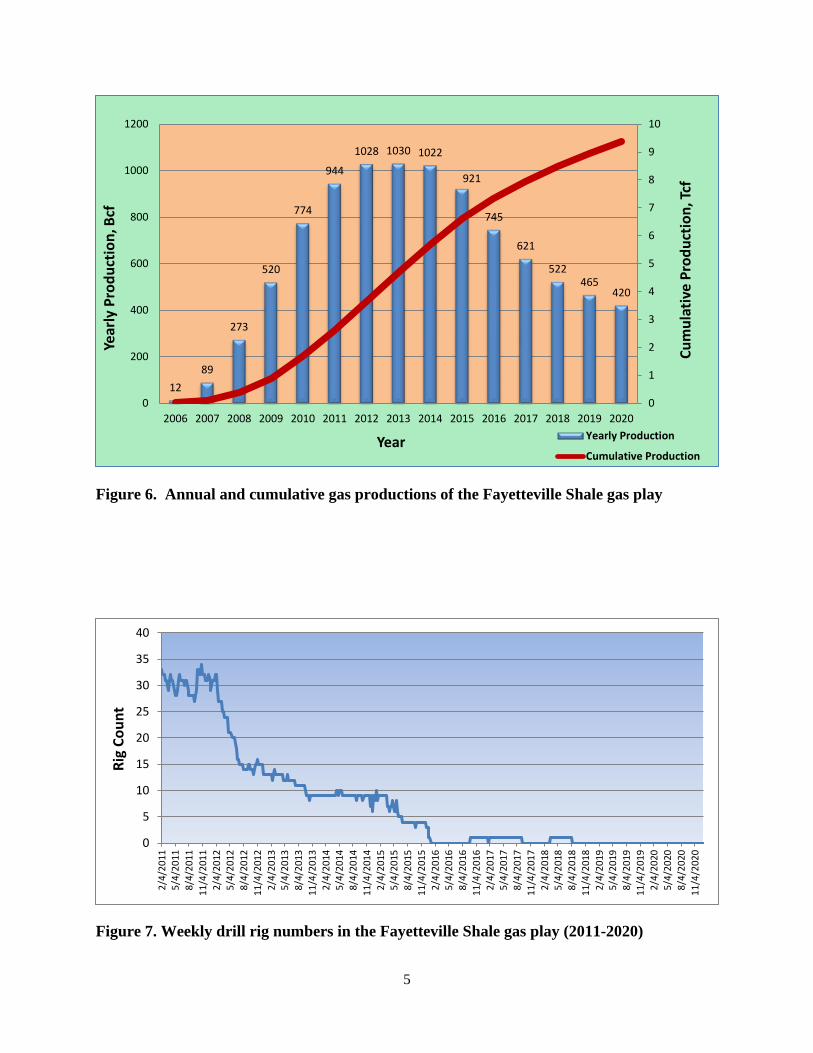
Due to a decline in drilling activity driven by lower natural gas prices, Fayetteville Shale gas production has decreased since peaking in 2013. In 2020, approximately 420 Bcf of gas was produced in the play, a 10% decline over the last year. Estimated cumulative production of gas as of 2020 has totaled 9.37 Tcf (Figure 6). Initial production rates of horizontal wells in 2017
0
200,000,000
400,000,000
600,000,000
800,000,000
1,000,000,000
1,200,000,000
1,400,000,000
1970 1975 1980 1985 1990 1995 2000 2005 2010 2015 2020
Mcf
Year
North Arkansas Gas Production
4
averaged about 5.3 MMcf/day. For more Fayetteville Shale information, please refer to the Arkansas Oil and Gas Commission’s web link at http://www.aogc.state.ar.us/sales/default.aspx.
Figure 5. Primary area of the Fayetteville Shale exploration and development in Arkansas
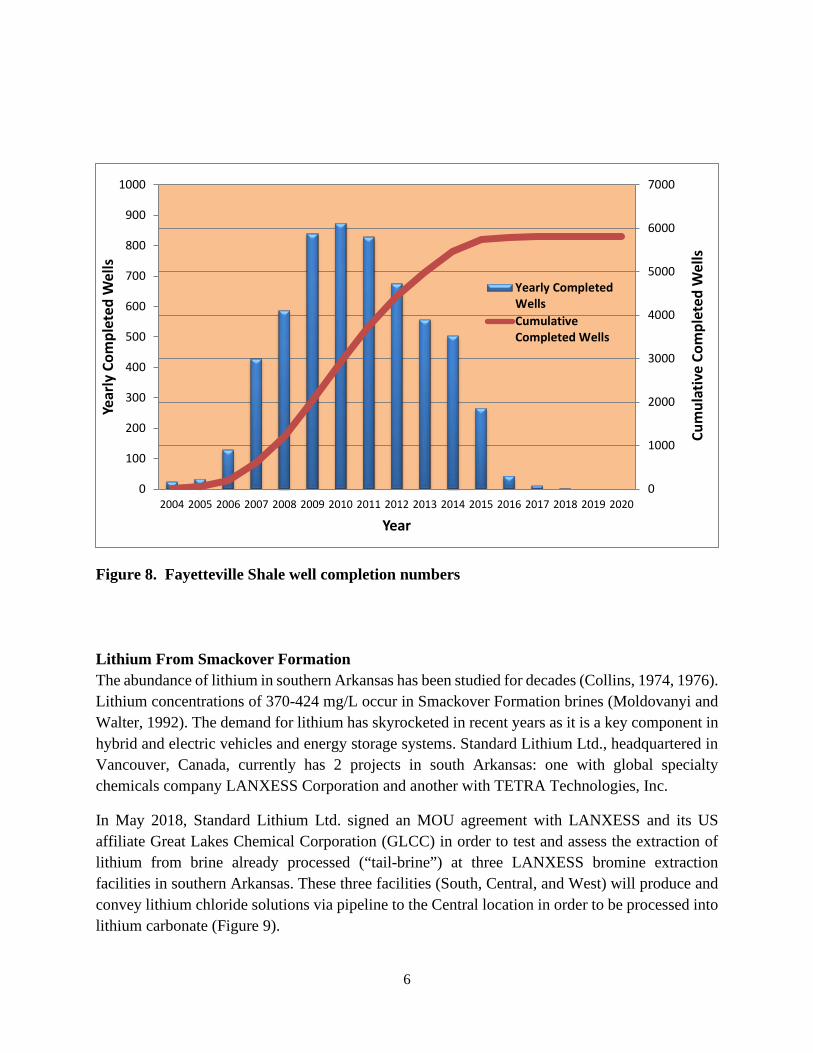
In the entire year of 2020, no rigs worked in the Fayetteville Shale gas play (Figure 7), demonstrating a rapid downward trend in well completion since 2015 (Figure 8). Approximately 96 gas wells were plugged and abandoned.
The Arkansas Geological Survey (AGS) completed two extensive geochemical research projects on the Fayetteville Shale and provided this information to the oil and gas industry and the public to assist with exploration and development projects. The results of these studies were published by the AGS as Information Circular 37 (Ratchford et al., 2006) and Information Circular 40 (Li et al., 2010), which integrated surface and subsurface geologic information with organic geochemistry and thermal maturity data.
5
Figure 6. Annual and cumulative gas productions of the Fayetteville Shale gas play
Figure 7. Weekly drill rig numbers in the Fayetteville Shale gas play (2011-2020)
1289
273
520
774
944
1028 1030 1022
921
745
621
522465
420
0
1
2
3
4
5
6
7
8
9
10
0
200
400
600
800
1000
1200
2006 2007 2008 2009 2010 2011 2012 2013 2014 2015 2016 2017 2018 2019 2020
Cum
ulat
ive
Prod
uctio
n, Tc
f
Year
ly P
rodu
ctio
n, B
cf
Year Yearly Production
Cumulative Production
0
5
10
15
20
25
30
35
40
2/4/
2011
5/4/
2011
8/4/
2011
11/4
/201
12/
4/20
125/
4/20
128/
4/20
1211
/4/2
012
2/4/
2013
5/4/
2013
8/4/
2013
11/4
/201
32/
4/20
145/
4/20
148/
4/20
1411
/4/2
014
2/4/
2015
5/4/
2015
8/4/
2015
11/4
/201
52/
4/20
165/
4/20
168/
4/20
1611
/4/2
016
2/4/
2017
5/4/
2017
8/4/
2017
11/4
/201
72/
4/20
185/
4/20
188/
4/20
1811
/4/2
018
2/4/
2019
5/4/
2019
8/4/
2019
11/4
/201
92/
4/20
205/
4/20
208/
4/20
2011
/4/2
020
Rig
Coun
t
6
Figure 8. Fayetteville Shale well completion numbers
Lithium From Smackover Formation The abundance of lithium in southern Arkansas has been studied for decades (Collins, 1974, 1976). Lithium concentrations of 370-424 mg/L occur in Smackover Formation brines (Moldovanyi and Walter, 1992). The demand for lithium has skyrocketed in recent years as it is a key component in hybrid and electric vehicles and energy storage systems. Standard Lithium Ltd., headquartered in Vancouver, Canada, currently has 2 projects in south Arkansas: one with global specialty chemicals company LANXESS Corporation and another with TETRA Technologies, Inc.
In May 2018, Standard Lithium Ltd. signed an MOU agreement with LANXESS and its US affiliate Great Lakes Chemical Corporation (GLCC) in order to test and assess the extraction of lithium from brine already processed (“tail-brine”) at three LANXESS bromine extraction facilities in southern Arkansas. These three facilities (South, Central, and West) will produce and convey lithium chloride solutions via pipeline to the Central location in order to be processed into lithium carbonate (Figure 9).
0
100
200
300
400
500
600
700
800
900
1000
0
1000
2000
3000
4000
5000
6000
7000
20202019201820172016201520142013201220112010200920082007200620052004
Year
Year
ly C
ompl
eted
Wel
ls
Cum
ulat
ive
Com
plet
ed W
ells
Yearly CompletedWellsCumulativeCompleted Wells

7
A Resource Report was published in November 2018, followed by a Preliminary Economic Assessment in August 2019. The total resource for the LANXESS Project is estimated at 3,140,000 tonnes lithium carbonate equivalent (LCE), with a planned production of 20,900 tonnes per year. Although the planned project operation time is 25 years, this resource estimate could extend production beyond this timeline.
Additionally, in November 2018 the Arkansas Oil and Gas Commission (AOGC) approved a joint application from Great Lakes Chemical Corporation and Arkansas Lithium Corporation, a new subsidiary of Standard Lithium Ltd., to operate a pilot plant in El Dorado, Arkansas. During the summer and into the fall of 2019, Standard Lithium Ltd. constructed a demonstration-scale lithium extraction plant in Ontario, Canada, which was broken down into modules and shipped to a LANXESS brine processing facility at their South Plant. Initial installation was completed in October 2019, and in December 2019 they completed installation of a semi-permanent structure to enclose the plant and ancillary laboratory, as well as an office and control room. Since the beginning of 2020, utility and service connections were completed and the Plant entered the commissioning phase. An announcement in May 2020 expressed the successful completion of the commissioning phase and the start-up of this plant. In September 2020, bulk volumes of lithium chloride solution were shipped from Arkansas to British Columbia, Canada for final conversion to lithium carbonate using the company’s SiFT crystallization process. When the international border restrictions (due to COVID-19 pandemic) are lifted, it is possible to move the SiFT pilot plant and company’s staff from British Columbia to Arkansas.
Figure 9. South Arkansas brine leases (https://www.standardlithium.com/projects/arkansas-smackover)
8
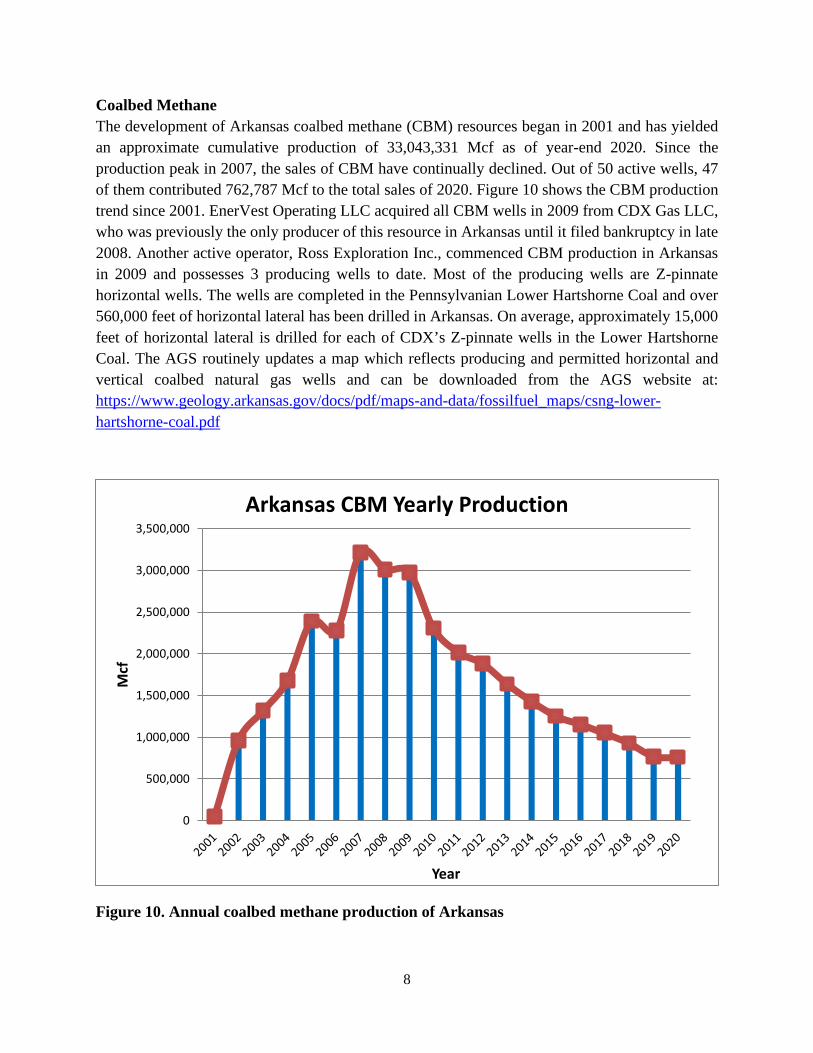
Coalbed Methane The development of Arkansas coalbed methane (CBM) resources began in 2001 and has yielded an approximate cumulative production of 33,043,331 Mcf as of year-end 2020. Since the production peak in 2007, the sales of CBM have continually declined. Out of 50 active wells, 47 of them contributed 762,787 Mcf to the total sales of 2020. Figure 10 shows the CBM production trend since 2001. EnerVest Operating LLC acquired all CBM wells in 2009 from CDX Gas LLC, who was previously the only producer of this resource in Arkansas until it filed bankruptcy in late 2008. Another active operator, Ross Exploration Inc., commenced CBM production in Arkansas in 2009 and possesses 3 producing wells to date. Most of the producing wells are Z-pinnate horizontal wells. The wells are completed in the Pennsylvanian Lower Hartshorne Coal and over 560,000 feet of horizontal lateral has been drilled in Arkansas. On average, approximately 15,000 feet of horizontal lateral is drilled for each of CDX’s Z-pinnate wells in the Lower Hartshorne Coal. The AGS routinely updates a map which reflects producing and permitted horizontal and vertical coalbed natural gas wells and can be downloaded from the AGS website at: https://www.geology.arkansas.gov/docs/pdf/maps-and-data/fossilfuel_maps/csng-lower-hartshorne-coal.pdf
Figure 10. Annual coalbed methane production of Arkansas
0
500,000
1,000,000
1,500,000
2,000,000
2,500,000
3,000,000
3,500,000
Mcf
Year
Arkansas CBM Yearly Production
9
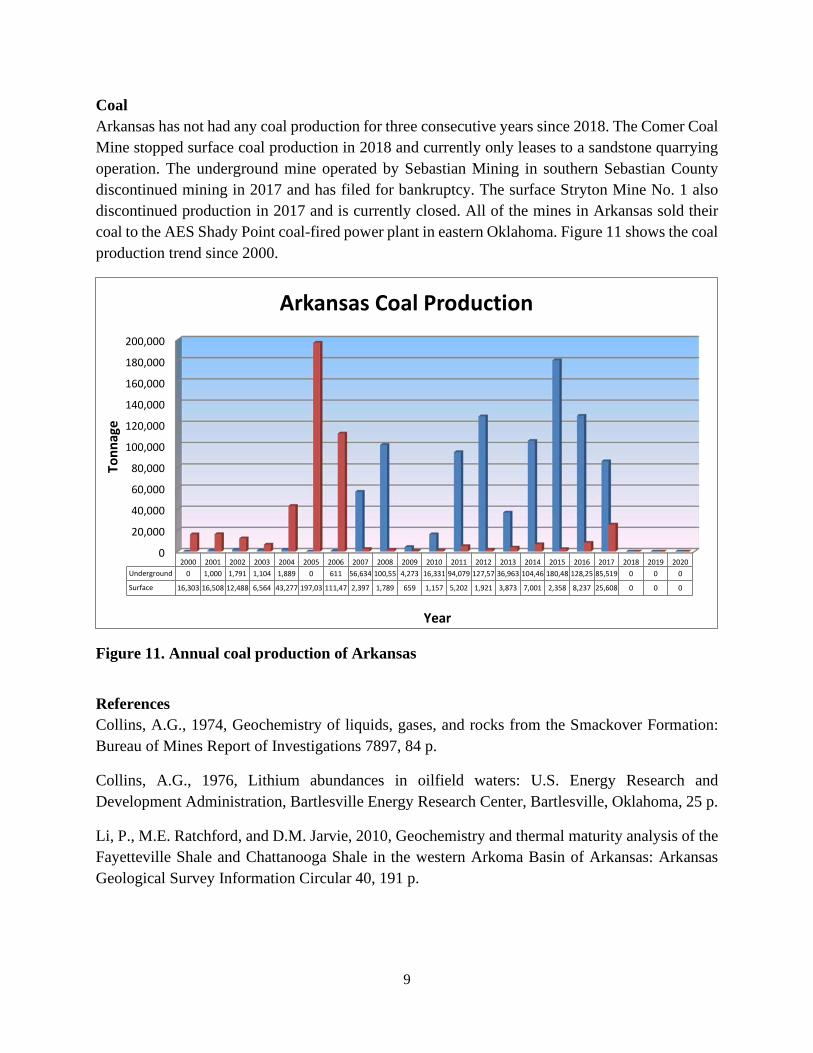
Coal Arkansas has not had any coal production for three consecutive years since 2018. The Comer Coal Mine stopped surface coal production in 2018 and currently only leases to a sandstone quarrying operation. The underground mine operated by Sebastian Mining in southern Sebastian County discontinued mining in 2017 and has filed for bankruptcy. The surface Stryton Mine No. 1 also discontinued production in 2017 and is currently closed. All of the mines in Arkansas sold their coal to the AES Shady Point coal-fired power plant in eastern Oklahoma. Figure 11 shows the coal production trend since 2000.
Figure 11. Annual coal production of Arkansas
References Collins, A.G., 1974, Geochemistry of liquids, gases, and rocks from the Smackover Formation: Bureau of Mines Report of Investigations 7897, 84 p.
Collins, A.G., 1976, Lithium abundances in oilfield waters: U.S. Energy Research and Development Administration, Bartlesville Energy Research Center, Bartlesville, Oklahoma, 25 p.
Li, P., M.E. Ratchford, and D.M. Jarvie, 2010, Geochemistry and thermal maturity analysis of the Fayetteville Shale and Chattanooga Shale in the western Arkoma Basin of Arkansas: Arkansas Geological Survey Information Circular 40, 191 p.
0
20,000
40,000
60,000
80,000
100,000
120,000
140,000
160,000
180,000
200,000
2000 2001 2002 2003 2004 2005 2006 2007 2008 2009 2010 2011 2012 2013 2014 2015 2016 2017 2018 2019 2020Underground 0 1,000 1,791 1,104 1,889 0 611 56,634 100,55 4,273 16,331 94,079 127,57 36,963 104,46 180,48 128,25 85,519 0 0 0
Surface 16,303 16,508 12,488 6,564 43,277 197,03 111,47 2,397 1,789 659 1,157 5,202 1,921 3,873 7,001 2,358 8,237 25,608 0 0 0
Tonn
age
Year
Arkansas Coal Production
10
Moldovanyi, E.P., and L.M. Walter, 1992, Regional trends in water chemistry, Smackover Formation, southwest Arkansas: geochemical and physical controls: American Association of Petroleum Geologists Bulletin, v. 76, p. 864-894.
Ratchford, M.E., L.C. Bridges, W.G. Dow, A. Colbert, and D.M. Jarvie, 2006, Organic geochemistry and thermal maturation analysis within the Fayetteville Shale study area – Eastern Arkoma Basin and Mississippi Embayment regions Arkansas: Arkansas Geological Survey Information Circular 37, 200 p, 23 Map Plates.