open day 2006 from expression, through annotation, to function ohad manor & tali goren
Post on 18-Dec-2015
220 views
TRANSCRIPT
Open Day 2006
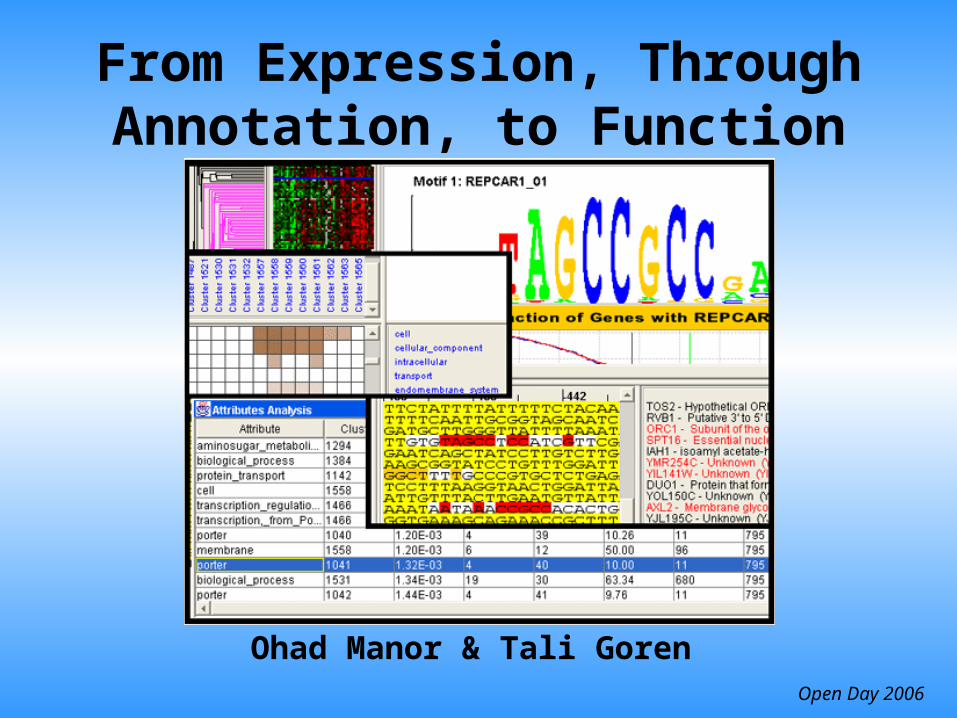
From Expression, Through Annotation, to Function
Ohad Manor & Tali Goren

Open Day 2006
Have you ever wondered…
Open Day 2006
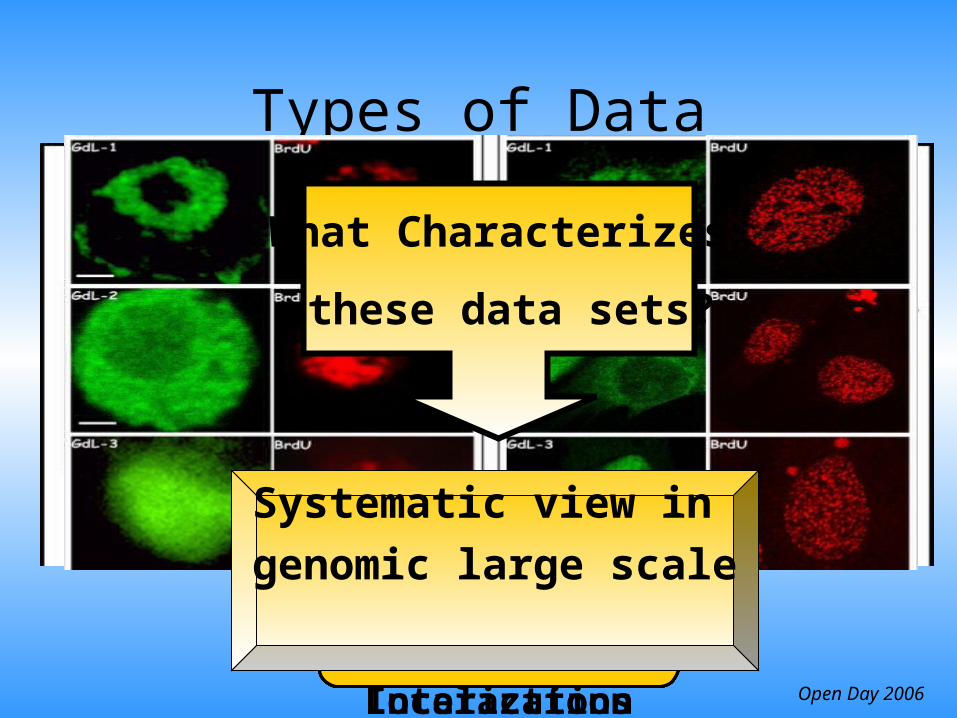
Types of Data
Gene Expression (Microarray)GO Annotations
Gene Expression (Microarray)
GO AnnotationsChIP on chipGO AnnotationsGene Expression
(Microarray)GO AnnotationsChIP on chipProtein – Protein Interactions
Sub - Cellular Localization
Systematic view in
genomic large scale
What Characterizes
these data sets?

Open Day 2006

Open Day 2006
• A computational tool to check enrichment of data sets
• Implemented in perl
• Interactive command line
• May be scripted…
• Concatenate tests and matrix operations
• Data manipulation functions and queries
What is ?

Open Day 2006
Using
• Load biological data
• Check enrichment of crossed data sets
• Extract statistically significant results
• Multiple hypothesis correction
• Cluster gene sets
• Save results

Open Day 2006
What is statistically significant?
• How to choose the right test to compare measurements?
• Paired or Unpaired?
• Non – Parametric:– no assumption about sample size or distribution– no parameters such as expectation or variance
Open Day 2006
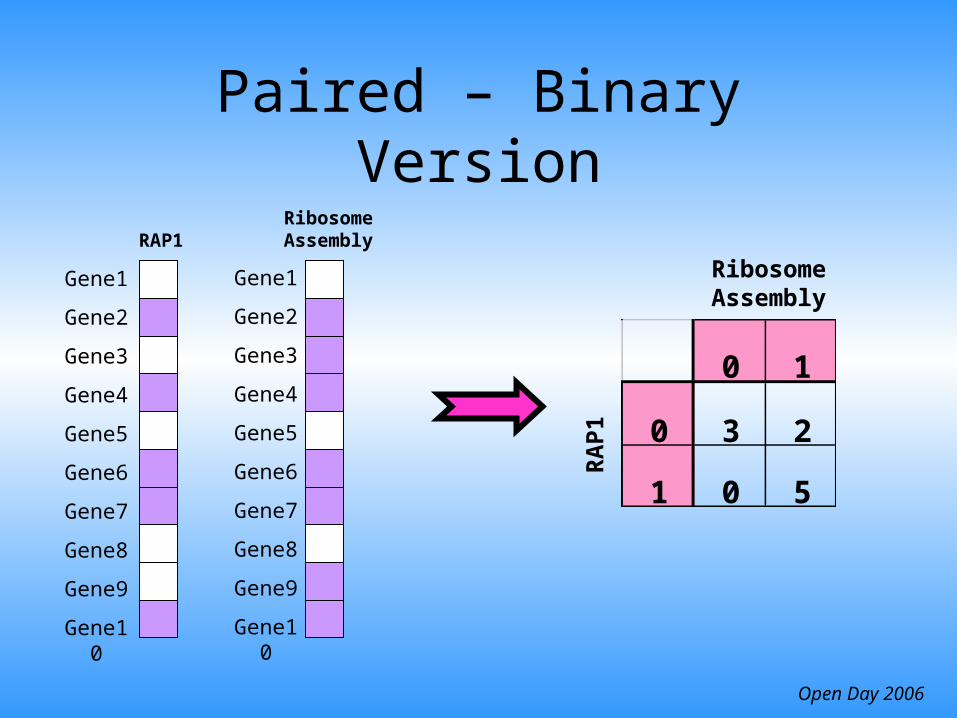
Paired – Binary Version
0 1
0 3 2
1 0 5
RA
P1
Ribosome Assembly
Gene1
Gene2
Gene3
Gene4
Gene5
Gene6
Gene7
Gene8
Gene9
Gene10
Gene1
Gene2
Gene3
Gene4
Gene5
Gene6
Gene7
Gene8
Gene9
Gene10
RAP1Ribosome Assembly

Open Day 2006
Paired – continuous version
Gene1
Gene2
Gene3
Gene4
Gene5
Gene6
Gene7
Gene8
Gene9
Gene10
heat shockGene1
Gene2
Gene3
Gene4
Gene5
Gene6
Gene7
Gene8
Gene9
Gene10
YPDGene1
Gene2
Gene3
Gene4
Gene5
Gene6
Gene7
Gene8
Gene9
Gene10
-1 1

Open Day 2006
Unpaired test
Gene1
Gene2
Gene4
Gene5
Gene6
heat shock
Gene3
Gene7
Gene8
Gene10
heat shock
-1 1
Gene1
Gene2
Gene3
Gene4
Gene5
Gene6
Gene7
Gene8
Gene9
Gene10
heat shock
RAP1
Gene1
Gene2
Gene3
Gene4
Gene5
Gene6
Gene7
Gene8
Gene9
Gene10

Open Day 2006
Statistics Statistics…….
Parametric TestsNon -Parametric
TestsBinary
Measurements
Compare two unpaired groups
Unpaired T test Kolmogorov-Smirnov
Compare two paired groups
Paired T test Wilcoxon test Chi-square test
Quantify association
between two variables
Pearson correlation Spearman Correlation
Goal
Type Of Data

Open Day 2006
How About Some Biology?

Open Day 2006
S. Cerevisiae Regulation
• Let’s presume we know nothing about the Yeast
• Use ENRICH to construct a basic regulatory network of Yeast
• How can we do that?
Open Day 2006
STE12
RAP1
YAP5
MSN2
SFP1
FHL1
GAT1
Binary values
Rib
osom
al
Stre
ss
Cel
l cyc
le
Met
abol
ism
Flow chart
HG test Significance
threshold
Rib
osom
al
Str
ess
Cel
l cyc
le
Met
abol
ism
STE12
RAP1
YAP5
MSN2
SFP1
FHL1
GAT1
P-values
Gene1
Gene2
Gene3
Gene4
Gene5
Gene6
Gene7
Gene8
Gene9
Gene10
Rib
osom
al
Stre
ss
Cel
l cyc
le
Met
abol
ism
GO
Gene1
Gene2
Gene3
Gene4
Gene5
Gene6
Gene7
Gene8
Gene9
Gene10
Ch
IP
STE
12
RA
P1
MSN
2 F
HL
1
Open Day 2006
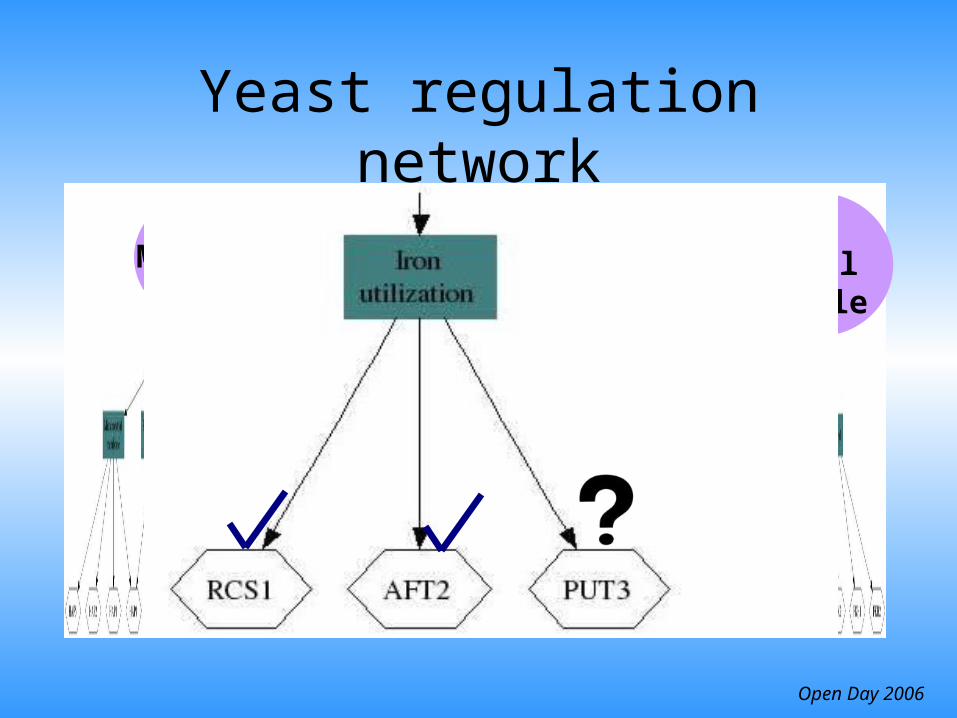
Metabolism Stress Cell cycle
Yeast regulation network

Open Day 2006
FHL1 proteinCase study

Open Day 2006
FHL1 – what is known
• Putative transcriptional regulator
• Predicted to be involved in stress response• Required for rRNA processing
• Null mutant shows reduced growth rate• Could we have found all of that alone?
Open Day 2006
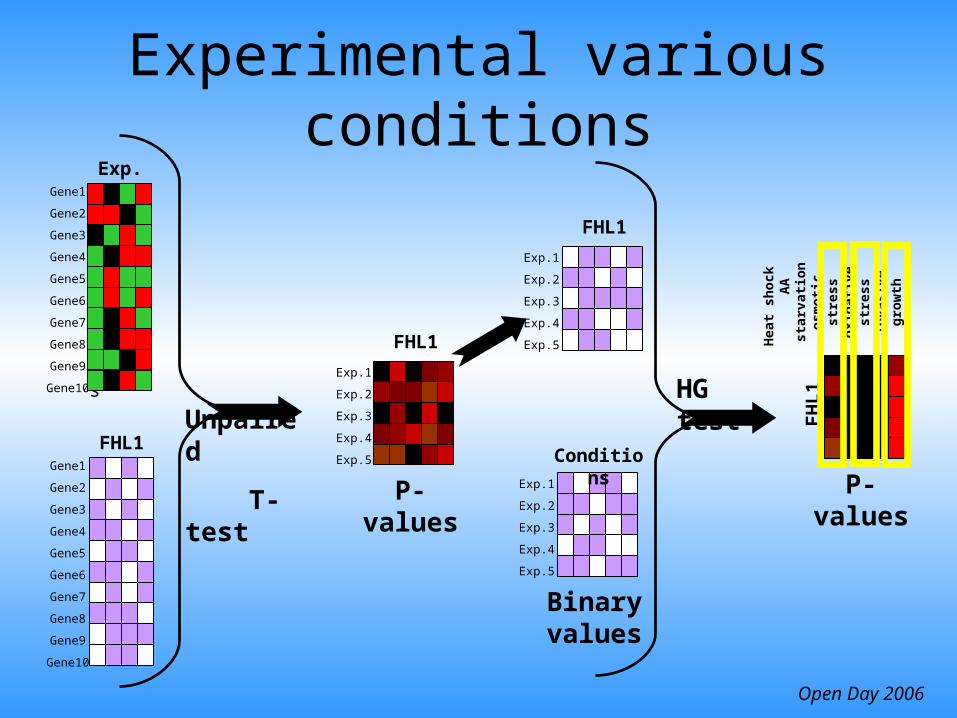
Experimental various conditions
genes
Gene1
Gene2
Gene3
Gene4
Gene5
Gene6
Gene7
Gene8
Gene9
Gene10
Exp.
Gene1
Gene2
Gene3
Gene4
Gene5
Gene6
Gene7
Gene8
Gene9
Gene10
FHL1
Unpaired
T-test
Exp.1
Exp.2
Exp.3
Exp.4
Exp.5
P-values
FHL1
Exp.1
Exp.2
Exp.3
Exp.4
Exp.5
FHL1
Exp.1
Exp.2
Exp.3
Exp.4
Exp.5
Binary values
Conditions
HG test
P-values
FH
L1
Hea
t sh
ock
AA
sta
rvat
ion
osm
otic
str
ess
oxid
ativ
e st
ress
in
vasi
ve g
row
th

Open Day 2006
Tell me who are your friends…Gene1
Gene2
Gene3
Gene4
Gene5
Gene6
Gene7
Gene8
Gene9
Gene10
FHL1
Gene1
Gene2
Gene3
Gene4
Gene5
Gene6
Gene7
Gene8
Gene9
Gene10
ChIP
HG test
RA
P1
FK
H2
MB
P1
GA
T3
S
OK
2
P-values
FH
L1

Open Day 2006
Enriched conditions
GrowthStress
response
Enriched GO annotations
Ribosome assembly
RAP1 SFP1 GAT3
Enriched TF’s

Open Day 2006
Remember this question?
• What is the connection between the expression level of a gene to its sub-cellular localization?
• Which Transcription Factors regulate Amino Acid Biosynthesis?
• Does a heat shock affect peripheral proteins more than it affects mitochondrial proteins?
MitochondrionCell Periphery

Open Day 2006
Flow chart
genes
Gene1
Gene2
Gene3
Gene4
Gene5
Gene6
Gene7
Gene8
Gene9
Gene10
Exp.
Gene1
Gene2
Gene3
Gene4
Gene5
Gene6
Gene7
Gene8
Gene9
Gene10
Localization
Unpaired
T-test
HG testExp.1
Exp.2
Exp.3
Exp.4
Exp.5
P-values
Mit
ocho
ndri
a
B
ud N
eck
V
acuo
le
Cel
l per
iphe
ry
Nuc
leus
Exp.1
Exp.2
Exp.3
Exp.4
Exp.5
Mit
ocho
ndri
a
B
ud N
eck
V
acuo
le
Cel
l per
iphe
ry
Nuc
leus
Exp.1
Exp.2
Exp.3
Exp.4
Exp.5
Binary values
Shor
t H
S M
ediu
m H
S
Lon
g H
S
Seve
re H
S
M
oder
ate
HS
P-values
Short HS Medium HS
Long HS Severe HS
Moderate HS
Cel
l per
iphe
ry
Mit
ocho
ndri
a

Open Day 2006
Future plans
• Continue to develop
• More data available out there
• Build Regulation networks for the Yeast and other species

Open Day 2006
Questions

Open Day 2006
Thanks
• Prof. Nir Friedman
• Tommy Kaplan
• And to you for listening!!!

Open Day 2006