open access systematic review scat2 and scat3 scores at
TRANSCRIPT
SCAT2 and SCAT3 scores at baselineand after sports-related mild braininjury/concussion: qualitative synthesiswith weighted means
Roger E Thomas,1 Jorge Alves,2 Marcus M Vaska,3 Rosana Magalhães4
To cite: Thomas RE, Alves J,Vaska MM, et al. SCAT2 andSCAT3 scores at baseline andafter sports-related mild braininjury/concussion: qualitativesynthesis with weightedmeans. BMJ Open SportExerc Med 2016;2:e000095.doi:10.1136/bmjsem-2015-000095
▸ Prepublication history andadditional material isavailable. To view please visitthe journal (http://dx.doi.org/10.1136/bmjsem-2015-000095).
Accepted 10 August 2016
1Department of FamilyMedicine, Faculty ofMedicine, Health SciencesCentre, University of Calgary,Calgary, Alberta, Canada2CEREBRO—Brain HealthCenter, Braga, Portugal3Knowledge ResourceService, Alberta HealthServices, Holy Cross Centre,Calgary, Alberta, Canada4Clinical Academic Center—Braga, Braga, Portugal
Correspondence toDr Roger E Thomas;[email protected]
ABSTRACTObjective: Identify all Sport Concussion AssessmentTool (SCAT2/3) studies, compare baseline andpostconcussion results.Design: Systematic review (qualitative synthesis,weighted means).Data sources: 18 databases, 9 grey literatureresources searched for SCAT2/3 data; 9150 articlesidentified, titles/abstracts assessed/data-entryindependently by two reviewers.Eligibility criteria for selecting studies: Anystudies reporting partial/complete SCAT2/3 data.Results: 21 studies with data ( partial/complete data16 SCAT2 (4087 athletes); 5 SCAT3 (891).Newcastle-Ottawa risk-of-bias scale: studies withmaximum possible score of 4, 85% scored 3 or 4;studies with maximum possible score of 6, 75%scored 5 or 6. SCAT2 high schoolers: weightedmean score for symptoms 18.46 (22=nosymptoms), Balance Error Scoring System (BESS)26.14, Standardised Assessment of Concussion(SAC) 26.00 and SCAT2 total 88.63. Collegiate/adults weighted means: symptoms 20.09, BESS25.54, SAC 27.51 and total SCAT2 91.20. Between-study and within-study variability similar to those ofthe high schoolers. Limited variability betweengenders. Only 2 studies report baseline andpostconcussion scores and 9 partial scores, butdata are too limited to provide weighted averagescores.Conclusions: Group mean baseline SCAT scoresfor high school and collegiate athletes are similar,with minimal gender differences; baseline symptomsshow more variability than other components. Thereare minimal data for elementary students andprofessionals, no data for adult non-collegiateathletes. Two studies provide preconcussion andpostconcussion scores. No data on minimalsignificant clinical differences to guide players/coaches in withdrawing from a game in progressand deciding when recovery is complete and playcan be resumed. The SCAT needs supplementingwith clinical and neuropsychological return-to-playassessments.
INTRODUCTIONEffects of concussionConcussion is typically conceptualised withinthe range of mild brain injury and mayacutely affect cognitive functioning withamnesia, confusion, changes in attention,concentration, memory, information process-ing, learning and reaction time; cause head-aches, dizziness, nausea, vomiting and affectvision, sleep and emotions.1–8
The American Medical Society for SportsMedicine9 estimated 3.8 million concussions
What is already known?
▪ The Sport Concussion Assessment Tool (SCAT) isthe most widely concussion assessment test, butbefore this review no summary data were availableabout SCAT component scores or between-sample and within-sample heterogeneity.
What are the new findings?
▪ 21 studies provided SCAT 2/3 assessments andincluded 4978 athletes (1067 females, 3831males and 80 gender not stated).
▪ Only one study reported SCAT data for a profes-sional league (Finnish ice hockey players), thereare minimal data on elementary students and nodata on adult non-collegiate athletes.
▪ Each player of a contact sport should completethe SCAT preseason to establish a baselinescore.
▪ The studies with data on preconcussion andpostconcussion SCAT scores are too limited toprovide weighted average scores. A study ofrugby players during 62 games noted 52 con-cussions (44/1000 match hours) with 8 wit-nessed concussions, but 44 unwitnessedconcussions identified postmatch by theKing-Devick test.
Thomas RE, et al. BMJ Open Sport Exerc Med 2016;2:e000095. doi:10.1136/bmjsem-2015-000095 1
Open Access Systematic reviewby copyright.
on Decem
ber 10, 2021 by guest. Protected
http://bmjopensem
.bmj.com
/B
MJ O
pen Sport E
xerc Med: first published as 10.1136/bm
jsem-2015-000095 on 19 O
ctober 2016. Dow
nloaded from
occur in the USA annually, and 50% may be unreported.The rates of concussion per 1000 athlete exposuresranged from 0.17 to 0.23 in two reviews.9 10
Follow-upThe problems experienced by medical teams infollow-up are the often low percentages contactableseveral months after concussion,11–16 and thus we do notknow the percentages of individuals who remain withconsequences of concussion.
MeasurementIn choosing a concussion measurement tool, it is import-ant that it has excellent validity and reliability and mea-sures concussion in a wide range of sports, age groupsand both genders and be equally reliable at initialenquiry and follow-up.It is important to assess all concussions promptly and
prevent individuals returning to contact sports while con-cussed and especially important to assess subsequent con-cussions because a history of concussion is associated witha higher risk of subsequent concussions.9 17 Repeatedconcussions result in permanent structural changes/damage and lead to later brain disease.18 19
SCAT2/SCAT3Several measures have been used to assess concussion:the Postconcussion Scale, the Sport ConcussionAssessment Tool (SCAT), the Reporting InformationOnline, the Concussion Resolution Index and theGraded Symptom Checklist.20 The InternationalSymposia on Concussion in Sport Zurich Consensusstatement proposed the SCAT2 in 2009.21 The SCAT2includes (1) a 22-item symptom checklist (score of22=no symptoms), (2) a 2-item physical signs score (lossof consciousness, balance difficulties), a score of 2=noproblems, (3) the Glasgow Coma Scale (no symptoms=score of 15), (4) the Maddocks Score (five questionsabout how oriented the player is to the current situation,and the score is not included in the overall SCAT2score), (5) the Standardised Assessment of Concussion(SAC) (no symptoms=score of 30), (6) the modifiedBalance Error Scoring System (BESS) (score of 30=noerrors), (7) a Coordination examination of five finger-nose movements (maximum score 1) and (8) a delayedrecall of the component of the SAC which asks for repe-tition of six words (maximum score 5). The maximumSCAT2 score is 100. Each symptom can be rated 0–6 toproduce a maximum symptom severity score of 132,which is not considered for the SCAT2 total score.The 2012 Concussion in Sport Group (CISG)
Consensus meeting concluded that there is good evi-dence to support the use of each of the componentsscored independently (symptoms, symptom severity, neu-rocognitive function and balance) but no evidence tosupport the use of a total score.22–28 The individualmajor components of the SCAT (Symptoms, Balance,SAC) have good validity and reliability. Owing to its wide
relevance to many sports and ongoing development, theSCAT is likely to be the key concussion assessment tooland for these reasons is the focus of this review.
Purpose of this systematic reviewIdentify all Sport Concussion Assessment Tool (SCAT2/3) studies and compare baseline and postconcussionresults.
METHODSSearch strategyThe following databases were searched using predeter-mined search strategies discussed between the librarian,principal investigator and coinvestigators: MEDLINE,EMBASE, EBM Reviews (Cochrane Database ofSystematic Reviews, ACP Journal Club, Database ofAbstracts of Reviews of Effects, Cochrane CentralRegister of Controlled Trials, Cochrane MethodologyRegister, Health Technology Assessment, NHS EconomicEvaluation Database), PubMed, PubMed Central, Web ofScience, CINAHL, SPORTDiscus, Family & SocietyStudies Worldwide, Family Studies Abstracts and HealthSource—Nursing/Academic Edition. In addition, ninegrey literature resources were consulted, includingGoogle, Google Scholar, OpenDOAR (http://www.opendoar.org), Health Sciences Online (HSO) (http://www.hso.info), ProQuest Dissertations & Theses, OAISter(http://oaister.worldcat.org), Sports Concussion Institute(http://concussiontreatment.com), Brain TraumaFoundation (https://www.braintrauma.org) and theCanadian Concussion Collaborative (http://casem-acmse.org/education/ccc). No limits on publication date wereapplied, and the search included studies in all languagesand from all countries. All included studies were individu-ally entered in the PubMed single citation matcher, andall relevant citation chains followed up to identify anyrelevant references.
Eligibility criteriaOn the basis of the information in the abstract, studieshad to provide partial or complete SCAT 2 or 3 data and73 studies were read in full-text.
Data extraction and analysisAll study titles and abstracts were read independentlyand data extracted independently by two reviewers(RET, then either JA or RM) and included if theauthors reported partial or complete SCAT2 or SCAT3numerical outcomes.
Data analysisFor the high school and collegiate age groups and bothgenders weighted means (according to sample size)were computed for SCAT2 and its components. Therewere insufficient data for separate computations forelementary school children,29 professional athletes30
and SCAT 3 scores (table 3); and preconcussion and
2 Thomas RE, et al. BMJ Open Sport Exerc Med 2016;2:e000095. doi:10.1136/bmjsem-2015-000095
Open Accessby copyright.
on Decem
ber 10, 2021 by guest. Protected
http://bmjopensem
.bmj.com
/B
MJ O
pen Sport E
xerc Med: first published as 10.1136/bm
jsem-2015-000095 on 19 O
ctober 2016. Dow
nloaded from
postconcussion scores were compared only for the twostudies that provided them. Only one study includeddata for elementary students (age 9–10 years old)29
(table 2), one study provided data for players in a profes-sional league30 (table 3) and the SCAT3 studies are toofew to permit computation of weighted means; all thesedata are presented in the tables without further analysis.
Risk of bias assessmentTo assess the overall risk of bias in the selected studiesand permit stratification of studies by risk of bias,assessment was performed using the Newcastle-OttawaScale (NOS),31 developed to assess the quality of non-randomised studies in meta-analysis. Each study wasassessed by two reviewers (RET then either JE or RM)with disagreements resolved by rounds of discussions.Each study was assessed for three components: theselection of the study groups; the comparability of thegroups and the ascertainment of either the exposureor outcome of interest for case–control or cohortstudies.
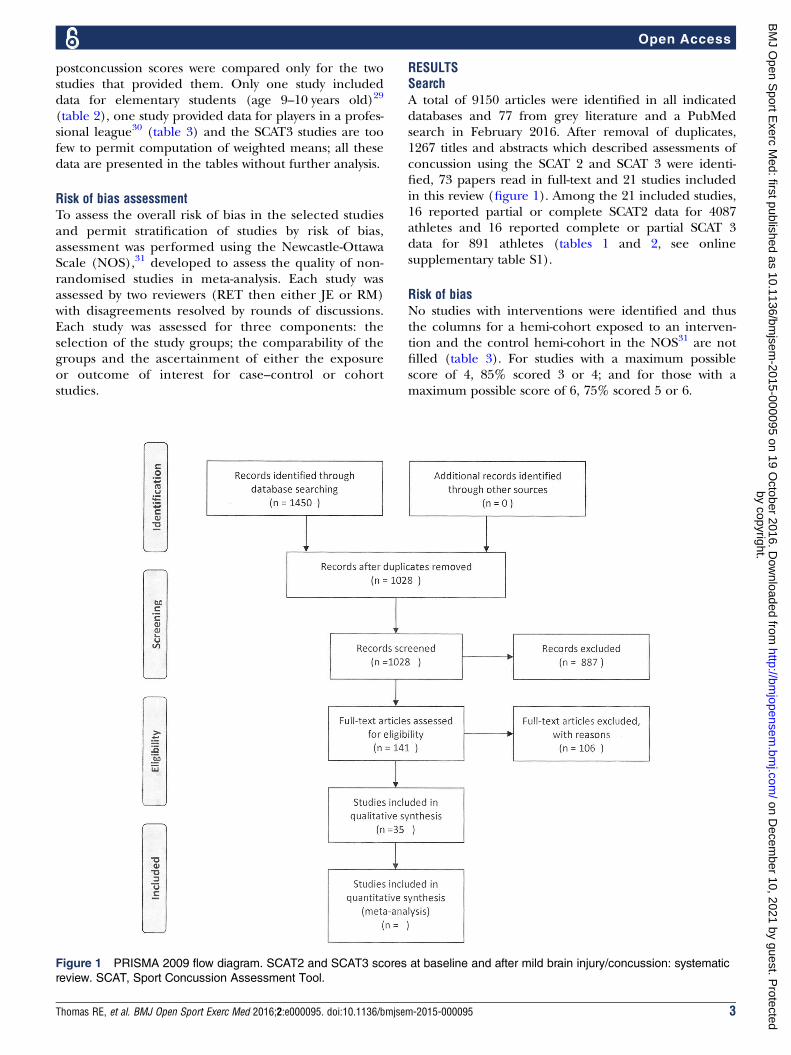
RESULTSSearchA total of 9150 articles were identified in all indicateddatabases and 77 from grey literature and a PubMedsearch in February 2016. After removal of duplicates,1267 titles and abstracts which described assessments ofconcussion using the SCAT 2 and SCAT 3 were identi-fied, 73 papers read in full-text and 21 studies includedin this review (figure 1). Among the 21 included studies,16 reported partial or complete SCAT2 data for 4087athletes and 16 reported complete or partial SCAT 3data for 891 athletes (tables 1 and 2, see onlinesupplementary table S1).
Risk of biasNo studies with interventions were identified and thusthe columns for a hemi-cohort exposed to an interven-tion and the control hemi-cohort in the NOS31 are notfilled (table 3). For studies with a maximum possiblescore of 4, 85% scored 3 or 4; and for those with amaximum possible score of 6, 75% scored 5 or 6.
Figure 1 PRISMA 2009 flow diagram. SCAT2 and SCAT3 scores at baseline and after mild brain injury/concussion: systematic
review. SCAT, Sport Concussion Assessment Tool.
Thomas RE, et al. BMJ Open Sport Exerc Med 2016;2:e000095. doi:10.1136/bmjsem-2015-000095 3
Open Accessby copyright.
on Decem
ber 10, 2021 by guest. Protected
http://bmjopensem
.bmj.com
/B
MJ O
pen Sport E
xerc Med: first published as 10.1136/bm
jsem-2015-000095 on 19 O
ctober 2016. Dow
nloaded from

Table 1 SCAT2 scores at baseline
Baseline scores
Author
and date,
country Participants
Symptom score (SD) (perfect
score=no symptoms=22 points);
symptom severity score
(max=132)
BESS (Balance) total (SD) (perfect
score=30 points)
SAC total (SD) (perfect
score=30 points)
SCAT2 scores (SD) (perfect
score=100)
SCAT 2 scores: high schoolers
Echlin,
2010,
Canada
67 male junior male hockey players 18.2 (1.2) years);
21 concussions medically observed during 51 games
25.73 25.75
Glaviano,
2015, USA
(n=361; 195m, 166f); private school, 9 different
sports; grades 7–12; avg age 14.6 years
Symptom score avg 20.32 Avg 26.88 Avg 26.73;
12-year-olds had the lowest
% of correct responses for
5 digit (46%), 6 digit (21%)
and months backwards
(67%) tasks
Avg 92.5
Males 20.6
(2.0); symptom
severity males:
19.8 (3.9)
Females 20
(2.2);
symptom severity
females: 19.1
(3.8)
Males 26.6 (2.6) Females 27.2 (2.3) Males 26.6 (2.2) Females
26.9
(2.0)
Males
92.0 (3.7)
Females 92.2 (3.8)
Jinguji,
2012*
(n=214; 155m, 59f); Seattle high school athletes and
NW soccer camps
19.75 (3.28) 25.82 (3.45) 25.52 (3.06) 88.99 (7.96)
Mayfield,
2013, USA
(Subset of
Valovich
McLeod
2012)
(n=119; 102m, 15f, 2 gender missing); age 15.8 (1.2)
years
High school athletes participating in interscholastic
contact sports
16.4 (5.4) 27.0 (3.4) 26.6 (2.6) 86.0
Snyder,
2014, USA
(n=761; 656m, 105f); 9–18 years. Students attended
medical offices for qualifying physical exams
Ages 9–10=18.59 (4.5) Ages 9–10=23.73 (3.57) Ages 9–10=24.22 (2.61) Ages 9–10=84.35 (7.55)
Ages 11–12=19.09 (3.77) Ages 11–12=25.03 (3.43) Ages 11–12=25.26 (2.48) Ages 11–12=87.25 (5.47)
Ages 13–14=19.85 (3.17) Ages 13–14=24.86 (3.4) Ages 13–14=24.7 (3.01) Ages 13–14=87.35 (5.87)
Ages 15–16=20.28 (2.73) Ages 15–16=25.28 (3.58) Ages 15–16=25.26 (2.83) Ages 15–16=88.77 (5.31)
Ages 17–18=20.42 (3.06) Ages 17–18=25.4 (3.48) Ages 17–18=25.47 (2.7) Ages 17–18=89.43 (5.53)
Weighted average ages 9–
18=19.85
Weighted average ages 9–18=24.91 Weighted average ages 9–
18=24.95
Weighted average ages
9–18=87.58
Valovich
McLeod,
2012,
USA†
(n=1134; 872m, 262f); high school athletes 16.9 (5.3) 26.7 (2.9) 26.5 (2.6) 88.3 (6.8)
Weighted
averages‡
2589 (1980m, 607f)§ 18.46 26.14 26.00 88.63
SCAT 2 scores: collegiate/university/adult non-collegiate
Galetta,
2013, USA
(n=27) male professional ice hockey team, average
age 28±5
22; severity score=0 28 (range 25–30)
Mrazik,
2013,
Canada
(SCAT2)
(n=125; 84m, 41f)
undergraduates (95 collegiate athletes and 30
recreational athletes) (14 had concussion history, all
more than 60 days previously)
Avg 17.81;
Sport group:
Team sport baseline: 18.6 (4.3)
Individual sport: 16.7 (5.5)
After Leger test: Team 13.5 (8.1),
individual 7.6 (10.3)
Fitness level: baseline
High 19.2 (4.2), low 14.9 (5.2); After
Leger test: high 12.9 (9.0), low 6.3
(9.4)
n/a n/a n/a
Continued
4Thom
asRE,etal.BM
JOpen
SportExercMed
2016;2:e000095.doi:10.1136/bmjsem
-2015-000095
OpenAccess
by copyright. on December 10, 2021 by guest. Protected http://bmjopensem.bmj.com/ BMJ Open Sport Exerc Med: first published as 10.1136/bmjsem-2015-000095 on 19 October 2016. Downloaded from
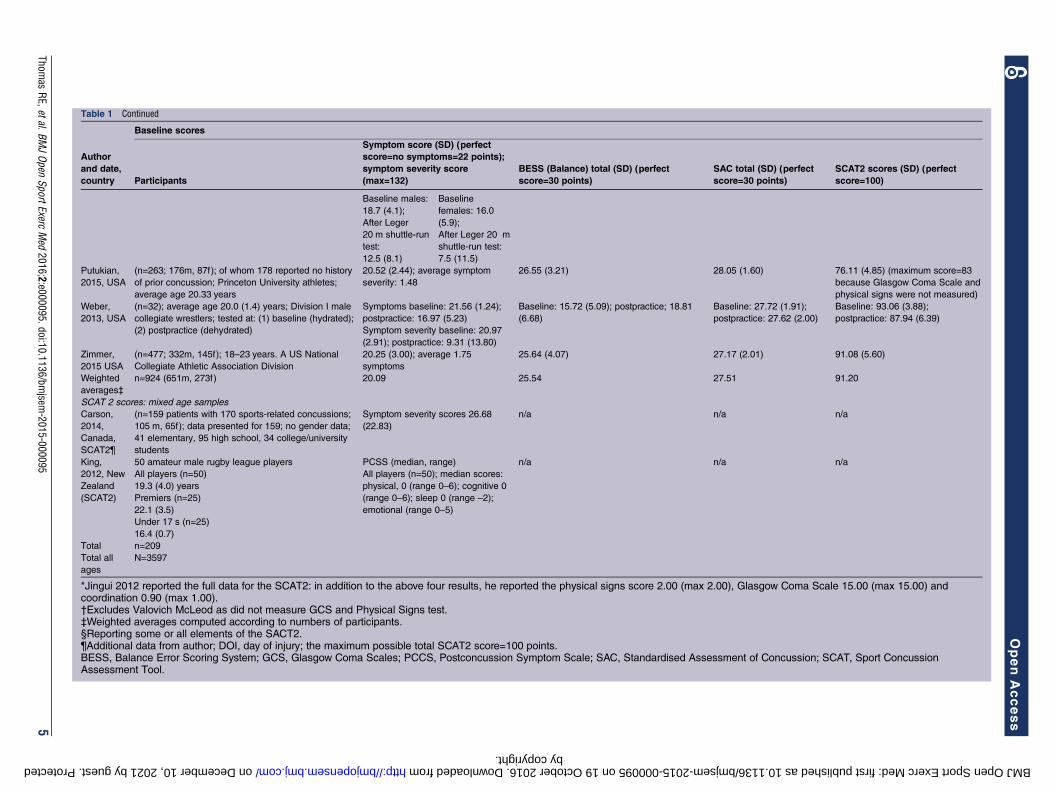
Table 1 Continued
Baseline scores
Author
and date,
country Participants
Symptom score (SD) (perfect
score=no symptoms=22 points);
symptom severity score
(max=132)
BESS (Balance) total (SD) (perfect
score=30 points)
SAC total (SD) (perfect
score=30 points)
SCAT2 scores (SD) (perfect
score=100)
Baseline males:
18.7 (4.1);
After Leger
20 m shuttle-run
test:
12.5 (8.1)
Baseline
females: 16.0
(5.9);
After Leger 20 m
shuttle-run test:
7.5 (11.5)
Putukian,
2015, USA
(n=263; 176m, 87f); of whom 178 reported no history
of prior concussion; Princeton University athletes;
average age 20.33 years
20.52 (2.44); average symptom
severity: 1.48
26.55 (3.21) 28.05 (1.60) 76.11 (4.85) (maximum score=83
because Glasgow Coma Scale and
physical signs were not measured)
Weber,
2013, USA
(n=32); average age 20.0 (1.4) years; Division I male
collegiate wrestlers; tested at: (1) baseline (hydrated);
(2) postpractice (dehydrated)
Symptoms baseline: 21.56 (1.24);
postpractice: 16.97 (5.23)
Symptom severity baseline: 20.97
(2.91); postpractice: 9.31 (13.80)
Baseline: 15.72 (5.09); postpractice; 18.81
(6.68)
Baseline: 27.72 (1.91);
postpractice: 27.62 (2.00)
Baseline: 93.06 (3.88);
postpractice: 87.94 (6.39)
Zimmer,
2015 USA
(n=477; 332m, 145f); 18–23 years. A US National
Collegiate Athletic Association Division
20.25 (3.00); average 1.75
symptoms
25.64 (4.07) 27.17 (2.01) 91.08 (5.60)
Weighted
averages‡
n=924 (651m, 273f) 20.09 25.54 27.51 91.20
SCAT 2 scores: mixed age samples
Carson,
2014,
Canada,
SCAT2¶
(n=159 patients with 170 sports-related concussions;
105 m, 65f); data presented for 159; no gender data;
41 elementary, 95 high school, 34 college/university
students
Symptom severity scores 26.68
(22.83)
n/a n/a n/a
King,
2012, New
Zealand
(SCAT2)
50 amateur male rugby league players
All players (n=50)
19.3 (4.0) years
Premiers (n=25)
22.1 (3.5)
Under 17 s (n=25)
16.4 (0.7)
PCSS (median, range)
All players (n=50); median scores:
physical, 0 (range 0–6); cognitive 0
(range 0–6); sleep 0 (range –2);
emotional (range 0–5)
n/a n/a n/a
Total n=209
Total all
ages
N=3597
*Jingui 2012 reported the full data for the SCAT2: in addition to the above four results, he reported the physical signs score 2.00 (max 2.00), Glasgow Coma Scale 15.00 (max 15.00) andcoordination 0.90 (max 1.00).†Excludes Valovich McLeod as did not measure GCS and Physical Signs test.‡Weighted averages computed according to numbers of participants.§Reporting some or all elements of the SACT2.¶Additional data from author; DOI, day of injury; the maximum possible total SCAT2 score=100 points.BESS, Balance Error Scoring System; GCS, Glasgow Coma Scales; PCCS, Postconcussion Symptom Scale; SAC, Standardised Assessment of Concussion; SCAT, Sport ConcussionAssessment Tool.
Thomas
RE,etal.BMJOpen
SportExercMed
2016;2:e000095.doi:10.1136/bmjsem
-2015-0000955
OpenAccess
by copyright. on December 10, 2021 by guest. Protected http://bmjopensem.bmj.com/ BMJ Open Sport Exerc Med: first published as 10.1136/bmjsem-2015-000095 on 19 October 2016. Downloaded from

Generalisability of the studiesThe most representative study reported on 304 of all the427 professional male ice hockey league players inFinland (the only study which reported professionals).Five studies focused on one sport: Echlin et al32 (67junior hockey players), King et al33 (37 rugby unionplayers), King et al34 (104 rugby union and rugby leagueplayers), King et al35 (50 rugby league) and Weber et al36
(32 wrestlers). Two studies combined reports on twosports: Jennings et al37 (71 footballers and baseballplayers) and Galetta et al38 (332 ice hockey and lacrosseplayers). Four studies reported individuals seen in con-cussion clinics.39–42 The rest reported participants inmultiple sports with up to nine different sports.43
Variability within and between studiesWeighted mean SCAT 2 scores were similar for the highschool and collegiate/university/adult non-universityathletes (table 4).Symptom scores showed more variability between
samples than the other SCAT2 components. For highschool children, the lowest mean SCAT symptom scores(22=no symptoms) were 12.5 (Baker40) 16.4 (Mayfield)48
and 16.9 (Valovich McLeod)27 with the SDs rangingfrom 2 to 6.7. The lowest mean BESS score was 23.73(Snyder and Bauer29 for those aged 9–10); SDs rangedfrom 2.0 to 3.58. The lowest mean SAC score was 24.2229
for those aged 9 and 10; SDs ranged from 1.9 to 3.01.The lowest mean SCAT2 total score was 84.35;29 SDsranged from 3.7 to 7.55 (Snyder and Bauer29 for thoseaged 9 and 10), whereas in some studies (eg, Zimmeret al44) there was minimal variability. For collegiate/adultathletes between-study and within-study variability weresimilar to those of the high school children. For the twoSCAT3 studies that provided complete data, Finnish icehockey players30 had symptom scores of 20.5, BESS of28.0 and SAC of 27.0 and for Benedict et al39 14, 24.1,and 27.
Variability in SAC scoresThree studies identified inaccuracy in repetition tasksthat might account for variability in SAC scores. Among13–15-year-old boys, 69% could repeat 4 digits correctly,37% 5 digits, 12% 6 digits and 57% could say themonths of the year backwards.45 Among 16–19-year-oldmales 79% could repeat 4 digits correctly, 37% 6 digits,21% 6 digits and 70% could say the months of the yearbackwards.45 Among 12-year-old boys 85% repeated 4digits correctly, 65% 5 digits, 31% 6 digits and 65%could say the months of the year backwards.43 Among18-year-old men 100% repeated 4 digits correctly, 82% 5digits, 72% 6 digits and 82% could say the months ofthe year backwards.43 Among college athletes (averageage 20, range 17–32) SAC scores were higher than for
Table 2 SCAT3 scores at baseline
Author,
date,
country Participants
Symptom score (SD) (perfect
score=no symptoms=22
points); symptom severity
score (max=132)
BESS (Balance)
total (SD) (perfect
score=30 points)
SAC total (SD)
(perfect score=30
points)
Elementary students
Jennings,
2015, USA
(n=71); males; age 10.2 (1.2)
years (1) contact sport group
= football; baseline = 59, post-
season (n=54); non-contact
sport group = baseball C
baseline n−28; post season(n=13)
(not reported) Contact group;
baseline: 27.39
(2.4); postseason:
27.61 (2.0)
Non-contact group:
baseline: 27.92
(1.8); postseason
28.31 (1.6)
Contact group:
baseline 24.3 (1.9);
postseason 25.5
(3.1)
Non-contact group:
baseline 24.69
(2.2); postseason
24.08 (2.3)
Collegiate/adults
Hänninen,
2015,
Finland
(n=304); males; 25.3 (5.2)
years, 16–40 years; 60.1%
(n=181) reported one or more
previous concussions;
average number of
concussions sustained prior to
testing: 1.2 (1.4), range=0–12;
professional male ice hockey
players (total in league=427)
20.5 (2.7) (range 0–21.0)
Symptom severity 2.3
(5.2) (range 0–61.0)
28.0 (2.5)
(range 0–20.0)
27.0 (1.7)
(range 19.0–30.0)
Galetta,
2015, USA
(n=332; 270m, 62f): 243
youth 5–15 ice hockey and
lacrosse leagues; 89 18–23
university athletes)
(not reported) (not reported) 26 (range 10–30);
youth 26
(range 10–30);
collegiate 28
(range 21–30)
BESS, Balance Error Scoring System; SAC, Standardised Assessment of Concussion.
6 Thomas RE, et al. BMJ Open Sport Exerc Med 2016;2:e000095. doi:10.1136/bmjsem-2015-000095
Open Accessby copyright.
on Decem
ber 10, 2021 by guest. Protected
http://bmjopensem
.bmj.com
/B
MJ O
pen Sport E
xerc Med: first published as 10.1136/bm
jsem-2015-000095 on 19 O
ctober 2016. Dow
nloaded from

Table 3 Assessments of risk of bias in included studies, according to the NOS
Selection Comparability Outcome
Author, date
Representativeness
of exposed
cohorts†
Selection of
nonexposed
cohort‡
Ascertainment
of exposure§
Demonstration
outcome of
interest not
present study
start¶
Comparability
of cohorts:
assessment
tool‡
Comparability
of cohorts:
other factors‡
Assessment
of outcome
Follow-up
long
enough
for
outcomes
to occur**
Adequacy
of
follow-up
of
cohorts**
Potential
maximum
score
Actual
score
Studies providing complete preconcussion or preconcussion and postconcussion data
Benedict, 2015 0 * * * N/A N/A 4 3
Glaviano, 2015 0 * * * N/A N/A 4 3
Hänninen, 2015 * * * * N/A N/A 4 4
Jinguji, 2012 0 * * * N/A N/A 4 3
Mayfield, 2013 * * * * * * 6 6
Putukian, 2015 0 * * * * * 6 5
Snyder, 2014 * * * * N/A N/A 4 4
Valovich McLeod,
2012
* * * * N/A N/A 4 4
Weber, 2013 * * * * N/A N/A 4 4
Zimmer, 2015 * * * * N/A N/A 4 4
Studies presenting partial data
Baker, 2015 0 * 0 0 N/A N/A 4 1
Carson, 2014 0 * 0 * 0 0 6 2
Echlin, 2010 0 * * * * * 6 5
Galetta, 2013 0 * 0 0 * 0 6 2
Galetta, 2015 * * 0 * * * 6 5
Jennings, 2015 * * * 0 N/A N/A 4 3
King, 2012 0 * * * * * 6 5
King, 2013 0 * * * * * 6 5
King, 2015 0 * 0 * N/A N/A 4 2
Miller, 2015 0 * * * N/A N/A 4 3
Mrazik, 2013 0 * * * N/A N/A 4 3
N/A=study performed a baseline assessment and planned no follow-up SCAT assessment, or follow-up data are not related to concussion ( Jennings et al37 compared preseason to postseasonSAC and BESS scores, Mrazik et al47 compared players before and after the 20 m Leger shuttle-run test and Weber (2013) compared wrestlers at baseline to postpractice when they weredehydrated).†Is the exposed (preteenaged to high school population with active sports participation assessed with SCAT2 or SCAT3 tools) cohort truly or somewhat representative of young athletes whosuffer sports-related concussions/are exposed to sports-related concussions?‡Because this review identified no studies with interventions, none included a hemi-cohort exposed to an intervention and a hemi-cohort which was the control.§Exposure is defined as a competitive athlete who has received a complete or partial SCAT2 or SCAT3 assessment.¶Players were specifically asked if they had a recent concussion before the SCAT was administered; or if they were in a concussed group whether they also had a more recent concussion beforetesting.** Single asterisk=complete follow-up, OR if participants lost to follow-up were unlikely to introduce bias (according to NOS instructions).BESS, Balance Error Scoring System; NOS, Newcastle-Ottawa Scale; SAC, Standardised Assessment of Concussion; SCAT, Sport Concussion Assessment Tool; SCAT, Sport ConcussionAssessment Tool.
Thomas
RE,etal.BMJOpen
SportExercMed
2016;2:e000095.doi:10.1136/bmjsem
-2015-0000957
OpenAccess
by copyright. on December 10, 2021 by guest. Protected http://bmjopensem.bmj.com/ BMJ Open Sport Exerc Med: first published as 10.1136/bmjsem-2015-000095 on 19 October 2016. Downloaded from

high school students (eg, 51% for 6 digits and 92%months of the year).46 Female data were similar.46
Variability in scores before and after tasks withoutconcussionOne study reported differences in symptoms after exer-cise (females symptom score 16.0 pre-exercise, femalessymptom score 11.5 after Leger 20 metre shuttle runtest. Males symptoms score 18.7 pre-exercise, malessymptom score 12.5 postexercise)47 while another studydid not (total symptoms (21.56, 20.97), BESS (15.72,18.81), SAC (27.72, 27.62) and SCAT2 total (93.06,87.94)).36
Rates of detection of concussionKing et al33 found that during amateur rugby unionmatches five concussions were identified by a nurse atthe pitch (average SCAT2 60.6, SD 4.2) but 17 wereidentified later by the King-Devick test with muchhigher SCAT2 total scores: (total SCAT2 84.2, SD 9.6).King et al34 during rugby union and league games notedeight witnessed concussions: total symptoms (8.6, SD3.7), BESS (17.5, SD 3.4), SAC (23.0, SD 2.1) and 44unwitnessed concussions with a difference only in thosewith lower BESS scores: total symptoms (8.6, SD 4.8),BESS (12.5, SD 6.2) and SAC 23.5, SD 3.1).
Studies of concussed playersOnly two studies report baseline and postconcussion
scores (see online supplementary table S1). Mayfieldet al48 reported data from the day of concussion to the10th day after concussion for 119 concussed athletes andfound most improvement in symptom scores: baselinetotal symptoms were 16.54 (day of impact 10.9; day 3 14.8; day 10 19.9); BESS baseline 27.0 (day of impact 24.5;day 3 26.0; day 10 27.4); SAC baseline 26.6 (day ofimpact 25.2; day 3 26.3; day 10 26.6) and total SCAT2baseline 88.00 (day of impact 77.76; day 3 84.74; day 1091.68). Putukian et al49 for 32 concussed players foundtheir baseline Total Symptom Score was 19.44 and post-concussion 13.00, BESS 26.13 and 24.54, SAC 27.63 and27.13 and SCAT2 total (excluding the Glasgow ComaScale and physical signs) 74.16 and 65.28. The weightedaverages for these two studies combined show anincrease in postconcussion of 8 symptoms, a decrease of2.3 on the BESS and an increase of 1 on the SAC. Ninestudies report partial data for concussed players (see
online supplementary table S1), and the incompletepreconcussion and postconcussion data are insufficientto provide reliable weighted average SCAT scores.
Gender differencesThere were sufficient gender data to compute weightedmean SCAT2 scores only for high school students andthese showed minimal differences between genders. Forfemales weighted mean symptom scores were 18.44(males 18.86), BESS scores 26.75 (males 25.89), SACscores 26.76 (males 26.03), and total SCAT 2 scores90.10 (males 88.79) (table 5).
DISCUSSIONAmount of published SCAT2/3 dataThis systematic review includes SCAT data from 4978 ath-letes. Most studies (n=16) provided partial or completeSCAT2 data, and five provided partial or completeSCAT3 data. There are limited data for elementary stu-dents, data only for one professional league and nonefor adult non-collegiate athletes. Generalisability washighest for a study of Finnish professional male icehockey which assessed most players in the league30 andlowest for studies of individual schools or groups includ-ing many sports. SCAT component average scores werehomogeneous between samples, but there was consider-able heterogeneity within samples. Available studiessuggest no strong differences between genders.
Limited data postconcussionThere are limited data on concussion. Only two studies(n=151) provided preconcussion and postconcussiondata. A study of 104 rugby players during 62 gamesnoted 52 concussions (44/1000 match hours) with 8 wit-nessed concussions, but 44 unwitnessed concussionswhich were identified postmatch by the King-Devicktest.34
Preseason baseline SCAT scoresGroup averages are not perfect scores on all SCAT com-ponents preseason because some athletes had pre-existing symptoms (eg, headache) or because some ath-letes had problems with test items (eg, repeating serialnumbers backwards). Thus, it is important to test playersat least preseason and also during the season to detectunwitnessed concussions.
Table 4 Weighted mean SCAT2 scores by the age group
Age group
Symptom score (SD)
(perfect score=no
symptoms=22 points)
BESS (Balance) total
(SD) (perfect
score=30 points)
SAC total (SD)
(perfect score=30
points)
SCAT2 scores (SD)
(perfect
score=100)
High school students 18.46 26.14 26.00 88.63
Collegiate/university/
adult non-university
20.09 25.54 27.51 91.20
BESS, Balance Error Scoring System; SAC, Standardised Assessment of Concussion; SCAT, Sport Concussion Assessment Tool.
8 Thomas RE, et al. BMJ Open Sport Exerc Med 2016;2:e000095. doi:10.1136/bmjsem-2015-000095
Open Accessby copyright.
on Decem
ber 10, 2021 by guest. Protected
http://bmjopensem
.bmj.com
/B
MJ O
pen Sport E
xerc Med: first published as 10.1136/bm
jsem-2015-000095 on 19 O
ctober 2016. Dow
nloaded from
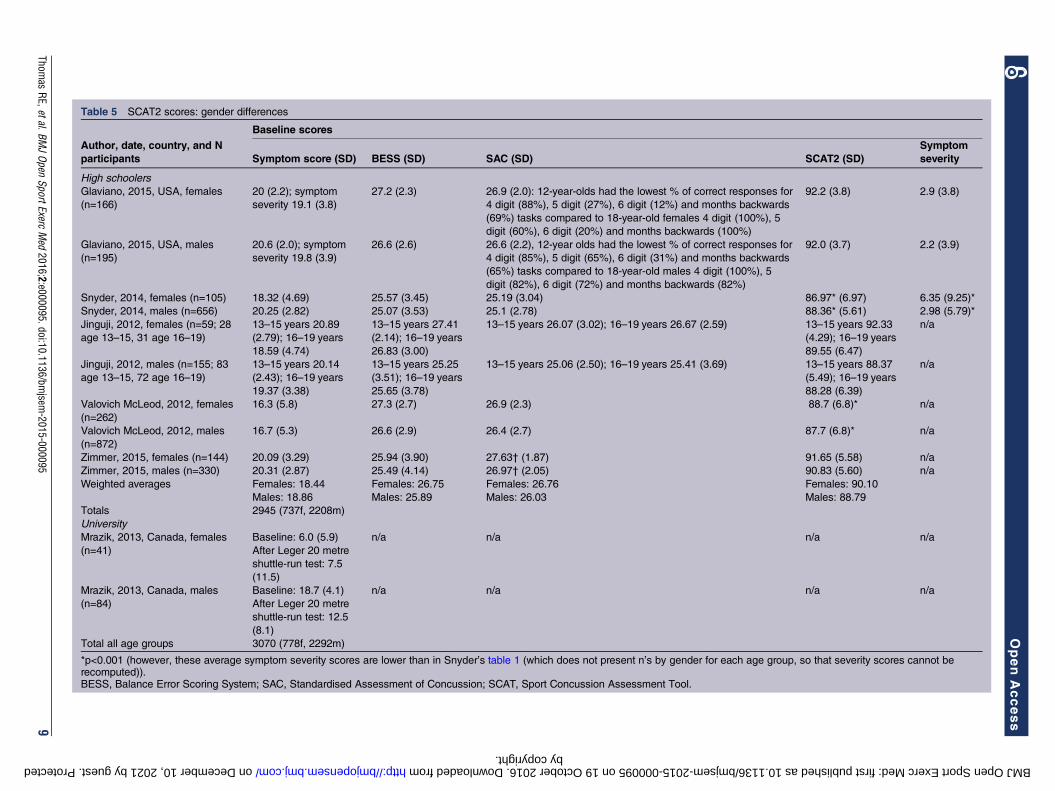
Table 5 SCAT2 scores: gender differences
Baseline scores
Author, date, country, and N
participants Symptom score (SD) BESS (SD) SAC (SD) SCAT2 (SD)
Symptom
severity
High schoolers
Glaviano, 2015, USA, females
(n=166)
20 (2.2); symptom
severity 19.1 (3.8)
27.2 (2.3) 26.9 (2.0): 12-year-olds had the lowest % of correct responses for
4 digit (88%), 5 digit (27%), 6 digit (12%) and months backwards
(69%) tasks compared to 18-year-old females 4 digit (100%), 5
digit (60%), 6 digit (20%) and months backwards (100%)
92.2 (3.8) 2.9 (3.8)
Glaviano, 2015, USA, males
(n=195)
20.6 (2.0); symptom
severity 19.8 (3.9)
26.6 (2.6) 26.6 (2.2), 12-year olds had the lowest % of correct responses for
4 digit (85%), 5 digit (65%), 6 digit (31%) and months backwards
(65%) tasks compared to 18-year-old males 4 digit (100%), 5
digit (82%), 6 digit (72%) and months backwards (82%)
92.0 (3.7) 2.2 (3.9)
Snyder, 2014, females (n=105) 18.32 (4.69) 25.57 (3.45) 25.19 (3.04) 86.97* (6.97) 6.35 (9.25)*
Snyder, 2014, males (n=656) 20.25 (2.82) 25.07 (3.53) 25.1 (2.78) 88.36* (5.61) 2.98 (5.79)*
Jinguji, 2012, females (n=59; 28
age 13–15, 31 age 16–19)
13–15 years 20.89
(2.79); 16–19 years
18.59 (4.74)
13–15 years 27.41
(2.14); 16–19 years
26.83 (3.00)
13–15 years 26.07 (3.02); 16–19 years 26.67 (2.59) 13–15 years 92.33
(4.29); 16–19 years
89.55 (6.47)
n/a
Jinguji, 2012, males (n=155; 83
age 13–15, 72 age 16–19)
13–15 years 20.14
(2.43); 16–19 years
19.37 (3.38)
13–15 years 25.25
(3.51); 16–19 years
25.65 (3.78)
13–15 years 25.06 (2.50); 16–19 years 25.41 (3.69) 13–15 years 88.37
(5.49); 16–19 years
88.28 (6.39)
n/a
Valovich McLeod, 2012, females
(n=262)
16.3 (5.8) 27.3 (2.7) 26.9 (2.3) 88.7 (6.8)* n/a
Valovich McLeod, 2012, males
(n=872)
16.7 (5.3) 26.6 (2.9) 26.4 (2.7) 87.7 (6.8)* n/a
Zimmer, 2015, females (n=144) 20.09 (3.29) 25.94 (3.90) 27.63† (1.87) 91.65 (5.58) n/a
Zimmer, 2015, males (n=330) 20.31 (2.87) 25.49 (4.14) 26.97† (2.05) 90.83 (5.60) n/a
Weighted averages Females: 18.44
Males: 18.86
Females: 26.75
Males: 25.89
Females: 26.76
Males: 26.03
Females: 90.10
Males: 88.79
Totals 2945 (737f, 2208m)
University
Mrazik, 2013, Canada, females
(n=41)
Baseline: 6.0 (5.9)
After Leger 20 metre
shuttle-run test: 7.5
(11.5)
n/a n/a n/a n/a
Mrazik, 2013, Canada, males
(n=84)
Baseline: 18.7 (4.1)
After Leger 20 metre
shuttle-run test: 12.5
(8.1)
n/a n/a n/a n/a
Total all age groups 3070 (778f, 2292m)
*p<0.001 (however, these average symptom severity scores are lower than in Snyder’s table 1 (which does not present n’s by gender for each age group, so that severity scores cannot berecomputed)).BESS, Balance Error Scoring System; SAC, Standardised Assessment of Concussion; SCAT, Sport Concussion Assessment Tool.
Thomas
RE,etal.BMJOpen
SportExercMed
2016;2:e000095.doi:10.1136/bmjsem
-2015-0000959
OpenAccess
by copyright. on December 10, 2021 by guest. Protected http://bmjopensem.bmj.com/ BMJ Open Sport Exerc Med: first published as 10.1136/bmjsem-2015-000095 on 19 October 2016. Downloaded from
Changes in SCAT scores during practice and playThere are only two studies which report how SCAT com-ponent scores change without a concussion whenplayers exercise or become exhausted during play, andmore studies are needed during game intermissions toassess the effects of play and exhaustion so that when aconcussion occurs the total change after a concussioncan be partitioned into the effects of play and concus-sion. General postevent testing (eg, King-Devick test) isimportant in identifying concussions which are missedor unwitnessed during gameplay.There are insufficient data on the longitudinal norma-
tive and abnormal range of SCAT performance in ath-letes, and this limits its current use as a science-baseddiagnostic and prognostic tool to guide players andcoaches when to stop players continuing during matchesand when to allow them to resume their sport.
Strengths and limitations of this reviewWe searched 18 databases and 9 grey literature resourceswithout limitation of language or date. We could notcombine data from elementary, high school and collegi-ate players because of the differences in physical size,the multiple sports played and individual sports resultsnot provided and likely differences in competitivenessand force of contacts. Instead, we report for each agegroup means weighted by the study sample sizes. Theeffects of heterogeneity within and between sampleswere thus not explored statistically. Owing to the limitedamount of data for many sports and age groups, theabsence of data for adult non-collegiate players and dataavailable only for one professional league, we were notable to draw conclusions for these groups.
CONCLUSIONSSCAT2/3 data are available for 4978 athletes, but thereare minimal data for elementary school students, profes-sional athletes and concussed athletes. There is no uni-formity across sports in preseason SCAT testing to obtainbaseline scores, numbers of observers to increase thelikelihood of detecting concussions during play or usingKing-Devick tests to detect unwitnessed concussions.There is an urgent need for systematic adoption of con-tinuous follow-up assessments including complete SCATand King-Devick testing in all age ranges of amateur andprofessional athletes participating in sports with risk ofconcussion and follow them if concussed until fullyrecovered. Minimum clinically important differences inSCAT scores37 have not been defined and would need tobe based on careful assessments by several assessors withminimal intraobserver and interobserver variability anddetailed follow-up of athletes to determine full recoveryand appropriate return to play. Until these problemshave been solved, the SCAT should be used cautiouslyfor clinical and return-to-play decision processes and becomplemented with an extensive medical examination
and quantitative neuropsychological testing providingobjective performance decrement data.
Acknowledgements The authors thank Dr Benedict and Carson for additionaldata.
Contributors RET conceived the systematic review, assessed titles andabstracts from the search, entered data into the review, computed data andwrote all drafts of the article. MMV conducted the searches. Titles/abstractswere assessed and data independently entered into the text and tables, andthe text was edited and amplified by JA, RM and MMV. All authors agree withthe final version of the article.
Competing interests None declared.
Provenance and peer review Not commissioned; externally peer reviewed.
Data sharing statement No additional data are available.
Open Access This is an Open Access article distributed in accordance withthe Creative Commons Attribution Non Commercial (CC BY-NC 4.0) license,which permits others to distribute, remix, adapt, build upon this work non-commercially, and license their derivative works on different terms, providedthe original work is properly cited and the use is non-commercial. See: http://creativecommons.org/licenses/by-nc/4.0/
REFERENCES1. Collie A, Makdissi M, Maruff P, et al. Cognition in the days following
concussion: comparison of symptomatic versus asymptomaticathletes. J Neurol Neurosurg Psychiatry 2006;77:241–5.
2. Guskiewicz KM, McCrea M, Marshall SW, et al. Cumulative effectsassociated with recurrent concussion in collegiate football players:the NCAA Concussion Study. JAMA 2003;290:2549–55.
3. Echemendia RJ, Julian LJ. Mild traumatic brain injury in sports:neuropsychology’s contribution to a developing field. NeuropsycholRev 2001;11:69–88.
4. Erlanger D, Saliba E, Barth J, et al. Monitoring resolution ofpostconcussion symptoms in athletes: preliminary results of aweb-based neuropsychological test protocol. J Athl Train2001;36:280–7.
5. Macciocchi SN, Barth JT, Alves W, et al. Neuropsychologicalfunctioning and recovery after mild head injury in collegiate athletes.Neurosurgery 1996;39:510–4.
6. Pardini D, Stump J, Lovell M, et al. The post-concussion symptomscale (PCSS): a factor analysis. Br J Sports Med 2004;38:661–2.
7. Pellman EJ, Viano DC, Casson IR, et al. Concussion in professionalfootball: injuries involving 7 or more days out—part 5. Neurosurgery2004;55:1100–19.
8. Williamson IJ, Goodman D. Converging evidence for theunder-reporting of concussions in youth ice hockey. Br J Sports Med2006;40:128–32; discussion 128–32.
9. Harmon KG, Drezner J, Gammons M, et al. American MedicalSociety for Sports Medicine position statement: concussion in sport.Clin J Sport Med 2013;23:1–18.
10. Pfister T, Pfister K, Hagel B, et al. The incidence of concussion inyouth sports: a systematic review and meta-analysis. Br J SportsMed 2016;50:292–7.
11. Pickering A, Grundy K, Clarke A, et al. A cohort study of outcomesfollowing head injury among children and young adults in full-timeeducation. Emerg Med J 2012;29:451–4.
12. Lowdon IM, Briggs M, Cockin J. Post-concussional symptomsfollowing minor head injury. Injury 1989;20:193–4.
13. Wade DT, Crawford S, Wenden FJ, et al. Does routine follow upafter head injury help? A randomised controlled trial. J NeurolNeurosurg Psychiatry 1997;62:478–84.
14. Wade DT, King NS, Wenden FJ, et al. Routine follow up after headinjury: a second randomised controlled trial. J Neurol NeurosurgPsychiatry 1998;65:177–83.
15. Elgmark Andersson E, Emanuelson I, Björklund R, et al. Mildtraumatic brain injuries: the impact of early intervention on latesequelae. A randomized controlled trial. Acta Neurochir (Wien)2007;149:151–9; discussion 160.
16. Jakola AS, Müller K, Larsen M, et al. Five-year outcome after mildhead injury: a prospective controlled study. Acta Neurol Scand2007;115:398–402.
17. King D, Brughelli M, Hume P, et al. Assessment, management andknowledge of sport-related concussion: systematic review. SportsMed 2014;44:449–71.
10 Thomas RE, et al. BMJ Open Sport Exerc Med 2016;2:e000095. doi:10.1136/bmjsem-2015-000095
Open Accessby copyright.
on Decem
ber 10, 2021 by guest. Protected
http://bmjopensem
.bmj.com
/B
MJ O
pen Sport E
xerc Med: first published as 10.1136/bm
jsem-2015-000095 on 19 O
ctober 2016. Dow
nloaded from

18. Gavett BE, Stern RA, McKee AC. Chronic traumatic encephalopathy:a potential late effect of sport-related concussive and subconcussivehead trauma. Clin Sports Med 2011;30:179–88, xi.
19. Riley DO, Robbins CA, Cantu RC, et al. Chronic traumaticencephalopathy: contributions from the Boston University Center forthe Study of Traumatic Encephalopathy. Brain Inj 2015;29:154–63.
20. Brown DA, Elsass JA, Miller AJ, et al. Differences in symptomreporting between males and females at baseline and after asports-related concussion: a systematic review and meta-analysis.Sports Med 2015;45:1027–40.
21. McCrory P, Meeuwisse W, Johnston K, et al. Consensus statementon concussion in sport—the Third International Conference onConcussion in Sport held in Zurich, November 2008. PhysSportsmed 2009;37:141–59.
22. Guskiewicz KM, Register-Mihalik J, McCrory P, et al.Evidence-based approach to revising the SCAT2: introducing theSCAT3. Br J Sports Med 2013;47:289–93.
23. McCrea M, Kelly JP, Kluge J, et al. Standardized assessment ofconcussion in football players. Neurology 1997;48:586–8.
24. McCrea M, Kelly JP, Randolph C, et al. Standardized assessment ofconcussion (SAC): on-site mental status evaluation of the athlete.J Head Trauma Rehabil 1998;13:27–35.
25. Koscs M, Kaminski TW, Swanik CB, et al. Effects of exertionalexercise on the Standardized Assessment of Concussion (SAC)Score. Athl Train Sports Health Care 2009;1:24–30.
26. Barr WB, McCrea M. Sensitivity and specificity of standardizedneurocognitive testing immediately following sports concussion.J Int Neuropsychol Soc 2001;7:693–702.
27. Valovich McLeod TC, Bay RC, Lam KC, et al. Representativebaseline values on the Sport Concussion Assessment Tool 2(SCAT2) in adolescent athletes vary by gender, grade, andconcussion history. Am J Sports Med 2012;40:927–33.
28. Riemann BL, Guskiewicz KM. Effects of mild head injury on posturalstability as measured through clinical balance testing. J Athl Train2000;35:19–25.
29. Snyder AR, Bauer RM, Health IMPACTS for Florida Network. Anormative study of the sport concussion assessment tool (SCAT2) inchildren and adolescents. Clin Neuropsychol 2014;28:1091–103.
30. Hänninen T, Tuominen M, Parkkari J, et al. Sport concussionassessment tool—3rd edition—normative reference values forprofessional ice hockey players. J Sci Med Sport 2016;19:636–41.
31. Wells G, Shea B, O’Connell D. The Newcastle-Ottawa Scale (NOS)for assessing the quality of nonrandomised studies inmeta-analyses. 2014. http://www.ohri.ca/programs/clinical_epidemiology/oxford.asp
32. Echlin PS, Tator CH, Cusimano MD, et al. A prospective study ofphysician-observed concussions during junior ice hockey:implications for incidence rates. Neurosurg Focus 2010;29:E4.
33. King D, Brughelli M, Hume P, et al. Concussions in amateur rugbyunion identified with the use of a rapid visual screening tool.J Neurol Sci 2013;326:59–63.
34. King D, Gissane C, Hume PA, et al. The King-Devick test wasuseful in management of concussion in amateur rugby union andrugby league in New Zealand. J Neurol Sci 2015;351:58–64.
35. King D, Clark T, Gissane C. Use of a rapid visual screening tool forthe assessment of concussion in amateur rugby league: a pilotstudy. J Neurol Sci 2012;320:16–21.
36. Weber AF, Mihalik JP, Register-Mihalik JK, et al. Dehydration andperformance on clinical concussion measures in collegiate wrestlers.J Athl Train 2013;48:153–60.
37. Jennings D, Sells P, Allison J, et al. Effects of a season ofsubconcussive contact on Child-Scat3 Scores in 8–12 year-old maleathletes. Int J Sports Phys Ther 2015;10:667–75.
38. Galetta KM, Morganroth J, Moehringer N, et al. Adding vision toconcussion testing: a prospective study of sideline testing in youthand collegiate athletes. J Neuroophthalmol 2015;35:235–41.
39. Benedict PA, Baner NV, Harrold GK, et al. Gender and age predictoutcomes of cognitive, balance and vision testing in amultidisciplinary concussion center. J Neurol Sci 2015;353:111–5.
40. Baker JG, Leddy JJ, Darling SR, et al. Factors associated withproblems for adolescents returning to the classroom aftersport-related concussion. Clin Pediatr (Phila) 2015;54:961–8.
41. Darling SR, Leddy JJ, Baker JG, et al. Evaluation of the ZurichGuidelines and exercise testing for return to play in adolescentsfollowing concussion. Clin J Sport Med 2014;24:128–33.
42. Miller JH, Gill C, Kuhn EN, et al. Predictors of delayed recoveryfollowing pediatric sports-related concussion: a case–control study.J Neurosurg Pediatr 2016;17:491–6.
43. Glaviano NR, Benson S, Goodkin HP, et al. Baseline SCAT2Assessment of healthy youth student-athletes: preliminary evidencefor the use of the child-SCAT3 in children younger than 13 years.Clin J Sport Med 2015;25:373–9.
44. Zimmer A, Marcinak J, Hibyan S, et al. Normative values of majorSCAT2 and SCAT3 components for a college athlete population.Appl Neuropsychol Adult 2015;22:132–40.
45. Jinguji TM, Bompadre V, Harmon KG, et al. Sport ConcussionAssessment Tool-2: baseline values for high school athletes.Br J Sports Med 2012;46:365–70.
46. Shehata N, Wiley JP, Richea S, et al. Sport concussion assessmenttool: baseline values for varsity collision sport athletes. Br J SportsMed 2009;43:730–4.
47. Mrazik M, Naidu D, Lebrun C, et al. Does an individual’s fitness levelaffect baseline concussion symptoms? J Athl Train 2013;48:654–8.
48. Mayfield R, Bay R, Valovich McLeod T. Postconcussion deficitsmeasured by the Sport Concussion Assessment Tool 2 amonginterscholastic athletes. Athl Train Sports Health Care2013;5:265–71.
49. Putukian M, Echemendia R, Dettwiler-Danspeckgruber A, et al.Prospective clinical assessment using Sideline ConcussionAssessment Tool-2 testing in the evaluation of sport-relatedconcussion in college athletes. Clin J Sport Med 2015;25:36–42.
Thomas RE, et al. BMJ Open Sport Exerc Med 2016;2:e000095. doi:10.1136/bmjsem-2015-000095 11
Open Accessby copyright.
on Decem
ber 10, 2021 by guest. Protected
http://bmjopensem
.bmj.com
/B
MJ O
pen Sport E
xerc Med: first published as 10.1136/bm
jsem-2015-000095 on 19 O
ctober 2016. Dow
nloaded from