open access bridging data management and knowledge
TRANSCRIPT
28 The Open Bioinformatics Journal, 2008, 2, 28-36
1875-0362/08 2008 Bentham Open
Open Access
Bridging Data Management and Knowledge Discovery in the Life Sciences
Karl Kugler*,1, Maria Mercedes Tejada
2, Christian Baumgartner
2, Bernhard Tilg
2, Armin Graber
1
and Bernhard Pfeifer*,2
1Institute for Bioinformatics, University for Health Sciences, Medical Informatics and Technology, Austria
2Institute of Biomedical Engineering, University for Health Sciences, Medical Informatics and Technology, Austria
Abstract: In this work we present an application for integrating and analyzing life science data using a biomedical data
warehouse system and tools developed in-house enabling knowledge discovery tasks. Knowledge discovery is known as a
process where different steps have to be coupled in order to solve a specified question. In order to create such a combina-
tion of steps, a data miner using our in-house developed knowledge discovery tool KD3 is able to assemble functional ob-
jects to a data mining workflow. The generated workflows can easily be used for ulterior purposes by only adding new
data and parameterizing the functional objects in the process. Workflows guide the performance of data integration and
aggregation tasks, which were defined and implemented using a public available open source tool. To prove the concept
of our application, intelligent query models were designed and tested for the identification of genotype-phenotype correla-
tions in Marfan Syndrome. It could be shown that by using our application, a data miner can easily develop new knowl-
edge discovery algorithms that may later be used to retrieve medical relevant information by clinical researchers.
1. INTRODUCTION
During the past years, the use of high-throughput assays and the formation of new life science related omic research fields, have led to an increase in the amount of data being produced by biomedical experiments. Until a few years ago the workbench experiment took most of the time and pro-duced a quantity of data, which could be processed non-automatically in most cases [1]. Nowadays, this ratio has reversed. Modern techniques like microarrays or HPLC-MS produce an enormous data output in little time, causing a need for automated data processing and integration methods. One approach for integrating and making the data harvesta-ble is to implement a data warehouse. The following pages shall present one possible usage of data warehousing tech-nologies in a biological research environment.
A data warehouse is a central collection or repository for persistently storing analysis relevant data and information [2-5]. Scattered and smothered under gigabytes and terabytes of data, useful information may be hidden. Data warehouses coupled with intelligent search algorithms, data mining ap- proaches and data discovery toolboxes enable collecting and processing these data in order to turn them into useful information and new knowledge [4,6]. The conceptual design and the implementation depend, among other things, on the project or enterprise size and the used (information) systems. Therefore, the development of a data warehouse can turn out to be a tedious and costly process. These constraints make it impossible to buy a data warehouse like a standard application. The correct answer to questions like
*Address correspondence to these authors at the Institute for Bioinformatics,
University for Health Sciences, Medical Informatics and Technology, Aus-
tria; E-mail: [email protected]
Institute of Biomedical Engineering, University for Health Sciences, Medi-
cal Informatics and Technology, Austria; E-mail: [email protected]
what data is really key for the scientists, what is the overall impact of their data on the system, in what aggregated form
and formats can the data be delivered, what data sources are
available and how can they be accessed is of importance for completing a data warehouse project.
Furthermore, the amount of data in a data warehouse is
usually huge due to the fact that data are stored over a long-term period to perform business intelligence (BI). An addi-
tional factor, with using biological data bases, is the expo-
nential growth rate of information contained in public avail-able data sources. This growth may be measured in two di-
mensions. One dimension represents the number of public
domain data bases. The current database issue of Nucleic Acid Research counts 1078 data bases, which reflects an
annual increase of about 11% in 2006 and 13% in 2007, re-
spectively; and the other dimension being the amount of the data itself, stored in these databases [7-9].
One of the biggest challenges of building a data ware-house system is that the data warehouse administrator needs
to be familiar with a lot of different “languages". One is
forced to know how the various data sources can be ac-cessed, how the different network protocols work and how
the operating systems can be handled. Only if these issues
are treated well, a data warehouse can be seen as useful, in-stead of becoming another vast silo of unusable information
[10]. The different data sources are integrated and updated in
periodic intervals by accessing the internal and external data sources. After consolidation the data become accessible by
BI tools, which are focused on unearthing unknown facts
hidden in the data. When recapitulating the above described steps, it becomes clear that a data warehouse system is not a
monolithic application, it is more a complex interacting sys-
tem of components, where several applications, frameworks and tools are bridged in order to accomplish these tasks.
Bridging Data Management and Knowledge Discovery The Open Bioinformatics Journal, 2008, Volume 2 29
Data can be described as logical grouped information units and are therefore the fundamental components of in-formation [3]. In the field of computer sciences data are un-derstood as machine readable and processable digital repre-sentations of information. The information itself is character coded, and the information is generated using defined rules. Therefore, information follows syntax. The feasibility of interpreting data in a semantic context is indispensable for extracting information from these data.
One main objective when working with data in a data warehousing environment is to keep the data sets in the cor-rect form, in a syntactic as well as in a semantic way. As data warehouses are tools for supporting the process of deci-sion making, or in the actual case, the development and de-ployment of new biomedical knowledge, the correctness of the stored data is a crucial prerequisite [11]. Rahm and Do further point out that regarding large number of various sources for data integration, it might be a reasonable assump-tion, that corrupted data might be contained. They even con-sider cleaning this potentially corrupted data as one of the biggest challenges in data warehousing. Several manipula-tion and cleaning approaches are defined [11-14]. They all should be complete, meaning that all errors and inconsisten-cies in both the source data and the integrated data, should be found and wherever possible fixed. In an optimal case those approaches should need minimal interaction by the user, should mask the underlying data sources and should be ex-tendable to further data sources. And last but not least, they should be combinable with schema related data transforma-tions, enabling semantic correctness and completeness. For biological data an additional criterion is the ability to find and merge duplicated information on a semantic level. A survey done by Schönbach et al. showed that about 30% of 145 source data contained non-critical errors, that could have caused further trouble [15].
In order to accomplish all these mentioned requirements an Extract-Transform-Load (ETL) process is introduced [2]. The ETL process may be considered as the basic concept of a data warehouse back room. It extracts the needed data from the source systems, transforms it into the needed presenta-tion, by performing aggregations and other manipulations on the extracted data, afterwards loads these results into the data warehouse repository, and finally transforms the stored data in a user friendly representation format. By putting these steps together it is possible to state, that ETL is responsible for syntactic data integration when using the data warehouse approach. In most cases the original data is uploaded into a separate staging area, where it is transformed and possibly corrected before loading it into the final repository. To fur-ther increase data quality, either manual curation by experts or automated annotation should be performed after integra-tion. Computational annotation has not yet been imple-mented but will be included in one of the next project steps. One thing that has to be kept in mind is that it is difficult to decide what data can be deleted since even incomplete or potentially incorrect data might be of interest for research purposes [1].
To prove the suitability and usefulness of our application to answer biological questions, we developed a framework for the study of correlations between genetic mutations and different phenotypic expressions. For this purpose, we used our application and a Knowledge Discovery in Databases
(KDD) approach to develop intelligent query models. Muta-tions in the fibrillin-1 coding gene FBN1 have been shown to cause Marfan Syndrome (MFS), a multisystemic connective tissue disorder, inherited as an autosomal dominant trait [16]. This abnormal genetic condition is characterized by plei-otropic manifestations and a high degree of clinical variabil-ity involving predominantly the ocular, skeletal, and cardio-vascular systems [17]. Several studies have been focused on exploring correlations between FBN1 mutations and the clinical phenotype, as they are crucial for predicting the clinical consequences of a specific mutation [18-21]. In the absence solid correlations, the identification of an FBN1 mutation has only a little prognostic value [22].
An early and accurate diagnosis is essential for the effec-tive treatment of MFS, before life threatening complications arise. The leading cause of death in patients with MFS is the progressive dilatation of the aorta, which can lead to dissec-tion or rupture. The weakening of the aortic wall is one of the many consequences of abnormalities in the synthesis and secretion of fibrillin-1 caused by mutations in the FBN1 gene. This extracellular matrix glycoprotein is the major constituent of the calcium-binding microfibrils, which pro-vide structural support in connective tissue throughout the body. Many of the clinical manifestations in MFS underlie deficiencies in the microfibrilar system [19].
2. METHODS
2.1. Data Warehousing Architecture
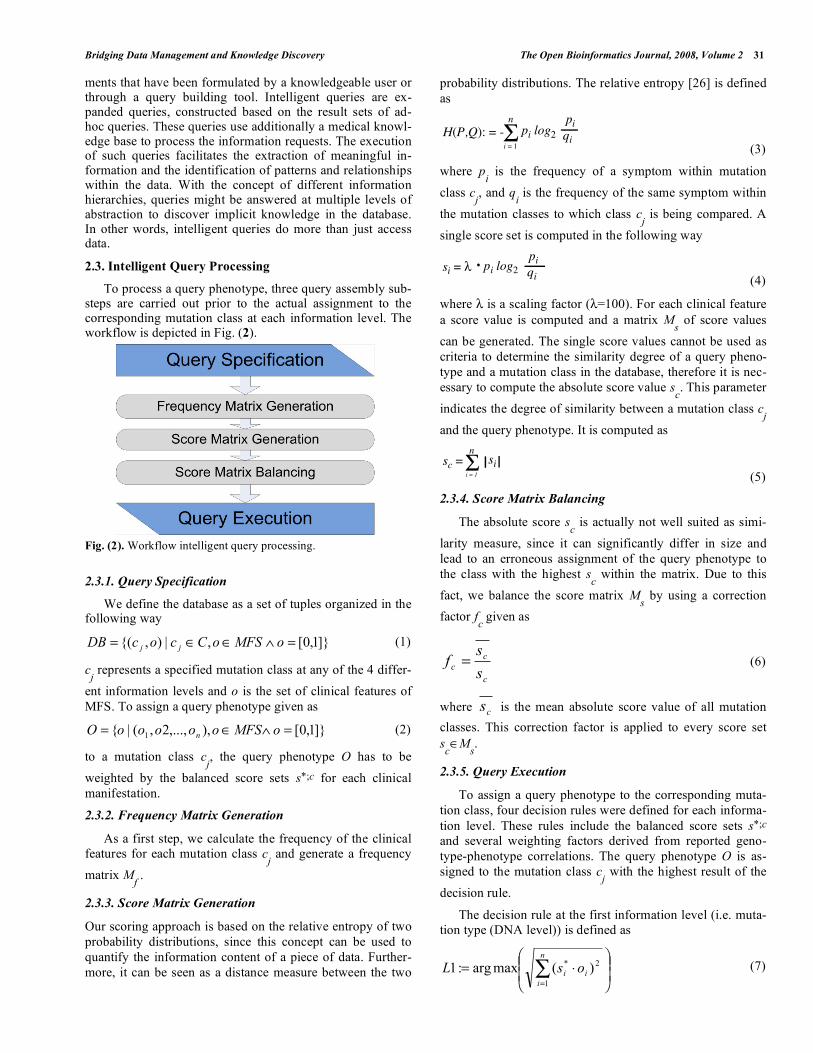
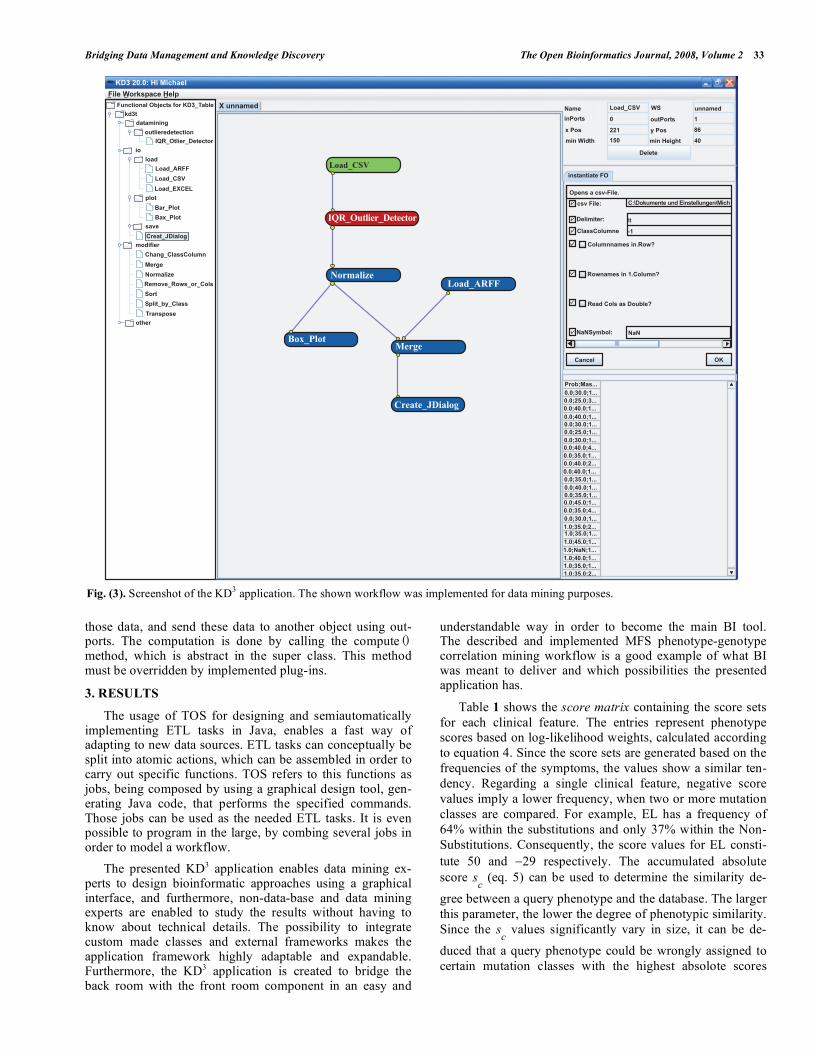
It is common practice to separate between back room and front room entities when talking about data warehouses. These two parts are in most cases separated physically as well as logically. While the back room is holding and man-aging the data, the front room enables data accession meth-ods. This distinction is crucial in understanding how a data warehouse works and how it is organized. The back room is often described as data management or data preparation component. It contains the data, prepares and delivers data retrieved by queries, but it does not support any user queries from the outside since this is a task of the front room. A back room, in this context, may be regarded as permanently stor-ing the information to a physical entity like a disc. In the presented application a PostgreSQL database was used as storage system (Version 8.1), further referred to as reposi-tory. For most ETL tasks the third party open source applica-tion Talend Open Studio (TOS) was used to build tasks that download data from the external data sources, transforms and cleans them, according to the manipulation necessities introduced above, and then loads them into the application’s repository [23], as can be seen in Fig. (4) for a simplified workflow.
The front room component enables a user or client appli-cation to access the data held in the warehouse. The main task of the front room is mapping the huge amount of low-level data, usually stored in a data warehouse, to another more valuable form [24]. The front room manages the que-ries performed at the outside and schedules and plans them, in order to achieve the results defined for performance is-sues. Its activities can be referred to as Business Intelligence. The diction “intelligence" implies that non trivial actions take place in here. If defining business intelligence as “...the process of turning data into information and then into
30 The Open Bioinformatics Journal, 2008, Volume 2 Kugler et al.
knowledge", as Golfarelli et al. do [25], and, at the same time, regarding the repository containing the data of the data warehouse as a database, we may set the wordings BI and KDD as equivalent in this context. The front room may pro-vide techniques of data mining, text mining or classical sta-tistical methods, being typically performed on Data Marts and multidimensional cubes.
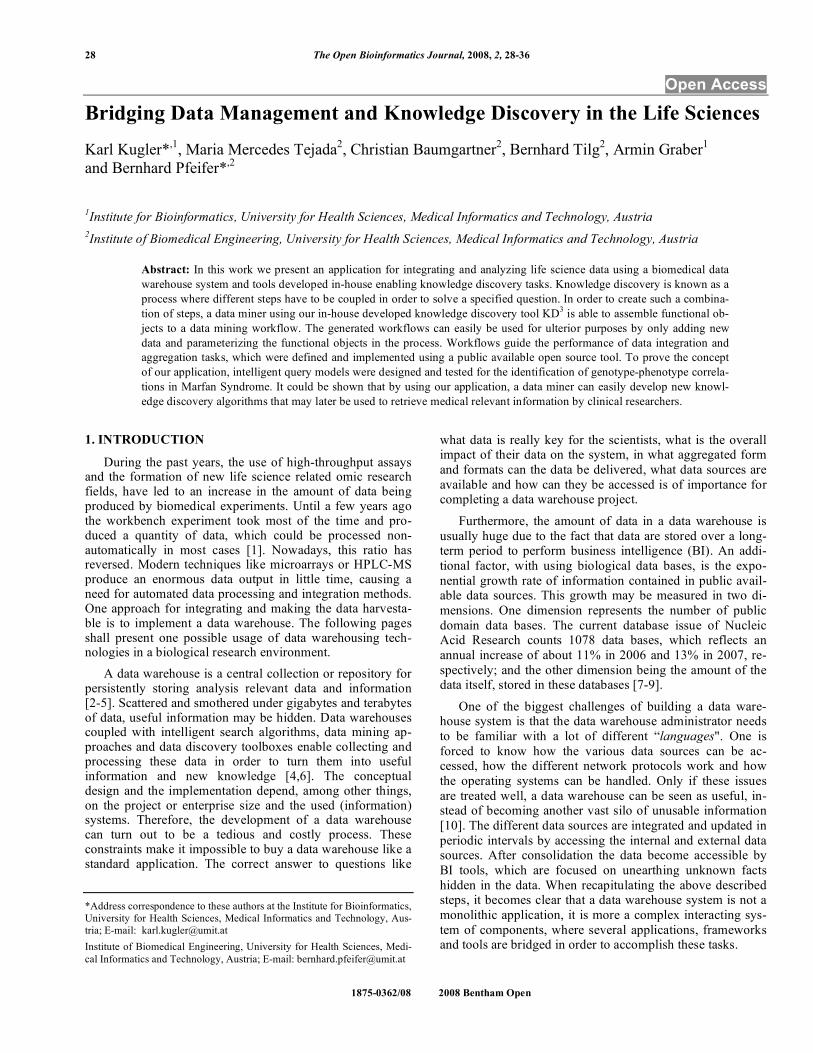
The presented ETL framework can be regarded as con-sisting of two main features. One of these features is the conversion of given file formats or database formats in order to fit to the structure needed by the following loading proc-esses, which store the data in the repository.
The right part of Fig. (1) shows the ETL-component em-bedded in the system environment, excluding any parts of the front room. As can be seen, data coming from external sources, may be accessed in a file representation, including simple flat files, more complex XML files or as a database, which in most cases mean, accessing and reading a data base dump. The loading component makes use of Java code and archives created by the TOS tool, which is used in order to create a simple mechanism of importing data. These files can later be re-used in the ETL component in order to read, mod-ify and store the data. As the requirement definition for data transformation consumes about 70-80% of the time used to build a data warehouse [15], the conversion and transforma-tion steps, including Java classes created by TOS, were the first software components to be designed and planed, in or-der to enable an early user interaction with establishing the warehouse.
2.2. Bridging the Front and Back Room
The back room component, where only the database and the data warehouse administrator has direct access, needs to
be bridged with the front room. Users and scientists have access to the data via the front room for generating new knowledge and systems biology approaches without having to know database query languages like e.g. SQL. An inte-grated business intelligence application or toolbox is essen-tial because it cannot be assumed that an average user is fa-miliar with the interaction of statistical, data mining or gen-erally knowledge discovery approaches. Furthermore, one common mistake is declaring a spreadsheet application, which can be used for basic tasks like visualization, to be the main knowledge discovery tool. To overcome the above-mentioned problems a tool, named Knowledge Discovery in Databases Designer (KD
3), has been implemented as part of
the presented Data Warehouse system.
To systematically study and support the discovery of novel genotype-phenotype correlations, intelligent query models were developed based on log-likelihood weights for each diagnostic criterion of MFS. The models were built using genetic and clinical data of 436 patients. Sixteen diag-nostic criteria were taken into account and coded as boolean vectors. This coding is based on the fact that clinical symp-toms are assumed to be either present or absent and hence they can be represented by a binary parameter. To query the database, four different levels of mutational information were defined. The models enable the assignment of a clinical phenotype of unknown mutation to a mutation class at each information level according to the type of mutation, the con-sequence at the protein level, the location of the mutational event, and the amino acid changes.
Two different types of queries are involved in the re-trieval process: ad-hoc and intelligent queries. Ad-hoc que-ries are information requests that are usually constructed and run a single time. The requests are executed as SQL state-
Fig. (1). The upper figure shows the main components of the presented application. The conversion and loading components for the ETL
process are the main features the back room implements. As can easily be seen, the loading component contains Java source provided by
Talend Open Studio. Bridging between back and front room is enabled by the ad-hoc query builder and KD3.
Bridging Data Management and Knowledge Discovery The Open Bioinformatics Journal, 2008, Volume 2 31
ments that have been formulated by a knowledgeable user or through a query building tool. Intelligent queries are ex-panded queries, constructed based on the result sets of ad-hoc queries. These queries use additionally a medical knowl-edge base to process the information requests. The execution of such queries facilitates the extraction of meaningful in-formation and the identification of patterns and relationships within the data. With the concept of different information hierarchies, queries might be answered at multiple levels of abstraction to discover implicit knowledge in the database. In other words, intelligent queries do more than just access data.
2.3. Intelligent Query Processing
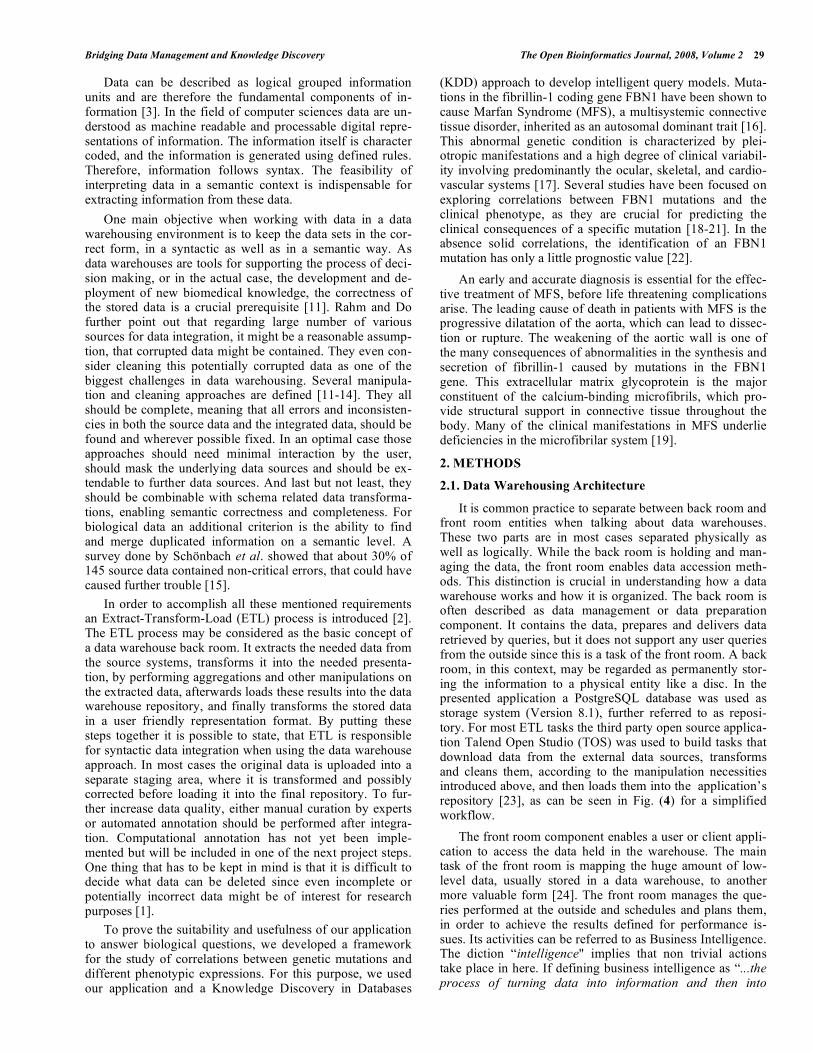
To process a query phenotype, three query assembly sub-steps are carried out prior to the actual assignment to the corresponding mutation class at each information level. The workflow is depicted in Fig. (2).
Fig. (2). Workflow intelligent query processing.
2.3.1. Query Specification
We define the database as a set of tuples organized in the following way
]}1,0[,|),{( == oMFSoCcocDB jj (1)
cj represents a specified mutation class at any of the 4 differ-
ent information levels and o is the set of clinical features of
MFS. To assign a query phenotype given as
]}1,0[),,...,2,(|{ 1 == oMFSoooooOn
(2)
to a mutation class cj, the query phenotype O has to be
weighted by the balanced score sets s*;c for each clinical
manifestation.
2.3.2. Frequency Matrix Generation
As a first step, we calculate the frequency of the clinical
features for each mutation class cj and generate a frequency
matrix Mf .
2.3.3. Score Matrix Generation
Our scoring approach is based on the relative entropy of two
probability distributions, since this concept can be used to
quantify the information content of a piece of data. Further-
more, it can be seen as a distance measure between the two
probability distributions. The relative entropy [26] is defined
as
H(P,Q): = - pi log2
n
i = 1
piqi
(3)
where pi is the frequency of a symptom within mutation
class cj, and q
i is the frequency of the same symptom within
the mutation classes to which class cj is being compared. A
single score set is computed in the following way
si = pi log2piqi (4)
where is a scaling factor ( =100). For each clinical feature
a score value is computed and a matrix Ms of score values
can be generated. The single score values cannot be used as
criteria to determine the similarity degree of a query pheno-
type and a mutation class in the database, therefore it is nec-
essary to compute the absolute score value sc. This parameter
indicates the degree of similarity between a mutation class cj
and the query phenotype. It is computed as
sc =n
i = 1
si
(5)
2.3.4. Score Matrix Balancing
The absolute score sc is actually not well suited as simi-
larity measure, since it can significantly differ in size and
lead to an erroneous assignment of the query phenotype to
the class with the highest sc within the matrix. Due to this
fact, we balance the score matrix Ms by using a correction
factor fc given as
c
c
cs
sf = (6)
where cs is the mean absolute score value of all mutation
classes. This correction factor is applied to every score set
scMs.
2.3.5. Query Execution
To assign a query phenotype to the corresponding muta-
tion class, four decision rules were defined for each informa-
tion level. These rules include the balanced score sets s*;c
and several weighting factors derived from reported geno-
type-phenotype correlations. The query phenotype O is as-
signed to the mutation class cj with the highest result of the
decision rule.
The decision rule at the first information level (i.e. muta-
tion type (DNA level)) is defined as
=
=
n
i
iiosL
1
2* )(maxarg:1 (7)
32 The Open Bioinformatics Journal, 2008, Volume 2 Kugler et al.
where s*;i is the set of balanced score values and o is the set of clinical features coded as a boolean vector.
At the second information level (i.e. mutation type and consequence (DNA and protein level)) the decision rule was defined as
+++=
=
222
1
2* )()()()0(maxarg:2 skecsvocu
n
i
iisskescsvsocusL
(8)
The first term of the rule is equal to the first level, but it
is expanded by three weighting factors. The clinical features
affecting the ocular (ocu), cardiovascular (csv) and skeletal
system (ske) are weighted depending on the number of pre-
sent symptoms. For this purpose, the mean score value of
each organ system is computed. These values are denoted by
s; ocu
, s; csv
and s; ske
respectively. The number of in-
volved criteria is expressed by ocu, cvs, and ske.
At the third information level (i.e. mutation type, conse-
quence, and location of the mutational event (DNA, protein
and affected exon level)) the decision rule was defined in the
following way
+++=
=
222
1
2* )()()()0(maxarg:3 avgcsvocu
n
i
ii amscsvsocusL
(9)
This rule is very similar to the second level, but here the
patient’s age is also taken into account. This is mainly be-
cause of the age related occurrence of mutations within the
exons 24 to 32, the so called “neonatal region". There is no
available data of genotype - phenotype correlations regarding
the skeletal system. For this reason this organ system was
not weighted in the decision rule.
In the fourth information level (i.e. mutation type, conse-
quence, and amino acid changes) we applied following deci-
sion rule
+=
=
2
1
2* )()0(maxarg:4 ocu
n
i
iisocusL (10)
According to the reported genotype - phenotype correla-tions in [18], patients with mutations involving a cysteine residue present a higher risk of ectopia lentis (EL), hence higher score values are expected for this clinical manifesta-tion. As there are no other correlations regarding the amino acid changes, only the weighting factor for the ocular system was considered.
2.4. KD3 Front Room Application
2.4.1. Workflow Designer
Many different steps are involved in a knowledge dis-covery approach [24]. These steps incorporate focusing and describing the problem, preprocessing and transformation of the data, performing statistical analyses and data mining al-gorithms, and a concluding evaluation. As data are delivered in an integrated and consistent form when using our data warehouse system, the preprocessing and transformation process can be reduced. Therefore, one can focus on building
analyzing workflows for generating new knowledge. Nor-mally more steps have to be bridged for answering a speci-fied problem. Beside this, these steps are dependent among each other and can therefore be coupled using a workflow pipeline concept. A workflow is characterized as a repeatable pattern activity, which is used to solve a defined process using different parameters and data sets.
One idea behind KD3 is to deploy two different versions.
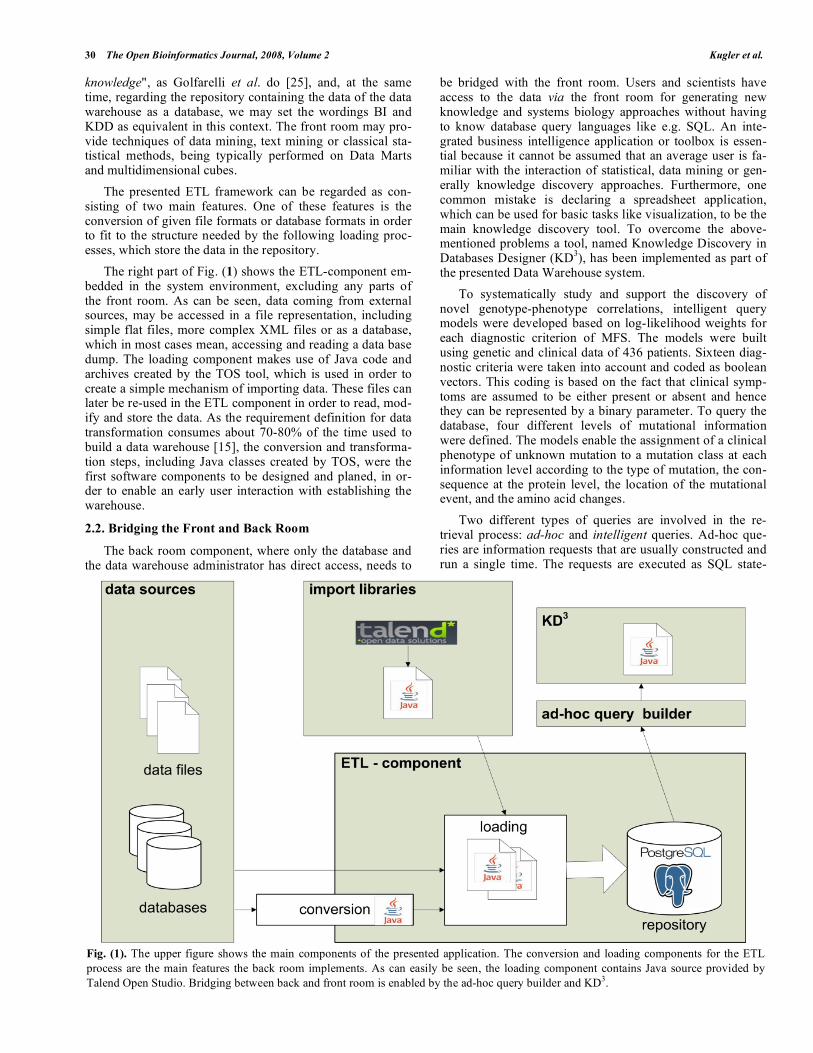
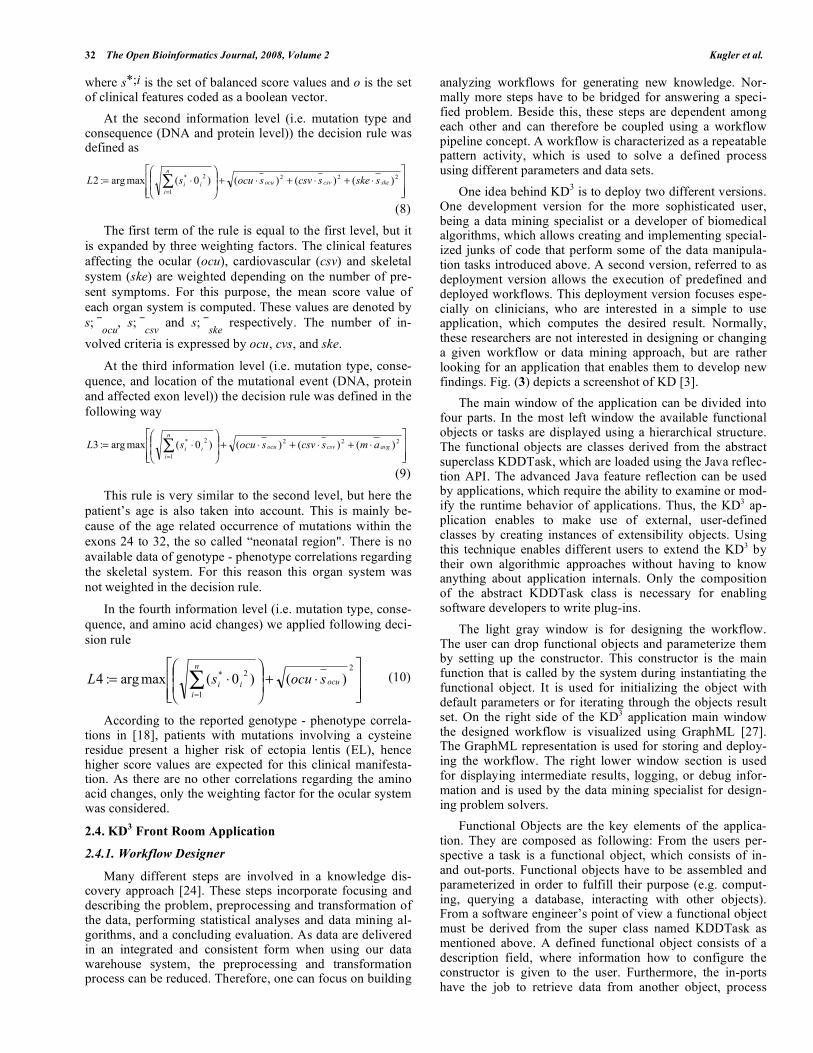
One development version for the more sophisticated user, being a data mining specialist or a developer of biomedical algorithms, which allows creating and implementing special-ized junks of code that perform some of the data manipula-tion tasks introduced above. A second version, referred to as deployment version allows the execution of predefined and deployed workflows. This deployment version focuses espe-cially on clinicians, who are interested in a simple to use application, which computes the desired result. Normally, these researchers are not interested in designing or changing a given workflow or data mining approach, but are rather looking for an application that enables them to develop new findings. Fig. (3) depicts a screenshot of KD [3].
The main window of the application can be divided into four parts. In the most left window the available functional objects or tasks are displayed using a hierarchical structure. The functional objects are classes derived from the abstract superclass KDDTask, which are loaded using the Java reflec-tion API. The advanced Java feature reflection can be used by applications, which require the ability to examine or mod-ify the runtime behavior of applications. Thus, the KD3 ap-plication enables to make use of external, user-defined classes by creating instances of extensibility objects. Using this technique enables different users to extend the KD3 by their own algorithmic approaches without having to know anything about application internals. Only the composition of the abstract KDDTask class is necessary for enabling software developers to write plug-ins.
The light gray window is for designing the workflow. The user can drop functional objects and parameterize them by setting up the constructor. This constructor is the main function that is called by the system during instantiating the functional object. It is used for initializing the object with default parameters or for iterating through the objects result set. On the right side of the KD3 application main window the designed workflow is visualized using GraphML [27]. The GraphML representation is used for storing and deploy-ing the workflow. The right lower window section is used for displaying intermediate results, logging, or debug infor-mation and is used by the data mining specialist for design-ing problem solvers.
Functional Objects are the key elements of the applica-tion. They are composed as following: From the users per-spective a task is a functional object, which consists of in- and out-ports. Functional objects have to be assembled and parameterized in order to fulfill their purpose (e.g. comput-ing, querying a database, interacting with other objects). From a software engineer’s point of view a functional object must be derived from the super class named KDDTask as mentioned above. A defined functional object consists of a description field, where information how to configure the constructor is given to the user. Furthermore, the in-ports have the job to retrieve data from another object, process
Bridging Data Management and Knowledge Discovery The Open Bioinformatics Journal, 2008, Volume 2 33
those data, and send these data to another object using out-ports. The computation is done by calling the compute () method, which is abstract in the super class. This method must be overridden by implemented plug-ins.
3. RESULTS
The usage of TOS for designing and semiautomatically implementing ETL tasks in Java, enables a fast way of adapting to new data sources. ETL tasks can conceptually be split into atomic actions, which can be assembled in order to carry out specific functions. TOS refers to this functions as jobs, being composed by using a graphical design tool, gen-erating Java code, that performs the specified commands. Those jobs can be used as the needed ETL tasks. It is even possible to program in the large, by combing several jobs in order to model a workflow.
The presented KD3 application enables data mining ex-perts to design bioinformatic approaches using a graphical interface, and furthermore, non-data-base and data mining experts are enabled to study the results without having to know about technical details. The possibility to integrate custom made classes and external frameworks makes the application framework highly adaptable and expandable. Furthermore, the KD3 application is created to bridge the back room with the front room component in an easy and
understandable way in order to become the main BI tool. The described and implemented MFS phenotype-genotype correlation mining workflow is a good example of what BI was meant to deliver and which possibilities the presented application has.
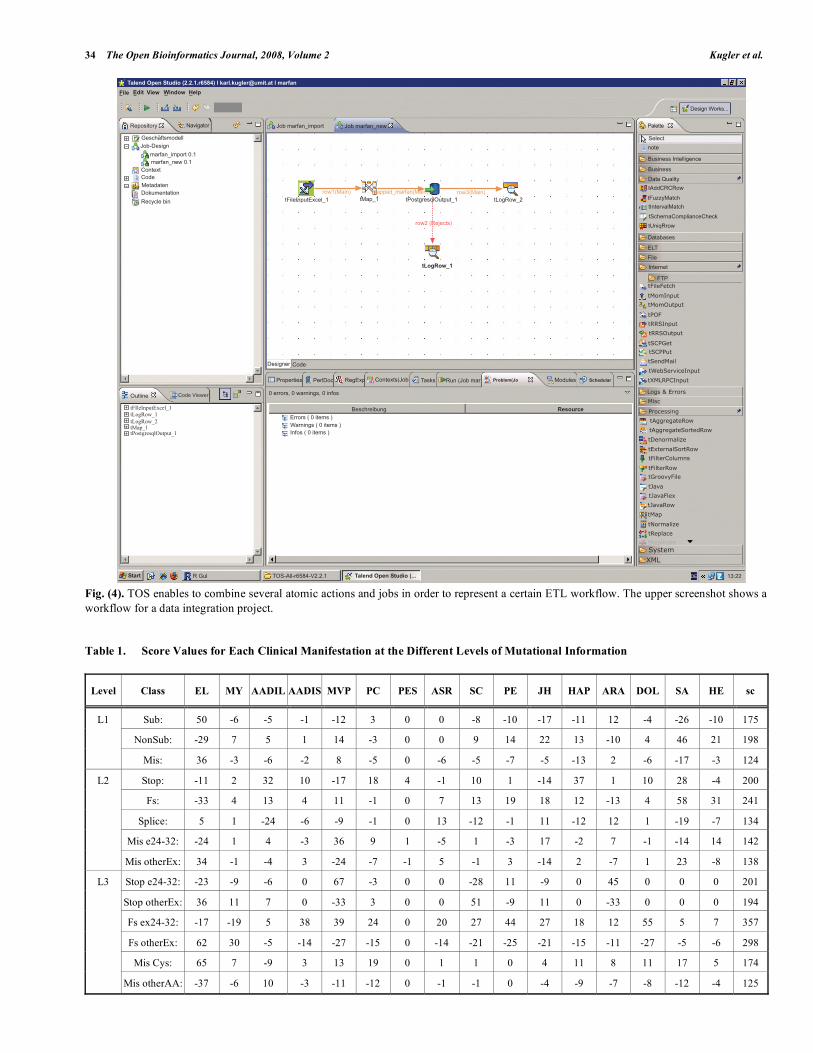
Table 1 shows the score matrix containing the score sets
for each clinical feature. The entries represent phenotype
scores based on log-likelihood weights, calculated according
to equation 4. Since the score sets are generated based on the
frequencies of the symptoms, the values show a similar ten-
dency. Regarding a single clinical feature, negative score
values imply a lower frequency, when two or more mutation
classes are compared. For example, EL has a frequency of
64% within the substitutions and only 37% within the Non-
Substitutions. Consequently, the score values for EL consti-
tute 50 and 29 respectively. The accumulated absolute
score sc (eq. 5) can be used to determine the similarity de-
gree between a query phenotype and the database. The larger
this parameter, the lower the degree of phenotypic similarity.
Since the sc values significantly vary in size, it can be de-
duced that a query phenotype could be wrongly assigned to
certain mutation classes with the highest absolote scores
Fig. (3). Screenshot of the KD3 application. The shown workflow was implemented for data mining purposes.
������������� ���
�������������������������������
��������� ������
�!��!���"��#
�������!�������$%&���������������
�
���!
'��!�(&��
'��!�)*+
'��!�,-),' ���
.���/���
.�0�/�����1�
"�!���
) ��#�)����)���"�
���#�
2��"��3�
&�"�1��&�4�����)���
*���
* ����5�)����
����� ����� ��
� � �
-�����"�! 2�"�
�/����
0�/��
"���!�
'��!�)*+
�
��6
67�
�*
���/����
5�/��
"���# �
������
����"�!
6
89
:�
������������
� ��������1;����
��1�����
���"����
)����)���"��
)���"���"�����&�4<
&�4��"�����6�)���"�<
&��!�)�������������<
2�2*5"���� 2�2
��)�����
/���=���������=����=6������=�7��=�������=:���=6������=:���=6������=����=6������=�7��=6������=����=6������=:���=:������=�7��=6������=:���=�������=:���=6������=�7��=6������=:���=6������=�7��=6������=:7��=6������=�7��=:������=����=6���6��=�7��=����6��=�7��=6���6��=:7��=6���6��=2�2=6���6��=:���=6���6��=�7��=6���6��=�7��=����
)�>����"�������!�,��������#��>��
;6
>�
��������
��� ��������������
������������������
�������������
��������������
)�����?����#
34 The Open Bioinformatics Journal, 2008, Volume 2 Kugler et al.
Fig. (4). TOS enables to combine several atomic actions and jobs in order to represent a certain ETL workflow. The upper screenshot shows a
workflow for a data integration project.
Table 1. Score Values for Each Clinical Manifestation at the Different Levels of Mutational Information
Level Class EL MY AADIL AADIS MVP PC PES ASR SC PE JH HAP ARA DOL SA HE sc
Sub: 50 -6 -5 -1 -12 3 0 0 -8 -10 -17 -11 12 -4 -26 -10 175
NonSub: -29 7 5 1 14 -3 0 0 9 14 22 13 -10 4 46 21 198
L1
Mis: 36 -3 -6 -2 8 -5 0 -6 -5 -7 -5 -13 2 -6 -17 -3 124
Stop: -11 2 32 10 -17 18 4 -1 10 1 -14 37 1 10 28 -4 200
Fs: -33 4 13 4 11 -1 0 7 13 19 18 12 -13 4 58 31 241
Splice: 5 1 -24 -6 -9 -1 0 13 -12 -1 11 -12 12 1 -19 -7 134
Mis e24-32: -24 1 4 -3 36 9 1 -5 1 -3 17 -2 7 -1 -14 14 142
L2
Mis otherEx: 34 -1 -4 3 -24 -7 -1 5 -1 3 -14 2 -7 1 23 -8 138
Stop e24-32: -23 -9 -6 0 67 -3 0 0 -28 11 -9 0 45 0 0 0 201
Stop otherEx: 36 11 7 0 -33 3 0 0 51 -9 11 0 -33 0 0 0 194
Fs ex24-32: -17 -19 5 38 39 24 0 20 27 44 27 18 12 55 5 7 357
Fs otherEx: 62 30 -5 -14 -27 -15 0 -14 -21 -25 -21 -15 -11 -27 -5 -6 298
Mis Cys: 65 7 -9 3 13 19 0 1 1 0 4 11 8 11 17 5 174
L3
Mis otherAA: -37 -6 10 -3 -11 -12 0 -1 -1 0 -4 -9 -7 -8 -12 -4 125
������������� � ���� � ��������������� � ������� �
�'�#&�4�6
���������� ������ ��� �������� ���!������
����"���#�����
�����!�� ���*��!��@����6��978:A����������#���B�"�������"�����
��� ,!� +�4 ��!�4 ��
���������$ %�&������
'���(� ��������)�*+,�����
��� �� ������"-.���� �� ���"-.�
/������/������������,�0���������
���$���"*��
������ /���"1�����
�������������� �������� �������������� ������������������
)�*"��� �� ������ )�*"��� �� ���
,�������
���������� ����,�� ����� /��������)�* 2��0� ��"�)�*"��� /�����"@?� ������ *� �!����
-"������3"-"��������3"-"�� ��
�����"�"-"�����"�4�������"�"-"�����"��� ��"�"-"�����"�
5���(���*�� &�������
*���� �"'� �����!�� ���*��!��@���2�6+7��+�89:;+1�.�.�
,�����"4��0�...
�������
6�����
����
5������"������������
5������
,���"<����$
/���
�7��/�/���
��==$����(
������&������(
�6�(����/���������/(��0
�>�������
,���*����
�2
����
��������
�2�����������
���� ��
����� ��
����
������ ��
������� ��
�������
�������
���������
������������� ��
��������� ��
���� �!����
����
�"���������#
�"��������������#
�$������%�
�!&����������#
������������
��������#
����'����
�(���
�(������&
�(����#
���
�)����%�
��� ����
�'������
�!?��
���������
��� ������
C,
@
@
@@@@@
..
Bridging Data Management and Knowledge Discovery The Open Bioinformatics Journal, 2008, Volume 2 35
(Table 1). Contd…..
Level Class EL MY AADIL AADIS MVP PC PES ASR SC PE JH HAP ARA DOL SA HE sc
Stop Cys: 0 55 -6 0 67 0 0 0 85 96 149 0 45 0 30 77 610
Stop otherAA: 0 -31 7 0 -33 0 0 0 -47 -35 -53 0 -33 0 -22 -15 276
Fs Cys: -14 -23 43 6 -25 15 0 11 13 -3 13 -7 1 -17 -16 -9 216
L4
Fs otherAA: 26 60 -30 -4 43 -11 0 -9 -11 4 -11 7 -1 35 20 14 286
preferably. The highest sc values were calculated for the
class of nonsense mutations involving a cysteine (610) fol-
lowed by the frameshift mutations within exons 24 32 (357).
To avoid the erroneous assignment of the query phenotype to
the class with the highest sc we generate a balanced score
matrix. The balancing is accomplished by computing a cor-
recting factor (eq. 6) and applying it to all score sets in the
matrix. The resulting balanced matrix (not explicitly shown)
is used for the actual phenotype assignment to the corre-
sponding mutation class at each information level.
4. DISCUSSION & CONCLUSION
The front to back room bridging application KD3 enables the data miner or BI specialist to predefine deployable workflows in order to turn data into information to gain new knowledge. Apart from this, the finding of unknown patterns and decision support or helping to enhance medical treat-ment is also targeted. The developed and tested MFS workflow can be deployed and used by other researchers and medical staff using such a distributable version. Further-more, external frameworks and toolboxes can be integrated by implementing an adaptor class. For use with other Data Mining methods, we integrated the well-known data mining framework WEKA [28] into our KD3 designer tool. Moti-vated by biomedical research projects an easy to use and easy expandable system has been developed. The presented application tries to bridge the gap between the back and front room component in a biomedical data warehouse project.
All mentioned software tools are accessible on request to the authors.
ACKNOWLEDGEMENTS
We want to thank Andreas Dander and Michael Handler for their contribution to the KD3 project, Gerd Lorünser and Robert Rostek for developing the ad-hoc query builder and Martin Lange and Yves de Montcheuil from Talend.
REFERENCES
[1] T. Hernandez and S. Kambhampati, “Integration of biological sources: current systems and challenges ahead”, SIGMOD Rec.,
vol. 33, no. 3, pp. 51-60, September 2004. [2] R. Kimball and J. Caserta, The data warehouse ETL toolkit. Wiley
Publishing, Indianapolis: 2000. [3] R. Kimball and M. Ross, The data warehouse toolkit: The complete
guide to dimensional modeling (Second Edition). Wiley Publishing, Indianapolis: 2002.
[4] A. Bauer and H. Günzel, data warehouse systeme. Heidelberg: dpunkt.verlag, 2004.
[5] G. Allen, Ed., Data warehousing tools and solutions. Towcester: Bloor Research Group, 1997.
[6] B. Pfeifer, J. Aschaber, C. Christian, S. Dreiseitl, R. Modre-Osprian, G. Schreier, and B. Tilg, “A data warehouse for prostate
cancer biomarker discovery”, in BIOCOMP 2007: International
conference on bioinformatics & computational biology, 2007, pp. 316-323.
[7] M. Y. Galperin, “The molecular biology database collection: 2008 update”, Nucleic Acids Res., vol. 36, no. "Database-Issue", pp. 2-4,
November 2007. [8] M. Y. Galperin, “The molecular biology database collection: 2007
update,” Nucleic Acids Res., vol. 35, no. "Database-Issue", pp. 3-4, January 2007.
[9] Swiss Institute of Bioinformatics, “UniProtKB/Swiss-Prot protein knowledgebase release 54.8 statistics”, 2008.
[10] S. P. Gardner, “Ontologies and semantic data integration,” Drug Discov. Today, vol. 10, no. 14, pp. 1001-1007, July 2005.
[11] E. Rahm and H. H. Do, “Data cleaning: problems and current ap-proaches”, IEEE Data Eng. Bull., vol. 23, no. 4, pp. 3-13, Septem-
ber 2000. [12] U. Leser and P. Rieger, “Integration molekularbiologischer daten”,
Datenbank-Spektrum, vol. 6, pp. 56-66, June 2003. [13] L. M. Haas, E. T. Lin, and M. A. Roth, “Data integration through
database federation”, IBM Syst. J., vol. 41, no. 4, pp. 578-596, Oc-tober 2002.
[14] I. K. Ibrahim and W. Schwinger, “Data integration in digital librar-ies: approaches and challenges”, in IDLN 2001: Proceedings of the
International Seminar on Digital Library and Knowledge Manage-ment, June 2001.
[15] C. Schönbach, P. Kowalski-Saunders, and V. Brusic, “Data ware-housing in molecular biology”, Brief. Bioinform., vol. 1, no. 1, pp.
190-198, May 2000. [16] D. Halliday, S. Hutchinson, L. Lonie, J. Hurst, H. Firth, P. Hand-
ford, and P. Wordsworth, “Twelve novel FBN1 mutations in mar-fan syndrome and marfan related phenotypes test the feasibility of
FBN1 mutation testing in clinical practice”, J. Med. Genet., vol. 39, no. 8, pp. 589-593, December 2002.
[17] P. Comeglio, P. Johnson, G. Arno, G. Brice, A. Evans, J. Aragon-Martin, F. P. da Silva, A. Kiotsekoglou, and A. Child, “The impor-
tance of mutation detection in marfan syndrome and marfan-related disorders: Report of 193 FBN1 Mutations”, Hum. Mutat., vol. 28,
no. 9, p. 928, September 2007. [18] L. Faivre, G. Collod-Beroudand, B. Loeys, A. Child, C. Binquet, E.
Gautier, B. Callewaert, E. Arbustini, K. Mayer, M. Arslan-Kirchner, A. Kiotsekoglou, P. C. glio, N. Marziliano, H. Dietz, D.
Halliday, C. Beroud, C. Bonithon-Kopp, M. Claustres, C. Muti, H. Plauchu, P. N. Robinson, L. C. Adès, A. Biggin, B. Benetts, M.
Brett, K. J. Holman, J. D. Backer, P. Coucke, U. Francke, A. D. Paepe, G. Jondeau, and C. Boileau, “Effect of Mutation type and
location on clinical outcome in 1,013 Probands with marfan syn-drome or related phenotypes and FBN1 mutations: an international
study”, Am. J. Hum. Genet., vol. 81, pp. 454-466, September 2007. [19] P. Robinson and M. Godfrey, “The molecular genetics of Marfan
syndrome and related microfibrillopathies”, J. Med. Genet., vol. 37, no. 1, pp. 9-25, January 2000.
[20] I. Schrijver, W. Liu, T. Brenn, H. Furthmayr, and U. Francke, “Cysteine substitutions in epidermal growth factor-like domains of
fibrillin-1: distinct effects on biochemical and clinical phenotypes”, Am. J. Hum. Genet., vol. 65, no. 4, pp. 1007-20, October 1999.
[21] F. Tiecke, S. Katzke, P. Booms, P. Robinson, L. Neumann, M. Godfrey, K. Mathews, M. Scheuner, G. Hinkel, R. Brenner, H.
Hovels-Gurich, C. Hagemeier, J. Fuchs, F. Skovby, and T. Rosen-berg, “Classic, atypically severe and neonatal Marfan syndrome:
twelve mutations and genotype-phenotype correlations in FBN1 exons 24-40”, Eur. J. Hum. Genet., vol. 9, pp. 13-21, January 2001.
[22] C. Baumgartner, G. Mátyás, B. Steinmann, M. Eberle, J. Stein, and D. Baumgartner, “A bioinformatics framework for genotype-
36 The Open Bioinformatics Journal, 2008, Volume 2 Kugler et al.
phenotype correlation in humans with Marfan syndrome caused by
FBN1 gene mutations”, J. Biomed. Inf., vol. 39, no. 2, pp. 171-183, April 2006.
[23] Talend Open Studio, [Online]. Available: http://www.talend.com [Accessed March 23, 2007].
[24] U. M. Fayyad, G. Piatetsky-Shapiro, and P. Smyth, “From data mining to knowledge discovery: An overview”, in Advances in
Knowledge Discovery and Data Mining, U. M. Fayyad, G. Pi-atetsky-Shapiro, P. Smyth , and R. Uthurusamy, Ed. Menlo Park:
AAAI Press, 1996, pp. 1-34. [25] M. Golfarelli, S. Rizzi, and I. Cella, “Beyond Data warehousing:
what’s next in business intelligence?” in DOLAP 2004: Proceed-
ings of the 7th ACM international workshop on data warehousing
and OLAP, November 2004, pp. 1-6. [26] S. Kullback and R. A. Leibler, “On information and sufficiency”,
Ann Math Statist, vol. 22, no. 1, pp. 79-86, March 1951. [27] GraphML, [Online]. Available: http://graphml.graphdrawing.org
[Accessed Feb. 01, 2007]. [28] I. H. Witten and E. Frank, Data Mining: Practical machine learn-
ing tools and techniques, Second Edition. San Francisco: Morgan Kaufmann, 2005.
Received: April 17, 2008 Revised: June 03, 2008 Accepted: June 04, 2008
© Kugler et al.; Licensee Bentham Open.
This is an open access article distributed under the terms of the Creative Commons Attribution License (http://creativecommons.org/licenses/by/2.5/), which permits unrestrictive use, distribution, and reproduction in any medium, provided the original work is properly cited.