op-pohjola group’s interim report 1 january–31 march 2011
TRANSCRIPT

Q1
OP-Pohjola Group’s Interim Report 1 January–31 March 2011

OP-Pohjola Group Company Release 4 May 2011, 08.00 am Release category: Interim Report
Strong start to 2011 by OP-Pohjola Group: best quarter in over three years
– The Group's pre-tax earnings shot up by 62% to EUR 208 million (128) – each business segment improved its performance. – Growth in income was 11 percentage points higher than that in expenses. Net interest income increase by 6% and Other income by 24%, while expenses increased by 6%. – Impairment losses on receivables shrank by 38% year on year, amounting to 0.16% of the loan and guarantee portfolio. – OP-Pohjola Group's joint banking and insurance customers increased in the report period by 25,000 (19,000). – Growth was stable, and in our strategic focus area, that is, integration and corporate financing, we proceeded well. – The Group's risk exposure is stable and the capital adequacy is solid, Tier 1 ratio being 12.7%. – The Group's performance for 2011 is expected to be better than in 2010. The greatest risks are related to changes in international capital and financial markets.
OP-Pohjola Group's key indicators
Q1/2011 Q1/2010 Change, % 2010
Earnings before tax, € million 208 128 61.9 575 Banking 133 93 43.2 367 Non-life Insurance 19 6 83 Life Insurance 37 1 43 Returns to owner-members and OP bonus customers
42 39 7.0 163
31 Mar 2011
31 Mar 2010
Change, % 31 Dec 2010
Ratio of capital base to minimum amount of capital base (under the Act on the Supervision of Financial and Insurance Conglomerates)
1.67 1.62 0.05* 1.70
Tier I ratio, % 12.7 12.6 0.1* 12.8 Non-performing loan losses within loan and guarantee portfolio, %
0.4 0.5 -0.1* 0.3
Joint banking and insurance customers (1,000)
1,222 1,117 9,4 1,197
* Change in ratio
OP-Pohjola Group's Interim Report for 1 January–31 March 2011 2

Comments by Reijo Karhinen, Executive Chairman Our first quarter saw improved earnings and a bold investment in developing improved services to our cus-tomers. Despite a number of uncertainties, we have been able to continue our success story, and I expect this to continue during the rest of the year. The quarter that just ended boasted the best earnings in over three years. This was the result of several factors that manifested our Group's strengths: All divisions improved their financial performance. Net interest income improved well and growth of Other income continued to be strong. The growth in income was triple that of the rise in expenses. Credit losses kept on contracting, reaching their lowest level in over two years. Although competition has been tough, our volume increase has been steady. Thanks to our solid capital adequacy, we can continue to implement our growth strategy with determination. Our decision to establish a development unit in Oulu that will focus on eBusiness and mobile applications for financial services in particular is a concrete example of OP-Pohjola Group's desire and ability to take on a new course and to lay new foundations for growth. Nokia's strategy change provided us with a window of opportunity to tap into a fresh pool of resources and to create new eBusiness. We are now moving boldly forward to create what we believe will be solutions that provide a better customer experience. I believe this move will turn out to be one of the Group's major turning points, a similar one being 1996 when we were the first in Europe to introduce online banking. Our good earnings performance is a reflection of the growth base of the Finnish economy, as indeed Finland is our primary market area. Our solid performance is good news to our customers. Banks are there for their customers and owners, and in our case the owners and the customers are the same people. Our cooperative base not only gives us the opportunity but also obligates us to channel our profits to long-term development projects. Finnish prosperity is only ensured by having sufficient growth. This country needs companies that have the courage to invest into the future even during difficult periods. OP-Pohjola Group is not only providing the framework for investments by our customers but also setting an example on how to build for the future. By boldly investing into new things, by emphasising growth and by increasing our personnel we are in the fore-front of Finnish growth companies.
OP-Pohjola Group's Interim Report for 1 January–31 March 2011 3

OP-Pohjola Group's Interim Report for 1 January–31 March 2011 Contents Page Operating environment 5 Group's earnings and total assets 6 Capital adequacy, risk exposure and credit ratings 8 Operations and earnings by business segment 11 Banking 11 Non-life Insurance 14 Life Insurance 16 Other Operations 18 Outlook 18 Events after the balance sheet date 18 Changes in OP-Pohjola Group's structure 19 Owner-members and customers 19 Personnel and incentive system 19 Senior management of OP-Pohjola Group Central Cooperative 19 Capital expenditure and service development 19 OP-Pohjola Group income statement 20 OP-Pohjola Group statement of comprehensive income 20 OP-Pohjola Group balance sheet 21 Changes in OP-Pohjola Group's equity capital 22 Cash flow statement 23 Notes: Note 1. Accounting policies 24 Note 2. OP-Pohjola Group's formulas for key figures and ratios 24 Note 3. OP-Pohjola Group quarterly performance 25 Note 4. Net interest income 25 Note 5. Impairments of receivables 26 Note 6. Net income from Non-life Insurance 26 Note 7. Net income from Life Insurance 27 Note 8. Net commissions and fees 28 Note 9. Net trading income 28 Note 10. Net investment income 29 Note 11. Other operating income 29 Note 12. Classification of financial instruments 30 Note 13. Financial instruments recognised at fair value, grouped by valuation technique 31 Note 14. Non-life Insurance assets 32 Note 15. Life Insurance assets 33 Note 16. Non-life Insurance liabilities 33 Note 17. Life Insurance liabilities 33 Note 18. Debt securities issued to the public 33 Note 19. Fair value reserve after income tax 34 Note 20. Capital structure and capital adequacy 34 Note 21. Capital adequacy under the Act on the Supervision of Financial and Insurance Conglomerates 35 Note 22. Collateral given 35 Note 23. Off-balance-sheet items 35 Note 24. Derivative contracts 36 Note 25. Related-party transactions 36
OP-Pohjola Group's Interim Report for 1 January–31 March 2011 4

Operating environment The world economy continued its strong growth in the first quarter of 2011. However, this favourable development was tinged with uncertainty caused by Japan's natural disaster and the restlessness in the Arab world. A reduction in unemployment has supported broad-based economic growth in the USA. Europe's economies, too, have shown some growth although inflation has climbed faster than expected. Accelerating inflation has also cast a shadow over emerging economies. All in all, however, the world economy will continue to grow this year at a rate above the long-term average. The Finnish economy grew rapidly and the unemployment rate continued to decline in the first quarter. Finland too showed an accelerating inflation rate but consumer confidence remained strong. Consumer spending will this year be buttressed by improving employment. Export prospects are favourable and the pace of capital spending is expected to quicken. The economic outlook for the current year is optimistic. The first quarter saw a quickening rise in short-term market rates because the European Central Bank (ECB) was anticipated to raise its main refinancing rate sooner than expected. Indeed, the ECB raised the rate to 1.25% in early April. Higher inflation and economic growth in the euro zone were reflected in the ECB's monetary policy decisions. The ECB is expected to continue to raise the main refinancing rate this year. The year-start was favourable in money and capital markets but Japan's natural disaster and rising oil prices made the markets nervous, which was reflected in equity markets in particular. Portugal faced increasing problems in government bond markets, which ultimately forced it to request a financial rescue from its euro-zone partners. However, Portugal's predicament was not reflected in the market on any wider scale. In order to survive their debt crisis, Portugal and the other debt-ridden euro-zone countries must solve their own competitiveness-related and structural problems because the financial aid is only temporary relief. In the first quarter, the loan portfolio in the financial sector continued to grow at an annual average rate of around 6%. Higher short-term market rates have not slowed down growth in consumer lending, and the housing market has remained lively. The corporate loan portfolio has continued to grow at a slightly slower rate than the consumer loan portfolio although there are signs of a pickup. Although global equity markets enjoyed a strong recovery towards the end of March, the NASDAQ OMX Helsinki stock indices were below their year-end level. Jittery financial markets and higher interest rates made the net assets inflow into mutual funds remain relatively low during the first quarter. Total deposits continued to grow at an annual rate of around 6%. Life Insurance's premiums written for the first quarter remained unchanged compared to the comparable figure year on year. In the first quarter, the growth rate of Non-life Insurance premiums written improved to over 5%. This growth is expected to remain at an above-average rate, underpinned by brighter prospects in the corporate sector and the accelerating inflation rate. Although Japan's natural disaster will have only minor direct effects on the Finnish insurance sector, natural disasters that have recently become more common are expected to put pressure on insurance premiums in the longer term. Greater economic activity increased claims incurred, which grew in the first quarter more rapidly than insurance premiums, as expected.
OP-Pohjola Group's Interim Report for 1 January–31 March 2011 5

OP-Pohjola Group's earnings and total assets
Earnings analysis, € mill.
Q1/2011
Q1/2010
Change, %
Q4/2010
Change,
%
2010
Banking 133 93 43.2 100 31.9 367 Non-life Insurance 19 6 -2 83 Life Insurance 37 1 20 80.2 43 Earnings before tax 208 128 61.9 137 51.7 575
Gross change in fair value reserve -82 212 -31 225
Earnings/loss before tax at fair value
126 340 -63.0 106 18.9 800
Return on economic capital, % *)
15.5 13.1 2.4 14.4
Return on economic capital at fair value, % *)
14.2 31.9 -17.7 18.7
Income
Net interest income 238 224 6.3 238 0.2 917 Net income from Non-life Insurance 92 78 18.7 73 26.3 382
Net income from Life Insur-ance 50 14 39 28.6 100
Net commissions and fees 156 143 8.8 146 7.0 563 Net trading and investment income 46 37 24.7 37 25.5 109
Other operating income 27 26 2.7 32 -15.2 101 Other income, total 371 298 24.3 326 13.8 1,256 Total income 609 523 16.6 564 8.1 2,172
Expenses Personnel costs 178 164 8.2 166 7.2 643 Other administrative expens-es 80 75 7.4 94 -15.0 319
Other operating expenses 78 78 0.0 85 -7.6 324 Total expenses 336 317 6.0 345 -2.5 1,286
Impairment losses on re-ceivables
23 38 -38.3 41 -42.4 149
Returns to owner-members and OP bonus customers
Bonuses 40 37 7.6 39 1.5 151 Interest on ordinary and sup-plementary cooperative capi-tal
3 3 -1.7 3 0.0 12
Total returns 42 39 7.0 42 1.4 163
*) 12-month rolling, change in percentage
Other key indicators, € mill.
31 Mar 2011
31 Mar 2010
Change, %
31 Dec 2010
Change, %
Receivables from customers 57,131 53,679 6.4 56,834 0.5 Life Insurance assets 7,594 6,889 10.2 7,544 0.7 Non-life Insurance assets 3,415 3,412 0.1 3,164 7.9 Liabilities to customers 38,743 38,425 0.8 39,205 -1.2 Debt securities issued to the public 19,844 19,708 0.7 19,577 1.4 Equity capital 6,725 6,376 5.5 6,726 0.0 Balance sheet total 85,250 83,211 2.4 83,969 1.5 Tier 1 capital 5,446 5,298 2.8 5,454 -0.1
OP-Pohjola Group's Interim Report for 1 January–31 March 2011 6

January–March The Group's earnings before tax grew by 62% to EUR 208 million (128). This was the result of lower impairment charges, higher net commissions and fees and, as a consequence of higher market rates, growing net interest income. Bonuses to owner-members and OP bonus customers that were recognised in the profit and loss grew by 7.6% year-on-year to EUR 40 million. All three business segments improved their performance. Following the recession, the financial services group's profitability is reaching it long-term average target level. Earnings before tax at fair value shrank owing to jittery investment markets and, as a consequence of higher long-term interest rates, falling market prices. The Group's fair value reserve shrank by EUR 61 million, while a year ago it increased by EUR 156 million. Non-life Insurance's operating combined ratio declined to 100.5% as a result of a higher amount of claims incurred. However, Non-life Insurance's pre-tax earnings improved year on year thanks to higher net investment income recognised in the profit and loss. This increase in net investment income also explains higher pre-tax earnings by Life Insurance. Net commissions and fees continued to increase especially owing to higher commissions and fees related to lending, payment transfer services and asset management. Net trading income tripled and net investment income fell somewhat short of the comparison period. Investment income shrank as a result of a fall in capital gains. Expenses increased year-on-year by 6.0% mainly because of higher personnel costs. Impairment losses recognised under various income statement items that eroded the report period's performance amounted to EUR 28 million (103), of which EUR 23 million (38) concerned loans and other receivables. Net impairment losses were 0.16% of the loan and guarantee portfolio (0.27). Equity capital stood at EUR 6,725 million on 31 March, being at the same level as on 31 December 2010. Equity capital was boosted by the report period's performance, while being eroded by a shrunken fair value reserve and dividend payments. The Annual General Meeting of Pohjola Bank plc decided on 29 March 2011 that the company will pay a dividend of EUR 0.40 (0.34) for each Series A and EUR 0.37 (0.31) for each Series K share for 2010, resulting in total dividends of EUR 126 million (107), of which the Group's internal divided accounted for 44%. On 31 March, the cooperative capital investments and supplementary cooperative capital investments of the member cooperative banks’ owner-members totalled EUR 784 million (778). OP-Pohjola Group's long-term financial targets 31 Mar
2011 31 Mar
2010 Target
Capital adequacy under the Act on the Supervision of Financial and Insurance Conglomerates
1.67
1.62
1.5
Return on economic capital, % (12-month rolling) 15.5 13.1 17
Growth differential between income and expenses, percentage points (12-month rolling)
4.8
11.0
> 0
OP-Pohjola Group's Interim Report for 1 January–31 March 2011 7

Capital adequacy, risk exposure and credit ratings
Capital adequacy On 31 March, OP-Pohjola Group's capital base, calculated according to the Act on the Supervision of Financial and Insurance Conglomerates, exceeded the minimum amount specified in the Act by EUR 2,562 million (2,666). The 3.9% fall in the capital buffers is the result the redemption of a EUR 150 million debenture loan under Pohjola Bank plc's Tier 2 capital, of which more information is provided in the capital adequacy section dealing with Banking.
As a result of the financial crisis, the regulatory framework for banks' capital requirements is becoming more rigorous in an effort to improve the quality of their capital base, to increase capital conservation buffers, to reduce the cyclic nature of capital requirements, to decrease banks' indebtedness and to set quantitative limits to liquidity risk. These changes have been planned to be implemented in 2013–2019. According to OP-Pohjola Group's analysis based on the current interpretations, the Group can fulfil the capital adequacy requirements in any eventuality. From OP-Pohjola Group's viewpoint, the major changes in the new regulations are related to how insurance company investments and supplementary cooperative capital are treated in terms of capital base calculation concerning capital adequacy, to the leverage ratio and to liquidity risk requirements. Risk exposure OP-Pohjola Group retained its strong risk-bearing capacity, with stable risk exposure. The Group's credit risk exposure is stable and still improving. The fact that the economy has stabilised has improved customers' repayment capacity, which has further resulted in lower impairments charges on receivables. See below in the part dealing with business segments for details on Banking's credit risk exposure. No major changes took place in the report period in Non-life Insurance's or Life Insurance's underwriting risks and investment portfolio risk exposure. See below in the part dealing with business segments for details on the risk exposure. OP-Pohjola Group's market risk exposure was stable in the report period, and the financial and liquidity position was good. Pohjola Bank plc issued a bond worth EUR 0.5 billion in the report period, and on 1 April 2011, OP Mortgage Bank issued a covered bond worth one billion euros. Pohjola Bank plc's short-term funding performed well in the report period. OP-Pohjola Group ensures its liquidity with liquidity reserves and other sources of finance referred to in the contingency plan. These are invested primarily in notes and bonds issued by governments, municipalities, financial institutions and companies all showing good credit ratings, and in securitised assets. The liquidity reserve portfolio's interest rate and currency risks have been hedged.
OP-Pohjola Group's Interim Report for 1 January–31 March 2011 8

Liquidity reserve, € mill. 31 Mar 2011 31 Dec 2010 Change
Nominal value/ 11,393 11,274 119 Collateral value 10,360 10,324 36 The liquidity reserve and other sources of finance included in OP-Pohjola Group's liquidity management strategy ensure the Group's liquidity for at least 24 months if wholesale funding became unavailable and deposits fell moderately.
Investment assets, € mill. 31 Mar 2011 31 Dec 2010 Change
Pohjola Bank plc 9,565 9,487 78 Non-life Insurance 2,979 2,924 55 Life Insurance 4,573 4,716 -143 Group member banks 1,785 1,663 121 OP-Pohjola Group Mutual Insurance Company
379
379
0
Total 19,280 19,169 110 Stress tests OP-Pohjola Group carries out regular stress tests of various types to ensure its business operations are on a sound basis. Regulators also conduct their own stress tests both at national and European level to find out whether an entire sector or individual actors can cope in weaker economic conditions than have been forecast. The Financial Supervisory Authority (FSA) published in April the results of an extensive stress test covering the Finnish financial sector. These tests were conducted in cooperation with OP-Pohjola Group and other banks operating in Finland. According to the FSA, the Finnish financial sector's capital adequacy on the whole is sufficient to withstand an economic downswing as specified in the stress tests, and falling asset values. However, the stress tests give reason for certain players to assess together with the regulators whether they should increase their capital or reduce their risk exposure. OP-Pohjola Group's capital adequacy passed the stress tests without problem, giving no reason to increase the level of capital or change the risk exposure.
The European Banking Authority (EBA) is currently carrying out EU-wide stress tests with the aim of having tested 65% of Europe's banking systems by the summer. The EBA will be publishing its results during the summer.
OP-Pohjola Group's Interim Report for 1 January–31 March 2011 9

Credit Ratings Rating agency Short-term
debt Long-term debt
Fitch Ratings (OP-Pohjola Group and Pohjola Bank plc)
F1+ AA-
Standard & Poor's (Pohjola Bank plc) A-1+ AA- Moody's (Pohjola Bank plc) P-1 Aa2
Fitch Ratings issues a rating for both OP-Pohjola Group and Pohjola Bank plc. OP-Pohjola Group's financial position also has a considerable impact on credit ratings issued for Pohjola Bank plc alone. Pohjola's credit rating outlook issued by Standard & Poor's is stable. Fitch Rating has issued a negative outlook for the long-term debt ratings of Pohjola and Moody's Investor Service has affirmed negative outlook on Pohjola's credit rating. The main reason for the negative outlook was the rapid deterioration of the Finnish economy in 2009 and its potential effects on Pohjola and OP-Pohjola Group that mainly operate in Finland.
OP-Pohjola Group's Interim Report for 1 January–31 March 2011 10

Operations and earnings by business segment OP-Pohjola Group's business segments are Banking, Non-life Insurance and Life Insurance. Non-segment operations are presented under 'Other Operations'. OP-Pohjola Group's segment reporting is based on accounting policies applied in its financial statements. Summary of performance by business segment € million
Income Expenses Other
items *)
Earnings before tax
Q1/2011
Earnings/loss before tax
Q1/2010 Change, %
Banking 439 240 -66 133 93 43.2 Non-life Insurance 100 81 0 19 6 232.5 Life Insurance 63 26 0 37 1 Other Operations 109 90 0 19 31 -39.3 Eliminations -101 -101 0 1 -2 -126.0 Total 609 336 -65 208 128 61.9
*) Other items contain returns to owner-members and OP bonus customers, and impairment losses on receivables Banking
Earnings before tax increased by 43% to EUR 133 million as a result of higher income and lower
impairment charges. Net interest income was up 7.9% and commissions and fees by 6.9%. Impairment losses on receivables
reduced even more, by 38% in the report period. The Group's loan portfolio grew at a rate above the market average. Capital invested in mutual funds
and the growth in deposits were slower than the sector average.
Banking, key figures € million Q1/2011 Q1/2010 Change, % 2010
Net interest income 225 208 7.9 852 Impairment losses on receivables 23 38 -38.0 149 Other income 214 192 11.5 745 Personnel costs 109 105 4.1 405 Other expenses 131 125 4.6 513 Returns to owner-members and OP bonus customers 42 39 7.0 163
Earnings/loss before tax 133 93 43.2 367 € million Home mortgages drawn down 1,498 1,313 14.1 6,651 Corporate loans drawn down 1,355 1,636 -17.2 6,554 Net subscriptions to mutual funds -398 575 -169.2 497 No. of brokered property transactions 3,777 3,757 0.5 17,009 € billion
31 Mar 2011 31 Mar 2010 Change, % 31 Dec
2010
Loan portfolio
Home loans 28 26 6.5 27 Corporate loans 15 14 8.4 14 Other loans 15 14 5.1 15 Total 57 53 6.6 57
Guarantee portfolio 3 3 -7 3
Deposits Total current and payment transfer 19 18 7.8 19 Investment deposits 17 17 4.9 17 Total deposits 37 34 6.4 36 Market share, %
Of loan portfolio 32.9 32.6 33.0 Of deposits 31.7 32.8 32.5 Of capital invested in mutual funds 22.6 23.6 23.4
OP-Pohjola Group's Interim Report for 1 January–31 March 2011 11

Banking's operating environment was favourable throughout the report period, while the competition continued to be hard. The fact that short-term market interest rates took an upward swing did not affect home sales in the report period, and home sales were lively. The number of housing deals brokered by OP-Kiinteistökeskus real estate agents in the first quarter was somewhat up year on year. The volume of new home mortgages increased clearly, by 14%, year on year. The margin of new home loans is almost at the same level as in late 2010. On 31 March, the Group held 35.8% (35.9) of the home mortgage portfolio. The consumer loan portfolio grew at a high rate. Companies' payment transfer volumes have increased considerably as the economy has picked up, with the payment transactions handled by OP-Pohjola Group increasing by 8%. The corporate loan portfolio grew in the year to March by 8.4%. The lack of investments by companies is still reflected in the demand for corporate financing. The Group's market share of the loan portfolio by businesses and housing corporations increased in the year to March from 28.7% to 29.5%. Capital invested in OP-Pohjola Group's mutual funds stood at EUR 13.8 billion (14.4). The amount of capital decreased along with the market trends by 0.9%.
Net subscriptions to OP-Pohjola Group's mutual funds were EUR 398 million in the negative (+575). OP-Pohjola Group's Asset Management managed a total of EUR 34.8 billion (35.0) on 31 March, of which assets in OP-Pohjola Group's mutual funds accounted for EUR 12.0 billion (12.0) and OP-Pohjola Group companies for EUR 8.8 billion. Earnings and risk exposure Earnings before tax by Banking increased by 43% to EUR 133 million thanks to good return performance and lower impairment charges. Banking income increased by 9.6% to EUR 439 million. Net interest income rose by 7.9%. The rise in short-term market interest rates supported the growth of net interest income. Net commissions and fees continued to grow steadily, by 6.9%, boosted particularly by higher volumes of asset management and stock broking volumes. Lending commissions and fees also grew considerably year on year. Net trading and investment income increased year on year by EUR 12 million, or 51%. Impairments of receivables contracted year on year by EUR 14 million. The ratio of impairment losses to the loan and guarantee portfolio in the report period was 0.16%, having been 0.32% at its highest after the financial crisis. Banking's credit risk exposure was stable. Thanks to the economy picking up, both impairment losses on receivables and non-performing and zero-interest receivables reduced. Households' repayment capacity remained high. The average loan capitals of new home mortgages drawn down fell somewhat, and the loan periods shortened. The economic upswing improved the financial position of more and more corporate
OP-Pohjola Group's Interim Report for 1 January–31 March 2011 12
customers. Of OP-Pohjola Group's corporate exposures, 44% fall into the top five credit categories (out of twelve categories), also known as investment grade. Doubtful receivables as percentage of loan and guarantee portfolio
31 Mar 2011
31 Mar 2010
31 Dec 2010
€ mill. % € mill. % € mill. %
Non-performing and zero-interest receivables, net
258
0,4
296
0,5
204
0,3
Impairments on receivables since 1 January, net
23
0,16
38
0,27
149
0,25
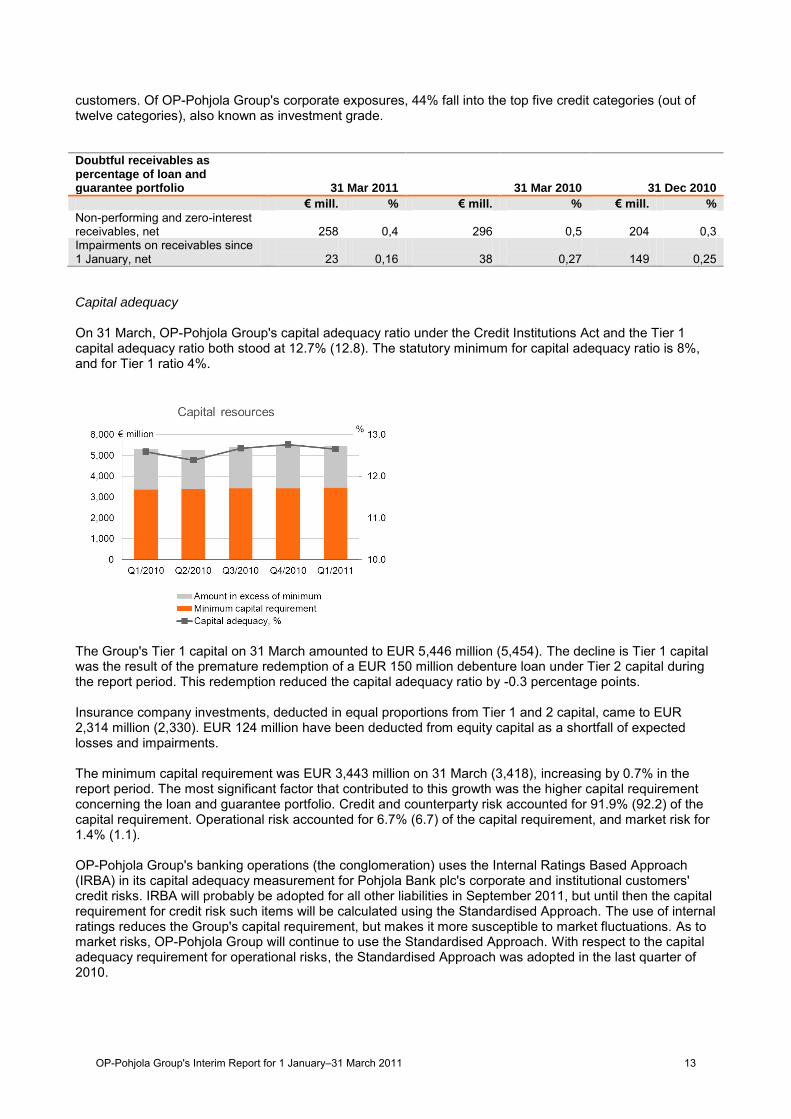
Capital adequacy On 31 March, OP-Pohjola Group's capital adequacy ratio under the Credit Institutions Act and the Tier 1 capital adequacy ratio both stood at 12.7% (12.8). The statutory minimum for capital adequacy ratio is 8%, and for Tier 1 ratio 4%.
The Group's Tier 1 capital on 31 March amounted to EUR 5,446 million (5,454). The decline is Tier 1 capital was the result of the premature redemption of a EUR 150 million debenture loan under Tier 2 capital during the report period. This redemption reduced the capital adequacy ratio by -0.3 percentage points. Insurance company investments, deducted in equal proportions from Tier 1 and 2 capital, came to EUR 2,314 million (2,330). EUR 124 million have been deducted from equity capital as a shortfall of expected losses and impairments. The minimum capital requirement was EUR 3,443 million on 31 March (3,418), increasing by 0.7% in the report period. The most significant factor that contributed to this growth was the higher capital requirement concerning the loan and guarantee portfolio. Credit and counterparty risk accounted for 91.9% (92.2) of the capital requirement. Operational risk accounted for 6.7% (6.7) of the capital requirement, and market risk for 1.4% (1.1). OP-Pohjola Group's banking operations (the conglomeration) uses the Internal Ratings Based Approach (IRBA) in its capital adequacy measurement for Pohjola Bank plc's corporate and institutional customers' credit risks. IRBA will probably be adopted for all other liabilities in September 2011, but until then the capital requirement for credit risk such items will be calculated using the Standardised Approach. The use of internal ratings reduces the Group's capital requirement, but makes it more susceptible to market fluctuations. As to market risks, OP-Pohjola Group will continue to use the Standardised Approach. With respect to the capital adequacy requirement for operational risks, the Standardised Approach was adopted in the last quarter of 2010.
OP-Pohjola Group's Interim Report for 1 January–31 March 2011 13

Non-life Insurance The growth rate of insurance premium revenue improved to 8% (–1). The number of loyal customer
households increased by 11,500 (8,700). The balance on technical account was eroded by higher claims expenditure. The operating combined
ratio stood at 100.5% (95.5). Pre-tax earnings increased to EUR 19 million (6) thanks to an increase in net investment income. Return on investments at fair value was 0.5% (3.2).
Non-life Insurance, key figures € million Q1/2011 Q1/2010 Change, % 2010
Insurance premium revenue 246 227 8.1 964 Insurance claims and benefits 178 154 15.7 637 Net investment income 38 16 138.1 87 Unwinding of discount and other items included in net income -12 -11 -1.7 -30
Net income from Non-life Insurance 95 78 20.5 383 Other net income 5 3 51.0 16 Personnel costs 32 27 19.3 109 Other expenses 49 49 -1.0 208 Earnings before tax 19 6 232.5 83
Gross change in fair value reserve -23 69 -133.3 56 Earnings/loss before tax at fair value -4 75 -105.7 139
€ million Q1/2011 Q1/2010 Change, % 2010 Insurance premium revenue Private Customers 117 107 10.1 470 Corporate customers 116 109 6.8 445 Baltic States 13 12 1.9 49 Total insurance premium revenue 246 227 8.1 964
Key ratios for Non-life Insurance
Operating loss ratio*, % 78.5 73.7 4.8 68.4 Return on investments at fair value*, % 0.5 3.2 -2.7 5.1 Operating combined ratio*, % 100.5 95.5 5.0 89.7 Operating expense ratio*, % 21.9 21.8 0.1 21.3 * These operating figures exclude changes in reserving bases and amortisation of intangible assets arising from the corporate acquisition. The changes have been calculated as changes in the ratio. Non-life Insurance's business improved well in the report period. We had good growth in terms of private customers, and premium revenue from corporate customers rebounded. The strongest growth came from SMEs whose number also increased within Corporate Customers. Insurance sales to private customers in-creased most at car dealerships and in Group member banks. There were 492,000 loyal customer households on 31 March, increasing by 11,500 in the report period (8,700). Up to 63% of these loyal customer households also use OP-Pohjola Group member cooperative banks as their main bank. OP-Pohjola Group member banks' owner-members and Helsinki OP Bank's bonus customers can use their OP bonuses earned through banking transactions to pay Pohjola non-life insurance premiums. Bonuses were used in the report period to pay 334,000 insurance bills, with over 49,000 of them paid in full using bonuses. Insurance premiums paid using bonuses totalled EUR 15 million. In terms of premiums written, OP-Pohjola Group is the non-life insurance market leader in Finland with a 27.8% market share of premiums written on 31 December 2010. Its market position improved among private customers during the report period. Earnings and risk exposure Growth in insurance premium revenue intensified, yet profitability declined mainly as a result of higher claims incurred from corporate customers. The profitability of private customers remained at the comparison period's level. The number of losses increased owing to the difficult winter conditions and as a result of greater economic activity. The number of losses reported increased by 6%. The operating combined ratio stood at 100.5% (95.5).
OP-Pohjola Group's Interim Report for 1 January–31 March 2011 14
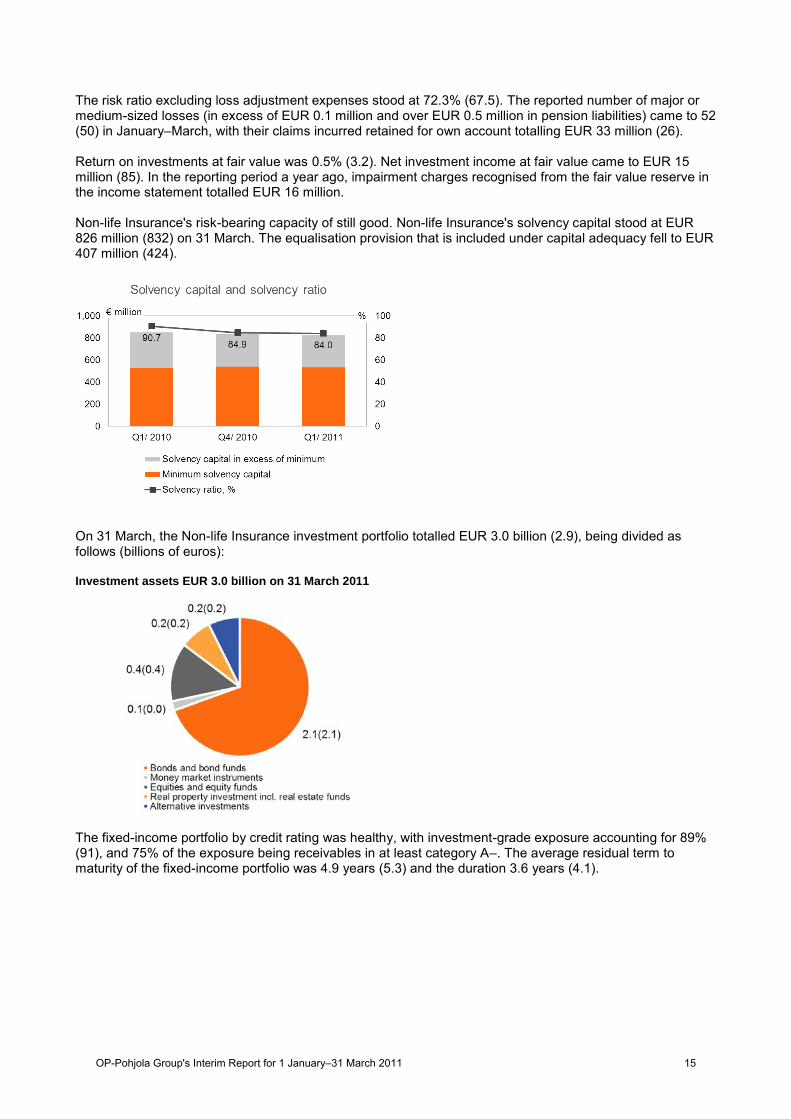
The risk ratio excluding loss adjustment expenses stood at 72.3% (67.5). The reported number of major or medium-sized losses (in excess of EUR 0.1 million and over EUR 0.5 million in pension liabilities) came to 52 (50) in January–March, with their claims incurred retained for own account totalling EUR 33 million (26). Return on investments at fair value was 0.5% (3.2). Net investment income at fair value came to EUR 15 million (85). In the reporting period a year ago, impairment charges recognised from the fair value reserve in the income statement totalled EUR 16 million. Non-life Insurance's risk-bearing capacity of still good. Non-life Insurance's solvency capital stood at EUR 826 million (832) on 31 March. The equalisation provision that is included under capital adequacy fell to EUR 407 million (424).
On 31 March, the Non-life Insurance investment portfolio totalled EUR 3.0 billion (2.9), being divided as follows (billions of euros): Investment assets EUR 3.0 billion on 31 March 2011
The fixed-income portfolio by credit rating was healthy, with investment-grade exposure accounting for 89% (91), and 75% of the exposure being receivables in at least category A–. The average residual term to maturity of the fixed-income portfolio was 4.9 years (5.3) and the duration 3.6 years (4.1).
OP-Pohjola Group's Interim Report for 1 January–31 March 2011 15

Life Insurance
The market share of insurance savings was unchanged. The share of unit-linked insurance of insurance savings increased to 45.3% (41.4). Earnings before tax increased significantly to EUR 37 million (1). Return on investments at fair value was 0.4% (4.1).
Life Insurance, key figures
€ million Q1/2011 Q1/2010 Change, % 2010
Premiums written 201 229 -12.2 1,287 Unit-linked 143 132 8.4 508 Net investment income 43 200 -78.3 539 Unit-linked -21 177 -111.8 374 Change in insurance contract liabilities 10 249 -95.9 1,119 Unit-linked 73 315 -76.9 755 Claims incurred 178 160 11.8 588 Other items -2 -4 63.1 -11 Net income from Life Insurance 54 16 236.6 109
Other income 9 8 16.4 16 Personnel costs 3 2 15.7 9 Other expenses 23 21 13.6 72 Earnings before tax 37 1 43
Gross change in fair value reserve -44 138 -132.2 220 Earnings/loss before tax at fair value -8 138 -105.5 263
31 Mar 2011 31 Mar 2010 Change, % 31 Dec
2010
Market share of insurance savings, % 21.3 20.7 21.3 Market share of unit-linked insurance savings, % 24.4 24.9 24.5
31 Mar 2011 31 Mar 2010 Change, % 31 Dec
2010
€ billion Insurance savings 7.1 6.5 8.7 7.1 Unit-linked 3.2 2.7 19.0 3.1
In accordance with the strategy, the focus in Life Insurance was turned increasingly to unit-linked insurance, this accounting for 45.3% of the insurance portfolio, down by 4 percentage points year on year. Unit-linked premiums written increased by 8.4% and insurance savings by 3.9%. Earnings and risk exposure Net investment income without the income from unit-linked insurance came to EUR 64 million (23). Investment income was improved particularly by smaller impairments on investments (by EUR 39 million), and higher capital gains and dividends. The company's balance sheet management was intensified during the report period by hedging interest rate risk associated with technical provisions by means of interest rate swaps. Operating efficiency improved somewhat as income increased. The cost ratio, in which sales channel fees are excluded and in which all income to cover business expenses are included as income, came to 31.7% (32.4).
OP-Pohjola Group's Interim Report for 1 January–31 March 2011 16

However, jittery investment markets and the fact that long-term interest rates turned up created a negative result at fair value. Return on investments at fair value was 0.4% (4.1). Life insurance investment assets, excluding assets covering unit-linked insurance, amounted to EUR 4.6 billion (4.7), divided as follows (billions of euros): Investment assets EUR 4.6 billion on 31 March 2011
Investments under the 'investment grade' accounted for 72% (71) of the fixed-income portfolio. The portfolio's modified duration was 3.6 years (3.7) on 31 March. Life Insurance's capital adequacy was solid: its solvency margin was EUR 722 million, which was 3.2-fold the required minimum. The solvency ratio, meaning the ratio of solvency capital to weighted technical provisions, was 15.8% (15.9).
OP-Pohjola Group's Interim Report for 1 January–31 March 2011 17

Other Operations
Other Operations, key figures € million Q1/2011 Q1/2010 Change, % 2010
Net interest income 12 15 -17.7 61 Net trading income -2 -6 56.4 -8 Net investment income 10 21 -52.8 40 Other income 89 84 6.2 342 Expenses 90 83 8.5 349 Impairment losses on receivables 0 0 -1 Earnings/loss before tax 19 31 -39.3 86 € billion
31 Mar 2011 31 Mar 2010 Change, % 31 Dec
2010
Receivables from financial institutions 9.6 7.5 27.5 7.8 Financial assets held for trading -0.1 0.3 -118.7 -0.1 Investment assets 7.8 7.1 11.2 7.3 Liabilities to credit institutions 4.6 4.4 4.7 4.0 Debt securities issued to the public 17.8 17.3 3.1 17.0
Other Operations' pre-tax result for January–March was EUR 19 million (31). Investment income included EUR 4.6 million (14) in capital gains on notes and bonds. No impairment charges were recognised on shares and participations included in available-for-sale financial assets (3). Most of the other income in Other Operations came from within the Group as internal service charges, which are recorded as business segment expenses. Of the Other Operations expenses, EUR 33 million (30) were personnel costs and EUR 25 million (20) ICT costs. Outlook
World economic growth is forecast to remain strong in 2011, although slowing down somewhat compared to last year, and the Finnish economy is expected to develop favourably, too. As the economy is recovering, short-term interest rates are again expected to rise towards the end of the year. The greatest risks that may overshadow the economic outlook are caused by public finance crises in certain euro countries and the consequent financial market jitters. OP-Pohjola Group's 2011 earnings before taxes are expected to be better than in 2010, the expected increase being attributed to climbing net interest income and net commissions and fees, and lower impairment charges related to banking and insurance operations. The greatest uncertainty is related to developments in international investment and financial markets. All forward-looking statements in this Interim Report expressing the management's expectations, beliefs, estimates, forecasts, projections and assumptions are based on the current view of the future financial performance of OP-Pohjola Group, and actual results may differ materially from those expressed in the forward-looking statements. Events after the balance sheet date
OP-Pohjola Group announced on 28 April that it will establish a development unit in Oulu that will focus on eBusiness, and mobile applications in particular. Moreover, a competence centre will be built in Oulu related to the Group's other ICT services. Operations will be started in stages, but eventually a total of some 150 jobs will be created.
OP-Pohjola Group's Interim Report for 1 January–31 March 2011 18
Changes in OP-Pohjola Group's structure OP-Pohjola Group's consolidated financial statements include the accounts of 212 member cooperative banks (213), OP-Pohjola Group Central Cooperative Consolidated and OP Bank Group Mutual Insurance Company. Kestilän Osuuspankki and Rantsilan Osuuspankki merged on 31 March 2011 to create Siikalatvan Osuuspankki. Pieksämäen Osuuspankki, Etelä-Savon Osuuspankki, Juvan Osuuspankki and Savonlinnan Osuuspankki will merge to become Suur-Savon Osuuspankki on 31 May 2011. Varpaisjärven Osuuspankki has decided to merge with Koillis-Savon Osuuspankki on 31 August 2011. Kokemäen Osuuspankki and Harjavallan Osuuspankki have decided to merge with Huittisten Osuuspankki on 31 December 2011. Owner-members and customers On 31 March, the cooperative member banks had 1.3 million owner-members, up by 31,600 year on year. On the same date, Group member banks and Helsinki OP Bank Plc, which operates in the Greater Helsinki Metropolitan Area, had a total of 1,219,000 OP bonus customers. Loyal customer bonuses earned by OP bonus customers totalled EUR 40 million, up by 7.6% year on year. In January–March, OP bonus customers used a total of EUR 22 million (21) of bonuses on banking services and EUR 15 million (13) on Pohjola non-life insurance premiums. Bonuses were used for the payment of 334,000 insurance premium bills, with almost 15% of these being paid using solely OP bonuses. OP-Pohjola Group had 4,140,000 customers in Finland at the end of March. The number of private customers totalled 3,717,000 and that of corporate customers 423,000. Since 1 January, the number of joint banking and non-life insurance customers in Finland increased by 25,000 to 1,222,000 as a result of cross-selling. Personnel and incentive system
At the end of March, the Group had 12,626 employees (12,504). The staff averaged 12,543 employees (12,468). 96 employees (83) retired from OP-Pohjola Group in the first quarter at an average age of 61.5 years (60.0). OP-Pohjola Group's long-term management incentive scheme for 2008–10 ended on 31 December 2010. A new incentive scheme for the entire Group is under preparation. Senior management of OP-Pohjola Group Central Cooperative
OP-Pohjola Group Central Cooperative's Annual Cooperative Meeting was held of 29 March 2011. Of the members who were due to resign, Senior Nursing Officer Marita Marttila, Professor Jaakko Pehkonen and Chairman of the Board of Directors Timo Parmasuo, were re-appointed for the term ending 2014 as new Supervisory Board members. New members appointed for the Board were Managing Director Ari Kakkori, Principal Seppo Laaninen and Managing Director Vesa Lehikoinen. In addition, the Meeting elected Managing Director Juha Pullinen for the term ending 2012. The Supervisory Board comprises 33 members. At is first meeting after the Annual Cooperative Meeting, the Supervisory Board re-elected Paavo Haapakoski Chairman. Professor Jaakko Pehkonen and Managing Director Vesa Lehikoinen were elected Vice Chairmen. Capital expenditure and service development The Central Cooperative and its subsidiaries are responsible for developing OP-Pohjola Group's services. ICT investments and related specifications make up a significant portion of costs of developing these services. EUR 9.1 million (7.4) of these expenses consisted of ICT procurement capitalised in the balance sheet in the accounting period. Of these investments, EUR 3,7 million (4,8) was allocated to banking operations, EUR 4,5 million (1,6) to non-life insurance operations and EUR 1,0 million (0,9) to life insurance operations.
OP-Pohjola Group's Interim Report for 1 January–31 March 2011 19

OP-Pohjola Group income statement
EUR million NoteQ1/
2011Q1/
2010 Change, % 2010Interest income 697 573 22 2 412Interest expenses 458 349 31 1 495Net interest income before impairmentlosses 4 238 224 6 917Impairments of receivables 5 23 38 -38 149
Net interest income after impairments 215 186 15 768Net income from Non-life Insuranceoperations 6 92 78 19 382Net income from Life Insurance operations 7 50 14 100Net commissions and fees 8 156 143 9 563Net trading income 9 19 6 46Net investment income 10 26 31 -14 62Other operating income 11 26 26 2 99Personnel costs 178 164 8 643Other administrative expenses 80 75 7 319Other operating expenses 78 78 0 324Returns to owner-members 42 39 7 163Share of associates' profits/losses 1 1 12 2Earnings before tax for the period 208 128 62 575Income tax expense 54 33 63 135Profit for the period 154 95 62 440
OP-Pohjola Group statement of comprehensive income
EUR millionQ1/
2011Q1/
2010 Change, % 2010Profit for the period 154 95 62 440Change in fair value reserve Measurement at fair value -60 212 10 234 Cash flow hedge -22 - -8Translation differences 0 0 0Income tax on other comprehensive income Measurement at fair value -15 56 61 Cash flow hedge -6 - -2Total comprehensive income for the period 94 252 -63 606
OP-Pohjola Group's Interim Report for 1 January–31 March 2011 20

OP-Pohjola Group balance sheet
EUR million Liite31 March
201131 March
2010 Change, % 2010Cash and cash equivalents 588 3 446 -83 1 628Receivables from credit institutions 1 639 1 483 11 1 121
438 1 306 -66 519Derivative contracts 1 882 1 743 8 1 933Receivables from customers 57 131 53 679 6 56 834Non-life Insurance assets 14 3 415 3 412 3 164Life Insurance assets 15 7 594 6 889 10 7 544Investment assets 7 990 7 089 13 7 438Investments in associates 37 16 38Intangible assets 1 158 1 170 -1 1 159Property, plant and equipment (PPE) 710 759 -6 716Other assets 2 552 2 130 20 1 749Tax assets 115 90 28 125Total assets 85 250 83 211 2 83 969
Liabilities to credit institutions 1 879 2 261 -17 1 6960 90 0
Derivative contracts 2 157 1 637 32 1 951Liabilities to customers 38 743 38 425 1 39 205Non-life Insurance liabilities 16 2 782 2 656 5 2 350Life Insurance liabilities 17 7 275 6 683 9 7 290Debt securities issued to the public 18 19 844 19 708 1 19 577Provisions and other liabilities 3 184 2 507 27 2 333Tax liabilities 1 011 966 5 1 014Cooperative capital 655 644 2 647Subordinated liabilities 996 1 257 -21 1 178Total liabilities 78 525 76 835 2 77 243Equity capitalShare of OP-Pohjola Group's ownersShare and cooperative capital 364 357 2 368Fair value reserve 19 52 102 -49 112Other reserves 2 684 2 640 2 2 656Retained earnings 3 625 3 278 11 3 590Total equity capital 6 725 6 376 5 6 726Total liabilities and equity capital 85 250 83 211 2 83 969
Financial assets at fair value through profit or loss
Financial liabilities at fair value through profit or loss
OP-Pohjola Group's Interim Report for 1 January–31 March 2011 21

Changes in OP-Pohjola Group's equity capital
EUR million
Share andcooperative
capital
Fairvalue
measure-ment
Cash flowhedging
Otherreserves
Retainedearnings
Totalequitycapital
Balance at 1 January 2010 358 -54 - 2 604 3 280 6 187Rights issue - - - - - -Transfer of cooperative capital to equitycapital 1 - - - - 1Issue expenses - - - - - -Transfer of reserves - - - 33 -33 -Profit distribution - - - - -64 -64
Total comprehensive income for the period - 156 - - 95 252Share-based payments - - - - - -Other -2 - - 3 0 1Balance at 31 March 2010 357 102 - 2 640 3 278 6 376
EUR million
Share andcooperative
capital
Fairvalue
measure-ment
Cash flowhedging
Otherreserves
Retainedearnings
Totalequitycapital
Balance at 1 January 2011 368 118 -6 2 656 3 590 6 726Increase of share capital - - - - - -Transfer of cooperative capital to equitycapital -2 - - - - -2Transfer of reserves - - - 28 -28 -Profit distribution - - - - -73 -73
Total comprehensive income for the period - -50 -10 - 154 93Share-based payments - - - - 1 1Other -2 - - - -19 -21Balance at 31 March 2011 364 68 -16 2 684 3 625 6 725
Fair value reserve
Fair value reserve
OP-Pohjola Group's Interim Report for 1 January–31 March 2011 22

Q1/2011
Q1/2010
154 95322 462
-2 692 -2 098-469 503
54 -572 -17
-353 -733-291 -277
-97 -332-605 -647-933 -539713 1 989190 87
0 192 15
-462 819228 190-26 255780 603-26 -1974 63
-1 455 492
-12 -365 69-1 00 0
-18 -221 1
36 46
6 25-165 -18
10 129 12 408-9 475 -12 699
35 41-29 -18-73 -64
0 00 00 0
429 -325-990 213
1 689 3 282699 3 495
549 574-403 -282
126 122573 3 373699 3 495
C. Net cash from financing activitiesOther
Cash and cash equivalents at period-startCash and cash equivalents at period-end
Net change in cash and cash equivalents (A+B+C)
Interest receivedInterest paid
Cash and cash equivalentsLiquid assetsReceivables from credit institutions payable on demandTotal
Life Insurance assets
Cash flow from operating activities
Non-life Insurance assets
Derivative contracts
EUR million
Cash flow statement
Profit for the periodAdjustments to profit for the period
Increases in cooperative and share capitalDecreases in cooperative and share capital
Increases in held-to-maturity financial assets
B. Net cash used in investing activities
Returns to owner-membersIncreases in invested unrestricted equity
Other assetsIncrease (+) or decrease (-) in operating liabilities
Purchase of PPE and intangible assetsProceeds from sale of PPE and intangible assets
Decreases in held-to-maturity financial assetsAcquisition of subsidiaries, net of cash acquiredDisposal of subsidiaries, net of cash disposed
Liabilities to customers
Liabilities to credit institutionsFinancial liabilities at fair value through profit or loss
Cash flow from financing activities
Derivative contracts
Non-life Insurance liabilitiesLife Insurance liabilities
Investment assets
Receivables from customers
Increase (-) or decrease (+) in operating assetsReceivables from credit institutionsFinancial assets at fair value through profit or loss
Increases in subordinated liabilities
Dividends paid and interest on cooperative capital
Provisions and other liabilitiesIncome tax paidDividends receivedA. Net cash from operating activitiesCash flow from investing activities
Decreases in subordinated liabilitiesIncreases in debt securities issued to the publicDecreases in debt securities issued to the public
OP-Pohjola Group's Interim Report for 1 January–31 March 2011 23

Notes
Note 1. Accounting policies
Note 2. OP-Pohjola Group's formulas for key figures and ratios
Q1/2011
Q1/2010 2010
Return on equity, % 9,3 6,2 6,8Return on equity at fair value, % 5,6 16,2 9,4Return on assets, % 0,74 0,47 0,53Cost/income ratio, % 55 61 59Average personnel 12 543 12 474 12 468
Full-time 11 414 11 339 11 394Part-time 1 129 1 135 1 074
Return on equity (ROE), % Profit for the period x 100Shareholders' equity (average of the beginning and end of the period)
Return on equity at fair value, % x 100Shareholders' equity (average of the beginning and end of the period)
Return on assets (ROA), % Profit for the period x 100Balance sheet total (average of the beginning and end of the period)
Cost/income ratio, % x 100
Return on economic capital, % x 100
Operating loss ratio Claims incurred excl. Change in technical interest x 100
Operating expense ratio Operating expenses x 100
Operating combined ratio, % Operating loss ratio + operating expense ratio
Risk ratio (excl. unwinding of discount), % Claims excl. loss adjustment expenses x 100Net insurance premium revenue
Cost ratio, % Operating expenses and loss adjustment expenses x 100Net insurance premium revenue
Operating cost ratio, % x 100Expense loading x 100
Solvency ratio, % Solvency capital x 100Insurance premium revenue
(Personnel costs + other administrative expenses + other operatingexpenses)
The Financial Statements 2010 contain a description of the accounting policies, which have been applied for thisinterim report.
Information in the Financial Statements Bulletin is based on unaudited information. Since all figures in the Bulletinhave been rounded off, the sum of single figures may differ from the presented sum total.
Operating expenses before change in deferred acquisitions costs +
Insurance premium revenue excl. Change in technical interest (net)
The Interim Report for 1 January–31 March 2011 has been prepared in accordance with IAS 34 (Interim FinancialReporting).
Profit for the period + change in fair value reserve less
(Net interest income + net income from Non-life Insurance operations+ net income from Life Insurance operations + net commissions andfees + net trading income + net investment income + other operatingincome + share of associates' profits/losses)
Earnings + customer bonuses after tax (value rolling 12 month)Average economic capital
Insurance premium revenue excl. Change in technical interest (net)
OP-Pohjola Group's Interim Report for 1 January–31 March 2011 24
Note 3. OP-Pohjola Group quarterly performance
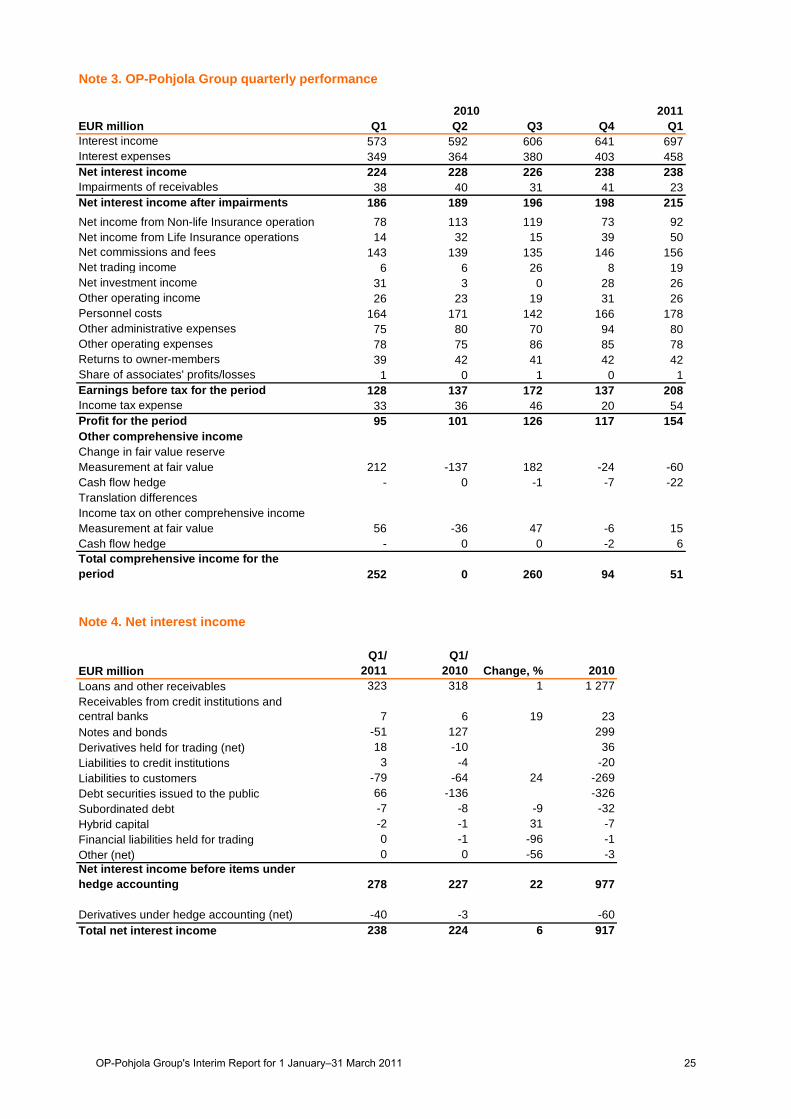
2011EUR million Q1 Q2 Q3 Q4 Q1Interest income 573 592 606 641 697Interest expenses 349 364 380 403 458Net interest income 224 228 226 238 238Impairments of receivables 38 40 31 41 23Net interest income after impairments 186 189 196 198 215Net income from Non-life Insurance operations 78 113 119 73 92Net income from Life Insurance operations 14 32 15 39 50Net commissions and fees 143 139 135 146 156Net trading income 6 6 26 8 19Net investment income 31 3 0 28 26Other operating income 26 23 19 31 26Personnel costs 164 171 142 166 178Other administrative expenses 75 80 70 94 80Other operating expenses 78 75 86 85 78Returns to owner-members 39 42 41 42 42Share of associates' profits/losses 1 0 1 0 1Earnings before tax for the period 128 137 172 137 208Income tax expense 33 36 46 20 54Profit for the period 95 101 126 117 154Other comprehensive incomeChange in fair value reserveMeasurement at fair value 212 -137 182 -24 -60Cash flow hedge - 0 -1 -7 -22Translation differencesIncome tax on other comprehensive incomeMeasurement at fair value 56 -36 47 -6 15Cash flow hedge - 0 0 -2 6Total comprehensive income for theperiod 252 0 260 94 51
Note 4. Net interest income
EUR millionQ1/
2011Q1/
2010 Change, % 2010Loans and other receivables 323 318 1 1 277Receivables from credit institutions andcentral banks 7 6 19 23Notes and bonds -51 127 299Derivatives held for trading (net) 18 -10 36Liabilities to credit institutions 3 -4 -20Liabilities to customers -79 -64 24 -269Debt securities issued to the public 66 -136 -326Subordinated debt -7 -8 -9 -32Hybrid capital -2 -1 31 -7Financial liabilities held for trading 0 -1 -96 -1Other (net) 0 0 -56 -3Net interest income before items underhedge accounting 278 227 22 977
Derivatives under hedge accounting (net) -40 -3 -60Total net interest income 238 224 6 917
2010
OP-Pohjola Group's Interim Report for 1 January–31 March 2011 25

Note 5. Impairments of receivables
EUR millionQ1/
2011Q1/
2010 Change, % 2010Impairments of receivables 32 80 -60 231Reversals of impairments -9 -39 77 -79amortised from statement of financialposition -2 -2 -1 -10Net change in group-specific impairments 3 -1 7Total 23 38 -38 149
Note 6. Net income from Non-life Insurance
EUR millionQ1/
2011Q1/
2010 Change, % 2010Net insurance premium revenue
Premiums written 474 446 6 1 023Insurance premiums ceded to reinsurers -30 -28 -6 -40Change in provision for unearnedpremiums -218 -208 -4 -13Reinsurers' share 19 18 9 -6
Total 246 227 8 964
Net Non-life Insurance claimsClaims paid 176 177 0 655Insurance claims recovered fromreinsurers -4 -15 70 -29Change in provision for unpaid claims 5 -30 19Reinsurers' share 1 22 -96 -8
Total 178 154 16 637
Net investment income, Non-life InsuranceInterest income 16 16 0 64Dividend income 21 17 30 21Property 1 1 2 1Capital gains and losses
Notes and bonds -9 31 53Shares and participations 5 -20 -2Loans and receivables -1 -1 5 1Property 0 0 3Derivatives 7 -8 -20
Fair value gains and lossesNotes and bonds 0 0 0Shares and participations -5 -16 65 -33Loans and receivables -1 -1 43 -4Property 0 0 1Derivatives 1 -4 0
Other 0 0 1Total 36 15 86
Unwinding of discount -12 -11 -4 -45Other 0 0 14Net income from Non-life Insurance 92 78 19 382
OP-Pohjola Group's Interim Report for 1 January–31 March 2011 26

Note 7. Net income from Life Insurance
EUR millionQ1/
2011Q1/
2010 Change, % 2010Premiums written 207 234 -12 1 315
Reinsurers' share -6 -6 -6 -28Total 201 229 -12 1 287
Claims incurredBenefits paid -179 -161 -11 -595Change in provision for unpaid claims 7 -21 -414Reinsurers' share 1 1 -2 7
Change in insurance contract liabilitiesChange in life insurance provision -14 -232 94 -698Reinsurers' share 1 2 -29 10
Total -184 -412 55 -1 689
Other -6 -1 -29Total 11 -184 -431
Net investment income, Llife InsuranceInterest income 13 11 18 47Dividend income 43 35 23 49Property 1 1 11 2Capital gains and losses
Notes and bonds 1 2 -27 6Shares and participations 11 18 -40 128Loans and receivables 0 1 -98 1Property 0 0 -100 0Derivatives -9 -24 62 -43
Fair value gains and lossesNotes and bonds 7 3 17Shares and participations -9 -29 69 -58Loans and receivables -3 -2 -3Property 1 - -1Derivatives 2 0 2
Other 3 6 11Assets serving as cover for unit-linkedpolicies
Shares and participationsCapital gains and losses -12 5 53Fair value gains and losses -16 167 297Other 7 5 31 23
Total 39 199 -80 531
Net income from Non-life Insurance 50 14 100
OP-Pohjola Group's Interim Report for 1 January–31 March 2011 27

Note 8. Net commissions and fees
EUR millionQ1/
2011Q1/
2010 Change, % 2010Commission income
Lending 40 37 10 153Deposits 1 1 3 5Payment transfers 39 35 12 150Securities brokerage 10 7 37 30Securities issuance 2 5 -61 13Mutual funds brokerage 26 21 24 89Asset management and legal services 17 15 12 65Insurance brokerage 19 22 -11 57Guarantees 6 5 9 23Other 10 9 5 39
Total 170 157 8 624
Commission expenses 14 13 4 61
Net commissions and fees 156 143 9 563
Note 9. Net trading income
EUR millionQ1/
2011Q1/
2010 Change, % 2010Capital gains and losses
Notes and bonds -3 5 20Shares and participations 2 0 2Derivatives 17 -13 -13
Changes in fair valueNotes and bonds 1 5 -88 3Shares and participations -1 3 5Derivatives 3 1 12
Financial assets and liabilities amortised at costCapital gains and losses
Loans and other receivables - - -Dividend income 0 0 -36 1operations 2 4 -47 17Total 19 6 46
OP-Pohjola Group's Interim Report for 1 January–31 March 2011 28

Note 10. Net investment income
EUR millionQ1/
2011Q1/
2010 Change, % 2010Available-for-sale financial assetsCapital gains and losses
Notes and bonds 6 16 -65 32Shares and participations 7 3 13
Financial assets and liabilities amortised atcost
Capital gains and lossesLoans and other receivables 1 4 1
Other - - -Dividend income 8 10 -18 15Impairment losses 0 -5 -97 -17Total 21 28 -24 44Investment property
Rental income 10 12 -11 45Maintenance charges and expenses -7 -7 4 -29losses 2 -2 1Other 0 0 -63 0
Total 5 3 91 18Other - - -Net investment income 26 31 -14 62
Note 11. Other operating income
EUR millionQ1/
2011Q1/
2010 Change, % 2010Income from property and businesspremises in own use 4 4 -7 15Other 22 21 4 84Total 26 26 2 99
OP-Pohjola Group's Interim Report for 1 January–31 March 2011 29
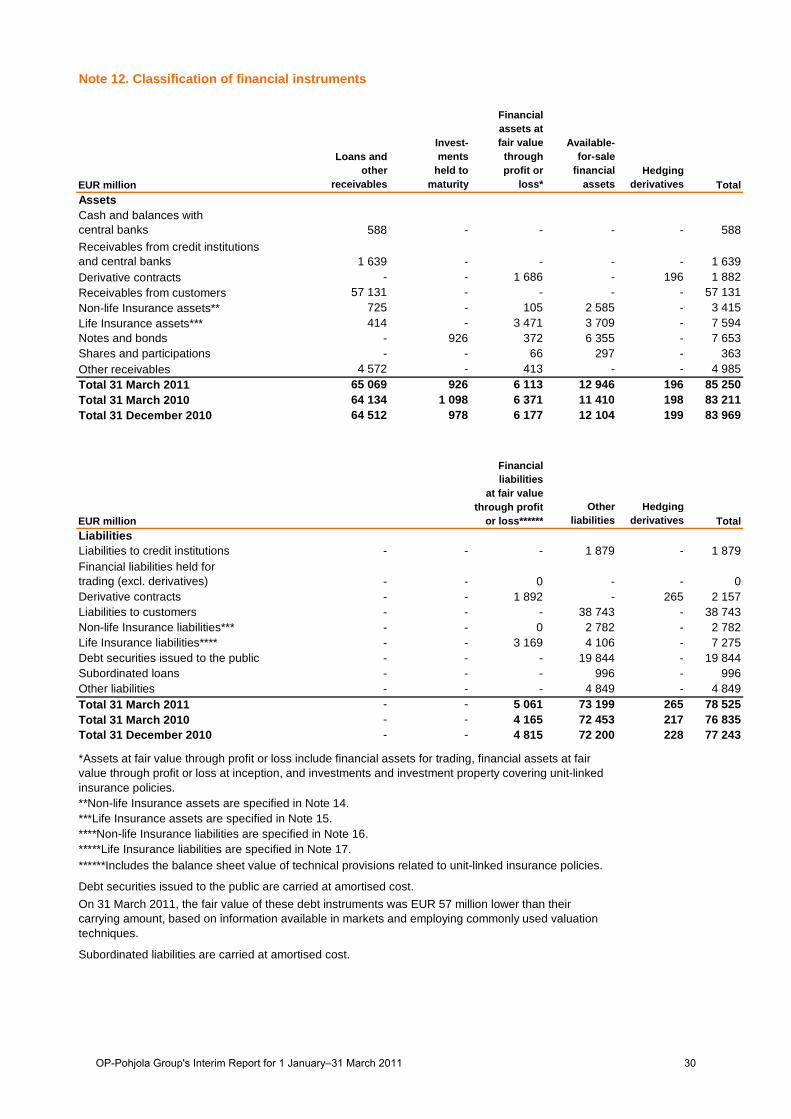
Note 12. Classification of financial instruments
EUR million
Loans andother
receivables
Invest-ments
held tomaturity
Financialassets atfair value
throughprofit or
loss*
Available-for-sale
financialassets
Hedgingderivatives Total
AssetsCash and balances withcentral banks 588 - - - - 588Receivables from credit institutionsand central banks 1 639 - - - - 1 639Derivative contracts - - 1 686 - 196 1 882Receivables from customers 57 131 - - - - 57 131Non-life Insurance assets** 725 - 105 2 585 - 3 415Life Insurance assets*** 414 - 3 471 3 709 - 7 594Notes and bonds - 926 372 6 355 - 7 653Shares and participations - - 66 297 - 363Other receivables 4 572 - 413 - - 4 985Total 31 March 2011 65 069 926 6 113 12 946 196 85 250Total 31 March 2010 64 134 1 098 6 371 11 410 198 83 211Total 31 December 2010 64 512 978 6 177 12 104 199 83 969
EUR millionOther
liabilitiesHedging
derivatives TotalLiabilitiesLiabilities to credit institutions - - - 1 879 - 1 879Financial liabilities held fortrading (excl. derivatives) - - 0 - - 0Derivative contracts - - 1 892 - 265 2 157Liabilities to customers - - - 38 743 - 38 743Non-life Insurance liabilities*** - - 0 2 782 - 2 782Life Insurance liabilities**** - - 3 169 4 106 - 7 275Debt securities issued to the public - - - 19 844 - 19 844Subordinated loans - - - 996 - 996Other liabilities - - - 4 849 - 4 849Total 31 March 2011 - - 5 061 73 199 265 78 525Total 31 March 2010 - - 4 165 72 453 217 76 835Total 31 December 2010 - - 4 815 72 200 228 77 243
**Non-life Insurance assets are specified in Note 14.***Life Insurance assets are specified in Note 15.****Non-life Insurance liabilities are specified in Note 16.*****Life Insurance liabilities are specified in Note 17.
Debt securities issued to the public are carried at amortised cost.On 31 March 2011, the fair value of these debt instruments was EUR 57 million lower than theircarrying amount, based on information available in markets and employing commonly used valuationtechniques.
******Includes the balance sheet value of technical provisions related to unit-linked insurance policies.
Financialliabilities
at fair valuethrough profit
or loss******
*Assets at fair value through profit or loss include financial assets for trading, financial assets at fairvalue through profit or loss at inception, and investments and investment property covering unit-linkedinsurance policies.
Subordinated liabilities are carried at amortised cost.
OP-Pohjola Group's Interim Report for 1 January–31 March 2011 30

Fair value of assets on 31 March 2011,EUR million Level 1* Level 2** Level 3*** TotalRecognised at fair value through profit or loss
Banking 339 84 15 438Non-life Insurance - - 8 8Life Insurance - - 122 122
Derivative financial instrumentsBanking 19 1 715 148 1 882Non-life Insurance 1 2 0 3Life Insurance - - - -
Available-for-saleBanking 5 626 972 54 6 652Non-life Insurance 1 742 612 231 2 585Life Insurance 2 686 310 713 3 709
Total 10 413 3 695 1 292 15 400
Fair value of assets on 31 Dec 2010, EURmillion Level 1* Level 2** Level 3*** TotalRecognised at fair value through profit or loss
Banking 307 199 14 519Non-life Insurance - - 8 8Life Insurance - - 116 116
Derivative financial instrumentsBanking 32 1 764 137 1 933Non-life Insurance - 1 - 1Life Insurance - - - 0
Available-for-saleBanking 5 379 592 61 6 032Non-life Insurance 1 563 648 231 2 442Life Insurance 2 428 496 705 3 629
Total 9 709 3 700 1 272 14 681
Fair value of liabilities on 31 March 2011,EUR million Level 1* Level 2** Level 3*** TotalRecognised at fair value through profit or loss
Banking 0 - - 0Non-life Insurance - - - -Life Insurance - - - -
Derivative financial instrumentsBanking 6 2 124 26 2 157Non-life Insurance 0 0 - 0Life Insurance - 6 - 6
Total 7 2 130 26 2 163
Fair value of liabilities on 31 Dec 2010,EUR million Level 1* Level 2** Level 3*** TotalRecognised at fair value through profit or loss
Banking 0 - - 0Non-life Insurance - - - -Life Insurance - - - -
Derivative financial instrumentsBanking 22 1 917 12 1 951Non-life Insurance 1 0 - 2Life Insurance - - - -
Total 24 1 917 12 1 953
Note 13. Financial instruments recognised at fair value,grouped by valuation technique
OP-Pohjola Group's Interim Report for 1 January–31 March 2011 31

Transfers between levels of the fair value hierarchy
Note 14. Non-life Insurance assets
EUR million31 March
201131 March
2010 Change, % 2010Investments
Loan and other receivables 178 400 -56 229Shares and participations 556 434 28 400Property 94 78 21 87Notes and bonds 1 476 1 349 9 1 490Derivatives 3 0 1Other participations 561 712 -21 561
Total 2 868 2 973 -4 2 768Other assets
Prepayments and accrued income 33 33 1 38Other
Arising from direct insurance operations 336 310 9 228Arising from reinsurance operations 112 92 22 87Cash in hand and at bank 10 3 0 4Other receivables 55 - 39
Total 547 439 25 396Non-life Insurance assets 3 415 3 412 0 3 164
* This level includes equities listed on major stock exchanges, quoted corporate debt instruments,bonds issued by governments and financial institutions with credit rating of at least A-, and exchange-traded derivatives. The fair value of these instruments is determined on the basis of market quotes.
** Valuation techniques based on observable input parameters. The fair value of the instrumentsincluded within this level means value derived from the market price of a financial instrument'scomponents or similar financial instruments; or value which can be determined using commonly usedvaluation models and techniques if the inputs significant to the fair value measurement are based onobservable market data. The fair value hierarchy level at Pohjola Group includes OTC derivatives,treasury bills/notes, debt instruments issued by companies and financial institutions, repo agreements,and securities lent or borrowed.
*** Valuation techniques whose input parameters involve special uncertainty. The fair valuedetermination of the financial instruments included within this level contains inputs not based onobservable market data (unobservable inputs). This level includes the most complex OTC derivatives,certain private equity investments, and illiquid bonds, structured bonds, including securitised bonds andstructured debt securities, and hedge funds.
Within Non-life Inurance, in the first quarter of 2011 EUR 18.4 million in Portuguese and Irishgovernment bonds were transferred from level 1 to level 2, due to changes in credit ratings.
OP-Pohjola Group's Interim Report for 1 January–31 March 2011 32
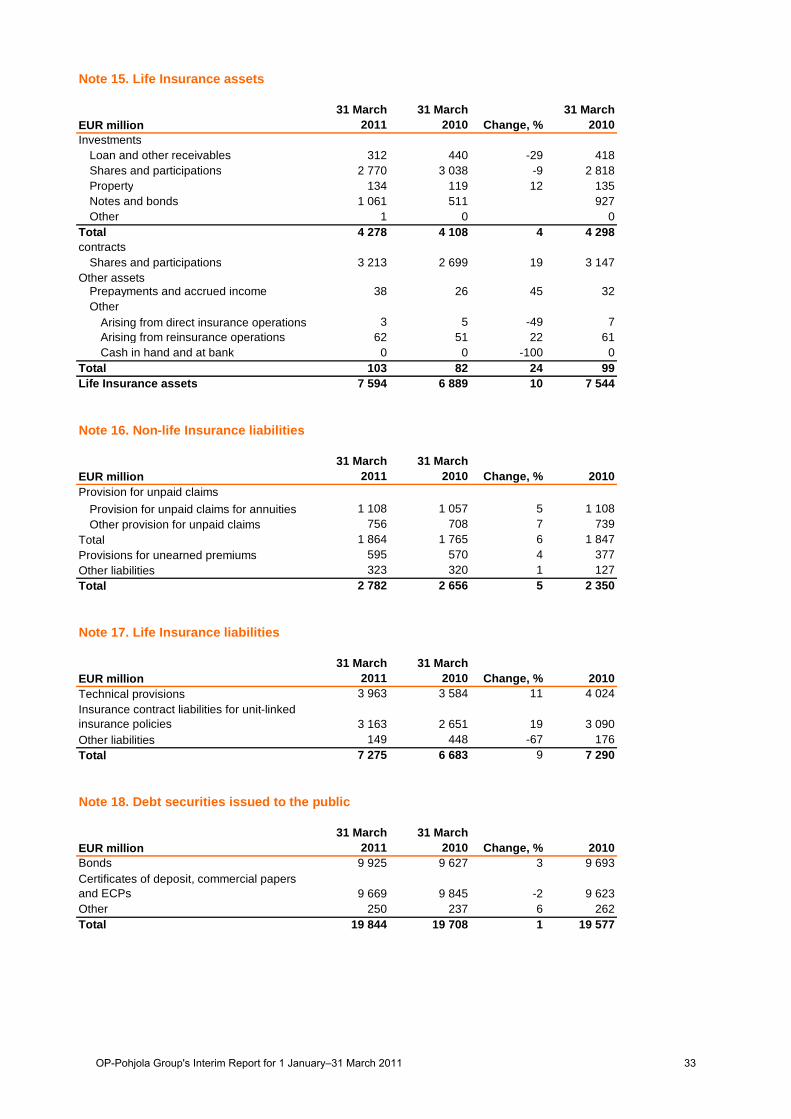
Note 15. Life Insurance assets
EUR million31 March
201131 March
2010 Change, %31 March
2010Investments
Loan and other receivables 312 440 -29 418Shares and participations 2 770 3 038 -9 2 818Property 134 119 12 135Notes and bonds 1 061 511 927Other 1 0 0
Total 4 278 4 108 4 4 298contracts
Shares and participations 3 213 2 699 19 3 147Other assets
Prepayments and accrued income 38 26 45 32Other
Arising from direct insurance operations 3 5 -49 7Arising from reinsurance operations 62 51 22 61Cash in hand and at bank 0 0 -100 0
Total 103 82 24 99Life Insurance assets 7 594 6 889 10 7 544
Note 16. Non-life Insurance liabilities
EUR million31 March
201131 March
2010 Change, % 2010Provision for unpaid claims
Provision for unpaid claims for annuities 1 108 1 057 5 1 108Other provision for unpaid claims 756 708 7 739
Total 1 864 1 765 6 1 847Provisions for unearned premiums 595 570 4 377Other liabilities 323 320 1 127Total 2 782 2 656 5 2 350
Note 17. Life Insurance liabilities
EUR million31 March
201131 March
2010 Change, % 2010Technical provisions 3 963 3 584 11 4 024Insurance contract liabilities for unit-linkedinsurance policies 3 163 2 651 19 3 090Other liabilities 149 448 -67 176Total 7 275 6 683 9 7 290
Note 18. Debt securities issued to the public
EUR million31 March
201131 March
2010 Change, % 2010Bonds 9 925 9 627 3 9 693Certificates of deposit, commercial papersand ECPs 9 669 9 845 -2 9 623Other 250 237 6 262Total 19 844 19 708 1 19 577
OP-Pohjola Group's Interim Report for 1 January–31 March 2011 33

Note 19. Fair value reserve after income tax
EUR million31 March
201131 March
2010 Change, % 2010Notes and bonds -79 11 -75Shares and participations 147 91 62 194Other -16 - -6Total 52 102 -49 112
Note 20. Capital structure and capital adequacy
Capital structure and capital adequacy, € mill.31 March
201131 March
2010 Change, % 2010Tier 1 capitalOP-Pohjola Group's equity capital 6 725 6 376 5 6 726The effect of insurance companies on theGroup’s shareholders’ equity is excluded(incl. OVY's technical provisions) 29 239 -88 -28Fair value reserve, transfer to Tier 2 31 -22 21Supplementary cooperative capital notincluded in equity capital 655 644 2 644Tier 1 capital before deductions and hybridcapital 7 440 7 237 3 7 363Hybrid capital 222 222 222Intangible assets -325 -286 14 -323Excess funding of pension liability and fairvalue measurement of investment property -376 -368 2 -373Planned profit distribution / profit distributionas proposed by the Board -20 -12 68 -69Investment in insurance companies andfinancial institutions -1 371 -1 312 4 -1 234Impairments – shortfall of expected losses -124 -183 -32 -131Net Tier 1 capital 5 446 5 298 3 5 454
Tier 2 capitalFair value reserve (excl. cash flow hedgevaluation) -15 22 -15Perpetual bonds 293 298 -2 295OVY's equalisation provision 208 0 207Debenture loans 457 689 -34 609Investment in insurance companies andfinancial institutions -944 -1 009 -7 -1 095Net Tier 2 capitalTotal capital base 5 446 5 298 3 5 454
Minimum capital requirementCredit and counterparty risk 3 164 3 039 4 3 153Market risk 47 46 1 37Operational risk 232 282 -18 228Total 3 443 3 367 2 3 418
Capital adequacy ratio, % 12,7 12,6 12,8Tier 1 ratio, % 12,7 12,6 12,8
A negative fair value reserve may recover by means of asset appreciation and recognised impairments.
The fair value reserve before tax amounted to EUR 70 million (151) and the related deferred tax liabilityto EUR 18 million (deferred tax asset EUR 39 million). On 31 March, positive mark-to-market valuationsof equity instruments in the fair value reserve totalled EUR 269 million (286) million and negative mark-to-market valuations EUR 64 million (19).
OP-Pohjola Group's Interim Report for 1 January–31 March 2011 34
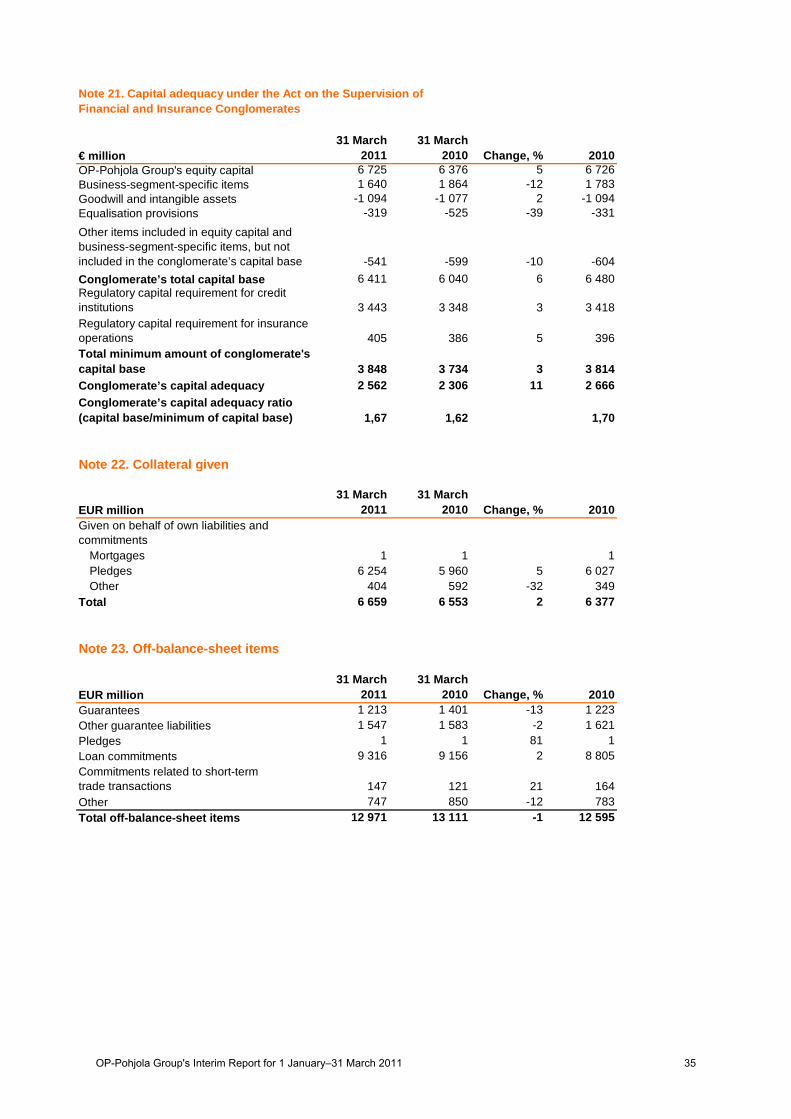
€ million31 March
201131 March
2010 Change, % 2010OP-Pohjola Group's equity capital 6 725 6 376 5 6 726Business-segment-specific items 1 640 1 864 -12 1 783Goodwill and intangible assets -1 094 -1 077 2 -1 094Equalisation provisions -319 -525 -39 -331
Other items included in equity capital andbusiness-segment-specific items, but notincluded in the conglomerate’s capital base -541 -599 -10 -604Conglomerate’s total capital base 6 411 6 040 6 6 480Regulatory capital requirement for creditinstitutions 3 443 3 348 3 3 418Regulatory capital requirement for insuranceoperations 405 386 5 396Total minimum amount of conglomerate'scapital base 3 848 3 734 3 3 814Conglomerate’s capital adequacy 2 562 2 306 11 2 666Conglomerate’s capital adequacy ratio(capital base/minimum of capital base) 1,67 1,62 1,70
Note 22. Collateral given
EUR million31 March
201131 March
2010 Change, % 2010Given on behalf of own liabilities andcommitments
Mortgages 1 1 1Pledges 6 254 5 960 5 6 027Other 404 592 -32 349
Total 6 659 6 553 2 6 377
Note 23. Off-balance-sheet items
EUR million31 March
201131 March
2010 Change, % 2010Guarantees 1 213 1 401 -13 1 223Other guarantee liabilities 1 547 1 583 -2 1 621Pledges 1 1 81 1Loan commitments 9 316 9 156 2 8 805Commitments related to short-termtrade transactions 147 121 21 164Other 747 850 -12 783Total off-balance-sheet items 12 971 13 111 -1 12 595
Note 21. Capital adequacy under the Act on the Supervision ofFinancial and Insurance Conglomerates
OP-Pohjola Group's Interim Report for 1 January–31 March 2011 35

Note 24. Derivative contracts
31 March 2011, EUR million <1 year 1-5 years >5 years Total Assets sInterest rate derivatives 48 292 70 922 31 756 150 970 1 379 1 297Currency derivatives 16 856 2 317 530 19 703 266 633Equity and index-linkedderivatives 175 994 29 1 198 119 0Credit derivatives 23 252 - 275 5 -1Other derivatives 3 315 246 - 3 562 21 52Total derivatives 68 662 74 732 32 314 175 708 1 790 1 982
31 March 2010, EUR million <1 year 1-5 years >5 years Total Assets sInterest rate derivatives 50 516 46 869 15 958 113 344 1 464 1 371Currency derivatives 12 591 2 083 497 15 171 290 326Equity and index-linkedderivatives 125 835 23 983 105 -Credit derivatives 30 178 - 208 4 2Other derivatives 3 826 284 - 4 111 4 18Total derivatives 67 089 50 249 16 479 133 816 1 868 1 718
Note 25. Related-party transactions
The related parties of OP-Pohjola Group include associates, administrative personnel and other relatedparty companies. The administrative personnel comprise OP-Pohjola Group's Executive Chairman(Chairman of the Executive Board of OP-Pohjola Group Central Cooperative), President of OP-PohjolaGroup Central Cooperative, members and deputy members of the Executive and Supervisory Boardsand their close relatives. Related parties also include companies over which a person amongadministrative personnel or his close family member exercises significant influence. Other communitiesconsidered as related parties include OP Bank Group Pension Fund and OP Bank Group PensionFoundation.
Standard terms and conditions for credit are applied to loans granted to the related parties. Loans aretied to generally used reference rates.
Related-party transactions have not undergone any substantial changes since 31 December 2010.
Fair values*Nominal values / remaining term to maturity
*Fair values include accrued interest which is shown under other assets or provisions andother liabilities in the balance sheet.
Fair values*Nominal values / remaining term to maturity
OP-Pohjola Group's Interim Report for 1 January–31 March 2011 36

Helsinki, 4 May 2011.
OP-Pohjola Group Central CooperativeExecutive Board
ADDITIONAL INFORMATION
DISTRIBUTIONNASDAQ OMX Helsinki LtdLondon Stock ExchangeMajor mediaop.fi and pohjola.fi
Pohjola Bank plc will publish its own interim report.
Executive Chairman Reijo Karhinen, tel. +358 (0)10 252 4500Harri Luhtala, CFO, tel. +358 (0)10 252 2433Carina Geber-Teir, Chief Communications Officer, tel. +358 (0)10 252
OP-Pohjola Group's financial performance will be presented to the media by Executive Chairman ReijoKarhinen in a press conference on 4 May 2011 at 12 noon at Teollisuuskatu 1 b, Vallila, Helsinki.
Interim reports for six and nine months will be published on 3 August and 2 November 2011,respectively.
OP-Pohjola Group's Interim Report for 1 January–31 March 2011 37