op peennrreepoorrtt ss ... of contents introduction 3 administration console
TRANSCRIPT

OOOPPPEEENNNRRREEEPPPOOORRRTTTSSS
OOPPEENNRREEPPOORRTTSS AADDMMIINNIISSTTRRAATTIIOONN GGUUIIDDEE
VVEERRSSIIOONN 33..00

Table of Contents
INTRODUCTION .......................................................................................................................................................................... 3
ADMINISTRATION CONSOLE ................................................................................................................................................. 4
REPORT DATASOURCES .......................................................................................................................................................... 5
REPORTS ....................................................................................................................................................................................... 6
Report Definition .......................................................................................................................................................................... 7 QueryReports ................................................................................................................................................................................ 8 ChartReports ................................................................................................................................................................................. 9 Adding Report Parameters .......................................................................................................................................................... 10 JasperReports Export Options ..................................................................................................................................................... 11 Additional Report Information .................................................................................................................................................... 12
REPORT PARAMETERS .......................................................................................................................................................... 13
Query Parameters ........................................................................................................................................................................ 13 List Parameters ........................................................................................................................................................................... 14 Boolean Parameters .................................................................................................................................................................... 16 Additional Parameter Information .............................................................................................................................................. 17
CHARTS ....................................................................................................................................................................................... 18
Chart Definitions ......................................................................................................................................................................... 19 Bar Chart ................................................................................................................................................................................. 20 Pie and Ring Charts ................................................................................................................................................................. 20 XY Chart .................................................................................................................................................................................. 20 Time Chart ............................................................................................................................................................................... 21
Charts in JasperReports ............................................................................................................................................................... 22 Drill-Down ChartReports ............................................................................................................................................................ 23
ONLINE ANALYTICAL PROCESSING (OLAP) ................................................................................................................... 24
USERS AND GROUPS ................................................................................................................................................................ 25
User Administration .................................................................................................................................................................... 26 Report Groups ............................................................................................................................................................................. 27
SCHEDULED REPORTS ........................................................................................................................................................... 28
QUERYREPORT TEMPLATES ............................................................................................................................................... 29
EXTERNAL/DRILL-DOWN REPORT EXECUTION ........................................................................................................... 31
OPENREPORTS PROFESSIONAL FEATURES .................................................................................................................... 32
Report DashBoard ....................................................................................................................................................................... 33 Alerts and Conditional Scheduling ............................................................................................................................................. 34 Scheduler Administration ........................................................................................................................................................... 36 Report Statistics .......................................................................................................................................................................... 37
OPENREPORTS SYSTEMS ADMINISTRATION ................................................................................................................. 38
Cache .......................................................................................................................................................................................... 38 Localization ................................................................................................................................................................................ 38 Eclipse BIRT ............................................................................................................................................................................... 38 Spring Configuration .................................................................................................................................................................. 39
DICTIONARY ............................................................................................................................................................................. 40
ROLE DEFINITIONS ................................................................................................................................................................. 41
LICENSE AND CREDITS .......................................................................................................................................................... 42

Introduction
OpenReports is a powerful, flexible, and easy to use open source web reporting solution that provides browser based, parameter driven, dynamic report generation and flexible report scheduling capabilities.
OpenReports supports a variety of open source reporting engines, including JasperReports, JFreeReport, JXLS, and Eclipse BIRT, to provide support for a wide range of reporting requirements and capabilities. OpenReports also supports QueryReports and ChartReports, easy to create SQL based reports that do not require a predefined report definition.
OpenReports provides a web based report generation and administration interface with the following features:
Support for a wide variety of export formats including PDF, HTML, CSV, XLS, RTF, and Image.
Web based Administration of Users, Groups, Reports, Charts, Parameters, and DataSources
Flexible Scheduling capabilities including Daily, Weekly, and Monthly options and multiple recipients.
Comprehensive Report Parameter support including Date, Text, List, Query, and Boolean parameters.
Fine-grained security controls access to Reports, Scheduling, and Administration functionality.
Report Auditing tracks start time, duration, status, and user of every report generated.
Support for multiple JNDI or Connection Pool DataSources for use in generating reports.
Support for Drill Down reports and external application integration via secure report generation URL
OpenReports report generation and scheduling capabilities are also available directly via the ReportService, a Service-oriented architecture (SOA) for report generation and scheduling. The ReportService provides the ability to quickly add reporting functionality to existing or new applications through a comprehensive and flexible API exposed as a SOAP web service and to HTTP GET/PUT requests.
OpenReports Professional, the commercial version of OpenReports, includes all the features of the open source version and introduces advanced functionality, including the Reporting Dashboard, Alerts, Conditional Report Scheduling, and Report Statistics at an affordable price point.

Administration Console
The OpenReports Administration console provides the ability to manage Reports, DataSources, Parameters, Users, Groups, Charts, and other important settings.
Note
Tables with clickable headers, such as the list of reports in the following example are sortable.

Report DataSources
Report DataSources are used to run queries in reports, parameters, and charts. Report DataSources can be either JNDI DataSources or connection pools. Each report, parameter, or chart can be assigned its own DataSource. At least one Report DataSource should be created before defining any reports, parameters, or charts.
To create a Report DataSource, click on the DataSources link in the Administration Menu, and then click on
the Add DataSource link in the top center of the page.
Notes:
When the Ok button is pressed, OpenReports tests the DataSource by trying to get a connection. If an error
message is displayed, check the connection properties and try again.
JNDI DataSources require only Name and URL. See the Dictionary for definitions of the connection pool properties.

Reports
In order to deploy a report though OpenReports, you must define each report, add any required parameters, and assign the report to a group. If you are using a predefined report, such as a JasperReport, JFreeReport, or JXLS template, you must upload the associated report file before defining the report. OpenReports supports uploading compiled JasperReports files (.jasper), JasperReports report definition (.jrxml) files, JFreeReport files (.xml), JXLS templates (.xls), and Eclipse BIRT files (.rptdesign).
Important
When uploading compiled JasperReports (.jasper) files, the version of JasperReports used to compile the report must be in sync with OpenReports. If users are having problems running reports, verify that the reports were compiled with the same version of the JasperReports jar file that is in the openreports/WEB-INF/lib directory or try uploading the JasperReports definition files (.jrxml) file instead.
Report Definition
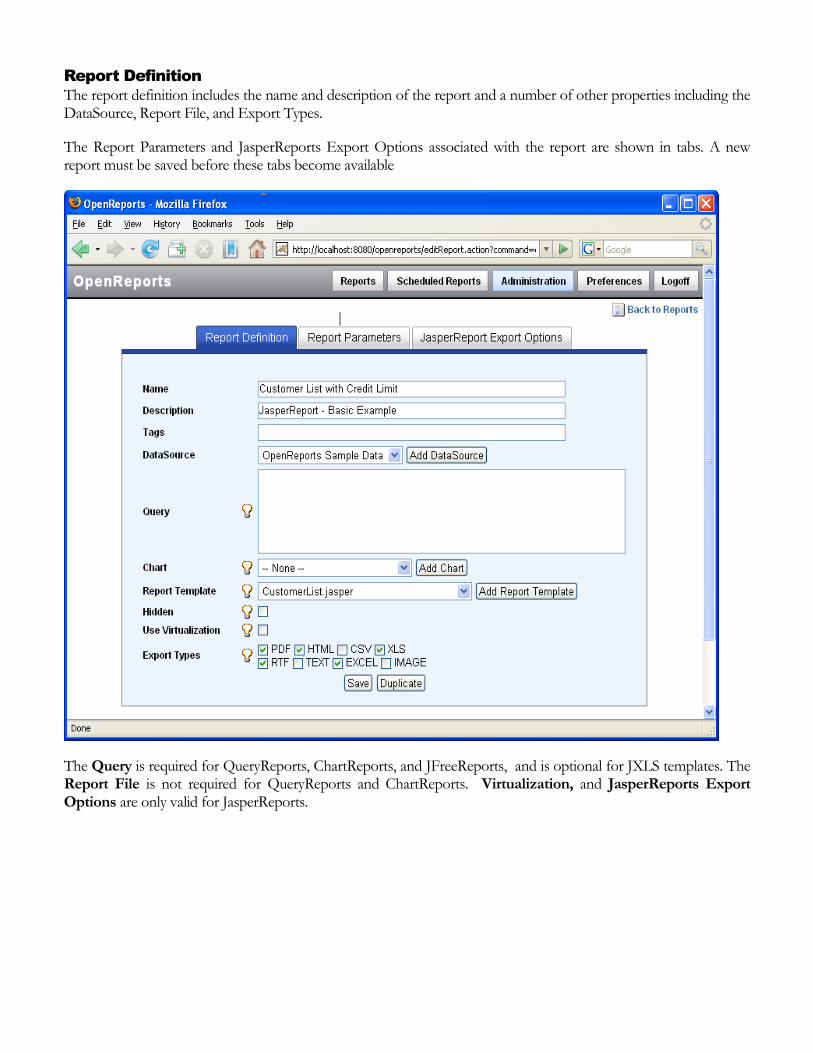
The report definition includes the name and description of the report and a number of other properties including the DataSource, Report File, and Export Types.
The Report Parameters and JasperReports Export Options associated with the report are shown in tabs. A new report must be saved before these tabs become available
The Query is required for QueryReports, ChartReports, and JFreeReports, and is optional for JXLS templates. The Report File is not required for QueryReports and ChartReports. Virtualization, and JasperReports Export Options are only valid for JasperReports.

QueryReports
QueryReports are reports created directly from SQL queries. Query Reports are displayed as a table in an HTML page and support paging, sorting, scheduling, and exporting to XLS, CSV, and PDF.
A query report is added to OpenReports in the same manner as other reports. The only difference is that a valid query must be entered in the query field. The report file field can be left blank or used to specify a QueryReport (.vm) , JFreeReport (.xml), or JXLS Report (.xls) template. See the QueryReport Templates section for
more information on using FreeMarker templates to customize the output of QueryReports.
JXLS Support
JXLS Reports use Excel (.xls) templates to generate reports. OpenReports supports the use of JXLS templates as the output format for QueryReports. OpenReports also supports embedded SQL in JXLS reports, in which case the Query field would be left blank. See the example reports, Customers.xls, ProductLines.xls, and OpenReportsActivity.xls for example JXLS templates.

ChartReports
ChartReports are reports created directly from OpenReports chart definitions. The only required fields are Name, Description, and Chart. See the Charts chapter for more information on defining charts.

Adding Report Parameters
The Report Parameters tab is used to associate parameters with a report. Report Parameters are given a
Step and a Sort Order and can be marked as Required.
The Step property is used to prompt to the user to enter parameters in a series of steps, or pages. The Sort
Order sets the order of parameters within a given step.
Important
In order to use Compound Parameters, parameters that are built from the values of a previous chosen parameter, the first parameter must be in added to the report in a prior Step then the dependent parameter.

JasperReports Export Options
The JasperReports Export Options tab on Report definition page is used to set a number of export options.
This tab is only displayed for JasperReports and these options are only applied when exporting JasperReports to XLS or HTML.
Additional Report Information
Note
If the Report DataSource is set to none, a JREmptyDataSource will be passed to the report. This is useful for reports that do not contain queries.

Report Parameters
Report Parameters are defined via the Parameters link in the Administration menu and are associated with
reports in the Report Definition.
Important
In order for JasperReports and BIRT to recognize the parameters, the name and class of the Report Parameter must match the name and class of the parameter defined in the report definition file. When prompting the user for a parameter, OpenReports displays the parameter description instead of the name.
Note
OpenReports automatically passes the following parameters to all reports: OPENREPORTS_USER_ID, OPENREPORTS_USER_EXTERNALID, OPENREPORTS_USER_NAME, OPENREPORTS_EXPORT_TYPE, and
OPENREPORTS_IMAGE_DIR
When running a report, the end user is prompted to enter a value for the parameters associated with the report. The following example illustrates the appearance of the Query, List, and Text parameters to the end
user.
Query Parameters
Query Parameters are used to prompt a user to select from a list of the values returned from a query. In order to create a Query Parameter, change the Type to Query, enter the query in the Data field, and select the
corresponding DataSource.

The query used in this example, select distinct productcode, productname from products
where productline = $P{ProductLine}, is an example of a compound parameter. Compound
parameters are parameters that are built from the values of a previously chosen parameter. For example, this parameter will display a list of Products based on the value of the $P{ProductLine} parameter. The
$P{ProductLine} parameter must be added to the Report Definition before the new parameter will work. See
the Report Definition section for more information.
Note
If the query contains two columns, OpenReports will display the value of the second column as the parameter on the web page, but send the value of the first column to the report. For example, the query 'select statecode, statename from states' will show the list of state names as available parameters, but send the state code of the chosen state to the report.
List Parameters
List Parameters are used to prompt a user to select from a list of the values contained in a pipe delimited data String. Optionally, a description for each value can be specified using a colon delimited String. In the example below ‘Small’,
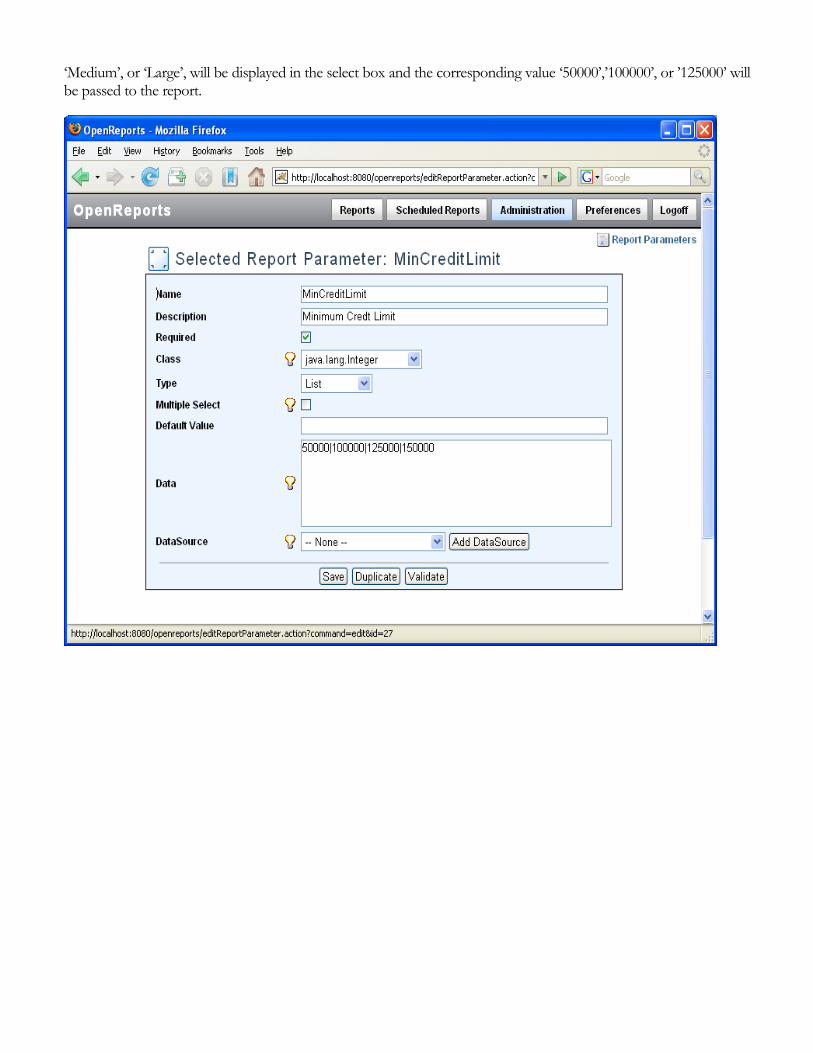
‘Medium’, or ‘Large’, will be displayed in the select box and the corresponding value ‘50000’,’100000’, or ’125000’ will be passed to the report.
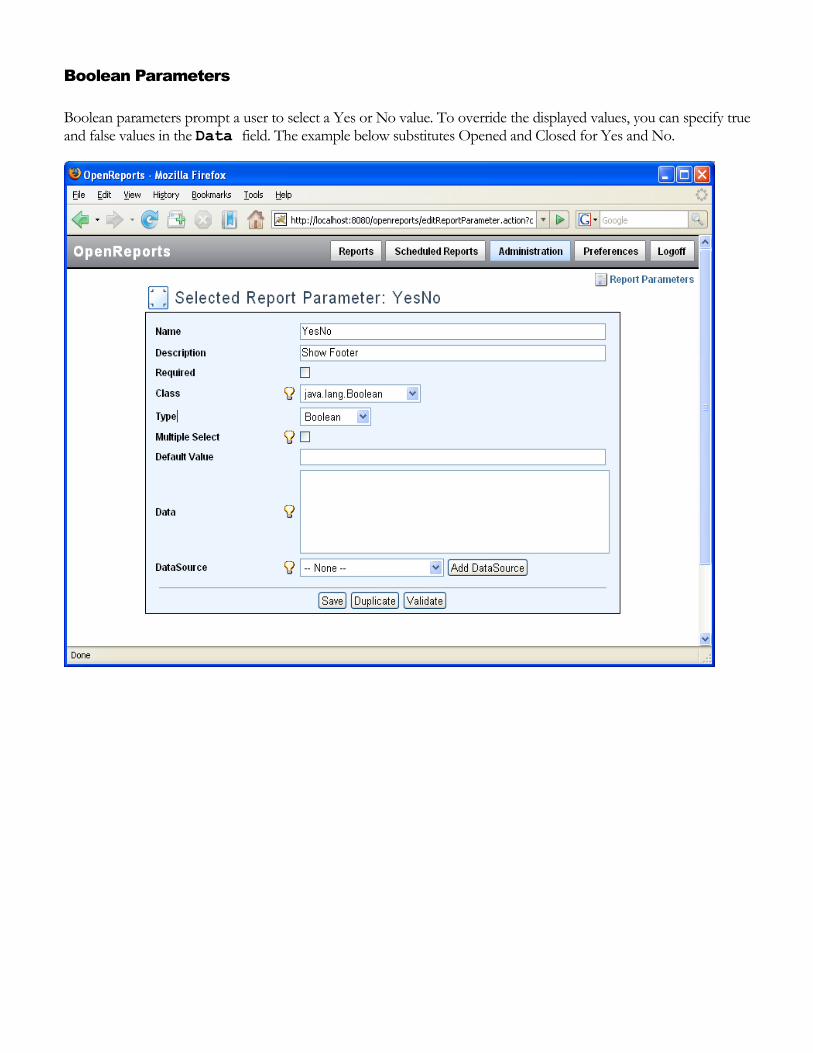
Boolean Parameters
Boolean parameters prompt a user to select a Yes or No value. To override the displayed values, you can specify true and false values in the Data field. The example below substitutes Opened and Closed for Yes and No.

Additional Parameter Information
OpenReports includes two other parameter types, Text and Date.
Text parameters are used to prompt the user to type in a value. Date parameters are similar to Text parameters,
with the addition of a date picker component.
Multi-Select Query and List parameters will display a list of possible values and allow the user to select
more then one value.
The selected values will be passed to the report as a String in the following format:: 'Austria','Canada','France' . This value can be used in the report query, for example:
SELECT orderid, employeeid, freight, shipcountry
FROM orders
WHERE shipcountry IN ($P!{CountryList})
ORDER BY shipcountry
The automatic parameter, OPENREPORTS_REPORT_DIR, should be used load SubReports. In order to use
OPENREPORTS_REPORT_DIR to load SubReports, you must add the following parameter to your JasperReports
definition:
<parameter name="OPENREPORTS_REPORT_DIR" class="java.io.File"/>

Charts
ChartReports use JFreeCharts, the leading open source charting package, to provide the ability to dynamically generate charts without the need to write any code. In order to create a ChartReport you must create a chart definition and then add the chart and the chart query parameters to the report.
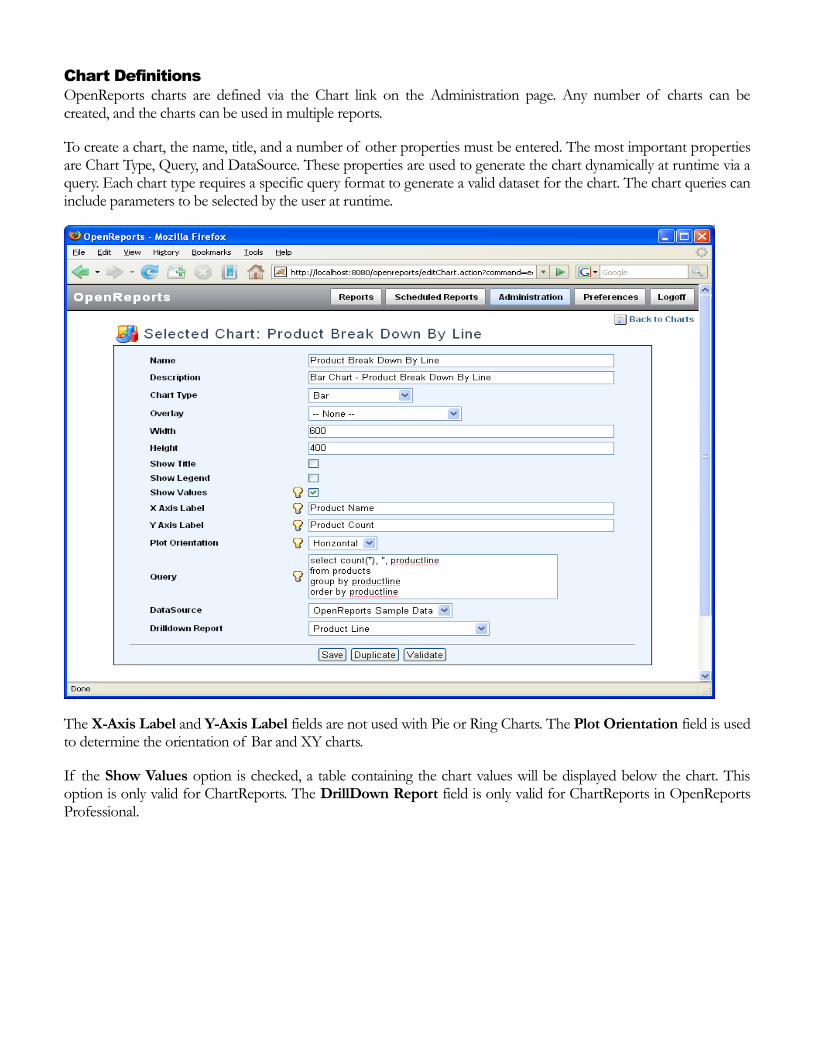
Chart Definitions
OpenReports charts are defined via the Chart link on the Administration page. Any number of charts can be created, and the charts can be used in multiple reports.
To create a chart, the name, title, and a number of other properties must be entered. The most important properties are Chart Type, Query, and DataSource. These properties are used to generate the chart dynamically at runtime via a query. Each chart type requires a specific query format to generate a valid dataset for the chart. The chart queries can include parameters to be selected by the user at runtime.
The X-Axis Label and Y-Axis Label fields are not used with Pie or Ring Charts. The Plot Orientation field is used to determine the orientation of Bar and XY charts.
If the Show Values option is checked, a table containing the chart values will be displayed below the chart. This option is only valid for ChartReports. The DrillDown Report field is only valid for ChartReports in OpenReports Professional.

OpenReports currently supports five types of charts, Bar, Pie, Ring, Time, and XY charts. The following examples illustrate the query format required for each chart.
Bar Chart
The query format for Bar Chart reports is
SELECT value, series, category FROM ... WHERE... GROUP BY... ORDER BY...
For example:
The following query produces a bar chart of the number of orders by city and country:
SELECT count(*), shipcity, shipcountry
FROM orders
WHERE shipcountry LIKE 'A%' OR shipcountry LIKE 'B%'
GROUP BY shipcity ORDER BY shipcountry, shipcity
This query produces a bar chart of the number orders by city for a given country. To use a parameter with a chart query, the matching report parameter must be added to the report via the Report admin page.
SELECT count(*), shipcity
FROM orders
WHERE shipcountry = $P{Country} GROUP BY shipcity
Pie and Ring Charts
The query format for Pie Chart reports is
SELECT value, key FROM ... WHERE... GROUP BY... ORDER BY...
For example:
This query produces a pie chart displaying the allocation of addresses for each city in the address table
SELECT count(*), city FROM address GROUP BY city
XY Chart
The query format for XY Chart reports is
SELECT series, value1, value2 FROM ... WHERE... GROUP BY... ORDER BY...
For example:
This query produces a XY chart comparing the position versus quantity for two different products.
SELECT name, position, quantity FROM position, product
WHERE productid in (1,2) AND productid = product.id
ORDER BY productid

Time Chart
The query format for Time Chart reports is
SELECT series, time, value FROM ... WHERE... GROUP BY... ORDER BY...
For example:
This query produces a time chart that plots the amount of orders over time.
SELECT 'Orders', count(*), orderdate FROM orders GROUP BY orderdate

Charts in JasperReports
In order to pass a Chart to JasperReports, the report definition must be modified to include the chart. This is done by selecting the desired report from the chart dropdown box on the Edit Report page. Also, if the chart query included any parameters, the matching report parameters must be selected on the Edit Report page in order for the user to be prompted to enter the parameter.
Charts generated by OpenReports are passed to reports as a parameter named ChartImage. In order for the chart
to appear in the report, modify the JasperReport definition to include the following parameter:
<parameter name="ChartImage" class="java.awt.Image"/>
Here is an example of an image tag that can be used in a JasperReports definition to display the ChartImage:
<image scaleImage="RetainShape" hAlign="Center">
<reportElement x="0" y="40" width="545" height="752"/>
<imageExpression class="java.awt.Image>$P{ChartImage}<imageExpression/>
</image>

Drill-Down ChartReports
Drill-Down ChartReports are powerful new features that give the end user the ability to drill down on a specific bar, segment, or slice in Bar, Ring, or Pie charts. In order to create a Drill-Down ChartReport, the following three steps must be followed:
Create a Drill-Down Report. The Drill-Down value will be passed to the report as parameter named Drill-Down. For example, in a Drill-Down QueryReport the SQL query will look like this
Create the master Chart definition. The Chart must be a Bar, Pie or Ring chart and you must specify the Drill-Down Report.
Create the ChartReport definition. This is just a regular report definition. The only values required are name, description, and the master Chart.

Online Analytical Processing (OLAP)
OpenReports 3.0 includes support for OLAP via the Mondrian OLAP server and the JPivot OLAP tag library.
Before you create an OLAP report, you must copy your Mondrian schema file and datasources.xml file to your OpenReports reports directory. The datasources.xml file defines your OLAP Data Sources and must contain the full path to your schema file in the Catalog section.
When creating an OLAP report, choose datasources.xml as the Report File and enter your MDX query in the query field.
Users and Groups
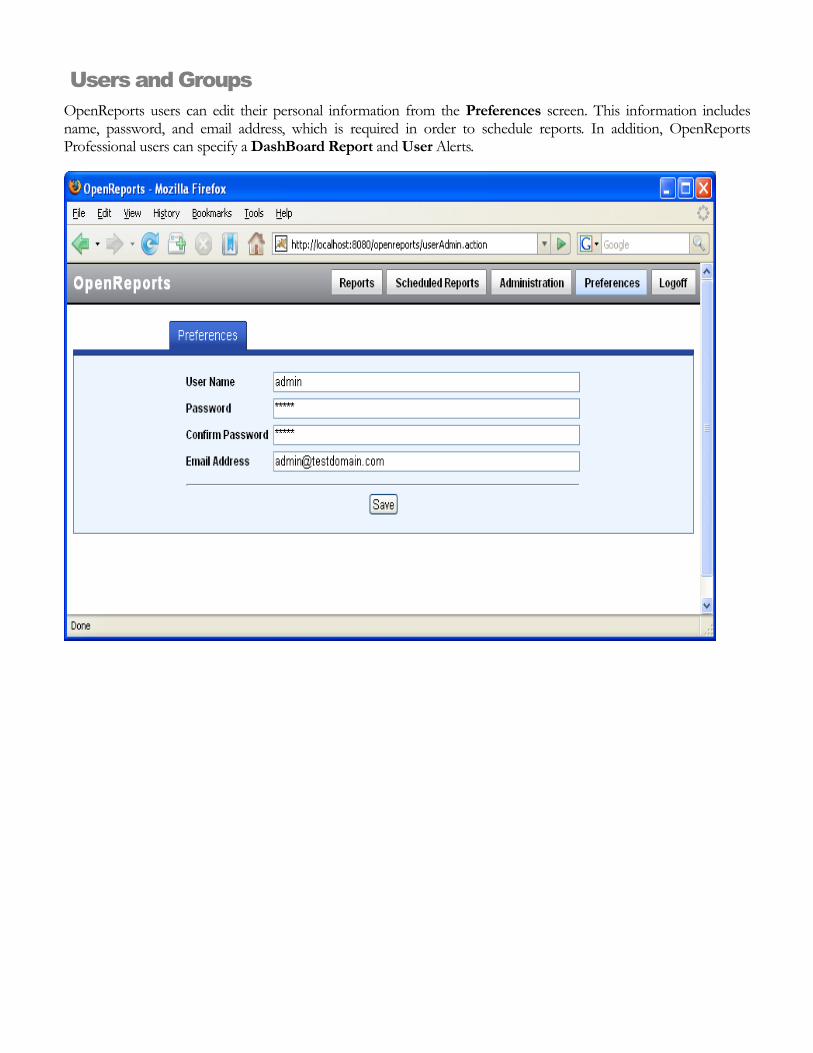
OpenReports users can edit their personal information from the Preferences screen. This information includes name, password, and email address, which is required in order to schedule reports. In addition, OpenReports Professional users can specify a DashBoard Report and User Alerts.

User Administration
User Administration is available from the Users link on the Administration menu. In addition to the information available on the Preferences page, the following values can be set:
External Id - The External Id is passed to reports as the parameter OPENREPORTS_USER_EXTERNALID. This parameter can be used as part of a report query to return results associated with the user
Roles – Role are used to control access to functionality in OpenReports. For example, the Scheduler role allows the user to schedule reports. See the Dictionary for definitions of the available roles.
Groups – Groups are used to provide access to reports by groups.
Report Groups
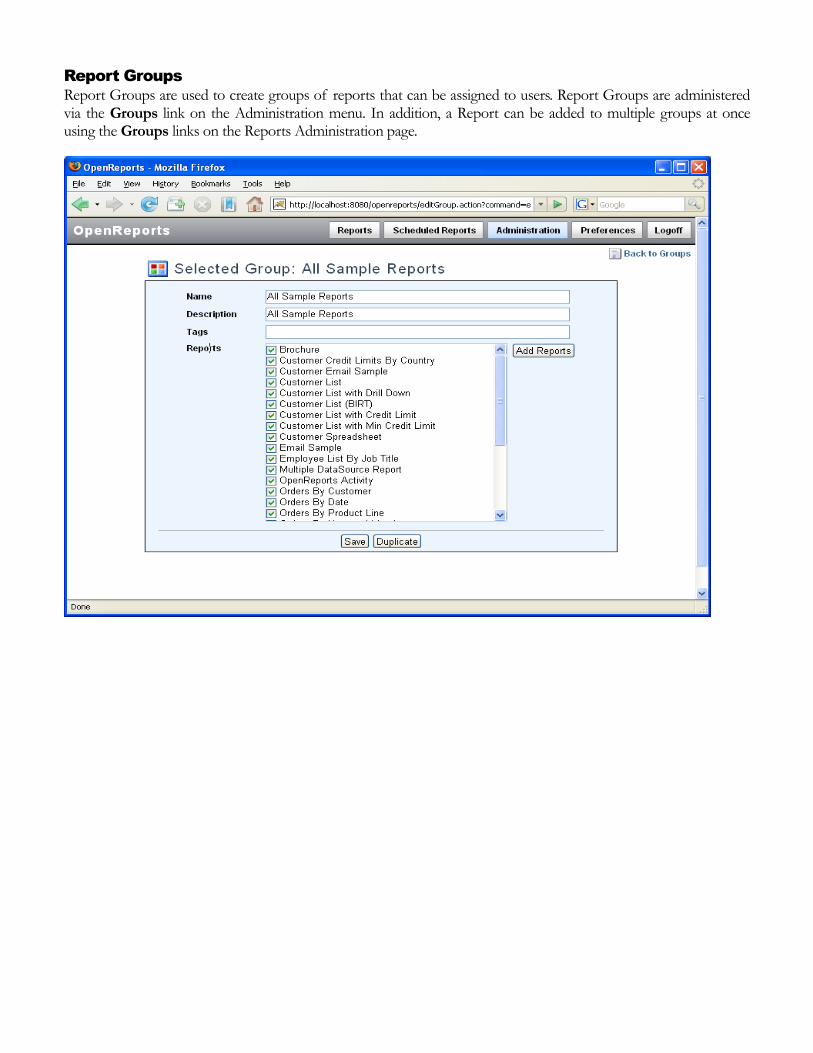
Report Groups are used to create groups of reports that can be assigned to users. Report Groups are administered via the Groups link on the Administration menu. In addition, a Report can be added to multiple groups at once using the Groups links on the Reports Administration page.
Scheduled Reports
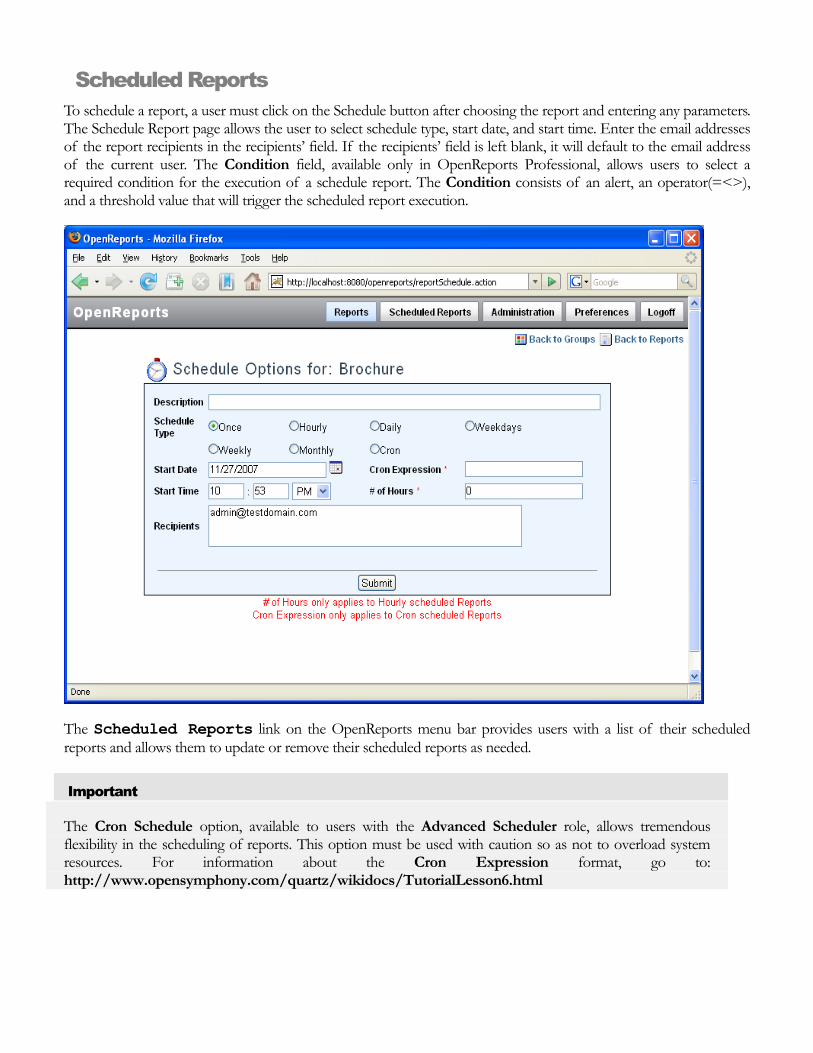
To schedule a report, a user must click on the Schedule button after choosing the report and entering any parameters. The Schedule Report page allows the user to select schedule type, start date, and start time. Enter the email addresses of the report recipients in the recipients’ field. If the recipients’ field is left blank, it will default to the email address of the current user. The Condition field, available only in OpenReports Professional, allows users to select a required condition for the execution of a schedule report. The Condition consists of an alert, an operator(=<>), and a threshold value that will trigger the scheduled report execution.
The Scheduled Reports link on the OpenReports menu bar provides users with a list of their scheduled
reports and allows them to update or remove their scheduled reports as needed.
Important
The Cron Schedule option, available to users with the Advanced Scheduler role, allows tremendous flexibility in the scheduling of reports. This option must be used with caution so as not to overload system resources. For information about the Cron Expression format, go to: http://www.opensymphony.com/quartz/wikidocs/TutorialLesson6.html

QueryReport Templates
QueryReport Templates are FreeMarker templates used to customize the output of QueryReports.
In order to deploy a QueryReport Template, copy the FreeMarker template to the same directory as your JasperReport files and specify the template file as the report file when defining the QueryReport through the report administration screen.
CustomerListWithTemplate.ftl is an example of a QueryReport Template that differs from a standard QueryReport in the following ways:
Instructions were added below the Report Name
The page size of the table has been changed to 15 rows
The column headers are customized
The Order List and Order Break Down columns are links to drill-down reports.

In the following code from CustomerListWithTemplate.ftl, the pagesize attribute in the Table tag has been changed, the property and title tags are specified for each column, and the last two columns use the href, paramId, and paramProperty tags to create drill-down report links using the executeReport.action.
<@display.table name="results" class="displayTag" sort="list" export=true pagesize=10
requestURI="queryReportResult.action">
<@display.column property="name" title="Name" sortable=true
headerClass="sortable"/>
<@display.column property="city" title="City" sortable=true
headerClass="sortable"/>
<@display.column property="country" title="Country" sortable=true
headerClass="sortable"/>
<@display.column value="View Report" title="Order List"
href="executeReport.action?reportName=Orders By Customer"
paramId="CustomerNumber" paramProperty="customernumber"/>
<@display.column value="View Chart" title="Order Break Down"
href="executeReport.action?reportName=Orders By Product Line"
paramId="CustomerNumber" paramProperty="customernumber"/>
<@display.setProperty name="export.pdf" value="true"/>
<@display.setProperty name="export.xml" value="false"/>
<@display.setProperty name="export.pdf.filename" value="${report.name}.pdf"/>
<@display.setProperty name="export.csv.filename" value="${report.name}.csv"/>
<@display.setProperty name="export.excel.filename" value="${report.name}.xls"/>
</@display.table>
Note
For more information on creating FreeMarker templates, read the FreeMarker Manual at http://freemarker.org/docs/index.html
For more information on configuring the DisplayTag library used to display tables in OpenReports, visit: http://displaytag.sourceforge.net

External/Drill-Down Report Execution
OpenReports provides an executeReport action that can be used by other applications to run a report through OpenReports. The executeReport action can also be used from links inside of reports to create Drill-Down reports. The executeReport action takes the following parameters:
userName and password - The userName and password of the person running the report.
reportId or reportName - The id or name of the report.
exportType - The exportType for the report: PDF = 0, XLS = 1, HTML = 2, CSV = 3, IMAGE = 4
displayInline – Optionally, if displayInline=true, OpenReports will suppress the banner and footer when displaying QueryReports or ChartReports.
The userName and password parameters are only required on the first call per session and are not required at all if the user is already logged into OpenReports. If the report includes required parameters, they must also be included in the URL. The exportType is not required for QueryReports.
The OpenReports distribution includes a number of examples that illustrate the use of the executeReport action.
ExecuteReportTest.html is an HTML page that contains two examples forms that can be used to execute reports from an external application.
CustomerListWithDrillDown.jrxml is an example of a JasperReport containing a link to a Drill-Down report. The Drill-Down link uses the OPENREPORTS_EXPORT_TYPE parameter to pass the correct export type to the Drill-Down report.
CustomerListWithTemplate.ftl is an example of a QueryReport Template that illustrates using the executeReport action to add links to a Drill-Down report in a QueryReport.
Note
Standard OpenReports security applies to the executeReport action. The userName and password must match that of a user in the OpenReports database, and the report must be in a report group assigned to the user.
OpenReports Professional Features
OpenReports Professional is built upon the open source version of OpenReports and offers a number of additional features and an easy upgrade path. The Report DashBoard, Alerts, and Conditional Report Scheduling are significant additions to end user functionality that provide a way to quickly display, highlight, and distribute the information that is most important to end users.
Additional OpenReports Professional features include Scheduler Administration, Report Statistics, and Report Definition Import/Export capability.
OpenReports Professional is built upon the same code base as the open source version of OpenReports. OpenReports Professional also shares the same database schema in order to provide an easy upgrade path for current users of the open source version.

Report DashBoard
The Report DashBoard is displayed upon login and consists of the Alerts and the Dashboard Report selected by the user on the Preferences page. Features include:
Collapsible Alert and Report panes.
Alert Listing with Alerts that pass a specified threshold highlighted in red
DrillDown Alert and ChartReport support.

Alerts and Conditional Scheduling
OpenReports Professional uses Alerts in two ways. The first way is on the Reporting DashBoard to highlight alert conditions. The second way is the provide Conditional Report Scheduling..
Before an Alert can be used by an end user, it must be defined by an Administrator using the Alert Administration screen. An alert definition consists of a name, description, SQL query, and a DataSource. The SQL query must return an Integer, in most cases it will be a simple COUNT(*) query.
Once an alert has been defined, it can be used when scheduling reports. This functionality is described in the Scheduled Reports section above. In order to use the Alert on their DashBoard, a user must click on the Edit Users Alerts link on the Preferences page.

User Alerts consist of an alert, an operator, a limit or threshold value, and optionally a DrillDown Report. Any number of User Alerts can be added, and the same alert can be used twice with different values.

Scheduler Administration
OpenReports Professional includes global scheduler administration functionality that gives administrators the ability view all scheduled reports by user. Each schedule report can be paused, resumed, updated or removed.

Report Statistics
The OpenReports Professional Report Statistics module provides the following queries: Top Reports, Top Reports by User, Top Reports Last 30 Days, Top Reports Last 60 Days, Top Reports Last 90 Days, Top Failed Reports, and Top Empty Report.

OpenReports Systems Administration
Cache
OpenReports supports caching of OpenReports Administration objects such as users, groups, parameters, and report and chart definitions. OpenReports does not cache generated reports. Caching can significantly improve performance and reduce database load. By default OpenReports Professional has caching turned on.
In order to disable cache, uncomment the following property in the hibernate.cfg.xml file.
<property name="cache.provider_class">
org.hibernate.cache.NoCacheProvider
</property>
The cache settings are configured in the ehcache.xml file. The default configuration should be fine for most
environments. If you want to modify the cache settings, the ehcache.xml file includes descriptions of the cache
configuration attributes.
Note
More information on ehcache configuration can be found here: http://ehcache.sourceforge.net/
Localization
In order to localize OpenReports you must:
1. Create a LocalStrings.properties file for your Locale in the src directory. This file should contain translations for all the messages in the LocalStrings.properties file.
2. Set the struts.locale in the struts.properties file.
3. Rebuild and redeploy the WAR file.
For example, to create a French translation, you would add a LocalStrings_fr.properties file and changes the struts.locale from struts.locale=en_US to struts.locale=fr.
Eclipse BIRT
There are two steps that need to be performed before using BIRT reports with OpenReports:
1. Create a 'temp' directory under your 'reports/images' directory.
2. Download the or-3.0-birt-2.2-platform.zip file and unzip to your 'reports' directory.
When exporting reports to HTML, the BIRT engine will create temporary image files in your 'reports/images/temp' directory. The Image Cleanup tab on the Administration Settings page provides the ability to delete these files.
OpenReports will override the datasource properties contained in your .rptdesign files if the datasource name matches the name of an existing OpenReports datasource.

Spring Configuration
OpenReports uses the Spring Framework to configure and wire together its various components. Spring is configured using the applicationContext.xml file in the WebRoot/WEB-INF directory.
OpenReports is configured to use the Spring PropertyPlaceholderConfigurer to load the openreports.properties file from the classpath. In some situations, it may be advantageous to externalize the openreports.properties file in order to deploy the same war file across multiple environments. In order to do this you must replace classpath with file in the locations section of the applicationContext.xml file. The following example uses a Java system property to support specifying the location of the openreports.properties file dynamically.
<bean id="environment"
class="org.springframework.beans.factory.config.PropertyPlaceholderConfigurer"
lazy-init="false">
<property name="ignoreResourceNotFound" value="true" />
<property name="locations">
<list>
<value>
file:${some.system.property}/openreports.properties
</value>
</list>
</property>
</bean>
The applicationContext.xml file can also be used to configure a MailSession that will override any mail server settings entered on the OpenReports Administration screens. This is useful if you want to do a JNDI lookup of a mail session or use mail properties not available through the OpenReports user interface. This example defines a mail session that is configured via openreports.properties.
<bean id="mailAuthenticator" class="org.efs.openreports.util.SMTPAuthenticator">
<constructor-arg index="0" value="${mail.user}" />
<constructor-arg index="1" value="${ mail.password}" />
</bean>
<bean id="mailSession" class="javax.mail.Session" factory-method="getInstance">
<constructor-arg index="0">
<props>
<prop key="mail.smtp.host">${mail.smtp.host}</prop>
</props>
</constructor-arg>
<constructor-arg index="1" ref="mailAuthenticator" />
</bean>

Dictionary
Alert – A method for highlighting important conditions and triggering scheduled reports.
Base Directory – The full path to directory containing your report files.
ChartReports – Easy to create charts built from SQL queries.
Dashboard – A single screen used to present critical information through alerts and a default report.
Dashboard Report – A default report, selected on the user preferences screen that will be displayed on the users Dashboard.
Driver – The JDBC driver class. Used for internal connection pooling. If specified this class must be in the OpenReports classpath.
Hidden Report – A report that can be assigned to a report group, but is not displayed to the end user. This is useful for DrillDown reports that should not be run independently of the Top-Level report.
JasperReports – A leading open source reporting engine.
JNDI DataSource – A DataSource that is defined outside of OpenReports and looked up using a JNDI URL.
Legend – A box displayed below a chart that displays chart values.
Max Active – The maximum number of active connection that can be allocation to a DataSource. A negative valued indicates no limit.
Max Idle - The maximum number of active connections that can remain idle. Use zero for no limit.
Max Rows – The maximum number of rows that can be returned by a QueryReport
Max Wait – The maximum number of milliseconds to wait for a connection before throwing an exception. Use negative one to wait indefinitely.
Multi-Select – A parameter option that determines if the parameter allows multiple selections.
Plot Orientation – The orientation of the chart plot, for example the bars in a bar chart.
QueryReports – Table based reports built from SQL queries.
Temp Directory – The full path to directory used to store Temp files used by virtualization process.
Validation Query – The SQL query used to validate connections. If specified, this query must return at least one row.
Virtualization – An option for JasperReports that virtualizes data to the file system when running a report. This option can reduce memory usage when running large reports.

Role Definitions
These roles are control access to Administration and end user functionality:
Advanced Scheduler – Ability to schedule reports using Cron expressions.
Alert Admin - Insert, Update, and Delete Alerts. OpenReports Professional only.
Alert User - Access to Alerts when Scheduling Reports. OpenReports Professional only.
Chart Admin – Insert, Update, and Delete Charts.
Dashboard User- Access to the Reporting Dashboard. OpenReports Professional only.
DataSource Admin – Insert, Update, and Delete DataSources.
File Uploader - Ability to Upload Report Files.
Group Admin - Insert, Update, and Delete report groups.
Log Viewer – Access to Report Logs. Also provides Reporting Statistics in OpenReports Professional.
Parameter Admin – Insert, Update, and Delete report parameters.
Report Admin – Insert, Update, and Delete reports.
Root Admin - Access to all OpenReports user and administration functionality.
Scheduler Admin – View, Update, Remove, Pause, and Resume scheduled reports for all users.
Scheduler - Ability to schedule reports.

License and Credits
OpenReports is distributed under the GPL License. OpenReports Professional is distributed under a commercial license on a per-server basis.
For additional license information, visit http://oreports.com or email [email protected]
OpenReports uses the following open-source projects:
JasperReports - Java report-generating library - http://jasperreports.sourceforge.net
WebWork - MVC web application framework - http://opensymphony.org
Hibernate - an object/relational persistence and query service for Java - http://hibernate.org
Quartz - a Java open source enterprise-class Job Scheduler, http://sourceforge.net/projects/quartz
JFreeCharts - a Java charting library - http://www.jfree.org/jfreechart/index.html
OpenReports also uses a variety of other open-source software including software developed by the Apache Software Foundation (http://www.apache.org)