online video &the media industry q3 2010
DESCRIPTION
Brightcove and TubeMogul have teamed up to develop an online video index and quarterly research report, which will help identify key industry trends and answer questions about the state of the industryTRANSCRIPT

© 2010 Brightcove, Inc. and TubeMogul, Inc 1
Online Video &the Media IndustrySPECIAL FEATURE: PEAK VIDEO ENGAGEMENT
BY DAYS OFTHE WEEK AND TIMES OF DAY
QUARTERLY RESEARCH REPORT, Q3 2010

© 2010 Brightcove, Inc. and TubeMogul, Inc 2
Online Video & the Media Industry
Methodology . . . . . . . . . . . . . . . . . . . . . . . . . . . . . . . . . . . 3 Key Findings . . . . . . . . . . . . . . . . . . . . . . . . . . . . . . . . . . . 4
Platform Usage . . . . . . . . . . . . . . . . . . . . . . . . . . . . . . . . . 5
Video Stream Trend Data . . . . . . . . . . . . . . . . . . . . . . 5
Total Minutes Streamed . . . . . . . . . . . . . . . . . . . . . . . 5
Player Loads Q3 2010 . . . . . . . . . . . . . . . . . . . . . . . . 7
Engagement, Discovery, Geography and Distribution . . . . 8
Discovery and Engagement . . . . . . . . . . . . . . . . . . . 10
Device Engagement . . . . . . . . . . . . . . . . . . . . . . . . . 12
Geographic Distribution . . . . . . . . . . . . . . . . . . . . . . . 13
Browser Distribution . . . . . . . . . . . . . . . . . . . . . . . . . . 13
Special Feature: Video Engagement by Day and Time . .14
Total Views by Day . . . . . . . . . . . . . . . . . . . . . . . . . . .14
Engagement by Day . . . . . . . . . . . . . . . . . . . . . . . . . 16
Peak Times of Day . . . . . . . . . . . . . . . . . . . . . . . . . . .17
Contacts . . . . . . . . . . . . . . . . . . . . . . . . . . . . . . . . . . .20
© 2010 Brightcove, Inc. and TubeMogul, Inc 3
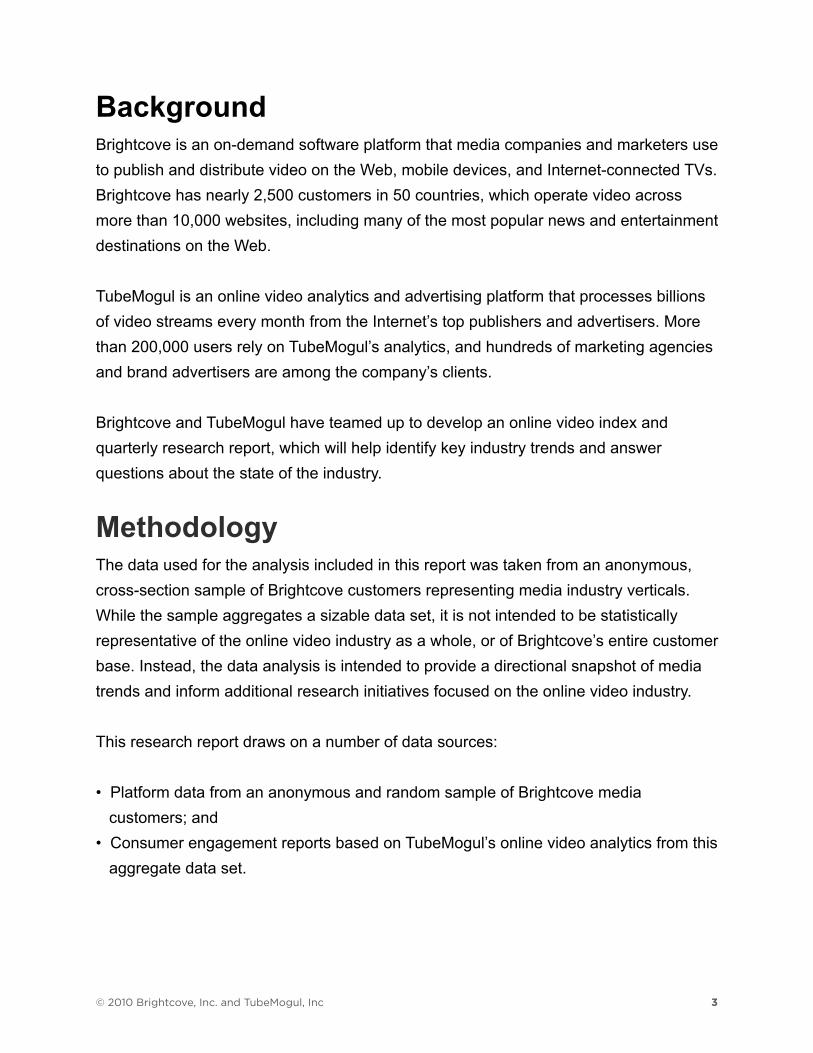
BackgroundBrightcove is an on-demand software platform that media companies and marketers use to publish and distribute video on the Web, mobile devices, and Internet-connected TVs . Brightcove has nearly 2,500 customers in 50 countries, which operate video across more than 10,000 websites, including many of the most popular news and entertainment destinations on the Web .
TubeMogul is an online video analytics and advertising platform that processes billions of video streams every month from the Internet’s top publishers and advertisers . More than 200,000 users rely on TubeMogul’s analytics, and hundreds of marketing agencies and brand advertisers are among the company’s clients .
Brightcove and TubeMogul have teamed up to develop an online video index and quarterly research report, which will help identify key industry trends and answer questions about the state of the industry .
MethodologyThe data used for the analysis included in this report was taken from an anonymous, cross-section sample of Brightcove customers representing media industry verticals . While the sample aggregates a sizable data set, it is not intended to be statistically representative of the online video industry as a whole, or of Brightcove’s entire customer base . Instead, the data analysis is intended to provide a directional snapshot of media trends and inform additional research initiatives focused on the online video industry .
This research report draws on a number of data sources:
• Platform data from an anonymous and random sample of Brightcove media customers; and• Consumer engagement reports based on TubeMogul’s online video analytics from this aggregate data set .

© 2010 Brightcove, Inc. and TubeMogul, Inc 4
Key FindingsDiscovery• Facebook now refers more video streams than Yahoo! for the aggregate media sample. This marks the first time the social platform has surpassed the search engine and content portal . Facebook accounted for 9 .6% of all referrals, making it second only to Google .
Online Video Streams• Newspapers saw significant growth in the number of titles uploaded (51% growth) and surpassed broadcasters in total minutes streamed for the first time this quarter. This is an interesting development, and suggests that newspapers are rapidly adopting and producing video content for what was once a print business . This data also bears out the distinct differences in the content between the two verticals: broadcasters have fewer but longer titles, while newspapers are producing many more, but shorter titles on a more regular basis .• Online media properties (which includes pure-play Web properties and blogs) also had a strong growth quarter in player loads (127% growth) and titles uploaded (23% growth), suggesting that video adoption and production activity is on the rise across the growing media category .
Engagement• Completion rates for brand marketers (47%), broadcasters (44%), and online media properties (45.9%) continued to rise quarter to quarter, reaching new highs in Q3.• Gaming consoles lead in average viewing time, suggesting that lean-back environments are the most engaged of the three screens. This is also the first time we’ve broken out cross-device engagement metrics for this report and will be followed by detailed analysis by device next quarter .

© 2010 Brightcove, Inc. and TubeMogul, Inc 5
Special Feature: Video Activity by the Hour and the Day• The most active days of the week by total video views for all media companies were weekdays, in particular peaking on Wednesdays . By category, brand marketers and online media saw peaks in total views on Thursdays .• In contrast, the weekends including Friday had the highest engagement per view based on average minutes watched across the aggregate sample . • “Prime time” online video watching behavior for media categories varied greatly depending on the category . Magazines and online media peaked during working hours, while newspapers had more steady engagement into the evening hours . And, as expected, broadcasters total daily views peaked during traditional “prime time” hours from 6-11PM, mirroring their television counterparts.
Platform UsageThe following analysis is based on aggregated Brightcove platform data from an anonymous sample of more than 200 media companies representing media industry verticals, including broadcast networks, magazine publishers, newspaper publishers, and pure-play Web media properties .
Video Stream Trend DataTotal Videos StreamedIn Q3, broadcast networks maintained their top position among media verticals for the tenth consecutive quarter with 433 million online video streams, up from 406 million last quarter, representing a 6% jump, and a 25% year over year jump compared to the same quarter last year .
Total Minutes StreamedNewspapers have surpassed broadcasters in the total minutes streamed this quarter, with 313 million minutes streamed, compared to 290 million for broadcasters . This is an interesting turning point because while broadcasters tend to have longer-form content, newspapers lead the group in sheer number of titles uploaded (data following). It’s likely that spikes in news video production coincided with large events of the quarter, including continued coverage of the World Cup that finished up in July, and of the mid-term elections in the US .

© 2010 Brightcove, Inc. and TubeMogul, Inc 6
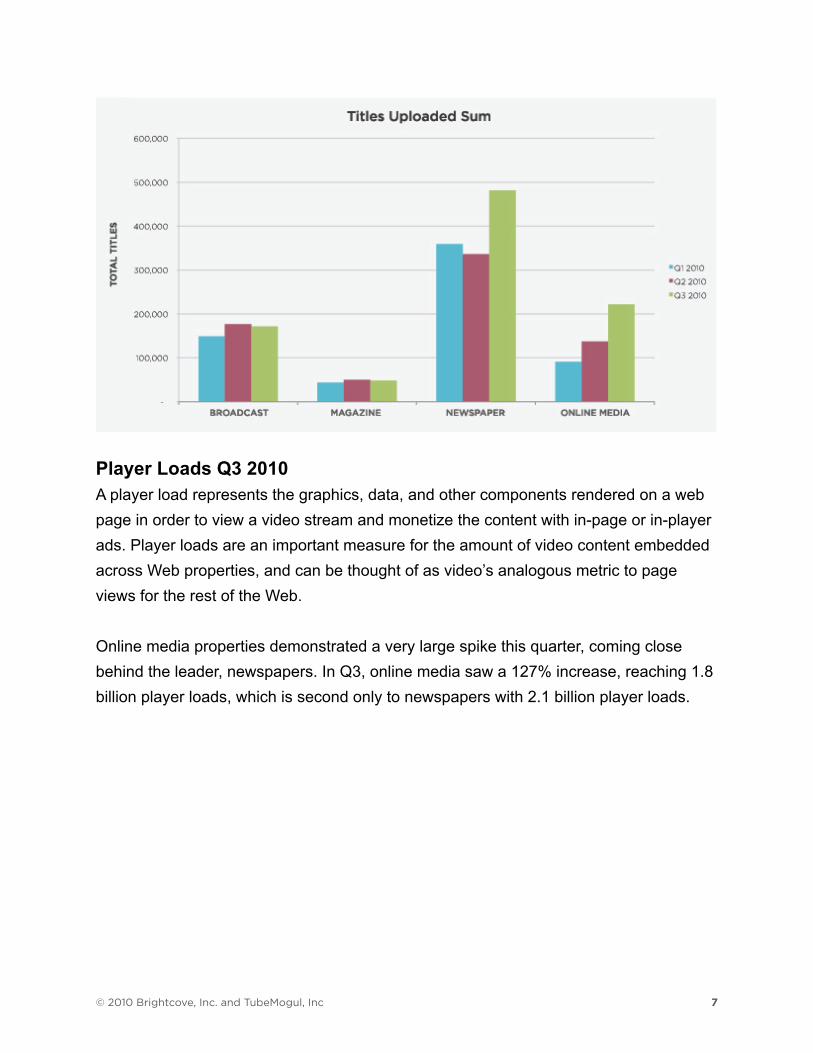
Video UploadsQ3 saw a significant increase in titles uploaded for newspapers, with a quarter to quarter growth of 51%, and a 110% growth compared to the same quarter last year . Newspapers lead the number of titles uploaded for media companies with 482,000 titles uploaded in the quarter .
This quarter, we also saw significant growth (23% since last quarter) in title uploads from the online media category, which has now surpassed broadcast uploads, a first this quarter. This represents a 188% increase in video uploads year over year for online media .
© 2010 Brightcove, Inc. and TubeMogul, Inc 7
Player Loads Q3 2010A player load represents the graphics, data, and other components rendered on a web page in order to view a video stream and monetize the content with in-page or in-player ads . Player loads are an important measure for the amount of video content embedded across Web properties, and can be thought of as video’s analogous metric to page views for the rest of the Web .
Online media properties demonstrated a very large spike this quarter, coming close behind the leader, newspapers. In Q3, online media saw a 127% increase, reaching 1.8 billion player loads, which is second only to newspapers with 2 .1 billion player loads .

© 2010 Brightcove, Inc. and TubeMogul, Inc 8
Engagement, Discovery, Geography and DistributionThe following section analyzes viewer behavior for a cross-section of media companies (broadcasters, magazines, newspapers, and online media properties).
Video EngagementAudience engagement levels across all of the media verticals were fairly consistent across Q1, Q2, and Q3, though some verticals saw a decrease in minutes watched . But completion rates went up in some of the same verticals, suggesting that while the content may be shorter, engagement via completion rates may be higher .
All verticals experienced slight drops in average minutes viewed per stream, with the exception of newspapers and brand marketers, who returned to their Q1 levels this quarter . Broadcasters remain far above the rest of the categories in average minutes watched per stream, likely due to their penchant for longer-form content .

© 2010 Brightcove, Inc. and TubeMogul, Inc 9
Completion rates, which refer to videos that were watched from start to finish, either stayed steady or saw a spike this quarter, in particular for brand marketers, broadcasters, and online media properties . Brands continued an upward trend three quarters in a row with a 47% completion rate, which also surpassed online media’s 46% rate. Brand marketers saw a 7.9% increase in completion rates this quarter.

© 2010 Brightcove, Inc. and TubeMogul, Inc 10
Brand marketers and online media properties both had the highest completion rates, but they also had the steepest drop off rates, with a 14.2% and 15.1% delta respectively between percentage of viewers completing half the video and those completing the entire video .
Discovery and EngagementAs predicted in last quarter’s report based on Facebook’s referral growth rate, Facebook has surpassed Yahoo! to be second only to Google in referral traffic to online video content for media companies . Facebook now accounts for 9 .6% of all referred video traffic to media companies.
Brands experienced much higher rates of engagement (1:47 minutes) through referrals from Twitter . Twitter was the highest average engagement source across the categories, and also accounted for the highest engagement rates specifically for broadcasters (1:57 minutes) and online media properties (1:40 minutes).
Notably, Google accounted for significantly higher engagement for newspapers at 1:57 minutes, compared to the category average of 1:27 minutes. This suggests that viewers look to the search engine as a source for the most relevant breaking and timely content .Facebook was the most engaging referral source for entertainment categories, including

© 2010 Brightcove, Inc. and TubeMogul, Inc 11
broadcasters (1:57 minutes) and magazines (1:34 minutes). This can be explained that entertainment is a more commonly shared and more engaging content type among friends connecting on the social network .

© 2010 Brightcove, Inc. and TubeMogul, Inc 12
Device EngagementThis quarter, we also looked at minutes watched per view by device and found that game consoles (such as the Wii and PlayStation) lead in viewing time with an average of 2:45 minutes watched per view, compared with online video averaging out to just under 2:27 minutes per view. This is not surprising given that gaming consoles are currently the most common playback device connected to TVs and most closely replicate a comfortable lean-back experience . We anticipate this disparity to increase as more Brightcove customers make content available to viewers through connected TV apps and gaming consoles. Note: this data does not include over the top boxes like Boxee or Yahoo TV, only gaming consoles.

© 2010 Brightcove, Inc. and TubeMogul, Inc 13
Geographic DistributionCertain regions have outsized influence in specific media categories. Viewers in the U .S . watched a much larger share of videos from pure-play Web media properties, accounting for 70% of the total views in the category.
Browser DistributionThe overall dominant browser across every media category was Microsoft’s Internet Explorer, which is consistent with the overall usage share of browsers across all Internet traffic.
The most diverse category in browser share of views is newspapers, with browsers most closely split between Safari (7.5%), IE (48.6%), Firefox (28.7%), and Chrome (14.4%).
The top media categories for each browser are as follows:
Safari Magazines (9.7%) IE Broadcasters (62.7%) Firefox Newspapers (28.7%) Chrome Newspapers (14.4%)

© 2010 Brightcove, Inc. and TubeMogul, Inc 14
Special Feature:Video Engagement by Day and TimeTotal Views by DayViewership for media companies peaked on Wednesdays, according to Q3 media data . We also saw a highger volume of views during the workdays from Tuesday to Thursday, which is likely because the majority of online video is watched when people spend the most time online–on their computers at work .

© 2010 Brightcove, Inc. and TubeMogul, Inc 15
Both brands marketers and online media properties showed significant spikes in activity on Thursday . Broadcasters and brands had stronger weekends overall, likely due to entertainment content being watched during leisure time .

© 2010 Brightcove, Inc. and TubeMogul, Inc 16
Engagement by DayThough activity by number of views is higher during the week, we’ve seen longer average minutes watched per view during the weekend, which can be again attributed to leisure viewing habits .
Friday and Saturday saw the highest average minutes watched at 1:59 and 1:58 minutes viewed respectively across all media categories .
By category, broadcasters and online media properties saw the longest viewing times on the weekends . This data also bears out again the idea that broadcasters are seeing significantly higher average minutes watched per view than other categories, which can be attributed again to their penchant for longer-form content .

© 2010 Brightcove, Inc. and TubeMogul, Inc 17
Peak Times of DayThis quarter, we were interested in breaking out the peak viewing times across each of the vertical categories, and found that there is significant variability in peak times for each of the media categories, which we break out in detail below .
© 2010 Brightcove, Inc. and TubeMogul, Inc 18
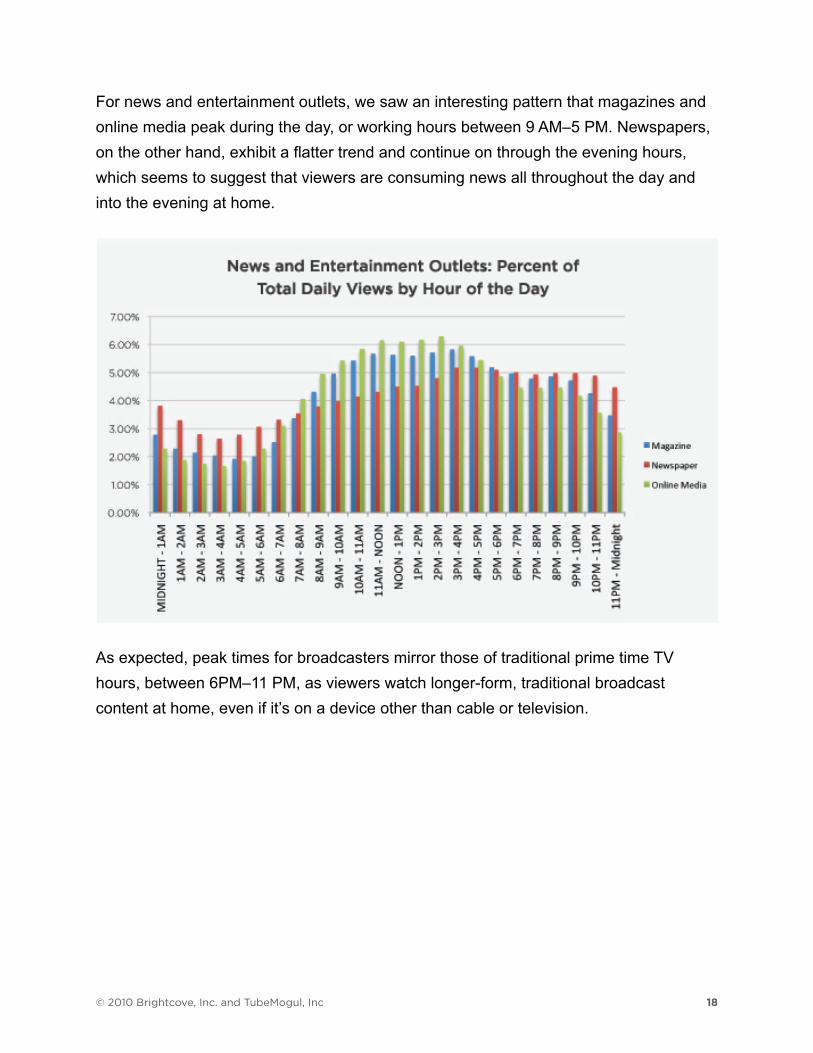
For news and entertainment outlets, we saw an interesting pattern that magazines and online media peak during the day, or working hours between 9 AM–5 PM. Newspapers, on the other hand, exhibit a flatter trend and continue on through the evening hours, which seems to suggest that viewers are consuming news all throughout the day and into the evening at home .
As expected, peak times for broadcasters mirror those of traditional prime time TV hours, between 6PM–11 PM, as viewers watch longer-form, traditional broadcast content at home, even if it’s on a device other than cable or television .

© 2010 Brightcove, Inc. and TubeMogul, Inc 19
Brands showed peak views during the day, with a dip during commute hours between 4–6PM and picked back up for the dinner hours between 7–8PM, likely before prime time entertainment starts up .

© 2010 Brightcove, Inc. and TubeMogul, Inc 20
Contacts
Sara WatsonInbound Marketing Content ManagerBrightcove, Inc .Phone: 617-245-6079Email: swatson@brightcove .com
David BurchCommunications DirectorTubeMogul, Inc .Phone: 510-653-0501Email: david@tubemogul .com