online surface roughness characterization of paper and
TRANSCRIPT
Online surface roughness characterization of paper and paperboard using a line of light triangulation technique Anzar Alam, Anatoliy Manuilskiy, Jan Thim, Mattias O’Nils, Johan Lindgren and Joar Lidén
KEYWORDS: Paper, paperboard, Newspaper, Online
surface measurement, OnTop, Line of light triangulation,
Paper smoothness, Paper roughness, Optical
measurement, laser application.
SUMMARY: Within both the paper and paperboard
industries, real time monitoring and measurement of
surface roughness of a paper moving at high velocities is
an important and challenging area of research. The uni-
form surface, for an entire production, can be effectively
achieved by monitoring and controlling the paper surface
roughness, in real time during the manufacturing steps.
Presently the majority of paper industries rely on tradi-
tional laboratory profilometers. The obvious limitations
of lab profilometers are that these are slow, do not
measure the quality of entire reels but rather deal with
only a few small pieces of samples taken from the end of
the reels and it is difficult to make any possible correction
in the production lines without knowing the online rough-
ness data. To eradicate the disadvantages associated with
conventional measurements, an online prototype instru-
ment has been developed that measures the surface
roughness during the manufacturing steps, and is based
on a line of light triangulation technique. The prototype
technique will be of assistance in ensuring tight process
control in order to maintain both a better and a uniform
quality throughout the entire production. It measures the
whole reel, meter by meter, in traditional units of
roughness and is also capable of characterizing the
topography in a wide range of wavelength spectra. The
article presents the online analyses results obtained from
the developed prototype. The real time measurements, in
a paperboard pilot mill, have successfully characterized
and distinguished 16 different grades of newspaper and
paperboard reels including reels which have the same
family of quality grades and materials.
ADDRESSES OF THE AUTHORS: Anzar Alam
([email protected]), Anatoliy Manuilskiy
([email protected]) Jan Thim
([email protected]) and Mattias O’Nils
([email protected]): Mid Sweden University,
Department of Information Technology and Media, SE-
851 70, Sundsvall, Sweden. Johan Lindgren
([email protected]): Iggesund Paperboard
AB, Iggesund, Sweden. Joar Lidén
([email protected]): SCA Ortviken AB, Sundsvall,
Sweden. Corresponding author: Anzar Alam
Topography is the field of study which deals with the out-
of-plane properties of a surface including a wide range of
geometrical irregularities and in which roughness is one
of the components of the topography. The roughness of a
paper or paperboard surface is recognized as being one
of the most important paper properties, in relation to the
printability, coating and consumption of inks (Pino et al.
2010; Aguilar et al. 2009; Schwaiger et al. 2009; Vernhes
at el. 2008; Ma 2005; Costa et al. 2005). For example, the
value of a graphical paper product is mainly dependent
on the perceived surface quality (Goic et al. 2011; Thim
et al. 2009). Roughness relates to paper properties
including gloss, uneven grammage distribution and
friction (Pierre at el. 2008; Gunnar and Veronique 1994).
Papers are often coated and the amount of coating
depends upon the surface quality of the base
paper/paperboard and it is also true that the amount of
coating is influenced by the requirements of the final
paper/board product. Paper process researchers have been
endeavoring to improve the processing techniques in
order to enhance the quality of the manufactured paper
and this is the reason why many processing steps, for
example, calendering, coating, and hot calendering are in
fact undertaken mainly to improve the surface
smoothness (Samyn et al. 2011; Litvinov and Farnood
2006; Rättö 2005; Hansson and Johansson 1999). The
surface property is one of the critical parameters used for
either the acceptance or rejection of the final product
(Tay and Quan 2003).
Because the importance of the surface quality of the
manufactured paper and paperboard, a number of hi-tech
industrial laboratory profilometers are available,
including both contact and non-contact techniques.
Among the contact techniques, air leak methods have
been in use over the years in both the paper and
paperboard industries as they are considered to be very
reliable. There are various air leak measurement methods,
including Bekk, Bendtsen and Parker Print Surf (PPS)
which are widely used. There is a common basic working
principle for all of the air leak instruments which is that a
rough paper sample will act as a poor seal in relation to
the pressurized air and will allow a high rate of air flow
through its surface, while a smooth surface will act as a
good seal and will restrict the rate of air flow through its
surface. Air leak roughness is measured by the rate of air
flow in ml/min. The mechanical stylus is also a contact
based technique and this consists of a fine preloaded
diamond tip which is mechanically dragged over the
surface under test. The stylus tip traverses the surface
irregularities in order to measure the topography along a
line. The vertical resolution of the stylus depends upon
the diameter of the tip which can be approximately a few
µm (Ostadi 2010). The mechanical stylus is used for hard
surfaces such as metals. In both the case of the air leak
and stylus, destructive tests are conducted and thus
measurements are non repeatable.
The Atomic Force Microscope (AFM) measures the soft
surfaces including paper without any damage as its tip is
very fine and has a very high vertical resolution in the
nanometer range.
PAPER PHYSICS
662 Nordic Pulp and Paper Research Journal Vol 27 no.3/2012
However, there are obvious limitations in laboratory
measurements. For example, the absence of real time
surface quality data while paper was being manufactured
and a few laboratory samples, usually taken from the end
of the paper reels, cannot represent the entire reel as
measurements have not been taken across the whole
length. Furthermore, not only would there be large local
variations over the length of the reel, but rolling force and
speeds are reduced at the beginning and end of the reel,
thus yielding changes in properties at the sampling
position as compared to those for the remainder of the
reel (Bilstein et al. 2007). The surface dynamic
properties, which develop during the manufacturing
process such as cockling and long waviness, will not
appear with the same intensity on the lab samples.
Therefore, the conventional laboratory measurement is
not sufficient and there has thus been a requirement for
online surface measurements.
There has long been a request for measurements relating
to the whole length of a reel in order to ensure and
improve the quality of all paper and paperboard products.
Online surface measurements, directly on the machines,
will be of great use. The real-time surface topography,
including roughness, cockling, waviness and dynamic
variations are of prime importance in order to investigate
and fix the problems.
The conventional methods, as discussed above, for
example, air leak is good in relation to a laboratory
situation but is not valid for online measurements and the
mechanical contact stylus has a poor resolution and
conducts a destructive test and thus it is not possible to
apply these methods to online paper testing. AFM and
other high resolution microscopes are sophisticated and
have been designed for laboratory conditions. It is thus
the case that non-contact optical techniques offer a strong
potential for online measurements.
The real time monitoring and measurement of surface
roughness, on a paper web, is an important and
challenging research area (Pino et al. 2010; Kuparinen et
al. 2005). Paper web at high velocities introduces some
additional features to the surface due to vibrations, stress
on surface, and noise etc. During online measurements
these features also become part of the actual surface
topography, making it difficult to measure the true
surface roughness (Schwaiger et al. 2009). The speed of
the paper machine can reach 2000 m/min or higher and
thus an online technique must be capable of taking
measurements across a wide range of operating speeds.
The resolution of the online device should be sufficiently
high in order to distinguish between individual wood
fibers.
The optical techniques, used in laboratory instruments,
are for example interferometric, laser triangulation, laser
scanning profilometry (Hladnik and Lazar 2011) and
confocal microscopy, which enables measurements of a
surface with precision (Goic et al. 2011). Researchers are
focusing on non-contact optical based measurement
techniques. For example, Hansson and Johansson in 2000
developed a photometric stereo technique, which was
implemented by Åslund in 2004 to make a fast surface
measurement setup (Åslund et al. 2004). Barros and
Johansson, designed a laboratory profilometer, the
‘Optitopo’ in 2005, to measure paper surface roughness
which was also based on the photometric stereo principle
(Barros, Johansson 2005).
The online optical roughness assessment is an emerging
research area and new measuring techniques are being
explored (Wu et al. 2008). In the majority of techniques,
the target surface is illuminated either by a pulse source
or by a continuous light source. The reflected light from
the surface is captured by a CCD camera(s). The physical
region of the paper surface illuminated by the light source
can be a point, a line or an area.
There are a few online devices available which are
designed to detect mainly a surface fault as this is also
important (Rodríguez-Jiménez et al. 2010). There are
also some devices which measure surface roughness
within a short range of wavelengths and thus there was a
requirement for an online device that can
comprehensively measure and analyze the surface
topography within a wide range of wavelength.
A new prototype, the Online Topography (OnTop)
device, based on a pulsed line of light triangulation
technique, has recently been developed. The triangulation
is a proven technique, well known, simple and is low cost
designed (Cheng et al. 2007). The prototype, OnTop, has
been tested at the Pilot Coating Plant at Iggesund
Paperboard Mill in Sweden. It is designed to measure the
paper and paperboard web surfaces meter by meter for an
entire reel during the manufacturing process. It measures,
a 210 mm long web-width, and estimates surface height
irregularities in traditional units of average roughness Ra,
root mean square roughness Rq, and is also capable of
characterizing surface topography in a wide range of
wavelength spectral regions (Alam et al. 2012).
The online measurement in the production line, will
reduce the requirements for frequent physical inspections
(Wu et al. 2008) and provide an opportunity to perform
timely corrective actions so as to maintain the desired
quality of the finished products. It will assist in reducing
wastages and will enhance the quality in an efficient
manner.
The intention of this study is to present the performance
and accuracy of the OnTop device. The correlation results
between the online measurement made by OnTop and
those made by the industrial laboratory profilometer are
shown. The online characterization results, on the basis of
rms roughness Rq, are presented for the sample reels
consist of both wide and narrow topographical
differences and include samples of the same family
material and grades.
Materials and Methods The online surface roughness measurements were taken
and analyzed, in this study, by means of the developed
prototype in the Pilot Coating Machine of Iggesund
Paperboard Mill, Iggesund Sweden.
OnTop prototype
The developed prototype is based on technique involving
a non-contact line of light triangulation. According to
ASME B46.1-2002 standards the prototype lies in the
category of ‘Type II Full Profiling non-contact
PAPER PHYSICS
Nordic Pulp and Paper Research Journal Vol 27 no.3/2012 663
instruments’ which includes the measurement techniques
generally based on optical and electronics sensors.
Since it was previously concluded by Alam et al. (2011)
that for paper and paperboard the roughness levels are in
general higher in the cross direction (CD) than in the
machine direction (MD), the prototype is designed to
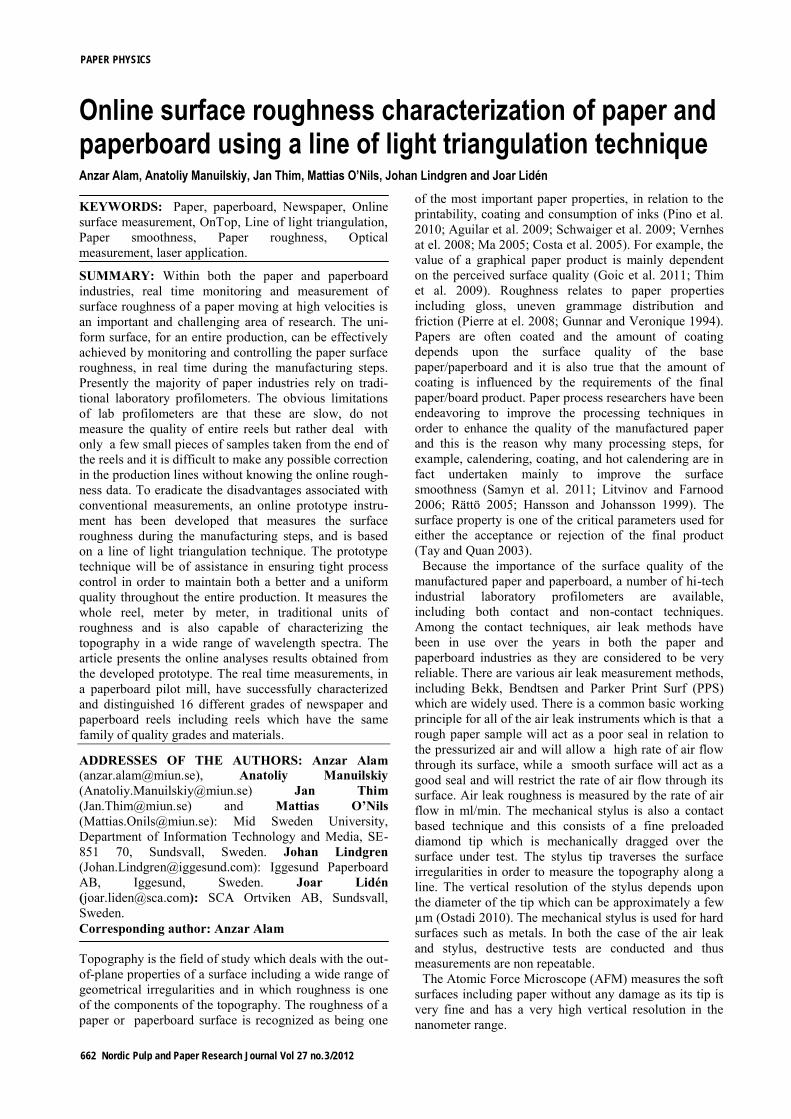
scan a line of light in the CD. An installation picture and
a sketch are shown in Fig 1 which indicates the exact
location of the OnTop and the measurement in the CD.
The aim of this study was mainly to measure the surface
roughness and thus the location chosen in the trial tests
was quite stable and suitable for measuring the
roughness. However, different locations can also be
chosen depending upon the interest of topographical
components.
The majority of the laboratory optical profilometers
scan a sample point by point (Ren et al. 2010) in order to
create a vector of a line profile. Since the prototype is
designed on a line of light projection technique, a vector
of a line-profile is obtained in a single step which makes
a rapid acquisition of the entire line. A robust prototype
assembly with a fast algorithm was built as these are
among the criteria for online production devices
(Rodríguez-Jiménez et al. 2010).
The prototype consists of two semiconductor pulsed
laser sources of 900 nm wavelength having an operating
energy of about 150 µjoules, two plano-convex
cylindrical lenses of 40 mm focal length, the option of
selecting 1 to 3 CCD sensors, a trigger pulsed generator,
a timing control unit and DC power sources. A beam of
laser source is transformed into a sharp thin line using
cylindrical lenses and projected onto the surface of the
paper web. The low-specular reflected line of light from
the paper surface, which carries the surface topographical
information, is captured by cameras. The captured images
are processed by image processing techniques which
include, the fast acquisition of images synchronized with
the pulsed laser sources, pre-processing and post-
processing filters, cropping the region of interest, a line
profile processing algorithm and the transformation from
a time domain to a frequency domain. Finally, the
averages of multiple measurements and quantitative
results in the form of Ra and Rq are obtained.
The accuracy of the overall system can deteriorate due
to the noise in the electronic system, the imaging sensor,
and speckle in the laser line. The average noise based on
Rq was found to be 8.1 nm (4.3%), calculated when the
long-wavelength cutoff λc was 8.75 mm. The imaging
sensor resolution in the horizontal axis was 1600 pixels
and, as each sensor captures a 70 mm physical length
(evaluation length) on the paper surface, the spatial
resolution is 43.75 µm.
Sample reels descriptions
There were 8 sample reels in total including 4
newspapers and 4 paperboards, since each reel was
measured separately on two sides, a total of 16 surfaces
measured. For example reels 1 and 2 are physically the
same reel, but when its topside was measured, it was
numbered as Reel 1 and when the wireside was
measured, it was numbered as Reel 2. Similarly, the
Fig 1. Indicates the exact location of the OnTop in the figure at the left. The two figures show the location of the measurement on the moving paper web along cross direction.
paperboard reels were also measured separately for the
uncoated and coated sides and numbered accordingly.
These 16 surfaces were examined online and listed in
Table 1. The samples consist of different grades and
weights of newspaper and paperboard reels. The
paperboard samples consist of the edge and the middle
reels. The edge reels are those which were taken from the
edge position of the master reel and the middle reels were
taken from the middle positions of the master reel. It is
commonly known that the difference in surface quality
between the edge and middle positions is very small but it
is also known that the level of roughness, in general, is
higher at the edge positions than at the middle position,
due to shrinkages during the manufacturing process. The
edge and middle reels were deliberately included in the
study in order to measure the roughness of almost similar
surfaces where the differences are very low. These reels
played important roles in order to evaluate the accuracy
and performance of the prototype. The paperboard reels
were provided by Iggesund Paperboard AB, Iggesund,
Sweden and the Newspaper reels by SCA Ortviken Paper
Mill, Sundsvall, Sweden.
Table I. Sample reels description.
Reel Nr.
Description Surface
1 43 gsm Newspaper Topside 2 43 gsm Newspaper Wireside 3 49 gsm Newspaper Topside 4 49 gsm Newspaper Wireside 5 51 gsm Newspaper Topside 6 51 gsm Newspaper Wireside 7 60 gsm Newspaper Topside 8 60 gsm Newspaper Wireside 9 Edge-position paperboard Uncoated 10 20 gsm Edge-position paperboard Coated 11 Middle-position paperboard Uncoated 12 20 gsm middle-position paperboard Coated 13 Edge-position paperboard Uncoated 14 24 gsm Edge-position paperboard Coated 15 Middle-position paperboard Uncoated 16 24 gsm middle-position paperboard Coated
PAPER PHYSICS
664 Nordic Pulp and Paper Research Journal Vol 27 no.3/2012
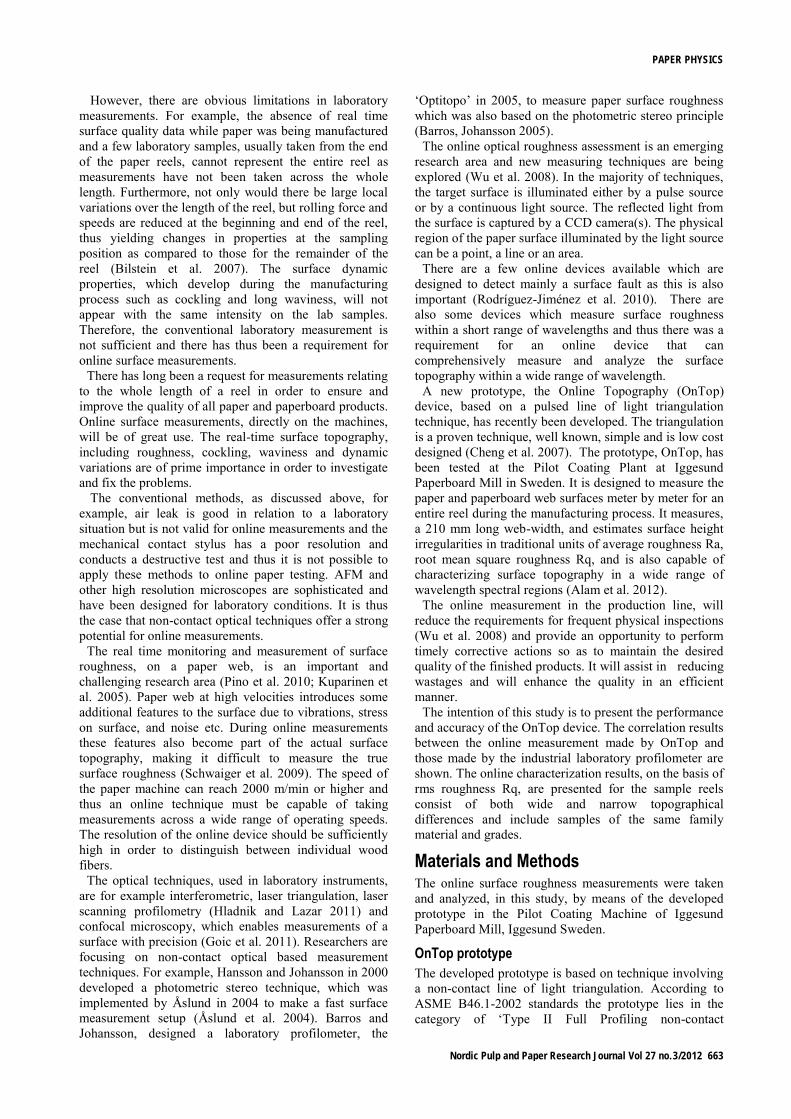
Statistical Analysis
The surface structure contains irregularities such as
roughness, waviness, and form including position error
(Costa et al. 2005; ASME B46.1-2002) and their
relationships are shown in Fig 2. Roughness is defined as
the finer irregularities on the surface that can be caused
by either processing methods or the material. Roughness
is a short and narrow spaced deviation and waviness is a
long and more widely spaced deviation phenomenon
(Alam at el. 2011; Reis and Saraiva 2010; Raja et al.
2002). Form and position error are also the topography
components that can develop due to the shape of the
sample under test and due to the insecure clamping or
misalignment of the paper samples or incorrect
positioning of the measuring device. Typical examples of
position-error are out-of-flatness and out-of-roundness
(ASME B46.1-2002).
In addition, there is also a surface deformation called
cockling which develops due to a change in humidity
(Gepp et al. 2009; Könnö and Stenberg 2010) and also
depends on the paper fiber orientation structure
(Leppänen at el. 2008). For example, during the drying
process the paper fibers can shrink and this consequently
creates tension among the surrounding fibers.
The prototype OnTop scans the web surface and builds
line profiles. The line profiles are filtered to extract
average roughness ‘Ra’ or the rms (root mean squared)
roughness ‘Rq’ (Alcock et al. 2010; Chinga 2006;
Duparre et al. 2002).
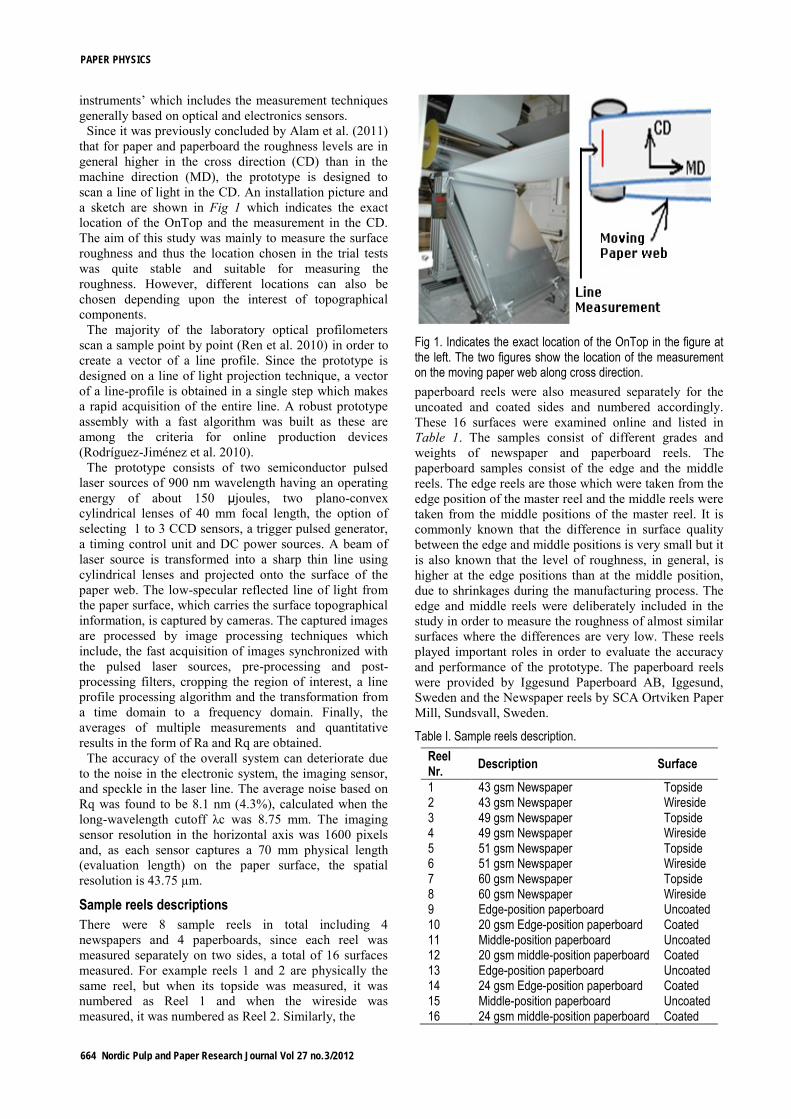
The Ra and Rq are the functions of the profile deviations
from a mean line (Stor-Pellinen et al. 1995), see Eq [1]
and [2]. In general, these can be defined as the statistical
data which contains an estimation of the overall surface
irregularities in one variable. Fig 3 is a plot of a profile
while the Ra and Rq levels are shown in order to show
the differences between them. ‘L’ is the total length
scanned on the horizontal axis and ‘x’ is a reference mean
line over which the topographical heights are measured.
Zx is the height amplitude at each iteration over the full
measurement length from x=0 to L-1.The surface profile
height ‘Z’ is calculated with reference to the mean line
and plotted on the vertical axis.
The widely used Ra and Rq formulas are represented in
the spatial domain as;
[1]
[2]
where
In Eq 2 it can be noted that the height amplitudes are
squared, therefore, the rms is more sensitive to the peaks
and valleys in the profile. Mathematically, the relation
between Ra and Rq is defined as Rq ≥ Ra. How much Rq
is larger than Ra depends on the scanned surface profile.
For most of the samples, studied in this work, the
amplitudes of Rq were found to be about 10-11% higher
than the Ra. All analysis results presented for the sample
reels are in rms Rq.
Fig 2. Shows (a) an image captured by the prototype, (b) the original profile extracted from the captured image, (c)-(e) depicts the relationship for the Roughness, Waviness and Form error components. The length of the scanned line is on the horizontal axis and the height of the profile is on the vertical axis.
Fig 3. Average levels of roughness Ra and rms roughness Rq of a typical profile extracted from one of our samples.
Results The performance verification of the developed prototype
in a real time environment was one of the challenges as
there was no such device available to make online
comparisons. Therefore, a comparison between online
and offline measurements was first made, and then the
online surface characterization of samples, as listed in
Table I, was presented. For example, comparisons were
carried out for the topside versus the wireside of the
newspaper reels, the coated side versus the uncoated side
of the paperboard reels, and also the middle reels versus
the edge reels.
Online versus offline measurements
The measurements of the 16 sample reels were obtained
by i) the online device OnTop and by ii) an offline
industrial profilometer, the Sture-3, and both
PAPER PHYSICS
Nordic Pulp and Paper Research Journal Vol 27 no.3/2012 665
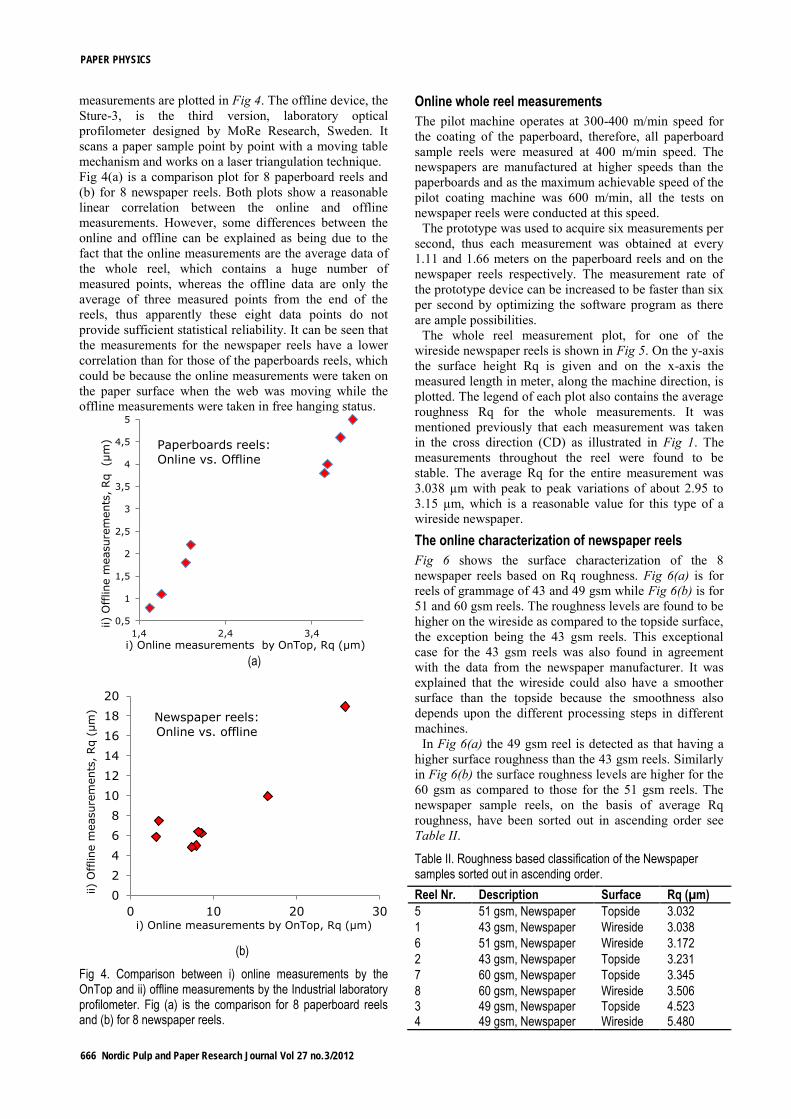
measurements are plotted in Fig 4. The offline device, the
Sture-3, is the third version, laboratory optical
profilometer designed by MoRe Research, Sweden. It
scans a paper sample point by point with a moving table
mechanism and works on a laser triangulation technique.
Fig 4(a) is a comparison plot for 8 paperboard reels and
(b) for 8 newspaper reels. Both plots show a reasonable
linear correlation between the online and offline
measurements. However, some differences between the
online and offline can be explained as being due to the
fact that the online measurements are the average data of
the whole reel, which contains a huge number of
measured points, whereas the offline data are only the
average of three measured points from the end of the
reels, thus apparently these eight data points do not
provide sufficient statistical reliability. It can be seen that
the measurements for the newspaper reels have a lower
correlation than for those of the paperboards reels, which
could be because the online measurements were taken on
the paper surface when the web was moving while the
offline measurements were taken in free hanging status.
(a)
(b)
Fig 4. Comparison between i) online measurements by the OnTop and ii) offline measurements by the Industrial laboratory profilometer. Fig (a) is the comparison for 8 paperboard reels and (b) for 8 newspaper reels.
Online whole reel measurements
The pilot machine operates at 300-400 m/min speed for
the coating of the paperboard, therefore, all paperboard
sample reels were measured at 400 m/min speed. The
newspapers are manufactured at higher speeds than the
paperboards and as the maximum achievable speed of the
pilot coating machine was 600 m/min, all the tests on
newspaper reels were conducted at this speed.
The prototype was used to acquire six measurements per
second, thus each measurement was obtained at every
1.11 and 1.66 meters on the paperboard reels and on the
newspaper reels respectively. The measurement rate of
the prototype device can be increased to be faster than six
per second by optimizing the software program as there
are ample possibilities.
The whole reel measurement plot, for one of the
wireside newspaper reels is shown in Fig 5. On the y-axis
the surface height Rq is given and on the x-axis the
measured length in meter, along the machine direction, is
plotted. The legend of each plot also contains the average
roughness Rq for the whole measurements. It was
mentioned previously that each measurement was taken
in the cross direction (CD) as illustrated in Fig 1. The
measurements throughout the reel were found to be
stable. The average Rq for the entire measurement was
3.038 µm with peak to peak variations of about 2.95 to
3.15 µm, which is a reasonable value for this type of a
wireside newspaper.
The online characterization of newspaper reels
Fig 6 shows the surface characterization of the 8
newspaper reels based on Rq roughness. Fig 6(a) is for
reels of grammage of 43 and 49 gsm while Fig 6(b) is for
51 and 60 gsm reels. The roughness levels are found to be
higher on the wireside as compared to the topside surface,
the exception being the 43 gsm reels. This exceptional
case for the 43 gsm reels was also found in agreement
with the data from the newspaper manufacturer. It was
explained that the wireside could also have a smoother
surface than the topside because the smoothness also
depends upon the different processing steps in different
machines.
In Fig 6(a) the 49 gsm reel is detected as that having a
higher surface roughness than the 43 gsm reels. Similarly
in Fig 6(b) the surface roughness levels are higher for the
60 gsm as compared to those for the 51 gsm reels. The
newspaper sample reels, on the basis of average Rq
roughness, have been sorted out in ascending order see
Table II.
Table II. Roughness based classification of the Newspaper samples sorted out in ascending order.
Reel Nr. Description Surface Rq (µm)
5 51 gsm, Newspaper Topside 3.032
1 43 gsm, Newspaper Wireside 3.038
6 51 gsm, Newspaper Wireside 3.172
2 43 gsm, Newspaper Topside 3.231
7 60 gsm, Newspaper Topside 3.345
8 60 gsm, Newspaper Wireside 3.506 3 49 gsm, Newspaper Topside 4.523 4 49 gsm, Newspaper Wireside 5.480
0,5
1
1,5
2
2,5
3
3,5
4
4,5
5
1,4 2,4 3,4
ii)
Off
line m
easure
ments
, Rq (µ
m)
i) Online measurements by OnTop, Rq (µm)
Paperboards reels:
Online vs. Offline
0
2
4
6
8
10
12
14
16
18
20
0 10 20 30
Newspaper reels:
Online vs. offline
i) Online measurements by OnTop, Rq (µm)
ii)
Off
line m
easure
ments
, Rq (
µm
)
PAPER PHYSICS
666 Nordic Pulp and Paper Research Journal Vol 27 no.3/2012
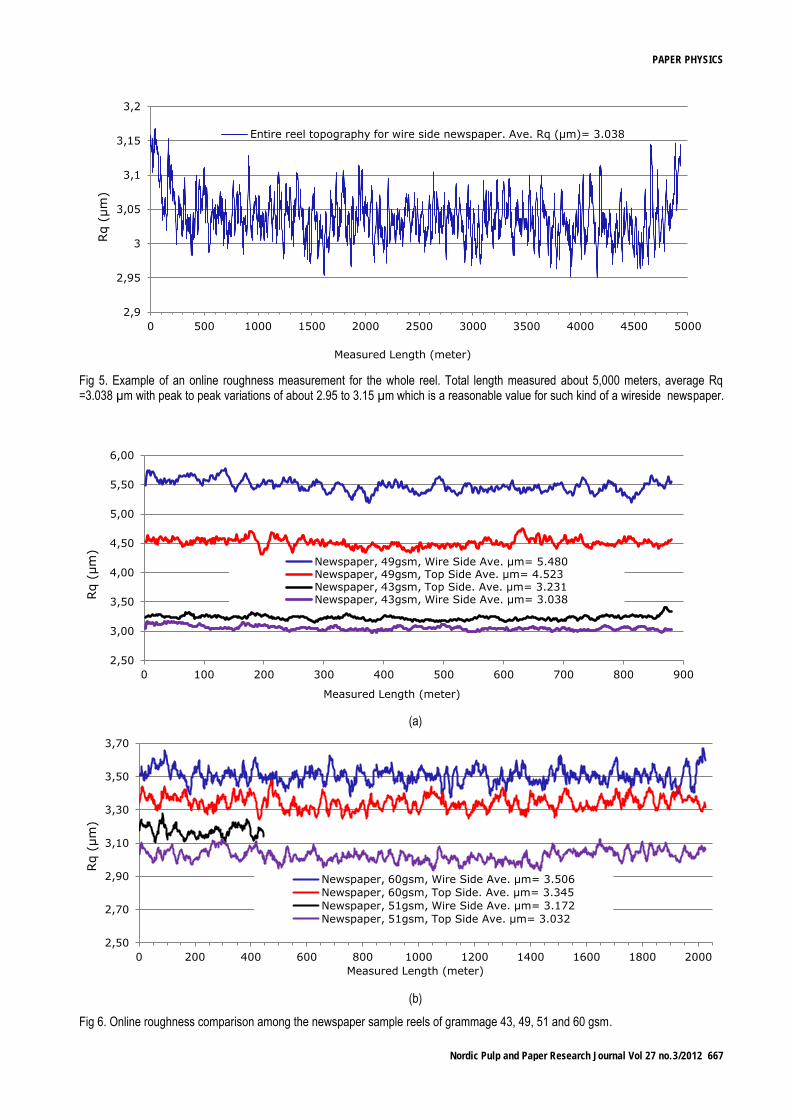
Fig 5. Example of an online roughness measurement for the whole reel. Total length measured about 5,000 meters, average Rq =3.038 µm with peak to peak variations of about 2.95 to 3.15 µm which is a reasonable value for such kind of a wireside newspaper.
(a)
(b)
Fig 6. Online roughness comparison among the newspaper sample reels of grammage 43, 49, 51 and 60 gsm.
2,9
2,95
3
3,05
3,1
3,15
3,2
0 500 1000 1500 2000 2500 3000 3500 4000 4500 5000
Entire reel topography for wire side newspaper. Ave. Rq (µm)= 3.038
Measured Length (meter)
Rq (
µm
)
2,50
3,00
3,50
4,00
4,50
5,00
5,50
6,00
0 100 200 300 400 500 600 700 800 900
Newspaper, 49gsm, Wire Side Ave. µm= 5.480 Newspaper, 49gsm, Top Side Ave. µm= 4.523 Newspaper, 43gsm, Top Side. Ave. µm= 3.231 Newspaper, 43gsm, Wire Side Ave. µm= 3.038
Measured Length (meter)
Rq (
µm
)
2,50
2,70
2,90
3,10
3,30
3,50
3,70
0 200 400 600 800 1000 1200 1400 1600 1800 2000
Newspaper, 60gsm, Wire Side Ave. µm= 3.506
Newspaper, 60gsm, Top Side. Ave. µm= 3.345
Newspaper, 51gsm, Wire Side Ave. µm= 3.172
Newspaper, 51gsm, Top Side Ave. µm= 3.032
Measured Length (meter)
Rq (
µm
)
PAPER PHYSICS
Nordic Pulp and Paper Research Journal Vol 27 no.3/2012 667
(a)
(b)
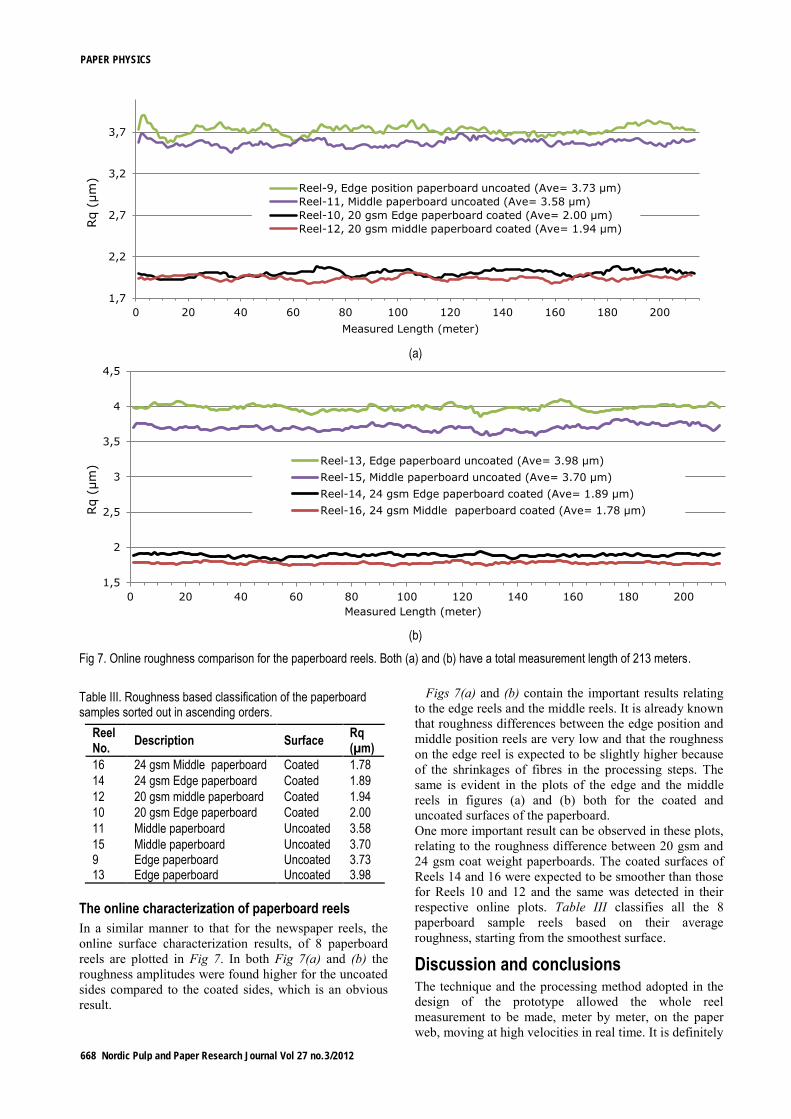
Fig 7. Online roughness comparison for the paperboard reels. Both (a) and (b) have a total measurement length of 213 meters.
Table III. Roughness based classification of the paperboard samples sorted out in ascending orders.
Reel No.
Description Surface Rq (µm)
16 24 gsm Middle paperboard Coated 1.78
14 24 gsm Edge paperboard Coated 1.89
12 20 gsm middle paperboard Coated 1.94
10 20 gsm Edge paperboard Coated 2.00
11 Middle paperboard Uncoated 3.58
15 Middle paperboard Uncoated 3.70 9 Edge paperboard Uncoated 3.73 13 Edge paperboard Uncoated 3.98
The online characterization of paperboard reels
In a similar manner to that for the newspaper reels, the
online surface characterization results, of 8 paperboard
reels are plotted in Fig 7. In both Fig 7(a) and (b) the
roughness amplitudes were found higher for the uncoated
sides compared to the coated sides, which is an obvious
result.
Figs 7(a) and (b) contain the important results relating
to the edge reels and the middle reels. It is already known
that roughness differences between the edge position and
middle position reels are very low and that the roughness
on the edge reel is expected to be slightly higher because
of the shrinkages of fibres in the processing steps. The
same is evident in the plots of the edge and the middle
reels in figures (a) and (b) both for the coated and
uncoated surfaces of the paperboard.
One more important result can be observed in these plots,
relating to the roughness difference between 20 gsm and
24 gsm coat weight paperboards. The coated surfaces of
Reels 14 and 16 were expected to be smoother than those
for Reels 10 and 12 and the same was detected in their
respective online plots. Table III classifies all the 8
paperboard sample reels based on their average
roughness, starting from the smoothest surface.
Discussion and conclusions The technique and the processing method adopted in the
design of the prototype allowed the whole reel
measurement to be made, meter by meter, on the paper
web, moving at high velocities in real time. It is definitely
1,7
2,2
2,7
3,2
3,7
0 20 40 60 80 100 120 140 160 180 200
Reel-9, Edge position paperboard uncoated (Ave= 3.73 µm)
Reel-11, Middle paperboard uncoated (Ave= 3.58 µm)
Reel-10, 20 gsm Edge paperboard coated (Ave= 2.00 µm)
Reel-12, 20 gsm middle paperboard coated (Ave= 1.94 µm)
Measured Length (meter)
Rq (
µm
)
1,5
2
2,5
3
3,5
4
4,5
0 20 40 60 80 100 120 140 160 180 200
Reel-13, Edge paperboard uncoated (Ave= 3.98 µm)
Reel-15, Middle paperboard uncoated (Ave= 3.70 µm)
Reel-14, 24 gsm Edge paperboard coated (Ave= 1.89 µm)
Reel-16, 24 gsm Middle paperboard coated (Ave= 1.78 µm)
Measured Length (meter)
Rq (
µm
)
PAPER PHYSICS
668 Nordic Pulp and Paper Research Journal Vol 27 no.3/2012
possible to increase the current prototype measurement
rate of six per second by optimizing the software and if
the only interest is in measuring the average roughness in
a single variable of Ra or Rq. The online results
presented have achieved the micro level roughness
measurements and have shown that the prototype method
can differentiate between surfaces of very similar
roughness, making the method useful for the paper and
paperboard industries. The tests, conducted to compare
online and the offline measurements, give hints as to the
accuracy of the OnTop prototype method.
The real time surface profile data offer the potential to
extract and measure the surface irregularity components
such as cockling and waviness in addition to roughness.
The developed prototype and the experimental results
have provided proof that the exploitation of simple and
economical laser triangulation technique can not only be
a valuable application for online surface topography
measurements in both the paper and paperboard
industries, but also for other related industrial
applications.
Acknowledgements Knowledge Foundation, Sweden is gratefully acknowledged for its financial support. Thanks to Krister Alden of Mid Sweden University, Sundsvall Sweden for his technical help in accomplishing this prototype. Thanks must also be given to Professor Bengt Oelmann for his great support and inspiration and for providing the motivation to encourage the researchers in the department.
Literature Aguilar, J. R., Arenas J.P. and Salinas, R. (2009): Friction noise technique for the measurement of surface roughness of papers, Applied Acoustics, 70(9), 1235-1240.
Alam, A., Thim, J., Manuilskiy, A., O’Nils, M., Westerlind., C., Lindgren, J. and Lidén, J. (2011): Investigation of the surface topographical differences between the Cross Direction and the Machine Direction for newspaper and paperboard. Nord. Pulp Paper Res. J. 26(4), 468-475.
Alam, A., Thim, J., O’Nils, M., Manuilskiy, A., Lindgren, J. and Lidén, J. (2012): Online surface characterization of paper and paperboards in a wide-range of the spatial wavelength spectrum, Appl. Surf. Sci., http://dx.doi.org/10.1016/j.apsusc.2012.04.136, in press
Alcock, S.G., Ludbrook, G.D., Owen, T. and Dockree, R. (2010): Using the power spectral density method to characterise the surface topography of optical surfaces, Proceedings of SPIE –The International Society for Optical Engineering, 7801(780108), Advances in Metrology for X-Ray and EUV Optics III; San Diego, CA.
Åslund, P., Johansson, P.-Å. and Blohm, E. (2004): Photometric method for dynamic measurements of paper roughening after a moistening printing nip , Nord. Pulp Paper Res. J., 19(4),460-465.
ASME B46.1-2002 (2002): Surface Texture, Surface Roughness, Waviness and Lay. An American National Standard, the American Society of Mechanical Engineers.
Barros, G.G. and Johansson, P. -Å (2005): The OptiTopo technique for fast assessment of paper topography –Limitatios, applications and improvements, Journal of Imaging Science and Technology, 49(2), (170-178).
Bilstein, W., Enderle, W., Moreas, G., Oppermann, D., Routschek, T. and Velde F.V.D. (2007): Two Systems for On-Line Oilfilm and Surface Roughness Measurement for Strip Steel.Production, An Int. Journal of Metallurgy, 104, 348-353.
Cheng, V.S., Hao, L.J., Chen, X.Z., Zhang, S. and Chen, Y.Z. (2007): Laser vision system based on synchronized scanning method Lecture Notes in Control and Information Sciences2007 362 83-89
Chinga, G. (2006): A quadtree decomposition approach for surface assessment, Pattern Analysis and Applications, 9(1), 94-101.
sta, ., Ange li , ., eis, M. ., Atai de, J.M. and Saraiva, P.M. (2005): Paper superficial waviness: Conception and implementation of an industrial statistical measurement system Analytica Chimica Acta 544 (1-2), (135-142).
Duparre, A., Ferre-Borrull J., Gliech, S., Notni, G., Steinert, J. and Bennett, J.M. (2002): Surface Characterization Techniques for Determining the Root-Mean-Square roughness and Power Spectral Denstities of Optical Components, OSA Journal Applied Optics, 41(1), (154-171).
Gepp, S., Örtegren, J., Hägglund, J.-E. and Alfthan, E. (2009): Measuring cockling on-line in high speed inkjet printing. Int. Conf. on Digital Printing Tech. 521-523.
Goic, G.L., Favrelière, H., Samper, S. and Formosa, F. (2011) Multi Scale Modal Decomposition of Primary Form, Waviness and Roughness of Surfaces. Scanning 33, 1–10.
Gunnar Engstrom, Veronique Morin (1994): Quantitative description of the increase in surface roughness of the base paper during coating, Nord. Pulp Paper Res. J., 9(2), 106-110.
Hansson, P. and Johansson, P –Å. (1999): New method for the simultaneous measurement of surface topography and ink distribution on prints, Nord. Pulp Paper Res. J. 14(4), 315-319.
Hladnik, A. and Lazar, M. (2011): Paper and board surface roughness characterization using laser profilometry and gray level cooccurrence matrix, Nord. Pulp Paper Res. J. 26(1), 99-105.
Könnö, J. and Stenberg, R. (2010): A Finite element analysis of composite plates with an application to the paper cockling problem Finite Elements in Analysis and Design 46 265-272.
Kuparinen, T., Rodionov, O., Toivanen, P., Mielikainen, J., Bochko, V., Korkalainen, A., Parviainen, J., Vartiainen, E. (2005): Fractal Dimension Analysis and Statistical Processing of Paper Surface Images Towards Surface Roughness Measurement. SCIA Lecture Notes in Computer Science 3540, 1218-1227
Leppänen, T., Erkkilä, A.-L. and Hämäläinen, J. (2008):
Effect of fiber orientation structure on simulated cockling of
paper. J. Pulp Paper Sci. 34 (4), 226-233.
Litvinov, V. and Farnood, R (2006) Modeling thickness and roughness reduction of paper in calendering. Nord. Pulp Paper Res. J. 21 (3), 365-371
Ma, J. (2005): Towards artifact-free characterization of surface topography using complex wavelets and total variation minimization Applied Mathematics and Computation 170 1014-1030
PAPER PHYSICS
Nordic Pulp and Paper Research Journal Vol 27 no.3/2012 669
Ostadi, H., Jiang, K. and Hukins D.W.L. (2010): A comparison of surface roughness analysis methods applied to urinary catheters Precision Engineering 34 798–801
Pierre, V., Jean-Francis, B., Christophe, M., Anne, B., and Bernard, P. (2008): Statistical analysis of paper surface microstructure: A multi-scale approach, Applied Surface Science, 254(22), 7431-7437.
Pino, A.O., Pladellorens, J. and Colom, J.F. (2010): Method of measure of roughness of paper based in the analysis of the texture of speckle pattern Proceedings of SPIE - The Int. Society for Optical Engineering Rosario Argentina 7387, art. no. 73871W
Raja, J.B., Muralikrishnan, B. and Fu, S. (2002): Recent advances in separation of roughness, waviness and form Journal of the International Societies for Precision Engineering and Nanotechnology 20 222-235.
Rättö, P. (2005): The influence of surface roughness on the compressive behaviour of paper, Nord. Pulp Paper Res. J., 20(3), 304-307.
Reis, M.S. and Saraiva, P.M. (2010): Analysis and Classification of the Paper Surface, Ind. Eng. Chem. Res. 49 2493-2502.
Ren, J., Gao, X.-R., Peng, J.-P. and Guo, J.-Q. (2010): Research on 2D laser distance sensor , Proceedings of SPIE - The Int. Society for Optical Engineering 7544, art. no. 75444Q.
Singh, S.P. (2008): A comparison of different methods of paper surface smoothness evaluation, BioResources, 3 503-516.
Rodríguez-Jiménez, S., Álvarez, I., García, R. and Marina,
J. (2010): Analysis of Block Matching Algorithms for the
Application of Image Mosaicing to Online Surface Inspection of Steel Products IEEE Int. Conf. on Imaging Systems and Techniques, IST 2010 - Proceeding 5548491 214-219.
Samyn, P., Van Erps, J., Thienpont, H. and Schoukens, G.
(2011): Paper coatings with multi-scale roughness evaluated at different sampling sizes. Applied Surface Science 257 (13), 5613-5625
Schwaiger, E., Kandelbauer, A. and Teischinger, A. (2009) Practicalities and limitations of measuring techniques for paper properties that affect flexographic printability - A review. Nord. Pulp Paper Res. J. 24 (3), 351-362
Stor-Pellinen, J. and Luukkala M. (1995): Paper roughness measurement using airborne ultrasound Sensors and Actuators: A. Physical 49 37-40.
Tay, C.J. and Quan, C. (2003): A parametric study on surface
roughness evaluation of semi-conductor wafers by laser
scattering Optik (Jena) Int. Journal for Light and Electron Optics
114 01-06.
Thim, J., O’Nils, M., Manuilskiy, A. and Thörnberg, B. (2009): Simulating the Impact of Topographical Microstructures on Triangulation Measurement Setups Using MATLAB. Matlabe User Conf. Nordic 2008 Stockholm.
Vernhes, P., Bloch, J.-F., Mercier, C., Blayo, A. and Pineaux, B. (2008): Statistical analysis of paper surface microstructure: A multi-scale approach, Applied Surface Science, 254(22), 7431-7437.
Wu, G., Kwak, H., Jnag, S., Xu, K. and Xu, J. (2008): Design of Online Surface Inspection System of Hot Rolled Strips. Proc. IEEE Int. Conf. on Automation and Logistics, ICAL 2008 Qingdao 4636548 2291-2295.
Manuscript received November 22, 2011 Accepted February 16, 2012
PAPER PHYSICS
670 Nordic Pulp and Paper Research Journal Vol 27 no.3/2012