online supplementary table 1 macronutrients and their
TRANSCRIPT

Online Supplementary Table 1 Macronutrients and their association or effect on CV outcomes
Study Participant characteristics Study Design Measures and time points Key observations
Esmeijer et al.[7]
4837 participants in original cohort
Excluded 671
Total participants: n 2248
Time since MI: 4.0 (1.9-6.4) years
<0.80 g/kg ideal bodyweight:
Age: 69±6 years
77% men
BMI: 27.6±3.6 kg/m2
Ethnicity: 99% white
High blood pressure: 57%
SBP: 144±22 mmHg
DBP: 82±11 mmHg
Serum LDL-C: 2.7±0.9 mmol/L
Plasma Glucose: 6.0±1.8 mmol/L
Current smoker: 20%
BP lowering drugs: 90%
RAS drugs: 52%
Diabetes prevalence: 18%
Glucose lowering drugs: 14%
Lipid-modifying drugs: 88%
Anti-thrombotic drugs: 98%
Current smoker
Serum cystatin C: 1.02±0.29 mg/L
Serum creatinine: 1.05±0.37 mg/dL
eGFRcysC: 77±20 mL/min/1.73 m2
eGFRcr–cysC: 75±19 mL/min/1.73
m2
0.80 to <1.00 g/kg ideal bodyweight:
Age: 69±5 years
83% men
BMI: 27.4±3.5 kg/m2
Ethnicity: 99% white
High blood pressure: 58%
SBP: 144±21 mmHg
DBP: 82±11 mmHg
Serum LDL-C: 2.7±0.8 mmol/L
Plasma Glucose: 6.0±1.9 mmol/L
Current smoker: 18%
BP lowering drugs: 87%
Prospective cohort study
Participants taken from the Alpha Omega
Cohort (low-dose omega-3 fatty acids)
Present study included patients with available
blood samples at baseline and after 41
months follow-up
Participants grouped based on protein intake
(g/kg ideal body weight) at baseline:
<0.80,
0.80 to <1.00,
1.00 to <1.20
≥1.20 g/kg
<0.80 g/kg ideal bodyweight: 1346 ± 316
kcal/d, 173 ± 49 g/d carbohydrates (51 ± 8%
total energy), 52 ± 20 g/d total fat (35 ± 8%
total energy), 46 ± 8 g/d protein (14 ± 3%
total energy), 25 ± 8 g/d animal protein (8 ± 3
% total energy), 9 ± 7 g/d from meat (3 ± 2 %
total energy), 10 ± 5 g/d from dairy (3 ± 2 %
total energy), 21 ± 5 g/d plant protein (6 ± 1
% total energy)
0.80 to <1.00 g/kg ideal bodyweight: 1659 ±
364 kcal/d, 204 ± 57 g/d carbohydrates (49 ±
7% total energy), 66 ± 23 g/d total fat (36 ±
7% total energy), 61 ± 6 g/d protein (15 ± 3%
total energy), 36 ± 7 g/d animal protein (9 ± 3
% total energy), 15 ± 7 g from meat (4 ± 2 %
total energy), 14 ± 7 g/d from dairy (3 ± 2 %
total energy), 25 ± 6 g/d plant protein (6 ± 1
% total energy)
1.00 to <1.20 g/kg ideal bodyweight: 1874 ±
359 kcal/d, 228 ± 58 g/d carbohydrates/d (48
± 7% total energy), 75 ± 22 g/d total fat (36 ±
7% total energy), 73 ± 8 g/d protein (16 ± 3%
total energy), 45 ± 8 g/d animal protein (10 ±
3 % total energy), 18 ± 7g/d from meat (4 ± 2
% total energy), 18 ± 8 g/d from dairy (4 ± 2
Primary outcome; association between dietary protein
intake and risk of kidney function decline in post-MI
individuals
Bloods taken at baseline and 41 months follow up.
Cystatin C measured at baseline and 41 months. GFR
based on cystatin C (eGFRcysC) and combined
creatinine–cystatin C (eGFRcr–cysC) at baseline and
after 41 months, using the Chronic Kidney Disease Epidemiology Collaboration equations from 2012.
Diet data and anthropometry measured at baseline.
Diet data collected using 203 item FFQ. Questionnaires
checked by registered dietitian and nutrient content
calculated using 2006 Dutch Food Composition tables.
41 month diet data not collected.
Protein intake expressed as g/kg ideal body weight to
avoid erroneously high requirements in overweight and
obese subjects.
Linear regression used to study association of kidney
function decline and baseline intake of total protein,
types of protein (meat vs. dairy) sources of protein
(animal vs. plant). Models adjusted for age, sex and total
energy intake, education, alcohol, smoking, physical
activity, RAS blocking drugs, intake of fat (MUFA,
PUFA, SFA and TFA), dietary sodium, diabetes and
systolic blood pressure.
For whole cohort, annual change in
eGFRcysC and eGFRcr–cysC was
−1.30 (−1.43, −1.17) and −1.71 (−1.87, −1.56) mL/min/1.73 m2, respectively.
Total energy, all macro and
micronutrients increased with each
protein category.
Annual change in eGFRcysC was
doubled in those individuals with
protein intake >1.2 when compared to
those with < 0.8 g/kg ideal body weight
(1.60 [−1.92,−1.28] vs. −0.84 [−1.21, −0.46] mL/min/1.73 m2, respectively.
Significant inverse association between
intake of animal protein and both
eGFRcysC and eGFRcr–cysC.
Significance not observed with plant
protein.
With eGFR as outcome, the annual
decline in renal function was
significantly slower with dairy vs. meat
for every 5 g protein (−0.05 [−0.13, 0.03] vs. −0.11 [−0.20, −0.02]).
With change in eGFRcr–cysC as
outcome, there was no significant
difference between dairy and meat.
3-fold stronger association between
protein intake and eGFR decline in
patients with diabetes
Summary
In patients with established CVD,
higher protein intakes were
associated with accelerated decline in
renal function. Note that “meat” category contained “processed meats” such as sausage, hamburger,
Supplementary material Heart
doi: 10.1136/heartjnl-2019-315499–731.:724 106 2020;Heart, et al. Butler T

RAS drugs: 56%
Diabetes prevalence: 18%
Glucose lowering drugs: 12%
Lipid-modifying drugs: 85%
Anti-thrombotic drugs: 97%
Serum cystatin C: 0.99±0.26 mg/L
Serum creatinine: 1.04±0.35 mg/dL
eGFRcysC: 80±20 mL/min/1.73 m2
eGFRcr–cysC: 77±19 mL/min/1.73
m2
1.00 to <1.20 g/kg ideal bodyweight:
Age: 69±5 years
80% men
BMI: 27.7±3.6 kg/m2
Ethnicity: 99% white
High blood pressure: 57%
SBP: 145±22 mmHg
DBP: 82±11 mmHg
Serum LDL-C: 2.7±0.8 mmol/L
Plasma Glucose: 6.0±1.8 mmol/l
Current smoker: 13%
BP lowering drugs: 84%
RAS drugs: 52%
Diabetes prevalence: 17%
Glucose lowering drugs: 12%
Lipid-modifying drugs: 88%
Anti-thrombotic drugs: 98%
Serum cystatin C: 0.95 ± 0.22 mg/L
Serum creatinine: 1.01 ± 0.30 mg/dL
eGFRcysC: 83±19 mL/min/1.73 m2
eGFRcr–cysC: 79±19 mL/min/1.73
m2
≥1.20 g/kg ideal bodyweight: Age: 69±5 years
78% men
BMI: 27.8±3.7 kg/m2
Ethnicity: 99% white
High blood pressure: 55%
SBP: 142±20 mmHg
DBP: 81±10 mmHg
Serum LDL-C: 2.7±0.7 mmol/L
Plasma Glucose: 6.1±2.1 mmol/L
Current smoker:14%
% total energy), 28 ± 6 g/d plant protein (6 ±
1 % total energy)
≥1.20 g/kg ideal bodyweight: 2250 ± 469 kcal/d, 268 ± 68 g/d carbohydrates (48 ± 7%
total energy), 90 ± 27 g/d total fat (36 ± 6%
total energy), 92 ± 14 g/d protein (17 ± 3%
total energy), 60 ± 12 g/d animal protein (11
± 3 % total energy), 22 ± 8 g/d from meat (4
± 2 % total energy), 27 ± 12 g/d from dairy
(5 ± 2 % total energy), 33 ± 8 g/d plant
protein (6 ± 1 % total energy)
bacon therefore “meat” includes processed and unprocessed foods
Supplementary material Heart
doi: 10.1136/heartjnl-2019-315499–731.:724 106 2020;Heart, et al. Butler T
BP lowering drugs: 88%
RAS drugs: 57%
Diabetes prevalence: 19%
Glucose lowering drugs: 13%
Lipid-modifying drugs: 86%
Anti-thrombotic drugs: 99%
Serum cystatin C: 0.93±0.21 mg/L
Serum creatinine: 0.98±0.31 mg/dL
eGFRcysC: 85±18 mL/min/1.73 m2
eGFRcr–cysC: 82±18 mL/min/1.73
m2
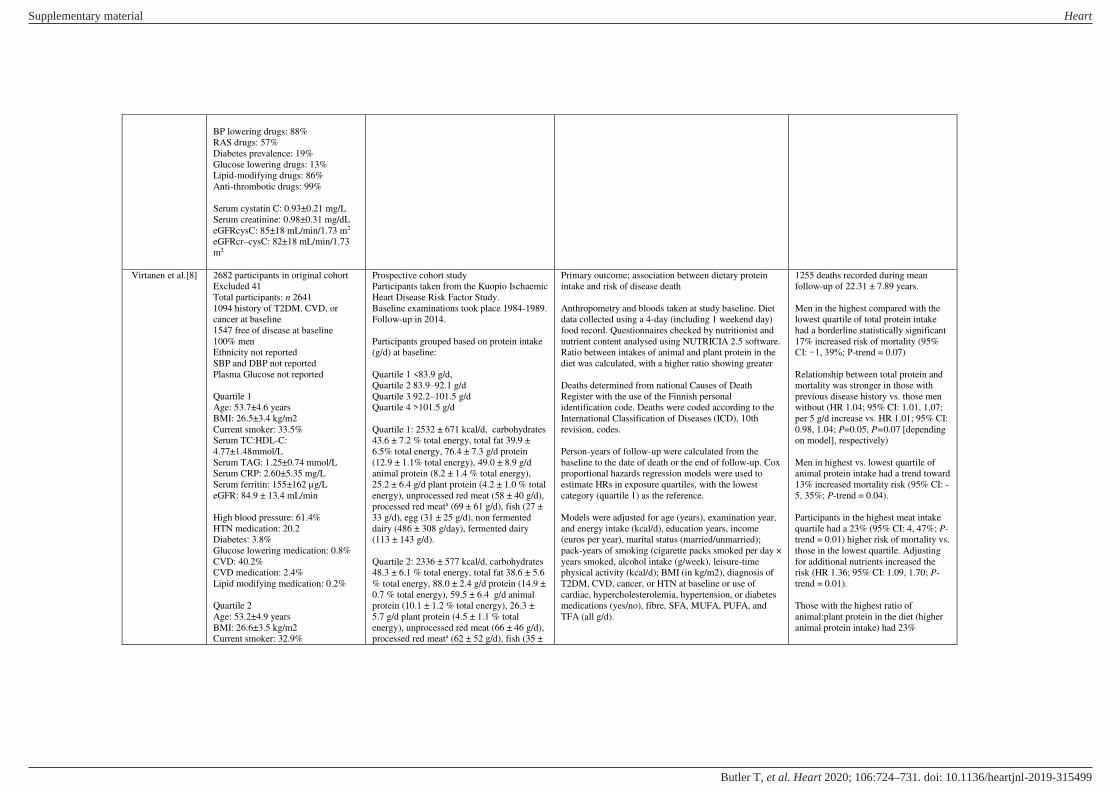
Virtanen et al.[8]
2682 participants in original cohort
Excluded 41
Total participants: n 2641
1094 history of T2DM, CVD, or
cancer at baseline
1547 free of disease at baseline
100% men
Ethnicity not reported
SBP and DBP not reported
Plasma Glucose not reported
Quartile 1
Age: 53.7±4.6 years
BMI: 26.5±3.4 kg/m2
Current smoker: 33.5%
Serum TC:HDL-C:
4.77±1.48mmol/L
Serum TAG: 1.25±0.74 mmol/L
Serum CRP: 2.60±5.35 mg/L
Serum ferritin: 155±162 µg/L
eGFR: 84.9 ± 13.4 mL/min
High blood pressure: 61.4%
HTN medication: 20.2
Diabetes: 3.8%
Glucose lowering medication: 0.8%
CVD: 40.2%
CVD medication: 2.4%
Lipid modifying medication: 0.2%
Quartile 2
Age: 53.2±4.9 years
BMI: 26.6±3.5 kg/m2
Current smoker: 32.9%
Prospective cohort study
Participants taken from the Kuopio Ischaemic
Heart Disease Risk Factor Study.
Baseline examinations took place 1984-1989.
Follow-up in 2014.
Participants grouped based on protein intake
(g/d) at baseline:
Quartile 1 <83.9 g/d,
Quartile 2 83.9–92.1 g/d
Quartile 3 92.2–101.5 g/d
Quartile 4 >101.5 g/d
Quartile 1: 2532 ± 671 kcal/d, carbohydrates
43.6 ± 7.2 % total energy, total fat 39.9 ±
6.5% total energy, 76.4 ± 7.3 g/d protein
(12.9 ± 1.1% total energy), 49.0 ± 8.9 g/d
animal protein (8.2 ± 1.4 % total energy),
25.2 ± 6.4 g/d plant protein (4.2 ± 1.0 % total
energy), unprocessed red meat (58 ± 40 g/d),
processed red meata (69 ± 61 g/d), fish (27 ±
33 g/d), egg (31 ± 25 g/d), non fermented
dairy (486 ± 308 g/day), fermented dairy
(113 ± 143 g/d).
Quartile 2: 2336 ± 577 kcal/d, carbohydrates
48.3 ± 6.1 % total energy, total fat 38.6 ± 5.6
% total energy, 88.0 ± 2.4 g/d protein (14.9 ±
0.7 % total energy), 59.5 ± 6.4 g/d animal
protein (10.1 ± 1.2 % total energy), 26.3 ±
5.7 g/d plant protein (4.5 ± 1.1 % total
energy), unprocessed red meat (66 ± 46 g/d),
processed red meata (62 ± 52 g/d), fish (35 ±
Primary outcome; association between dietary protein
intake and risk of disease death
Anthropometry and bloods taken at study baseline. Diet
data collected using a 4-day (including 1 weekend day)
food record. Questionnaires checked by nutritionist and
nutrient content analysed using NUTRICIA 2.5 software.
Ratio between intakes of animal and plant protein in the
diet was calculated, with a higher ratio showing greater
Deaths determined from national Causes of Death
Register with the use of the Finnish personal
identification code. Deaths were coded according to the
International Classification of Diseases (ICD), 10th
revision, codes.
Person-years of follow-up were calculated from the
baseline to the date of death or the end of follow-up. Cox
proportional hazards regression models were used to
estimate HRs in exposure quartiles, with the lowest
category (quartile 1) as the reference.
Models were adjusted for age (years), examination year,
and energy intake (kcal/d), education years, income
(euros per year), marital status (married/unmarried);
pack-years of smoking (cigarette packs smoked per day ×
years smoked, alcohol intake (g/week), leisure-time
physical activity (kcal/d); BMI (in kg/m2), diagnosis of
T2DM, CVD, cancer, or HTN at baseline or use of
cardiac, hypercholesterolemia, hypertension, or diabetes
medications (yes/no), fibre, SFA, MUFA, PUFA, and
TFA (all g/d).
1255 deaths recorded during mean
follow-up of 22.31 ± 7.89 years.
Men in the highest compared with the
lowest quartile of total protein intake
had a borderline statistically significant
17% increased risk of mortality (95%
CI: −1, 39%; P-trend = 0.07)
Relationship between total protein and
mortality was stronger in those with
previous disease history vs. those men
without (HR 1.04; 95% CI: 1.01, 1.07;
per 5 g/d increase vs. HR 1.01; 95% CI:
0.98, 1.04; P=0.05, P=0.07 [depending
on model], respectively)
Men in highest vs. lowest quartile of
animal protein intake had a trend toward
13% increased mortality risk (95% CI: -
5, 35%; P-trend = 0.04).
Participants in the highest meat intake
quartile had a 23% (95% CI: 4, 47%; P-
trend = 0.01) higher risk of mortality vs.
those in the lowest quartile. Adjusting
for additional nutrients increased the
risk (HR 1.36; 95% CI: 1.09, 1.70; P-
trend = 0.01).
Those with the highest ratio of
animal:plant protein in the diet (higher
animal protein intake) had 23%
Supplementary material Heart
doi: 10.1136/heartjnl-2019-315499–731.:724 106 2020;Heart, et al. Butler T
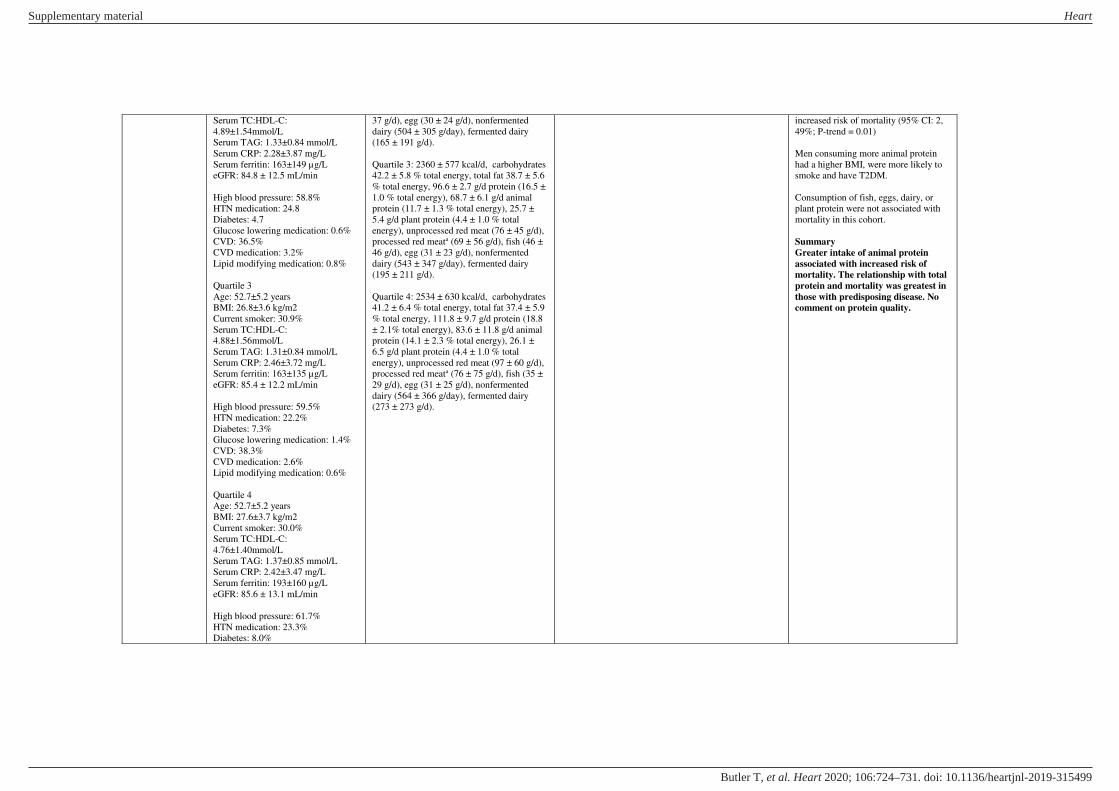
Serum TC:HDL-C:
4.89±1.54mmol/L
Serum TAG: 1.33±0.84 mmol/L
Serum CRP: 2.28±3.87 mg/L
Serum ferritin: 163±149 µg/L
eGFR: 84.8 ± 12.5 mL/min
High blood pressure: 58.8%
HTN medication: 24.8
Diabetes: 4.7
Glucose lowering medication: 0.6%
CVD: 36.5%
CVD medication: 3.2%
Lipid modifying medication: 0.8%
Quartile 3
Age: 52.7±5.2 years
BMI: 26.8±3.6 kg/m2
Current smoker: 30.9%
Serum TC:HDL-C:
4.88±1.56mmol/L
Serum TAG: 1.31±0.84 mmol/L
Serum CRP: 2.46±3.72 mg/L
Serum ferritin: 163±135 µg/L
eGFR: 85.4 ± 12.2 mL/min
High blood pressure: 59.5%
HTN medication: 22.2%
Diabetes: 7.3%
Glucose lowering medication: 1.4%
CVD: 38.3%
CVD medication: 2.6%
Lipid modifying medication: 0.6%
Quartile 4
Age: 52.7±5.2 years
BMI: 27.6±3.7 kg/m2
Current smoker: 30.0%
Serum TC:HDL-C:
4.76±1.40mmol/L
Serum TAG: 1.37±0.85 mmol/L
Serum CRP: 2.42±3.47 mg/L
Serum ferritin: 193±160 µg/L
eGFR: 85.6 ± 13.1 mL/min
High blood pressure: 61.7%
HTN medication: 23.3%
Diabetes: 8.0%
37 g/d), egg (30 ± 24 g/d), nonfermented
dairy (504 ± 305 g/day), fermented dairy
(165 ± 191 g/d).
Quartile 3: 2360 ± 577 kcal/d, carbohydrates
42.2 ± 5.8 % total energy, total fat 38.7 ± 5.6
% total energy, 96.6 ± 2.7 g/d protein (16.5 ±
1.0 % total energy), 68.7 ± 6.1 g/d animal
protein (11.7 ± 1.3 % total energy), 25.7 ±
5.4 g/d plant protein (4.4 ± 1.0 % total
energy), unprocessed red meat (76 ± 45 g/d),
processed red meata (69 ± 56 g/d), fish (46 ±
46 g/d), egg (31 ± 23 g/d), nonfermented
dairy (543 ± 347 g/day), fermented dairy
(195 ± 211 g/d).
Quartile 4: 2534 ± 630 kcal/d, carbohydrates
41.2 ± 6.4 % total energy, total fat 37.4 ± 5.9
% total energy, 111.8 ± 9.7 g/d protein (18.8
± 2.1% total energy), 83.6 ± 11.8 g/d animal
protein (14.1 ± 2.3 % total energy), 26.1 ±
6.5 g/d plant protein (4.4 ± 1.0 % total
energy), unprocessed red meat (97 ± 60 g/d),
processed red meata (76 ± 75 g/d), fish (35 ±
29 g/d), egg (31 ± 25 g/d), nonfermented
dairy (564 ± 366 g/day), fermented dairy
(273 ± 273 g/d).
increased risk of mortality (95% CI: 2,
49%; P-trend = 0.01)
Men consuming more animal protein
had a higher BMI, were more likely to
smoke and have T2DM.
Consumption of fish, eggs, dairy, or
plant protein were not associated with
mortality in this cohort.
Summary
Greater intake of animal protein
associated with increased risk of
mortality. The relationship with total
protein and mortality was greatest in
those with predisposing disease. No
comment on protein quality.
Supplementary material Heart
doi: 10.1136/heartjnl-2019-315499–731.:724 106 2020;Heart, et al. Butler T

Glucose lowering medication: 2.0%
CVD: 36.1%
CVD medication: 3.2%
Lipid modifying medication: 0.9%
O’Connor et al.[9]
261 participants approached
69 assessed for eligible
19 excluded
50 participants randomized
9 dropped out
Total participants: n 41
31% men
Age: 46±2 years
Med-Red
Body mass: 91.2±1.5 kg
Body fat: 37.2±1.0 %
SBP: 118±2 mmHg
DBP: 80±1 mmHg
Plasma glucose: 5.4±0.1 mmol/L
TC: 4.9±0.1 mmol/L
LDL-C: 3.1±0.1 mmol/L
HDL-C: 1.2±0.1 mmol/L
TAG: 1.4±0.1 mmol/L
ApoB: 1±0.0 g/L
Insulin: 85.4±7.6 pmol/L
CRP: 21.9±2.9
HOMA-IR: 2.981±0.299
10-year risk (%): 4.6±0.5
Vascular Age: 45±2 years
14-point Med Diet Score: 4±0
Med-Control
Body mass: 90.6±1.5 kg
Body fat: 36.6±1.0 %
SBP: 120±2 mmHg
DBP: 78±1 mmHg
Plasma glucose: 5.3±0.1 mmol/L
TC: 4.9±0.1 mmol/L
LDL-C: 3.0±0.1 mmol/L
HDL-C: 1.3±0.1 mmol/L
TAG: 1.4±0.1 mmol/L
ApoB: 0.9±0.0 g/L
Insulin: 77.1±6.9 pmol/L
CRP: 21.9±2.9
Randomized, crossover, controlled feeding
trial
16 week duration
Two 5-week controlled feeding intervention
with 4 week of self-selected unrestricted
“wash-out”. Intervention consisted of a “Mediterranean
Pattern” with daily macronutrients targets of 40% of total energy as carbohydrate, 22%
protein, and 40% fat. Daily fat intakes were
targeted at 7% of total energy as SFA and
20% MUFA. All foods were provided.
Mediterranean Patterns contained ∼500 g
(Med-Red) and ∼200 g (Med-Control) of
lean, unprocessed beef or pork per week.
Med-Red
2601 ± 428 kcal/d, carbohydrates 42 ± 1 %
total energy, total fat 40 ± 1 % total energy,
MUFA 22 ± 1 total energy, PUFA 8 ± 0 %
total energy, SFA 7 ± 0 total energy, protein
18 ± 0 % total energy, 476 g red meat/wk,
112 g poultry/wk, 336 g seafood/wk, 2
eggs/wk, 560g nuts, seed, soy/wk, 3 servings
dairy/d. 14-point Med Diet Score: 12
Med-Control
2573 ± 405 kcal/d, carbohydrates 42 ± 2 %
total energy, total fat 40 ± 1 % total energy,
MUFA 21 ± 1 total energy, PUFA 9 ± 1 %
total energy, SFA 8 ± 0 total energy, protein
19 ± 1 % total energy, 196 g red meat/wk,
420 g poultry/wk, 336 g seafood/wk, 3
eggs/wk, 616 g nuts, seed, soy/wk, 2 servings
dairy/d. 14-point Med Diet Score: 13
Note that these are prescribed diets. It is not
clear if participants consumed other food
during the study intervention.
Primary outcome: assess the effects of consuming a
Mediterranean Pattern with different amounts of red meat
on cardiometabolic disease risk factors
Anthropometry (body mass and composition), bloods
(full lipid profile) and Framingham Heart Study 10-year
CV risk and vascular age taken at baseline and during the
last week of the study.
Baseline food intakes determined prior to randomisation
and during washout to determine return to self-selected
eating pattern
Greater reduction of body mass in Med-
Red vs. Med-Control group (−1.6 ± 0.5 vs. −1.0 ± 0.5 kg, respectively).
TC decreased significantly in both Med-
Red and Med-Control (-0.4 ± 0.1 vs. -
0.2 ± 0.1 mmol/L, respectively).
Decrease in Med-Red was significantly
greater than Med-Control.
Significant decrease in LDL-C in Med-
Red group vs. baseline value (3.1 ± 0.1
vs. 2.8 ± 0.1 mmol/L, respectively).
Significant reduction in ApoB in Med-
Red vs. Med-Control (-0.1 ± 0.0 vs. 0.0
± 0.0 g/L, respectively)
No significant change in TC:HDL-C,
TAG, CRP, glucose, insulin, and
HOMA-IR between groups.
Significant reductions in SBP in Med-
Red and Med-Control groups over time
(-3 ± 2 vs. -5 ± 2 mmHg, respectively)
Both Med-Red and Med-Control
improved 10-year CV risk score (-0.7 ±
0.4 and -0.5 ± 0.4 years) and improved
vascular age.
Summary
This short-term study shows adopting
a Mediterranean diet pattern
improves cardiometabolic risk
irrespective of red meat intake
providing the meat is lean and
unprocessed.
Supplementary material Heart
doi: 10.1136/heartjnl-2019-315499–731.:724 106 2020;Heart, et al. Butler T

HOMA-IR: 2.679±0.297
10-year risk (%): 4.6±0.5
Vascular Age: 45±2 years
14-point Med Diet Score: 4±0
No statistically significant difference
in any baseline parameter between
groups
Ethnicity and medication use not
reported
Guasch-Ferré et
al.[10]
Articles via PubMed: 366
Excluded 267 due to inappropriate
articles (literature reviews, editorials,
not RCT design, outcomes of interest
not reported, control and red meat
consumption not different)
99 Articles assessed for eligibility
Excluded 66 due to acute feeding
trials, lipids not reported, red meat
intake not reported, no comparison
group.
Articles in final meta-analysis: 36
20 studies used a cross-over design
Sample size for studies ranged from
8-191 participants
Mean ages ranged from 22-70 years
of age
Included both normolipidaemic
(n=26 studies) and hyperlipidaemic
(n=11 studies) participants
Red meat consumption ranged from
46.5-500 g/d in intervention diets and
0-266 g/d in comparison diets
Minimally-processed red meat was
consumed in 24 studies; processed
red meat was consumed in 5 studies,
and the extent of red meat processing
was not reported in 8 studies
Meta-analysis of RCTs comparing red meat
consumption vs. other comparison diets
Articles soured from PubMed (up to 2017)
Study quality score from National Heart,
Lung and Blood Institute (Quality
Assessment of Controlled Intervention
Studies): Score ranging from 0 to 28 points
Research question developed using PICOS
Inclusion criteria were:
Participants aged ≥18 years and not pregnant, intervention and comparison diets
that prescribed differing amounts of red meat,
reporting, ≥1 cardiovascular risk factor as a dependent variable (i.e. TC, LDL-C, HDL-C,
TAGs, apolipoproteins [A1 and B], or blood
pressure), and use of a RCT study design. As
a minimum the study needed to be at least 2
weeks in duration
Meat defined as “all forms of beef, pork, lamb, veal, goat, and non-bird game (eg,
venison, bison, elk)”
Processed meat defined as “preserved by smoking, curing, salting, and/or the addition
of chemical preservative.”
Primary outcomes changes or differences in blood
concentrations of TC, LDL-C, HDL-C, ApoA1, ApoB,
or blood pressure.
When combining all studies examining
red meat vs. all comparison diets, there
was no significant effects of red meat
on TC, LDL-C, HDL-C, TC:HDL-C,
HDL-C:LDL-C, VLDL-C, ApoA1, or
ApoB.
Red meat yielded lesser decreases in
TAGs (WMD 0.065 mmol/L; 95% CI,
0.000, 0.129).
Lean red meat gave created decreases in
TC and LDL-C (WMD -0.05 mmol/L;
95% CI: -0.12, -0.02; P=0.04;
WMD -0.08 mmol/L; 95% CI: -0.15, -
0.02, P=0.03, respectively) relative to
all comparison diets.
No significant differential effects
of red meat were observed for total
cholesterol or LDL-C when dietary SFA
intake in the red meat
group was higher or similar to that in
the comparison diet.
When compared with high-quality plant
protein, red meat yielded smaller
decreases in TC (WMD 0.264 mmol/L;
95% CI: 0.144, 0.383; P<0.001) and
LDL-C (WMD 0.198 mmol/L; 95% CI:
0.065, 0.330; P=0.003).
Red meat decreased TC (WMD -0.109
mmol/L; 95% CI: -0.211, -0.007;
P<0.036) and LDL-C (WMD
Supplementary material Heart
doi: 10.1136/heartjnl-2019-315499–731.:724 106 2020;Heart, et al. Butler T

–0.173 mmol/L; 95% CI: -0.260, -
0.086; P<0.001) when compared to fish-
only diets
Red meat showed no significant
difference on any lipid variable when
compared with chicken or poultry diets
When poultry and fish were combined,
red meat decreased TC to a greater
extent (WMD -0.092
mmol/L; 95% CI: -0.177, -0.008;
P=0.032) and TAG to a lesser extent
(WMD 0.224 mmol/L; 95% CI: 0.077,
0.371; P=0.003).
When compared with carbohydrates, red
meat yielded lesser decreases in HDL-C
(WMD 0.139 mmol/L; 95%
CI, 0.004, 0.275; P=0.043) when usual
diet was the comparison (WMD 0.081
mmol/L; 95% CI, 0.008, 0.153;
P=0.030).
In comparison with carbohydrates, red
meat yielded greater decreases in
TAG concentrations (WMD -0.181
mmol/L; 95% CI: -0.349, -0.013;
P=0.035) and also with combined
animal protein sources (WMD -0.093
mol/L; 95% CI: -0.176, -0.011,
P=0.027).
Summary
Relative to all diets combined, red
meat had no significant impact on
TC, LDL-C, HDL-C, ApoA1, B, BP
but gave lesser decreases in TAG.
When compared with specific control
diets, swapping red met for high-
quality plant protein led to beneficial
changes in lipids.
Kwok et al.[11]
Potentially relevant records: 3011
Excluded 2670
341 reviews or studies reviewed in
detail
Excluded 308
Review of evidence from systematic reviews
and meta analyses
Identified food categories/groups based on
UK ‘EatWell guide’, ‘the five food groups’
Primary outcomes included death (all-cause) or
cardiovascular disease (stroke, cerebrovascular disease,
cerebrovascular accident, CHD, ischaemic heart disease,
coronary artery disease, acute myocardial infarction,
For all-cause mortality the evidence was
ranked as Level 2 for refined grains,
green leafy vegetables/salad and tinned
fruit.
Supplementary material Heart
doi: 10.1136/heartjnl-2019-315499–731.:724 106 2020;Heart, et al. Butler T

Articles in final meta-analysis: 33
16 reviews on all-cause mortality
17 reviews on cardiovascular disease
None of the included studies were
based on RCT data
Follow up periods not reported.
in the 2015-2020 Dietary guidelines for
Americans, and ‘Food guide pyramid’ from the Centre for Nutrition Policy and
Promotion in the United States
Searched PubMed (August 2018) for most
recent and highest quality systematic review
and meta analysis evaluating the dietary
components and associated adverse
outcomes.
Quality assessment of studies performed
using WHO strength of evidence:
Level 1a/b convincing evidence
Level 2 probable evidence
Level 3 possible evidence
Level 4 limited/contrasting
Inclusion criteria were
Studies had to have the dietary component of
interest and some form of quantitative
association with either CVD or mortality
Food item consumption and its association
with outcome can be quantified as a dose–response relationship and highest compared
to lowest consumers of food items.
acute coronary syndrome, HF, cardiac failure, cardiac
insufficiency)
For CVD only fish had Level 2
evidence.
All-cause mortality
2 or fewer studies for the assessment of
whole grain bread, pasta, whole grain
breakfast cereals, or oats/oatmeal.
In a dose-response analysis all food
items above were associated with a
significantly reduced risk of all-cause
mortality (whole grain bread: RR 0.85;
95% CI: 0.82, 0.89; pasta: RR 0.85;
95% CI: 0.74, 0.99; wholegrain
breakfast cereal: RR 0.88; 95% CI:
0.83, 0.92; oats/oatmeal: RR 0.88; 95%
CI: 0.83, 0.92).
Intake of refined grains and fibre were
associated with a significant dose–response reduction in all-cause
mortality (163,634 participants; RR
0.95; 95% CI: 0.91, 0.99; and 875,390
participants; RR 0.90; 95% CI: 0.86,
0.94, respectively)
No association was found between rice
(453,723 participants) and all-cause
mortality
Fish consumption was associated with a
benefit for all-cause mortality (RR 0.98;
95% CI: 0.97, 1.00).
Processed meat was associated with a
25% increased risk of all-cause
mortality (1,1423,969 participants, RR
1.25; 95% CI: 1.07, 1.45). No
associations were found between white
and red meat, and eggs.
Root vegetables (451,151 participants,
RR 0.76; 95% CI: 0.66, 0.88), green
leafy vegetables/salad (568,725
participants, RR 0.78; 95% CI: 0.71,
0.86), cooked vegetables (631,480
participants, RR 0.89; 95% CI: 0.80,
0.99) and cruciferous vegetables
Supplementary material Heart
doi: 10.1136/heartjnl-2019-315499–731.:724 106 2020;Heart, et al. Butler T

(531,147 participants, RR 0.90; 95% CI:
0.85, 0.95) were associated with lower
all-cause mortality. Tinned fruit was
associated with increased all-cause
mortality (147,712 participants, RR
1.14; 95% CI: 1.07, 1.21).
Comparing high and low consumers of
alcohol suggested a reduction in all-
cause mortality (844,414 participants,
RR 0.87; 95% CI: 0.83, 0.92)
Coffee displayed a dose-response
relationship for reduced all-cause
mortality (941,247 participants, RR
0.96; 95% CI: 0.94, 0.97).
Dairy products such as butter, yoghurt,
cheese, milk were not significantly
associated with mortality.
Increased nut intake was associated
with lower all-cause mortality (819,448
participants, RR 0.78; 95% CI: 0.72,
0.84). Specifically tree nuts (202,751
participants, RR 0.82; 95% CI: 0.75,
0.90) and peanuts (265,252 participants,
RR 0.77; 95% CI: 0.69, 0.86).
Cardiovascular Disease
A dose-response relationship existed for
whole grain bread (177,389 participants,
RR 0.87; 95% CI: 0.80, 0.95), whole
grain breakfast cereals (206,200
participants, RR 0.84; 95% CI: 0.78,
0.90), bran (118,085 participants, RR
0.85; 95% CI: 0.79, 0.90), and fibre
(1,279,690 participants, RR 0.91; 95%
CI: 0.88, 0.94)
Inverse associations were seen for red
meat (1,319,147 participants, RR 1.15;
95% CI: 1.05, 1.26), and processed
meat (1,186,761 participants, RR 1.24;
95% CI: 1.09, 1.40).
Supplementary material Heart
doi: 10.1136/heartjnl-2019-315499–731.:724 106 2020;Heart, et al. Butler T

Only raw vegetables displayed a dose-
response association of benefit (451,151
participants, RR 0.86; 95% CI: 0.81,
0.90).
Comparing the highest and lowest
consumption of alcohol showed an
inverse association with risk of CVD
(1,184,974 participants, RR 0.75; 95%
CI: 0.70, 0.80).
Yogurt, cheese, milk and butter showed
no evidence of a dose–response
association for benefit or harm with
CVD
Nut intake was associated with reduced
risk of CVD (376,228 participants, RR
0.79; 95% CI: 0.70, 0.88). Specifically
tree nuts (130,987 participants, RR
0.75; 95% CI: 0.67, 0.84) and peanuts
(265,252 participants, RR 0.64; 95% CI:
0.50, 0.81).
Olive oil showed a dose-response with
reduced CVD risk (476,714
participants, RR 0.82; 95% CI: 0.70,
0.96).
Comparing highest and lowest
consumers, increased soy consumption
was associated with lower risk of CVD
(718,279 participants, RR 0.83; 95% CI:
0.75, 0.93).
A dose-response relationship existed for
chocolate intake (per 20g/week) and
reduced CVD risk (369,599
participants, RR 0.982; 95% CI: 0.972,
0.992)
Summary
In this comprehensive review of
systematic reviews and meta analyses
key foods from specific food groups
show differential associations with
all-cause mortality and CVD.
Current evidence suggests that
specifically green leafy
Supplementary material Heart
doi: 10.1136/heartjnl-2019-315499–731.:724 106 2020;Heart, et al. Butler T

vegetables/salad is strongly associated
with reduced all-cause mortality, and
foods such as yoghurt, butter, cheese,
show no association. This review also
highlights significant associations
between processed meat and all-cause
mortality, but not with red or white
meat, or eggs. Foods that appear
harmful include processed meat and
tinned fruit for all-cause mortality
and processed meat and red meat for
CVD.
Park et al.[13]
355 participants assessed for eligible
235 excluded
120 participants randomized (40 to
each arm)
21 dropped out
40 included in ITT analysis
Protein intake of 0.8 g/kg/d
Age: 76.83 ± 3.86 years
Men: 40%
Weight: 58.73 ± 9.71 kg
BMI: 24.16 ± 33.82 kg/m2
ASM*: 15.19 ± 3.10 kg
ASM height2: 6.19 ± 0.79 kg/m2
ASM/weight: 26.00 ± 3.99 %
ASM/BMI: 0.64 ± 0.16
ASM:fat ratio: 1.08 ± 0.46
CHS Score: 1.70 ± 0.83
Frailty status 13%
Hypertension: 55%
Hyperlipidaemia: 18 %
Diabetes: 28 %
Osteoporosis: 18 %
Arthritis: 5 %
MNA Score: 20.04 ± 2.40
Protein intake of 1.2 g/kg/d
Age: 77.30 ± 3.67 years
Men: 35%
Weight: 59.73 ± 9.98 kg
BMI: 24.36 ± 3.04kg/m2
ASM: 15.53 ± 3.56 kg
ASM height2: 6.29 ± 0.93 kg/m2
ASM/weight: 26.03 ± 3.89 %
Randomised, double-blind, placebo-
controlled trial
12 week duration
Randomised to 1 of 3 interventions:
Protein intake of 0.8 g/kg/d
Protein intake of 1.2 g/kg/d
Protein intake of 1.5 g/kg/d
All participants were asked to maintain usual
diet and exercise.
Participants were provided with 5 x 10 g
packs containing placebo (9.6 g
maltodextrin) or protein powders (9.3 g whey
protein).
Baseline
Protein intake of 0.8 g/kg/d
1233.49 ± 296.31 kcal/d, carbohydrates
202.19 ± 49.36 g/d, total fat 26.61 ± 12.21
g/d, protein 48.36 ± 15.54 g/d, protein 0.84 ±
0.28 g/kg, MNA score 20.04 ± 2.40
Protein intake of 1.2 g/kg/d
1216.28 ± 290.01 kcal/d, carbohydrates
203.52 ± 47.97 g/d, total fat 26.55 ± 11.41
g/d, protein 45.18 ± 12.73 g/d, protein 0.77 ±
0.24 g/kg, MNA score 20.69 ± 2.11
Protein intake of 1.5 g/kg/d
1224.43 ± 263.03 kcal/d, carbohydrates
204.60 ± 39.02 g/d, total fat 23.38 ± 9.37 g/d,
Primary outcome: muscle mass as measured by dual-
energy X-ray absorptiometry (DEXA). Secondary
outcome measure was frailty.
1 screening visit and 3 visits at weeks 0 (baseline), 6, and
12.
Cardiovascular Health study (CHS), frailty criteria, the
Mini Nutritional Assessment (MNA), demographic and
medical information, BMI, and 3-d dietary intake were
measured during screening.
Medical and clinical information, KLoSHA frailty
criteria, the timed up-and-go (TUG) test, and
hematologic and urinary measurements were assessed at
weeks 0, 6 and 12. Muscle mass measured at weeks 0
and 12.
3-d dietary intake and adverse effects were assessed at
weeks 2, 4, 6, 8, 10, and 12.
Post intervention ASM indicators were
significantly (P<0.05) higher in the 1.5
g protein/kg/d then in the 0.8 g/kg/d
group
Protein intakes were higher in the 1.2
g/kg/d and 1.5 g/kg/d. Carbohydrate
intake was higher in 0.8 g/kg/d protein
group. There were no differences in fat
intake between groups.
Gait speed was significantly higher in
the 1.5 g/kg/d group vs. 0.8 g/kg/d
group. There was no difference between
0.8 g/kg/d and 1.2 g/kg/d.
Only blood urea nitrogen was
significantly increased by protein intake
of 1.2 and 1.5 g/kg/d compared with
protein intake of 0.8 g/kg/d at weeks 6
and 12
Summary
Protein intake high in leucine (whey)
leads to improvements in muscle and
physical performance in elderly
subjects with some cardiovascular
risk factors.
Including a variety of plant and
animal proteins (especially rich in
leucine) may help preserve muscle
mass in aging individuals.
Supplementary material Heart
doi: 10.1136/heartjnl-2019-315499–731.:724 106 2020;Heart, et al. Butler T

ASM/BMI: 0.64 ± 0.14
ASM:fat ratio: 1.08 ± 0.57
CHS Score: 1.78 ± 0.89
Frailty status 20%
Hypertension: 70%
Hyperlipidaemia: 25 %
Diabetes: 45 %
Osteoporosis: 5 %
Arthritis: 13 %
MNA Score: 20.69 ± 2.11
Protein intake of 1.5 g/kg/d
Age: 76.80 ± 3.70 years
Men: 30%
Weight: 56.28 ± 8.67 kg
BMI: 23.65 ± 2.53 kg/m2
ASM: 14.19 ± 2.78 kg
ASM height2: 5.93 ± 0.71 kg/m2
ASM/weight: 25.19 ± 2.74 %
ASM/BMI: 0.60 ± 0.11
ASM:fat ratio: 0.98 ± 0.49
CHS Score: 1.93 ± 0.94
Frailty status 30%
Hypertension: 58%
Hyperlipidaemia: 20 %
Diabetes: 23%
Osteoporosis: 18%
Arthritis: 13 %
MNA Score: 20.89 ± 1.93
* appendicular skeletal muscle mass
protein 44.84 ± 11.58 g/d, protein 0.80 ± 0.21
g/kg, MNA score 20.89 ± 1.93
12 weeks
Protein intake of 0.8 g/kg/d
1470.02 ± 343.40 kcal/d, carbohydrates
248.68 ± 54.30 g/d, total fat 24.43 ± 11.36
g/d, protein 52.28 ± 21.83 g/d, protein 0.90 ±
0.38 g/kg, MNA score 23.10 ± 2.76
Protein intake of 1.2 g/kg/d
1392.22 ± 277.22 kcal/d, carbohydrates
215.70 ± 39.19 g/d, total fat 22.74 ± 9.65 g/d,
protein 69.91 ± 16.98 g/d, protein 1.18 ± 0.23
g/kg, MNA score 23.91 ± 2.51
Protein intake of 1.5 g/kg/d
1386.21 ± 272.23 kcal/d, carbohydrates
214.80 ± 44.42 g/d, total fat 19.05 ± 8.11 g/d,
protein 76.36 ± 16.69 g/d, protein 1.37 ± 0.26
g/kg, MNA score 24.11 ± 2.25
Seidelmann et
al.[15]
Total participants: n 15,428
Q1
Participants: n 3086
Age: 53.7±5.7 years
Men: 53%
BMI: 28.0±0.1 kg/m2
Current smoker: 33%
Former smoker: 35%
Never smoker: 32%
High blood pressure: 35%
Diabetes: 13%
Ethnicity: 76% white, 24% Black,
<1% Asian, <1% Native American
Highest exercise activity: 15%
Prospective cohort study and meta-analysis
Participants taken from the Atherosclerosis
Risk in Communities (ARIC) study.
Participants based on quintiles of total energy
from carbohydrate
Q1: 1558 ± 11 kcal/d, carbohydrates 37 ±
5.7% total energy, animal fat 26.3 ± 0.1 %
total energy, plant fat 12.5 ± 0.1 % total
energy, animal protein 16.9 ± 0.1 % total
energy, plant protein 3.9 ± 0.02 % total
energy), dietary fibre 13.5 ± 0.1 g/d.
Glycaemic index 71.8 ± 0.1, Glycaemic load
100.6 ± 1.1
Primary outcome was all-cause mortality
Diet data collected using a 66-item semi-quantitative
FFQ at visit 1 and visit 3. The Harvard Nutrient Database
was used to derive nutrient intakes from the FFQ
responses.
Participants examined at follow-up visits, with the
second visit occurring between 1990 and 1992, the third
between 1993 and 1995, the fourth between 1996 and
1998, the fifth between 2011 and 2013, and the sixth
between 2016 and 2017.
Models adjusted for age, race and gender, ARIC test
centre, total energy consumption, diabetes, cigarette
smoking, physical activity, income level and education
Median follow-up of 25 years, with
6283 deaths occurring.
Participants in lower carbohydrate
quartiles had higher prevalence of
diabetes, exercised less, had higher
BMI, and smoking.
Significant U-shaped association
between carbohydrate intake and risk of
mortality (P<0.0001). Intake of 50-
55% energy had lowest risk but
carbohydrate intakes of 30% energy had
highest risk (HR 1.37; 95% CI: 1.16,
1.63). Risk was also increased in those
consuming >65% energy from
Supplementary material Heart
doi: 10.1136/heartjnl-2019-315499–731.:724 106 2020;Heart, et al. Butler T
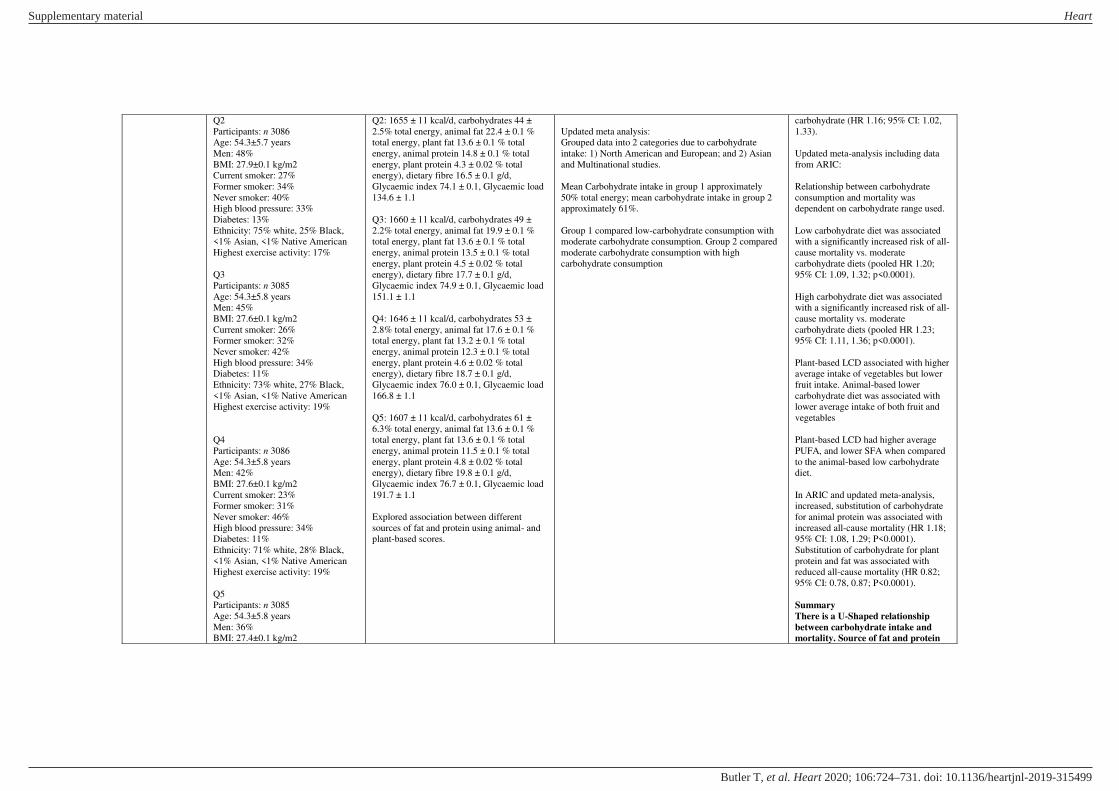
Q2
Participants: n 3086
Age: 54.3±5.7 years
Men: 48%
BMI: 27.9±0.1 kg/m2
Current smoker: 27%
Former smoker: 34%
Never smoker: 40%
High blood pressure: 33%
Diabetes: 13%
Ethnicity: 75% white, 25% Black,
<1% Asian, <1% Native American
Highest exercise activity: 17%
Q3
Participants: n 3085
Age: 54.3±5.8 years
Men: 45%
BMI: 27.6±0.1 kg/m2
Current smoker: 26%
Former smoker: 32%
Never smoker: 42%
High blood pressure: 34%
Diabetes: 11%
Ethnicity: 73% white, 27% Black,
<1% Asian, <1% Native American
Highest exercise activity: 19%
Q4
Participants: n 3086
Age: 54.3±5.8 years
Men: 42%
BMI: 27.6±0.1 kg/m2
Current smoker: 23%
Former smoker: 31%
Never smoker: 46%
High blood pressure: 34%
Diabetes: 11%
Ethnicity: 71% white, 28% Black,
<1% Asian, <1% Native American
Highest exercise activity: 19%
Q5
Participants: n 3085
Age: 54.3±5.8 years
Men: 36%
BMI: 27.4±0.1 kg/m2
Q2: 1655 ± 11 kcal/d, carbohydrates 44 ±
2.5% total energy, animal fat 22.4 ± 0.1 %
total energy, plant fat 13.6 ± 0.1 % total
energy, animal protein 14.8 ± 0.1 % total
energy, plant protein 4.3 ± 0.02 % total
energy), dietary fibre 16.5 ± 0.1 g/d,
Glycaemic index 74.1 ± 0.1, Glycaemic load
134.6 ± 1.1
Q3: 1660 ± 11 kcal/d, carbohydrates 49 ±
2.2% total energy, animal fat 19.9 ± 0.1 %
total energy, plant fat 13.6 ± 0.1 % total
energy, animal protein 13.5 ± 0.1 % total
energy, plant protein 4.5 ± 0.02 % total
energy), dietary fibre 17.7 ± 0.1 g/d,
Glycaemic index 74.9 ± 0.1, Glycaemic load
151.1 ± 1.1
Q4: 1646 ± 11 kcal/d, carbohydrates 53 ±
2.8% total energy, animal fat 17.6 ± 0.1 %
total energy, plant fat 13.2 ± 0.1 % total
energy, animal protein 12.3 ± 0.1 % total
energy, plant protein 4.6 ± 0.02 % total
energy), dietary fibre 18.7 ± 0.1 g/d,
Glycaemic index 76.0 ± 0.1, Glycaemic load
166.8 ± 1.1
Q5: 1607 ± 11 kcal/d, carbohydrates 61 ±
6.3% total energy, animal fat 13.6 ± 0.1 %
total energy, plant fat 13.6 ± 0.1 % total
energy, animal protein 11.5 ± 0.1 % total
energy, plant protein 4.8 ± 0.02 % total
energy), dietary fibre 19.8 ± 0.1 g/d,
Glycaemic index 76.7 ± 0.1, Glycaemic load
191.7 ± 1.1
Explored association between different
sources of fat and protein using animal- and
plant-based scores.
Updated meta analysis:
Grouped data into 2 categories due to carbohydrate
intake: 1) North American and European; and 2) Asian
and Multinational studies.
Mean Carbohydrate intake in group 1 approximately
50% total energy; mean carbohydrate intake in group 2
approximately 61%.
Group 1 compared low-carbohydrate consumption with
moderate carbohydrate consumption. Group 2 compared
moderate carbohydrate consumption with high
carbohydrate consumption
carbohydrate (HR 1.16; 95% CI: 1.02,
1.33).
Updated meta-analysis including data
from ARIC:
Relationship between carbohydrate
consumption and mortality was
dependent on carbohydrate range used.
Low carbohydrate diet was associated
with a significantly increased risk of all-
cause mortality vs. moderate
carbohydrate diets (pooled HR 1.20;
95% CI: 1.09, 1.32; p<0.0001).
High carbohydrate diet was associated
with a significantly increased risk of all-
cause mortality vs. moderate
carbohydrate diets (pooled HR 1.23;
95% CI: 1.11, 1.36; p<0.0001).
Plant-based LCD associated with higher
average intake of vegetables but lower
fruit intake. Animal-based lower
carbohydrate diet was associated with
lower average intake of both fruit and
vegetables
Plant-based LCD had higher average
PUFA, and lower SFA when compared
to the animal-based low carbohydrate
diet.
In ARIC and updated meta-analysis,
increased, substitution of carbohydrate
for animal protein was associated with
increased all-cause mortality (HR 1.18;
95% CI: 1.08, 1.29; P<0.0001).
Substitution of carbohydrate for plant
protein and fat was associated with
reduced all-cause mortality (HR 0.82;
95% CI: 0.78, 0.87; P<0.0001).
Summary
There is a U-Shaped relationship
between carbohydrate intake and
mortality. Source of fat and protein
Supplementary material Heart
doi: 10.1136/heartjnl-2019-315499–731.:724 106 2020;Heart, et al. Butler T
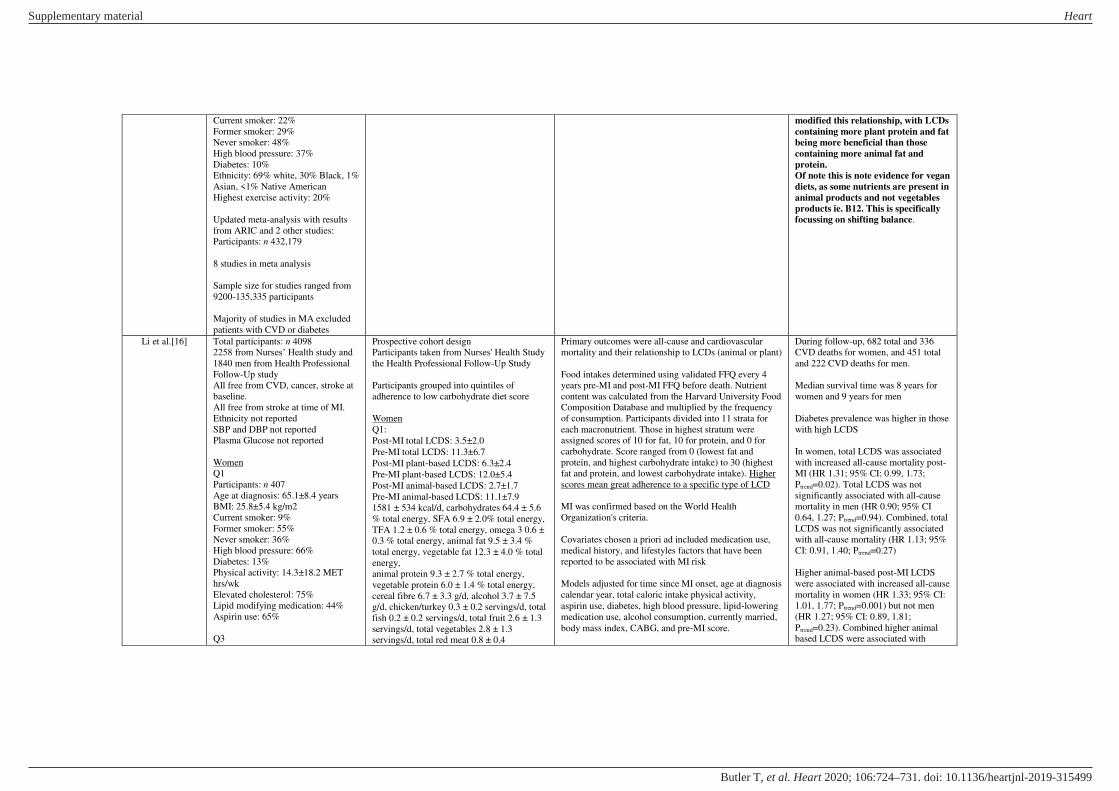
Current smoker: 22%
Former smoker: 29%
Never smoker: 48%
High blood pressure: 37%
Diabetes: 10%
Ethnicity: 69% white, 30% Black, 1%
Asian, <1% Native American
Highest exercise activity: 20%
Updated meta-analysis with results
from ARIC and 2 other studies:
Participants: n 432,179
8 studies in meta analysis
Sample size for studies ranged from
9200-135,335 participants
Majority of studies in MA excluded
patients with CVD or diabetes
modified this relationship, with LCDs
containing more plant protein and fat
being more beneficial than those
containing more animal fat and
protein.
Of note this is note evidence for vegan
diets, as some nutrients are present in
animal products and not vegetables
products ie. B12. This is specifically
focussing on shifting balance.
Li et al.[16] Total participants: n 4098
2258 from Nurses’ Health study and
1840 men from Health Professional
Follow-Up study
All free from CVD, cancer, stroke at
baseline.
All free from stroke at time of MI.
Ethnicity not reported
SBP and DBP not reported
Plasma Glucose not reported
Women
Q1
Participants: n 407
Age at diagnosis: 65.1±8.4 years
BMI: 25.8±5.4 kg/m2
Current smoker: 9%
Former smoker: 55%
Never smoker: 36%
High blood pressure: 66%
Diabetes: 13%
Physical activity: 14.3±18.2 MET
hrs/wk
Elevated cholesterol: 75%
Lipid modifying medication: 44%
Aspirin use: 65%
Q3
Prospective cohort design
Participants taken from Nurses' Health Study
the Health Professional Follow-Up Study
Participants grouped into quintiles of
adherence to low carbohydrate diet score
Women
Q1:
Post‐MI total LCDS: 3.5±2.0
Pre‐MI total LCDS: 11.3±6.7
Post‐MI plant‐based LCDS: 6.3±2.4
Pre‐MI plant‐based LCDS: 12.0±5.4
Post‐MI animal‐based LCDS: 2.7±1.7
Pre‐MI animal‐based LCDS: 11.1±7.9
1581 ± 534 kcal/d, carbohydrates 64.4 ± 5.6
% total energy, SFA 6.9 ± 2.0% total energy,
TFA 1.2 ± 0.6 % total energy, omega 3 0.6 ±
0.3 % total energy, animal fat 9.5 ± 3.4 %
total energy, vegetable fat 12.3 ± 4.0 % total
energy,
animal protein 9.3 ± 2.7 % total energy,
vegetable protein 6.0 ± 1.4 % total energy,
cereal fibre 6.7 ± 3.3 g/d, alcohol 3.7 ± 7.5
g/d, chicken/turkey 0.3 ± 0.2 servings/d, total
fish 0.2 ± 0.2 servings/d, total fruit 2.6 ± 1.3
servings/d, total vegetables 2.8 ± 1.3
servings/d, total red meat 0.8 ± 0.4
Primary outcomes were all-cause and cardiovascular
mortality and their relationship to LCDs (animal or plant)
Food intakes determined using validated FFQ every 4
years pre-MI and post-MI FFQ before death. Nutrient
content was calculated from the Harvard University Food
Composition Database and multiplied by the frequency
of consumption. Participants divided into 11 strata for
each macronutrient. Those in highest stratum were
assigned scores of 10 for fat, 10 for protein, and 0 for
carbohydrate. Score ranged from 0 (lowest fat and
protein, and highest carbohydrate intake) to 30 (highest
fat and protein, and lowest carbohydrate intake). Higher
scores mean great adherence to a specific type of LCD
MI was confirmed based on the World Health
Organization's criteria.
Covariates chosen a priori ad included medication use,
medical history, and lifestyles factors that have been
reported to be associated with MI risk
Models adjusted for time since MI onset, age at diagnosis
calendar year, total caloric intake physical activity,
aspirin use, diabetes, high blood pressure, lipid‐lowering
medication use, alcohol consumption, currently married,
body mass index, CABG, and pre‐MI score.
During follow-up, 682 total and 336
CVD deaths for women, and 451 total
and 222 CVD deaths for men.
Median survival time was 8 years for
women and 9 years for men
Diabetes prevalence was higher in those
with high LCDS
In women, total LCDS was associated
with increased all-cause mortality post-
MI (HR 1.31; 95% CI: 0.99, 1.73;
Ptrend=0.02). Total LCDS was not
significantly associated with all-cause
mortality in men (HR 0.90; 95% CI
0.64, 1.27; Ptrend=0.94). Combined, total
LCDS was not significantly associated
with all-cause mortality (HR 1.13; 95%
CI: 0.91, 1.40; Ptrend=0.27)
Higher animal-based post-MI LCDS
were associated with increased all-cause
mortality in women (HR 1.33; 95% CI:
1.01, 1.77; Ptrend=0.001) but not men
(HR 1.27; 95% CI: 0.89, 1.81;
Ptrend=0.23). Combined higher animal
based LCDS were associated with
Supplementary material Heart
doi: 10.1136/heartjnl-2019-315499–731.:724 106 2020;Heart, et al. Butler T
Participants: n 491
Age at diagnosis: 64.9±8.4 years
BMI: 26.6±5.2 kg/m2
Current smoker: 9%
Former smoker: 59%
Never smoker: 32%
High blood pressure: 69%
Diabetes: 21%
Physical activity: 14.7±16.9 MET
hrs/wk
Elevated cholesterol: 72%
Lipid modifying medication: 52%
Aspirin use: 62%
Q5
Participants: n 424
Age at diagnosis: 64.4±8.6 years
BMI: 28.2±5.9 kg/m2
Current smoker: 16%
Former smoker: 57%
Never smoker: 27%
High blood pressure: 72%
Diabetes: 36%
Physical activity: 12.4±17.4 MET
hrs/wk
Elevated cholesterol: 78%
Lipid modifying medication: 48%
Aspirin use: 61%
Men
Q1
Participants: n 410
Age at diagnosis: 66.0±9.0 years
BMI: 25.3±3.4 kg/m2
Current smoker: 12%
Former smoker: 49%
Never smoker: 39%
High blood pressure: 54%
Diabetes: 8%
Physical activity: 35.6±34.0 MET
hrs/wk
Elevated cholesterol: 67%
Lipid modifying medication: 51%
Aspirin use: 84%
Q3
servings/d, high-fat dairy 1.1 ± 0.9
servings/d, low-fat dairy 1.1 ± 0.8 servings/d
Q3:
Post‐MI total LCDS: 13.4±1.1
Pre‐MI total LCDS: 15.2±6.8
Post‐MI plant‐based LCDS: 13.9±0.8
Pre‐MI plant‐based LCDS: 14.6±5.2
Post‐MI animal‐based LCDS: 13.0±1.4
Pre‐MI animal‐based LCDS: 15.7±7.2
1628 ± 515 kcal/d, carbohydrates 53.9 ± 4.1
% total energy, SFA 9.0 ± 2.3% total energy,
TFA 1.4 ± 0.6 % total energy, omega 3 0.7 ±
0.3 % total energy, animal fat 13.3 ± 4.0 %
total energy, vegetable fat 14.5 ± 4.8 % total
energy, animal protein 12.8 ± 3.3 % total
energy, vegetable protein 5.8 ± 1.3 % total
energy, cereal fibre 6.3 ± 2.9 g/d, alcohol 4.6
± 9.3 g/d, chicken/turkey 0.4 ± 0.2
servings/d, total fish 0.3 ± 0.2 servings/d,
total fruit 2.4 ± 1.2 servings/d, total
vegetables 2.9 ± 1.2 servings/d, total red
meat 1.0 ± 0.5 servings/d, high-fat dairy 1.2
± 0.9 servings/d, low-fat dairy 1.1 ± 0.8
servings/d
Q5:
Post‐MI total LCDS: 24.0±2.6
Pre‐MI total LCDS: 19.3±6.9
Post‐MI plant‐based LCDS: 22.0±2.2
Pre‐MI plant‐based LCDS: 17.7±5.2
Post‐MI animal‐based LCDS: 25.5±2.5
Pre‐MI animal‐based LCDS: 19.8±7.3
1607 ± 536 kcal/d, carbohydrates 43.2 ± 5.7
% total energy, SFA 12.0 ± 2.5 % total
energy, TFA 1.2 ± 0.7 % total energy, omega
3 0.9 ± 0.4 % total energy, animal fat 19.3 ±
5.4 % total energy, vegetable fat 17.0 ± 6.2 %
total energy, animal protein 15.5 ± 3.8 %
total energy, vegetable protein 5.2 ± 1.2 %
total energy, cereal fibre 5.2 ± 2.7 g/d,
alcohol 3.6 ± 7.2 g/d, chicken/turkey 0.4 ±
0.2 servings/d, total fish 0.3 ± 0.2 servings/d,
total fruit 2.4 ± 1.2 servings/d, total
vegetables 2.9 ± 1.2 servings/d, total red
meat 1.1 ± 0.6 servings/d, high-fat dairy 1.4
± 1.1 servings/d, low-fat dairy 0.9 ± 0.9
servings/d
For women, additional adjustments were made for
postmenopausal hormone use status, and smoking.
For men, additional adjustments were made for heart
failure, LVEF, acute therapy during hospitalization
(received either angioplasty or thrombolytics, or none),
and smoking.
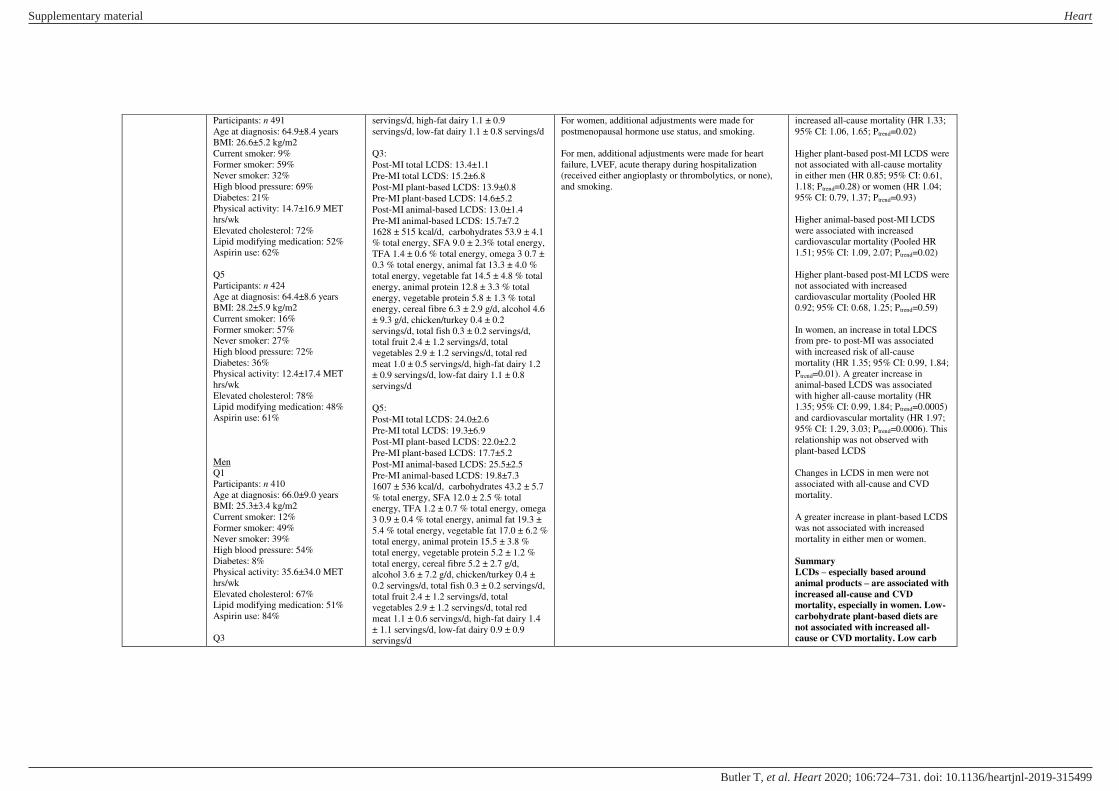
increased all-cause mortality (HR 1.33;
95% CI: 1.06, 1.65; Ptrend=0.02)
Higher plant-based post-MI LCDS were
not associated with all-cause mortality
in either men (HR 0.85; 95% CI: 0.61,
1.18; Ptrend=0.28) or women (HR 1.04;
95% CI: 0.79, 1.37; Ptrend=0.93)
Higher animal-based post-MI LCDS
were associated with increased
cardiovascular mortality (Pooled HR
1.51; 95% CI: 1.09, 2.07; Ptrend=0.02)
Higher plant-based post-MI LCDS were
not associated with increased
cardiovascular mortality (Pooled HR
0.92; 95% CI: 0.68, 1.25; Ptrend=0.59)
In women, an increase in total LDCS
from pre- to post-MI was associated
with increased risk of all-cause
mortality (HR 1.35; 95% CI: 0.99, 1.84;
Ptrend=0.01). A greater increase in
animal-based LCDS was associated
with higher all-cause mortality (HR
1.35; 95% CI: 0.99, 1.84; Ptrend=0.0005)
and cardiovascular mortality (HR 1.97;
95% CI: 1.29, 3.03; Ptrend=0.0006). This
relationship was not observed with
plant-based LCDS
Changes in LCDS in men were not
associated with all-cause and CVD
mortality.
A greater increase in plant-based LCDS
was not associated with increased
mortality in either men or women.
Summary
LCDs – especially based around
animal products – are associated with
increased all-cause and CVD
mortality, especially in women. Low-
carbohydrate plant-based diets are
not associated with increased all-
cause or CVD mortality. Low carb
Supplementary material Heart
doi: 10.1136/heartjnl-2019-315499–731.:724 106 2020;Heart, et al. Butler T

Participants: n 382
Age at diagnosis: 66.1±9.1 years
BMI: 26.61±3.7 kg/m2
Current smoker: 11%
Former smoker: 52%
Never smoker: 37%
High blood pressure: 56%
Diabetes: 17%
Physical activity: 32.9±48.7 MET
hrs/wk
Elevated cholesterol: 64%
Lipid modifying medication: 56%
Aspirin use: 84%
Q5
Participants: n 321
Age at diagnosis: 66.1±9.3 years
BMI: 26.8±3.8 kg/m2
Current smoker: 16%
Former smoker: 58%
Never smoker: 26%
High blood pressure: 47%
Diabetes: 24%
Physical activity: 32.1±38.5 MET
hrs/wk
Elevated cholesterol: 65%
Lipid modifying medication: 47%
Aspirin use: 79%
Men
Q1:
Post‐MI total LCDS: 4.1±2.2
Pre‐MI total LCDS: 12.2±7.3
Post‐MI plant‐based LCDS: 6.9±2.2
Pre‐MI plant‐based LCDS: 12.2±5.0
Post‐MI animal‐based LCDS: 2.4±1.7
Pre‐MI animal‐based LCDS: 11.2±7.9
2006 ± 632 kcal/d, carbohydrates 64.1 ± 6.1
% total energy, SFA 6.2 ± 2.0 % total energy,
TFA 1.2 ± 0.7 % total energy, omega 3 0.6 ±
0.3 % total energy, animal fat 8.0 ± 3.2 %
total energy, vegetable fat 13.1 ± 4.3 % total
energy,
animal protein 9.0 ± 2.7 % total energy,
vegetable protein 6.5 ± 1.6 % total energy,
cereal fibre 9.5 ± 4.1 g/d, alcohol 8.1 ± 12.3
g/d, chicken/turkey 0.4 ± 0.2 servings/d, total
fish 0.3 ± 0.2 servings/d, total fruit 3.2 ± 1.5
servings/d, total vegetables 3.5 ± 1.6
servings/d, total red meat 0.7 ± 0.5
servings/d, high-fat dairy 0.9 ± 0.8
servings/d, low-fat dairy 1.1 ± 0.8 servings/d
Q3
Post‐MI total LCDS: 12.4±1.1
Pre‐MI total LCDS: 15.4±6.3
Post‐MI plant‐based LCDS: 14.0±0.8
Pre‐MI plant‐based LCDS: 15.2±4.9
Post‐MI animal‐based LCDS: 13.0±1.4
Pre‐MI animal‐based LCDS: 15.3±7.0
1880 ± 595 kcal/d, carbohydrates 53.8 ± 4.2
% total energy, SFA 8.2 ± 2.2 % total energy,
TFA 1.4 ± 0.6 % total energy, omega 3 0.8 ±
0.4 % total energy, animal fat 12.1 ± 3.6 %
total energy, vegetable fat 14.6 ± 4.9 % total
energy,
animal protein 12.5 ± 3.3 % total energy,
vegetable protein 6.0 ± 1.3 % total energy,
cereal fibre 8.5 ± 3.7 g/d, alcohol 9.4 ± 12.8
g/d, chicken/turkey 0.4 ± 0.2 servings/d, total
fish 0.4 ± 0.3 servings/d, total fruit 2.6 ± 1.3
servings/d, total vegetables 3.3 ± 1.4
servings/d, total red meat 1.0 ± 0.5
servings/d, high-fat dairy 1.1 ± 1.0
servings/d, low-fat dairy 1.3 ± 1.0 servings/d
can be interpreted differently, and
care should be given to exploring if
they are based around animal or
plant products
Supplementary material Heart
doi: 10.1136/heartjnl-2019-315499–731.:724 106 2020;Heart, et al. Butler T

Q5
Post‐MI total LCDS: 24.3±2.7
Pre‐MI total LCDS: 19.9±6.3
Post‐MI plant‐based LCDS: 21.8±2.6
Pre‐MI plant‐based LCDS: 17.9±5.3
Post‐MI animal‐based LCDS: 24.8±2.8
Pre‐MI animal‐based LCDS: 20.3±6.7
1927 ± 658 kcal/d, carbohydrates 41.1 ± 6.2
% total energy, SFA 11.7 ± 2.7 % total
energy, TFA 1.8 ± 0.7 % total energy, omega
3 0.8 ± 0.6 % total energy, animal fat 19.5 ±
6.0 % total energy, vegetable fat 17.2 ± 6.1 %
total energy,
animal protein 15.2 ± 3.7 % total energy,
vegetable protein 5.2 ± 1.4 % total energy,
cereal fibre 6.0 ± 2.5 g/d, alcohol 8.9 ± 11.4
g/d, chicken/turkey 0.4 ± 0.3 servings/d, total
fish 0.3 ± 0.2 servings/d, total fruit 2.0 ± 1.2
servings/d, total vegetables 3.0 ± 1.4
servings/d, total red meat 1.5 ± 0.8
servings/d, high-fat dairy 1.4 ± 1.3
servings/d, low-fat dairy 1.1 ± 1.0 servings/d
Li et al.[17]
Total participants: n 4098
2258 from Nurses’ Health study
(NHS) and 1840 men from Health
Professional Follow-Up study
(HPFS)
All free from CVD, cancer, stroke at
baseline.
All free from stroke at time of MI.
Ethnicity not reported
SBP and DBP not reported
Plasma Glucose not reported
Women
Q1
Participants: n 433
Age at diagnosis: 64.5±8.8 years
BMI: 26.3±5.4 kg/m2
Current smoker: 24%
Former smoker: 51%
Never smoker: 25%
High blood pressure: 67%
Diabetes: 19%
Physical activity: 9.4±13.5 MET
hrs/wk
Elevated cholesterol: 71%
Lipid modifying medication: 42%
Prospective cohort design
Participants taken from Nurses' Health Study
the Health Professional Follow-Up Study
Grouped on quintiles of fibre intake (g/d)
Women
Q1
Post‐MI fibre intake: 12.4±2.0 g/d
Pre‐MI fibre intake: 14.0±4.6 g/d
1619 ± 538 kcal/d, SFA 11.1 ± 3.2 % total
energy, TFA 1.8 ± 0.8 % total energy, omega
3 0.7 ± 0.3 % total energy,
alcohol 6.0 ± 12.8 g/d, cereal fibre 4.0 ± 1.7
g/d, fruit fibre 1.3 ± 0.6 g/d, legume fibre 0.2
± 0.1 g/d
Q3
Post‐MI fibre intake: 19.2±0.8 g/d
Pre‐MI fibre intake: 17.5±4.6 g/d
1637 ± 526 kcal/d, SFA 9.2 ± 2.3 % total
energy, TFA 1.5 ± 0.5 % total energy, omega
3 0.7 ± 0.3 % total energy, g/d, alcohol 4.3 ±
9.1 g/d, cereal fibre 5.9 ± 2.2 g/d, fruit fibre
4.0 ± 0.64 g/d, legume fibre 1.0 ± 0.1 g/d
Primary outcomes of all-cause and cardiovascular
mortality
MI was confirmed according to symptoms plus either
diagnostic electrocardiographic changes or increased
levels of cardiac enzymes, including cardiac specific
troponin
Diet intakes assessed using a validated FFQ every 4
years from 1976-2006 for NHS and from 1986-2006 for
HPFS.
Covariates chosen a priori and included medication use,
medical history, and lifestyles factors. In HPFS, also
considered clinical characteristics such as ST elevation
MI (Y/N), site of MI, type or revascularisation, LVEF,
initial creatinine levels, and HF during hospital stay
(Y/N)
Models adjusted for time since MI onset, age at
diagnosis, calendar year. total caloric intake, physical
activity, aspirin use, diabetes, high blood pressure, use of
lipid lowering drugs, alcohol consumption, SFA intake,
n3 fatty acid intake, TFA intake, married, BMI, CABG,
folate intake, and pre-MI intake.
Median follow-up post MI was 8.7
years for women and 9.0 years for me.
682 total and 336 cardiovascular deaths
for women, and 451 total and 222
cardiovascular deaths for men.
In basic models (adjusted for age and
time since MI) higher post-MI fibre
intake was associated with lower all-
cause mortality in both men and women
(HR 0.63; 95% CI: 0.47, 0.86;
Ptrend=0.0008, and HR 0.50; 95% CI:
0.39, 0.64; Ptrend=<0.0001,
respectively).
Adjustment for lifestyle characteristics
attenuated these associations although
combined HR showed association (HR
0.75; 95% CI: 0.58, 0.97; Ptrend=0.03). A
similar relationship was observed
between post-MI fibre intake and
cardiovascular mortality, with addition
of lifestyle factors attenuating any
significant association.
Supplementary material Heart
doi: 10.1136/heartjnl-2019-315499–731.:724 106 2020;Heart, et al. Butler T

Aspirin use: 61%
Q3
Participants: n 437
Age at diagnosis: 64.9±8.5 years
BMI: 27.6±6.2 kg/m2
Current smoker: 9%
Former smoker: 61%
Never smoker: 30%
High blood pressure: 74%
Diabetes: 27%
Physical activity: 13.4±18.4 MET
hrs/wk
Elevated cholesterol: 80%
Lipid modifying medication: 50%
Aspirin use: 62%
Q5
Participants: n 457
Age at diagnosis: 65.1±8.2 years
BMI: 26.3±5.2 kg/m2
Current smoker: 4%
Former smoker: 58%
Never smoker: 38%
High blood pressure: 70%
Diabetes: 24%
Physical activity: 20.1±20.8 MET
hrs/wk
Elevated cholesterol: 79%
Lipid modifying medication: 55%
Aspirin use: 64%
Men
Q1
Participants: n 367
Age at diagnosis: 65.8±9.5 years
BMI: 26.4±3.7 kg/m2
Current smoker: 9%
Former smoker: 54%
Never smoker: 28%
High blood pressure: 59%
Diabetes: 13%
Physical activity: 25.9±33.6 MET
hrs/wk
Elevated cholesterol: 68%
Lipid modifying medication: 48%
Aspirin use: 78%
Q5
Post‐MI fibre intake: 28.7±4.4 g/d
Pre‐MI fibre intake: 22.2±6.6 g/d
1592 ± 518 kcal/d, SFA 7.0 ± 2.1 % total
energy, TFA 1.0 ± 0.5 % total energy, omega
3 0.8 ± 0.4 % total energy, alcohol 2.9 ± 5.4
g/d, cereal fibre 8.4 ± 4.0 g/d, fruit fibre 8.7 ±
2.6 g/d, legume fibre 3.4 ± 1.6 g/d
Men
Q1
Post‐MI fibre intake: 16.0±2.4 g/d
Pre‐MI fibre intake: 17.3±4.9 g/d
1878 ± 620 kcal/d, SFA 10.8 ± 3.0 % total
energy, TFA 1.8 ± 0.8 % total energy, omega
3 0.7 ± 0.5 % total energy,
alcohol 13.4 ± 17.1 g/d, cereal fibre 5.3 ± 2.1
g/d, fruit fibre 1.8 ± 0.7 g/d, legume fibre 0.4
± 0.3 g/d
Q3
Post‐MI fibre intake: 24.4±1.0 g/d
Pre‐MI fibre intake: 22.3±5.6 g/d
1946 ± 646 kcal/d, SFA 8.8 ± 2.4 % total
energy, TFA 1.5 ± 0.6 % total energy, omega
3 0.7 ± 0.3 % total energy,
alcohol 9.1 ± 12.3 g/d, cereal fibre 7.8 ± 2.8
g/d, fruit fibre 5.1 ± 0.5 g/d, legume fibre 1.7
± 0.2 g/d
Q5
Post‐MI fibre intake: 37.0±5.8 g/d
Pre‐MI fibre intake: 27.8±8.3 g/d
1925 ± 621 kcal/d, SFA 6.1 ± 2.0 % total
energy, TFA 0.9 ± 0.5 % total energy, omega
3 0.9 ± 0.5 % total energy,
alcohol 6.3 ± 10.3 g/d, cereal fibre 11.2 ± 4.8
g/d, fruit fibre 11.4 ± 3.5 g/d, legume fibre
5.3 ± 2.1 g/d
For women, additional adjustments were made for
postmenopausal hormone use status, and smoking
For men, additional adjustments were made for heart
failure, LVEF, acute therapy during hospitalization
(received either angioplasty or thrombolytics, or none),
and smoking.
Pooled HR of 0.85 (95% CI: 0.74, 0.97)
for all-cause mortality for a 10 g/d
increase in intake.
Only cereal fibre was inversely
associated with lower all-cause and
cardiovascular mortality (pooled HR
0.73; 95% CI: 0.58, 0.91 and pooled HR
0.72; 95% CI: 0.52, 0.99, respectively).
No association was observed for fruit or
legume fibre.
Pre-MI fibre was not associated with
post-MI all-cause mortality (pooled HR
1.17; 95% CI: 0.92, 1.48) and
cardiovascular mortality (pooled HR
1.10; 95% CI 0.77, 1.55).
In fully adjusted models a greater
increase in fibre intake from pre to post-
MI was associated with significantly
lower all-cause mortality in women (HR
0.64; 95% CI 0.48, 0.86; Ptrend=0.005),
but not men. The pooled HR was 0.69
(95% CI: 0.55, 0.87; Ptrend=0.002)
suggesting increasing fibre intake from
pre- to post-MI was beneficial.
In both men and women, an increase in
fibre intake from pre- to post MI was
associated with lower cardiovascular
mortality (HR 0.65; 95% CI 0.42, 0.99;
Ptrend=0.09 and 0.65; 95% CI: 0.39,1.08;
Ptrend=0.04)
Summary
Overall this study showed a modest
association between intake of fibre
post MI lower all-cause and
cardiovascular mortality, and that in
those individuals who increased their
fibre intake the most saw greater
benefit. This relationship appeared to
be driven by cereal fibre.
Supplementary material Heart
doi: 10.1136/heartjnl-2019-315499–731.:724 106 2020;Heart, et al. Butler T

Q3
Participants: n 373
Age at diagnosis: 66.1±8.9 years
BMI: 26.1±3.6 kg/m2
Current smoker: 4%
Former smoker: 52%
Never smoker: 36%
High blood pressure: 58%
Diabetes: 13%
Physical activity: 37.0±54.0 MET
hrs/wk
Elevated cholesterol: 63%
Lipid modifying medication: 57%
Aspirin use: 82%
Q5
Participants: n 358
Age at diagnosis: 66.1±8.9 years
BMI: 25.6±3.7 kg/m2
Current smoker: 1%
Former smoker: 47%
Never smoker: 41%
High blood pressure: 50%
Diabetes: 15%
Physical activity: 40.4±35.0 MET
hrs/wk
Elevated cholesterol: 64%
Lipid modifying medication: 50%
Aspirin use: 81%
Zhang et al.[18]
Potentially relevant records: 343
236 articles excluded based on title
Full texts assessed for eligibility: 109
Excluded 92 due to duplicates, 1 not
published, 28 not relevant outcomes,
6 comments/editorials, 4 review/meta
analysis
Articles in final meta-analysis: 17 (19
prospective cohort studies)
Total number of participants in
analysis: 1,041,962
6 studies reported whole grain, 11
studies reported whole grain foods.
Meta-analysis of prospective cohort studies
examining whole grain foods or diets on total
mortality, cardiovascular mortality, and
cancer mortality, and cardiovascular risk
factors in healthy people or those with
cardiovascular disease
Articles sourced from Pubmed and Web of
Science till January 2016
Quality of evidence was assessed using
Strengthening the Reporting of Observational
Studies in Epidemiology (STROBE).
Publication bias assessed using Begg’s Test
Inclusion criteria were:
Primary outcomes were all-cause mortality, CVD
mortality, and cancer mortality
Additional factors extracted included participants’ age
and sex, definition of whole grain or whole grain
products, methods for whole grain assessment,
confounders adjusted for in the analysis, whole grain
intake in each category, type of intake (whole grain
products or whole grain), RR and 95% CIs in each
category. Data on dietary changes or BMI not extracted.
For the outcome of total mortality there
were 661,752and 84,646 deaths.
9 studies reported on total mortality.
Pooled RR comparing highest and
lowest categories of intake was 0.84
(95% CI: 0.81, 0.88).
Subgroup analysis suggested the inverse
association between whole grain and
mortality was stronger in women (RR
0.85; 95% CI: 0.81, 0.89) than men (RR
0.90; 95% CI: 0.85, 0.95), and in studies
with a follow-up of 15-20 years (RR
0.75; 95% CI: 0.67, 0.84).
Each 28 g/d serving of wholegrain
associated with 9% reduction in in risk
Supplementary material Heart
doi: 10.1136/heartjnl-2019-315499–731.:724 106 2020;Heart, et al. Butler T

11 studies from America, 7 from
Europe, and 1 from the
Mediterranean area.
All used FFQ for assessing dietary
intake
Studies must be prospective cohort studies,
report effect on risk of all-cause and/or
cause-specific mortality, report RR, HR and
95% CI.
of all-cause mortality (pooled RR 0.91;
95% CI: 0.90, 0.93).
For the outcome of CVD mortality,
there were 595,585 participants and
23,482 deaths.
8 studies reported on cardiovascular
mortality. Pooled RR comparing highest
and lowest categories of intake was 0.83
(95% CI: 0.80, 0.87).
Each 28 g/d serving of wholegrain
associated with 14% reduction in in risk
of cardiovascular mortality (pooled RR
0.86 95% CI: 0.83, 0.89).
Summary
Data form prospective cohort studies
suggest increased wholegrain
consumption is associated with lower
all-cause and CVD mortality.
Kelly et al.[19] Potentially relevant records: 15,283
After duplicates: 11,104
Full-texts assessed for eligibility: 414
Excluded 401 due to inappropriate
articles (not wholegrain, not RCT,
intervention < 12 weeks, not relevant
comparison, macronutrient intake not
reported, not adults, ongoing studies)
Articles in final meta-analysis: 9
All studies were parallel RCTs
Total number of participants in
analysis: 1414
Interventions included oats (n=1),
range of foods based on wheat (n=5),
mixture of rye and wheat (n-1), whole
grain brown rice (n=1), and whole
grain wheat and oats (n=1).
In 7 studies the control diet was
described as refined. 1 study
described the control diet as usual
and 1 described control as white rice.
Meta-analysis of RCTs examining
wholegrain* foods or diets on total mortality,
cardiovascular events, and cardiovascular
risk factors in healthy people or those with
cardiovascular disease
Articles sourced from CENTRAL (2016),
MEDLINE (1946-August 2016), Embase
(1980-week 35 2016), CINHAL PLUS
(1937-August 2016), ClinicalTrials.gov, and
World Health Organization International
Clinical Trials Registry Platform (WHO
ICTRP)
Quality of evidence was assessed using
GRADE.
Study bias assessed using Cochrane ‘Risk of Bias’ tool
Inclusion criteria were:
Studies must be RCTs, including cross-over
and parallel-group designs.
Study duration needed to be at least 12
weeks. Participants ≥18 years, had raised lipids, BP, were overweight or obese, or had
MetS or DM.
Primary outcomes were total cardiovascular mortality,
Cardiovascular events (e.g. fatal and non‐fatal
myocardial infarction, unstable angina, coronary artery
bypass graft surgery, percutaneous transluminal coronary
angioplasty, stroke). Secondary outcomes were blood
lipids, blood pressure, quality of life, and adverse events.
Considered confounding variables such as bodyweight
and dietary fibre
Substantial variation in definition of
“wholegrain”
No studies reported effect of whole
grain on total cardiovascular mortality
or cardiovascular events
8 studies reported total cholesterol with
data from 7 being analysed. Pooled
analysis (722 participants) showed no
effect on total-cholesterol (MD 0.07;
95% CI: ‐0.07, 0.21). 1 study reported
medians and showed no difference in
TC between intervention and control. 1
study could not be combined due to
reporting of results as % change rather
than absolute values. In this study, TC
decreased by 5.4% in the intervention
vs. -2.9% in the control.
9 studies reported LDL-C, with data
from 7 being summarised. Pooled
analysis (770 participants) showed no
effect on LDL-C (MD 0.06; 95% CI: ‐0.05, 0.16). 1 study reported medians
and showed no difference in LDL-C
between intervention and control. 1
Supplementary material Heart
doi: 10.1136/heartjnl-2019-315499–731.:724 106 2020;Heart, et al. Butler T

3 studies included overweight or
obese participants, 2 included
participants with MetS, 1 included
participants with risk factors for
MetS, 1 included participants with a
BMI 18.5-35 kg/m2 or signs of MetS
or hypercholesterolaemia, 1 included
participants with MetS or DM
Foods were provided in 8/9 studies. 1
study gave participants information
regarding whole grain foods
Excluded studies that did not meet inclusion
criteria, or listed diabetes or changes in risk
factors (IGT, IR, glucose or insulin
outcomes, weight, BMI, and anthropometric
outcomes) if they did not also measure lipids
or blood pressure.
*wholegrain defined by authors as foods
based on milled wholegrains i.e. wholemeal
of oatmeal
study could not be combined due to
reporting of results as % change rather
than absolute values. In this study,
LDL-C decreased by 8.7% in the
intervention vs. 4.3% in the control.
8 studies reported HDL-C, with data
from 7 being summarised. Pooled
analysis (772 participants) showed no
effect on HDL-C (MD ‐0.02; 95% CI: -
0.05, 0.01
8 studies reported TAG, with data from
7 being summarised. Pooled analysis
(771 participants) showed no effect
(MD 0.03; 95% CI: ‐0.08, 0.13).
8 studies reported SBP, with data from
7 being summarised. Pooled analysis
(768 participants) showed no effect
(MD 0.04; 95% CI: ‐1.67, 1.75).
8 studies reported DBP, with data from
7 being summarised. Pooled analysis
(768 participants) showed no effect
(MD 0.16; 95% CI: ‐0.89, 1.21).
2 studies reported adverse events. 1
study showed similar events between
intervention and control and included
RTI, sinusitis, and pharyngitis). Events
considered to relate to the intervention
included nausea (2/77), flatulence
(2/77).
No studies reported QoL
Summary
Combined RCT data does not
support a clear role for wholegrains
in reducing CV risk factors, whereas
observation data does. Interpretation
of this is that single changes to
consume more wholegrains needs to
be as part of a whole dietary change.
Hooper et al.[20]
Potentially relevant records: 1459
Excluded 1327 records
Meta-analysis of RCTs examining effect of
reducing SFA intake and replacing it with
Primary outcomes were all-cause mortality,
cardiovascular mortality, and combined CVD events
There was no clear effect of reducing
SFA compared to usual or control diets
Supplementary material Heart
doi: 10.1136/heartjnl-2019-315499–731.:724 106 2020;Heart, et al. Butler T
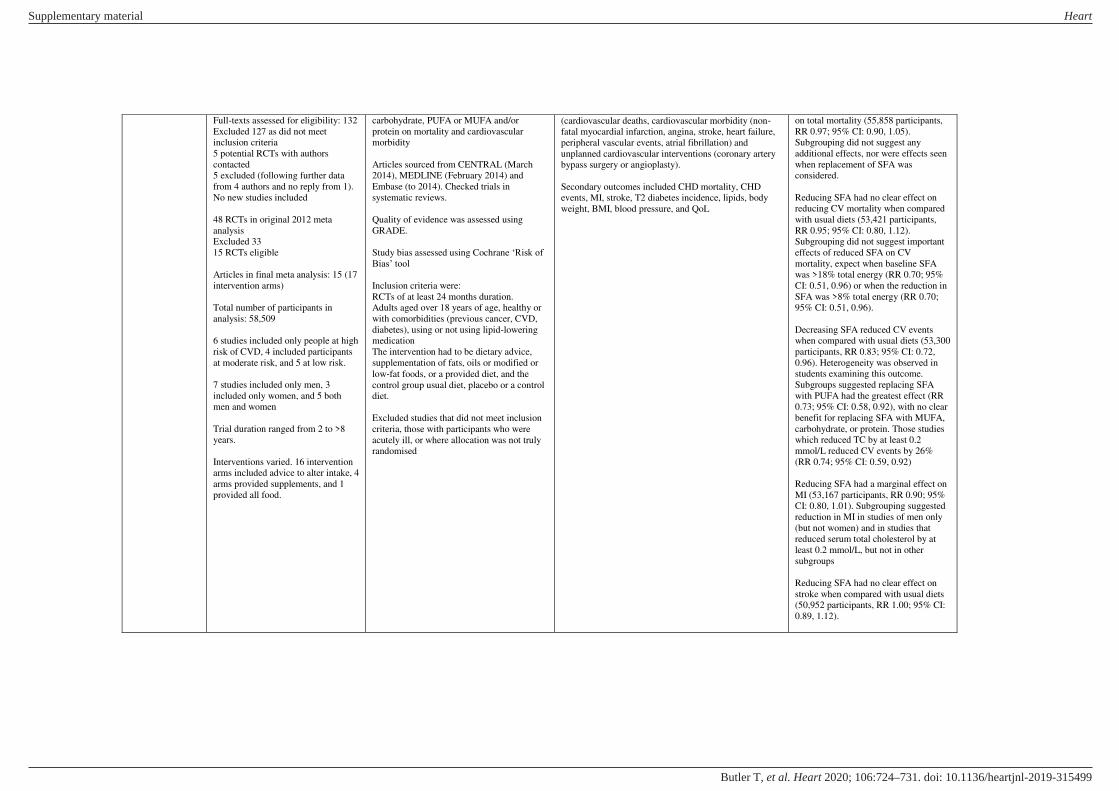
Full-texts assessed for eligibility: 132
Excluded 127 as did not meet
inclusion criteria
5 potential RCTs with authors
contacted
5 excluded (following further data
from 4 authors and no reply from 1).
No new studies included
48 RCTs in original 2012 meta
analysis
Excluded 33
15 RCTs eligible
Articles in final meta analysis: 15 (17
intervention arms)
Total number of participants in
analysis: 58,509
6 studies included only people at high
risk of CVD, 4 included participants
at moderate risk, and 5 at low risk.
7 studies included only men, 3
included only women, and 5 both
men and women
Trial duration ranged from 2 to >8
years.
Interventions varied. 16 intervention
arms included advice to alter intake, 4
arms provided supplements, and 1
provided all food.
carbohydrate, PUFA or MUFA and/or
protein on mortality and cardiovascular
morbidity
Articles sourced from CENTRAL (March
2014), MEDLINE (February 2014) and
Embase (to 2014). Checked trials in
systematic reviews.
Quality of evidence was assessed using
GRADE.
Study bias assessed using Cochrane ‘Risk of Bias’ tool
Inclusion criteria were:
RCTs of at least 24 months duration.
Adults aged over 18 years of age, healthy or
with comorbidities (previous cancer, CVD,
diabetes), using or not using lipid-lowering
medication
The intervention had to be dietary advice,
supplementation of fats, oils or modified or
low‐fat foods, or a provided diet, and the
control group usual diet, placebo or a control
diet.
Excluded studies that did not meet inclusion
criteria, those with participants who were
acutely ill, or where allocation was not truly
randomised
(cardiovascular deaths, cardiovascular morbidity (non‐fatal myocardial infarction, angina, stroke, heart failure,
peripheral vascular events, atrial fibrillation) and
unplanned cardiovascular interventions (coronary artery
bypass surgery or angioplasty).
Secondary outcomes included CHD mortality, CHD
events, MI, stroke, T2 diabetes incidence, lipids, body
weight, BMI, blood pressure, and QoL
on total mortality (55,858 participants,
RR 0.97; 95% CI: 0.90, 1.05).
Subgrouping did not suggest any
additional effects, nor were effects seen
when replacement of SFA was
considered.
Reducing SFA had no clear effect on
reducing CV mortality when compared
with usual diets (53,421 participants,
RR 0.95; 95% CI: 0.80, 1.12).
Subgrouping did not suggest important
effects of reduced SFA on CV
mortality, expect when baseline SFA
was >18% total energy (RR 0.70; 95%
CI: 0.51, 0.96) or when the reduction in
SFA was >8% total energy (RR 0.70;
95% CI: 0.51, 0.96).
Decreasing SFA reduced CV events
when compared with usual diets (53,300
participants, RR 0.83; 95% CI: 0.72,
0.96). Heterogeneity was observed in
students examining this outcome.
Subgroups suggested replacing SFA
with PUFA had the greatest effect (RR
0.73; 95% CI: 0.58, 0.92), with no clear
benefit for replacing SFA with MUFA,
carbohydrate, or protein. Those studies
which reduced TC by at least 0.2
mmol/L reduced CV events by 26%
(RR 0.74; 95% CI: 0.59, 0.92)
Reducing SFA had a marginal effect on
MI (53,167 participants, RR 0.90; 95%
CI: 0.80, 1.01). Subgrouping suggested
reduction in MI in studies of men only
(but not women) and in studies that
reduced serum total cholesterol by at
least 0.2 mmol/L, but not in other
subgroups
Reducing SFA had no clear effect on
stroke when compared with usual diets
(50,952 participants, RR 1.00; 95% CI:
0.89, 1.12).
Supplementary material Heart
doi: 10.1136/heartjnl-2019-315499–731.:724 106 2020;Heart, et al. Butler T

Reducing SFA did not suggest any
benefit on CHD mortality when
compared to usual diets (53,159
participants, RR 0.98; 95% CI: 0.84,
1.15)
Reducing SFA may decreased the risk
of CHD events (53,199 participants, RR
0.87; 95% CI: 0.74, 1.03).
Heterogeneity was high between
studies, and partly explained by the
degree of SFA at baseline and the level
of cholesterol lower achieved
There was no clear benefit of reducing
SFA on the diagnosis of diabetes
(48,835 participants, RR 0.96; 95% CI:
0.90, 1.02).
Compared with usual diet, reducing
SFA decreased TC (7115 participants,
MD ‐0.24 mmol/L; 95% CI: ‐0.36, ‐0.13, Peffect 0.0001) and LDL-C (3291
participants, MD ‐0.19 mmol/L; 95%
CI: ‐0.33, ‐0.05, Peffect 0.006).
Decreasing SFA had no clear effect on
HDL-C (5174 participants, MD ‐0.01
mmol/L, 95% CI: ‐0.02 to 0.01, Peffect
0.21) or TAG (3845 participants, MD ‐0.08 mmol/L; 95% CI: ‐0.21, 0.04, Peffect
0.20).
There was no clear effect of SFA on
TC/HDL-C ratio (2985 participants,
MD ‐0.10; 95% CI: ‐0.33, 0.13, Peffect
0.40), LDL-C/HDL-C ratio (50
participants, MD ‐0.36; 95% CI: ‐0.92,
0.20), Lp(a) (28,820 participants, MD
0.00; 95% CI: ‐0.00, 0.00, Peffect 1.00),
or HOMA (2832 participants, MD ‐0.00; 95% CI: ‐0.04, 0.04, Peffect 1.00).
Reducing SFA intake decreased glucose
when compared to usual diets (249
participants, MD ‐1.69 mmol/L; 95%
CI: ‐2.55, ‐0.82, Peffect 0.0001).
Supplementary material Heart
doi: 10.1136/heartjnl-2019-315499–731.:724 106 2020;Heart, et al. Butler T

Reducing SFA intake resulted in small
reductions in body weight (4541
participants, MD ‐1.97 kg; 95% CI: ‐3.67, ‐0.27, and BMI (5553 participants,
MD ‐0.50; 95% CI: ‐0.82, ‐0.19)
Summary
This study suggests reducing SFA has
no effect on total mortality. Reducing
SFA and replacing with PUFA had
the greatest effect on CV events.
Replacing with protein, MUFA or
carbohydrate did not have any effect.
Some of these effects are mediated by
the level of SFA consumed initially,
and the level of cholesterol reduction
achieved. The ideal type of
unsaturated fat to replace SFA with is
unclear.
Zhuang et al.[21]
Total participants: n 617,119
567,169 complete questionnaires
satisfactorily.
Excluded duplicates, individuals
moving out of state, and those who
died before study entry
Final sample: n 521,120 participants
for analysis
Quintile of Saturated Fat Intake
Q1
Age: 63.2 years
Male: 55.2%
Race: 89.6% White, 4.3% Black,
2.2% Hispanic, 2.2% Asian
BMI: 25.1 kg/m2
Current smoker: 6.7%
Physical activity (>5 times/wk):
27.4%
History of Hypercholesterolaemia:
22.6%
History of hypertension: 24.3%
Heart Disease: 18.8%
Stroke: 2.1%
Cancer: 8.9%
Diabetes: 6.1%
Fair or poor health: 10.6%
Daily aspirin use: 18.7%
Prospective cohort design.
Participants taken from National Institutes of
Health-American Association of Retired
Persons Diet and Health Study
Participants enrolled between1995-1996 with
16 years follow up
Grouped on quintiles of dietary fat intake
Quintile of Saturated Fat Intake
Q1:
1545.1 kcal/d, total fat 20.5 % total energy,
SFA 5.8 % total energy, MUFA 7.5 % total
energy, PUFA 5.2 % total energy, TFA 1.3 %
total energy, total protein 14.7 % total
energy, omega-3 0.6 % total energy, ALA
0.5 % total energy, marine omega-3 0.04 %
total energy, omega-6 4.6 % total energy, LA
4.5 % total energy, AA 0.04 % total energy,
omega-6/omega 3 ratio 8.2, alcohol 2.6 g/d
Q3:
1683.4 kcal/d, total fat 30.6 % total energy,
SFA 9.2 % total energy, MUFA 11.7 % total
energy, PUFA 4 7.1 % total energy, TFA 2.1
% total energy, total protein 15.5 % total
energy, omega-3 0.7 % total energy, ALA 0.6
% total energy, marine omega-3 0.04 % total
energy, omega-6 6.4 % total energy, LA 6.3
Primary outcomes were total mortality and
cardiovascular mortality
Diet measured at baseline using validated 124 item FFQ
+ Diet History Questionnaire. Total energy intake was
also calculated based on the Continuing Survey of Food
Intakes by Individual.
Sub study 2 non-consecutive 24 hr recall baseline
(validation)
Models adjusted age and sex, race, marital status, BMI,
education, household income, smoking status, physical
activity, alcohol consumption, history of hypertension,
history of hypercholesterolaemia, perceived health
condition, history of heart disease, stroke, diabetes,
cancer at baseline, multivitamin use, aspirin use,
hormones for women, total energy and energy from
protein and other fatty acids.
Evaluated effect of replacing SFA with other types of fat
Mortality determined from annual linkage to Social
Security administration Death Master File
>99% follow-up rate for mortality
Cause of death was determined by annual linkage to
National Death Index Plus classified into 22 categories-
9/10th ICD-9 and 10
During a follow-up of 16 years
(7,307,097 person-years), 129,328
deaths (85,037 in the men and 44, 291
in the women) were documented
Dietary intakes of SFAs and TFAs
positively associated with total
mortality in multivariable fully adjusted
models.
When substituting for carbohydrates,
those in the highest quintile of SFA
intake had the highest rate of total
mortality when compared against the
lowest quintile (HR 1.29; 95% CI: 1.25,
1.33; Ptrend<0.0001)
PUFA intake was inversely associated
with total mortality (HR 0.93; 95% CI:
0.91, 0.95; Ptrend<0.0001)
Each 1 SD increment of energy as
PUFA related to a 2% lower total
mortality.
Animal MUFA was correlated with
higher total mortality (HR 1.09; 95%
CI: 1.06, 1.13; Ptrend<0.0001) whereas
Supplementary material Heart
doi: 10.1136/heartjnl-2019-315499–731.:724 106 2020;Heart, et al. Butler T

Q3
Age: 62.8 years
Male: 59.3%
Race: 91.6% White, 3.9% Black,
1.9% Hispanic, 1.1 % Asian
BMI: 26.6 kg/m2
Current smoker: 10.4%
Physical activity (>5 times/wk):
17.6%
History of Hypercholesterolaemia:
26.1%
History of hypertension: 23.8%
Heart Disease: 13.3%
Stroke: 2.0%
Cancer: 9.0%
Diabetes: 9.4%
Fair or poor health: 12.7%
Daily aspirin use: 14.4%
Q5
Age: 62.6
Male: 61.5%
Race: 93.9% White, 2.7% Black,
1.3% Hispanic, 0.5% Asian
BMI: 27.1 kg/m2
Current smoker: 19.7%
Physical activity (>5 times/wk):
14.1%
History of Hypercholesterolaemia:
29.7%
History of hypertension: 21.6%
Heart Disease: 10.8%
Stroke: 2.2%
Cancer: 9.2%
Diabetes: 11.5%
Fair or poor health: 15.9%
Daily aspirin use: 12.0%
Quintile of PUFA Intake
Q1
Age: 62.8 years
Male: 61.5%
Race: 90.8% White, 3.2% Black,
2.6% Hispanic, 1.6% Asian
BMI: 25.8 kg/m2
Current smoker: 10.6%
Physical activity (>5 times/wk):
23.1%
% total energy, AA 0.05 % total energy,
omega-6/omega 3 ratio 9.0, alcohol 1.9 g/d
Q5:
1874.5 kcal/d, total fat 38.6 % total energy,
SFA 13.2 % total energy, MUFA 14.4 %
total energy, PUFA 7.5% total energy, TFA
2.4 % total energy, total protein 15.5 % total
energy, omega-3 0.8 % total energy, ALA 0.7
% total energy, marine omega-3 0.04 % total
energy, omega-6 6.7 % total energy, LA 6.6
% total energy, AA 0.05 % total energy,
omega-6/omega 3 ratio 8.4, alcohol 1.3 g/d
Quintile of PUFA Intake
Q1:
1638.8 kcal/d, total fat 21.2 % total energy,
SFA 6.9 % total energy, MUFA 7.9 % total
energy, PUFA 4.5 % total energy, TFA 1.4 %
total energy, total protein 14.9 % total
energy, omega-3 0.5 % total energy, ALA
0.4 % total energy, marine omega-3 0.03 %
total energy, omega-6 3.9 % total energy, LA
3.9 % total energy, AA 0.04 % total energy,
omega-6/omega 3 ratio 7.7, alcohol 2.9 g/d
Q3:
1704.8 kcal/d, total fat 30.2 % total energy,
SFA 9.3 % total energy, MUFA 11.5 % total
energy, PUFA 6.8 % total energy, TFA 2.1 %
total energy, total protein 15.7 % total
energy, omega-3 0.7 % total energy, ALA 0.6
% total energy, marine omega-3 0.04 % total
energy, omega-6 6.0 % total energy, LA 6.0
% total energy, AA 0.05 % total energy,
omega-6/omega 3 ratio 8.80, alcohol 1.9 g/d
Q5:
1697.1 kcal/d, total fat 38.0 % total energy,
SFA 10.5 % total energy, MUFA 14.3 %
total energy, PUFA 9.8 % total energy, TFA
2.5 % total energy, total protein 14.9 % total
energy, omega-3 1.0 % total energy, ALA 0.9
% total energy, marine omega-3 0.04 % total
energy, omega-6 8.8 % total energy, LA 8.8
% total energy, AA 0.05 % total energy,
omega-6/omega 3 ratio 9.3, alcohol 1.2 g/d
Sensitivity analysis excluding existing CVD at baseline
done to exclude reverse causality observed similar
results.
plant MUFA was inversely associated
with total mortality (HR 0.94; 95% CI:
0.91, 0.97; Ptrend<0.0004)
Comparing highest vs. lowest quintiles
of intake, increased SFA was associated
with increased CVD (HR 1.27; 95% CI:
1.21, 1.34; Ptrend<0.0001)
Each 1 SD increment in SFA was
related to 7% higher CVD mortality.
Total MUFA was not significantly
associated CVD, although animal
MUFA was inversely associated with
CVD mortality (HR 1.09; 95% CI: 1.03,
1.16; Ptrend=0.0015). Plant MUFA was
associated with lower CVD mortality
(HR 0.94; 95% CI: 0.89, 0.99;
Ptrend=0.015).
Comparing highest vs. lowest quintiles
of intake, increased TFA was associated
with increased CVD (HR 1.06; 95% CI:
1.03, 1.16; Ptrend<0.0001)
Comparing highest vs. lowest quintiles
of intake, increased PUFA intake was
associated with decreased CVD
mortality (HR 0.94; 95% CI: 0.90, 0.98;
Ptrend=0.0074)
Total omega-3 intake was not
associated with CVD mortality. Higher
intakes of omega-3 were associated
with lower CVD mortality (HR 0.90;
95% CI: 0.87, 0.94; Ptrend=<0.0001).
Total omega-6 was inversely associated
with CVD mortality. Higher intakes of
LA were associated with lower CVD
mortality (HR 0.92; 95% CI: 0.87, 0.98;
Ptrend=0.0038). Higher intake of AA was
associated with increased CVD
mortality (HR 1.11 95% CI: 1.06-1.16).
In isocaloric substitution analysis,
replacing 2% energy from SFA with
Supplementary material Heart
doi: 10.1136/heartjnl-2019-315499–731.:724 106 2020;Heart, et al. Butler T

History of Hypercholesterolaemia:
25.8%
History of hypertension: 23.3%
Heart Disease: 15.4%
Stroke: 2.2%
Cancer: 8.9%
Diabetes: 6.2%
Fair or poor health: 11.8%
Daily aspirin use: 16.1%
Q3
Age: 62.8 years
Male: 59.8%
Race: 92.6% White, 3.3% Black,
2.6% Hispanic, 1.0% Asian
BMI: 26.5 kg/m2
Current smoker: 11.1%
Physical activity (>5 times/wk):
18.5%
History of Hypercholesterolaemia:
26.1%
History of hypertension: 23.4%
Heart Disease: 13.8%
Stroke: 2.0%
Cancer: 8.9%
Diabetes: 9.1%
Fair or poor health: 12.4%
Daily aspirin use: 14.8%
Q5
Age: 62.9 years
Male: 60.7%
Race: 91.0% White, 4.6% Black,
1.4% Hispanic, 1.3% Asian
BMI: 26.6 kg/m2
Current smoker: 14.0%
Physical activity (>5 times/wk):
16.6%
History of Hypercholesterolaemia:
26.5%
History of hypertension: 23.5%
Heart Disease: 12.9%
Stroke: 2.2%
Cancer: 9.4%
Diabetes: 12.2%
Fair or poor health: 15.0%
Daily aspirin use: 13.5%
Quintile of MUFA Intake
Q1:
1546.7 kcal/d, total fat 20.3 % total energy,
SFA 5.9 % total energy, MUFA 7.3 % total
energy, PUFA 4.8 % total energy, TFA 1.2 %
total energy, total protein 14.9 % total
energy, omega-3 0.5 % total energy, ALA
0.5 % total energy, marine omega-3 0.04 %
total energy, omega-6 4.2 % total energy, LA
4.1 % total energy, AA 0.03 % total energy,
omega-6/omega 3 ratio 7.8, alcohol 2.5 g/d
Q3:
1685.1 kcal/d, total fat 30.3 % total energy,
SFA 9.3 % total energy, MUFA 11.4 % total
energy, PUFA 6.8 % total energy, TFA 2.1 %
total energy, total protein 15.4 % total
energy, omega-3 0.7 % total energy, ALA 0.6
% total energy, marine omega-3 0.04 % total
energy, omega-6 6.1 % total energy, LA 6.0
% total energy, AA 0.05 % total energy,
omega-6/omega 3 ratio 8.7, alcohol 2.0 g/d
Q5:
1860.3 kcal/d, total fat 39.7 % total energy,
SFA 12.1 % total energy, MUFA 15.3 %
total energy, PUFA 8.9 % total energy, TFA
2.8 % total energy, total protein 15.5 % total
energy, omega-3 1.0 % total energy, ALA 0.8
% total energy, marine omega-3 0.04 % total
energy, omega-6 8.0 % total energy, LA 7.9
% total energy, AA 0.06 % total energy,
omega-6/omega 3 ratio 9.4, alcohol 1.1 g/d
TFA was associated with a 3% increase
in total and CVD mortality.
Replacing 5% energy from MUFA was
associated with a 16% and 13%
reduction in total and CVD mortality,
respectively.
Replacing 5% energy from SFA with
PUFA was associated with a 18% and
15% reduction in total and CVD
mortality, respectively. Isocaloric
replacement of SFA with ALA showed
not benefit on total and CVD mortality.
Replacing 0.1% energy from SFA with
EPA and DHA was associated with a
4% reduction in total and CVD
mortality.
Replacing 2% of energy from SFA with
omeage-6 PUFA was associated with
lower risk of total and CVD mortality
(0.92; 95% CI: 0.91, 0.93; p<0.0001
and 0.94; 95% CI: 0.92, 0.96; p<0.0001,
respectively). Replacing SFA with AA
increased mortality and CVD mortality.
Summary
In this large cohort, increased intake
of SFA, TFA and animal-MUFA was
associated with higher total and CVD
mortality. Greater intakes of plant
MUFAs, marine omega-3 PUFAs and
LA were associated with lower total
and CVD mortality.
Supplementary material Heart
doi: 10.1136/heartjnl-2019-315499–731.:724 106 2020;Heart, et al. Butler T

Quintile of MUFA intake
Q1
Age: 63.0 years
Male: 53.2%
Race: 90.3% White, 3.8% Black,
2.3% Hispanic, 1.9% Asian
BMI: 25.3 kg/m2
Current smoker: 7.4%
Physical activity (>5 times/wk):
27.0%
History of Hypercholesterolaemia:
24.3%
History of hypertension: 23.9%
Heart Disease: 17.3%
Stroke: 2.1%
Cancer: 9.1%
Diabetes: 6.0%
Fair or poor health: 10.4%
Daily aspirin use: 17.7%
Q3
Age: 62.9 years
Male: 58.9%
Race: 91.9% White, 3.7% Black,
1.8% Hispanic, 1.1% Asian
BMI: 26.5 kg/m2
Current smoker: 10.9%
Physical activity (>5 times/wk):
17.8%
History of Hypercholesterolaemia:
26.8%
History of hypertension: 23.5%
Heart Disease: 13.1%
Stroke: 2.0%
Cancer: 8.6%
Diabetes: 6.2%
Fair or poor health: 12.1%
Daily aspirin use: 14.4%
Q5
Age: 62.6 years
Male: 63.8%
Race: 92.8% White, 3.6% Black,
1.3% Hispanic, 0.8% Asian
BMI: 27.3 kg/m2
Current smoker: 17.8%
Physical activity (>5 times/wk):
14.2%
Supplementary material Heart
doi: 10.1136/heartjnl-2019-315499–731.:724 106 2020;Heart, et al. Butler T

History of Hypercholesterolaemia:
27.4%
History of hypertension: 22.8%
Heart Disease: 12.5%
Stroke: 2.3%
Cancer: 9.1%
Diabetes: 13.3%
Fair or poor health: 16.9%
Daily aspirin use: 13.1%
Hooper et al.[22]
Potentially relevant records: 20,846
Full-texts assessed for eligibility:
2155
Excluded 1216 full texts, abstracts
and trials registry entries
Excluded 192 trials due to duration
<52 weeks, intervention was not
omeaga-6, or did not collect data on
one key review outcome
Articles in final meta analysis: 19 (17
included in quantitative analysis) and
2 narratively.
Total number of participants in
analysis: 6461
Participants followed for one to eight
years.
10 studies recruited both men and
women, 10 trials included
participants at low risk of CVD, 3
trials included people at moderate
risk of CVD, and 5 included people
with existing CVD
Articles in final meta analysis: 193
(49 trials) included in quantitative
analysis.
Total number of participants in
analysis: 24,272
Participants followed for 1 to 4 years.
44 studies recruited both men and
women, 5 trials did not report sex of
participants
Meta-analysis of RCTs examining effect
omega-6 fats on total mortality,
cardiovascular events, CHD events, MACCE,
and stroke in healthy people or those with
CVD
Articles sourced from CENTRAL,
MEDLINE and Embase to May 2017,
Clinical trials.gov; WHO International trials
platform to Sept 2016. Checked trials in
systematic reviews.
Quality of evidence was assessed using
GRADE.
Study bias assessed using Cochrane ‘Risk of Bias’ tool
Inclusion criteria were:
RCTs of at least 12 months duration.
Higher versus lower omega 6 fat (including
LA, GLA, DGLA, AA or any combination).
Intervention had to be dietary
supplementation, a provided diet or dietary
advice with aim to increase or decrease
intake of omega-6 fats or dietary component
high in omega-6 fats e.g. sunflower oil if no
clear aim stated.
Intervention to achieve increase or decrease
by 10% of baseline omega 6 intake
Diet versus usual diet; no advice, no
supplementation or placebo, with lower
omega 6 intake.
Excluded studies which aimed to increase
omega 6 and 3.
Primary outcomes were all-cause mortality, CVD
mortality, CVD events (all available data on fatal and not
fatal MI; angina and/or stroke), CHD events (MI (fatal or
/non fatal) or angina, Major Adverse cardiac and
cerebrovascular events (where it was possible to assess
the numbers of participants experiencing fatal or non
fatal MI; unstable angina and stoke), Stroke (total, fatal
and non-fatal, ischaemic and haemorrhagic.
Secondary outcomes were Myocardial infarction (MI,
total, fatal and non-fatal), Angina, Sudden cardiac death,
Atrial fibrillation (AF) (new or recurrent, ventricular
tachycardia and/or ventricular fibrillation), Heart failure,
Revascularisation (angioplasty or coronary artery bypass
grafting), Peripheral arterial disease (PAD), Serum lipids
(including TC, fasting
TAGs, HDL-C, LDL-C), BMI, body weight and other
measures of adiposity
10 trials reported all-cause mortality
Pooled analysis (4506 participants)
showed no effect of higher vs. lower
intake of omega-6 on all-cause
mortality (RR 1.00; 95% CI: 0.88, 1.12)
None of the subgroup analysis
considering omega-6 type, intervention
type, energy replacement, primary or
secondary prevention of CVD, dose,
duration, statin use, baseline omega-6
intake or sex suggested important
differences in mortality between higher
or lower omega-6 fats and all-cause
mortality.
7 trials reported CVD mortality Pooled
analysis (4019 participants) showed no
effect of higher vs. lower intake of
omega-6 on CVD mortality (RR 1.09;
95% CI: 0.76, 1.55). Significant
heterogeneity was observed in these
studies with some showing protective
effects whilst others showing harm.
Subgrouping by primary or secondary
prevention of CVD did not suggest
important differences between
subgroups but did reduce heterogeneity
and suggested harmful effects of
omega‐6 fat in secondary prevention
trials (RR 1.28; 95% CI: 1.04, 1.57).
7 trials reported CVD events. Pooled
analysis (4962 participants) showed no
effect of higher vs. lower intake of
omega-6 on CVD events (RR 0.97; 95%
CI: 0.81, 1.15).This was not altered by
subgroup analysis.
Supplementary material Heart
doi: 10.1136/heartjnl-2019-315499–731.:724 106 2020;Heart, et al. Butler T

16 trials included participants with
existing CVD
13 trials provided 0.6 - <1% energy
from PUFA, 17 trials provided 1-
<2% energy, 8 trials gave 2-<5%
energy, and 11 trials gave ≥5% energy as PUFA.
Baseline omega-6 intake was <5%
energy in 3 trials, 5% to <8% in 3
trials, and at least 8% in 1 trial. 12
trials did not report baselines
omeaga-3 intake.
In the majority of studies (9), as LA
increased, SFA decreased. MUFA
decreased in 5, carbohydrate and
protein in 1, and carbohydrates in 1.
For 3 trials it was unclear what was
replaced in the diet.
7 trials reported CHD events. Pooled
analysis (3997 participants) showed no
effect of higher vs. lower intake of
omega-6 on CHD events (RR 0.88; 95%
CI: 0.66, 1.17). Where omega‐6 fat
replaced MUFA, there was an increased
risk of CHD events, while omega‐6 fat
replacing carbohydrates appeared to
reduce CHD event risk
2 trials reported MACCEs. Pooled
analysis (2879 participants) showed no
effect of higher vs. lower intake of
omega-6 on MACCEs (RR 0.84; 95%
CI: 0.59, 1.20).
4 trials reported stroke. Pooled analysis
(3730 participants) showed no effect of
higher vs. lower intake of omega-6 on
stoke (RR 1.36; 95% CI: 0.45, 4.11).
Studies were heterogeneous and CIs
very wide. In subgroup analysis
increasing omega-6 fat was protective in
primary prevention but not secondary
prevention.
7 trials reported MI. Pooled analysis
(4606 participants) showed increasing
omega-6 was associated with reduced
risk of MI (RR 0.88; 95% CI: 0.76,
1.02). Studies were heterogeneous and
CIs very wide. There were no
differences with subgroup analysis
10 trials suggested increased omega-6
fats reduces TC (4280 participants, MD
-0.33 mmol/L; 95% CI -0.50, -0.16).
5 trials indicated increasing omega-6
has no effect on TAG (834 participants,
MD -0.01 mmol/L; 95% CI: -0.23,
0.21), 4 trials showed no effect on
HDL-C (1995 participants, MD −0.01 mmol/L; 95% CI: −0.03, 0.02), and 2 trials showed no effect on LDL-C (MD
−0.04 mmol/L; 95% CI: −0.21, 0.14)
Supplementary material Heart
doi: 10.1136/heartjnl-2019-315499–731.:724 106 2020;Heart, et al. Butler T

Increasing omega-6 had little or no
effect on adiposity (based on BMI).
Summary
Low quality evidence suggests
increasing omega-6 fats may make no
difference to all-cause mortality,
CVD events, CVD mortality, CHD
events or stroke. Increasing omega 6
may reduce MI risk although this is
based on low quality evidence. High
quality evidence suggests increasing
omega-6 may lower TC but has no
effect on adiposity, LDL-C, HDL-C
or TAGs
Aung et al.[23]
Potentially relevant records: 41,406
Texts screened for CV endpoints: 983
Excluded 354 as not human or
clinical trial
Excluded 548 as study length <6
months
81 reports reviewed against inclusion
criteria
Excluded 73 due to sample size <500,
duration <1 year, and major vascular
outcomes <10 events
Articles in final meta-analysis: 10
All studies were parallel RCTs
Total number of participants in
analysis: 77,917
8 studies had double-blind design and
were placebo-controlled.
2 had open label design
61.4% of participants were men,
with a mean age at entry was 64 years
66.4% of participants had a prior
history of CHD, 28% had prior
stroke, and 37% had prior diabetes.
Meta-analysis of RCTs examining
association of omega-3 supplements with risk
of fatal and non-fatal CHD and major
vascular events
Articles sourced from PUBMED and
MEDLINE, plus hand searching of reference
lists review articles or previous meta
analyses.
Used PRISMA guidelines for the conduct of
meta analyses and RCTs. Not clear how bias
or quality was determined.
Inclusion criteria were:
Studies must be RCTs, including cross-over
and parallel-group designs.
Must be trials or marine-derived very long
chain omega-3 FA supplements vs. placebo
All required use of supplements but no
restrictions on EPA or DHA
Studies must be 1 year in duration
Must contain >500 participants
Primary outcomes included nonfatal MI; death caused by
CHD; ischemic, haemorrhagic, and unclassified stroke;
coronary or non-coronary arterial revascularization
events; major vascular events (a composite of first
occurrence of nonfatal MI or death caused by CHD;
nonfatal or fatal stroke; or any revascularization
procedure); and all-cause mortality. Deaths caused by
CHD included sudden cardiac deaths, deaths due to
ventricular arrhythmias, and heart failure in patients with
CHD, MI, or deaths occurring after coronary
revascularization or heart transplant.
Omega-3 supplementation had no
significant association with any CHD
event (RR 0.96; 95% CI: 0.90, 1.01;
P = 0.12), CHD death (RR 0.93; 95% CI: 0.83, 1.03; P =0.05), nonfatal MI
(RR, 0.97; 95% CI: 0.87, 1.08; P =0.40), major vascular events (RR 0.97; 95%
CI: 0.93, 1.01; P=0.10), stroke (RR
1.03; 95% CI: 0.93, 1.13; P=0.56), or
revascularisaztion events (RR 0.99;
95% CI: 0.94, 1.04; P=0.61)
Considering history of CHD, diabetes,
pre-treatment levels of cholesterol,
HDL-C, LDL-C, TAGs or prior use of
statin therapy, intake of omega 3
supplements in each subgroup had no
significant association with major
vascular events
Study design (open vs. blind) did not
influence lack of association between
omega-3 supplementation of non-fatal
MI, CHD death, or any CHD.
Omega-supplementation was not
associated with all-cause mortality (RR
0.96; 95% CI: 0.92, 1.01; P=0.16)
Summary
Supplementary material Heart
doi: 10.1136/heartjnl-2019-315499–731.:724 106 2020;Heart, et al. Butler T

9/10 trials used a combination of
EPA and DHA. EPA dose ranged
from 226-1800 mg/d and DHA
ranged from 0-1700 mg/d.
This meta-analysis of RCTs does not
support the use of omega-3
supplements for the prevention of
fatal CHD, nonfatal MI, stroke,
revascularization events, or any
major vascular events in those with
no or pre-existing CVD. Important
consideration is DOSE given
Bhatt et al.[24]
.
19,212 participants eligible
Excluded 11,033.
8179 participants randomized (40 to
each arm)
Randomised 1:1 to either placebo (n
4089) or intervention (n 4090).
Intervention
Age: 64 (57.0-69.0) years
Age ≥ 65 years: 45.4%
Male: 71.6%
White: 90.3%
BMI: 30.8 (27.8-34.5) kg/m2
BMI ≥ 30 kg/m2: 57.0%
CV risk category: 70.7% secondary;
29.3% primary
Ezetimibe use: 6.4%
Statin Intensity: 6.2% low, 61.9%
moderate, 31.5% high, 0.3% missing
Diabetes: 0.7% T1, 57.9% T2, no
diabetes 41.5%, missing 0%
hsCRP: 2.2 (1.1-4.5) mg/L
TAG: 2.4 (2.0-3.1) mmol/L
HDL-C: 1.0 (0.9-1.2) mmol/L
LDL-C: 1.9 (1.6-2.3) mmol/L
Prior Atherosclerotic Coronary
Artery Disease and Related
Morbidities: 58.4%
Prior Atherosclerotic Cerebrovascular
Disease and Related Morbidities:
15.7%
Prior Atherosclerotic Peripheral
Artery Disease: 9.5%
Prior Non-Atherosclerotic
Cardiovascular Disease: 89.2%
Prior Cardiac Arrhythmias: 5.6%
Prior Non-Cardiac/Non-
Atherosclerotic Vascular Disorders:
87.3%
Anti-diabetic medication: 53.6%
Randomised, double-blind, placebo-
controlled trial.
Eligible patients randomized in a 1:1 fashion
to either icosapent ethyl (2 g twice daily with
food) or matching placebo
Randomization was stratified by primary vs.
secondary prevention, use of ezetimibe, and
geographic region
Primary outcome was the total of first plus subsequent
ischaemic events consisting of the composite of
cardiovascular death, nonfatal myocardial infarction,
nonfatal stroke, coronary revascularization, or
hospitalization for unstable angina. Secondary endpoint
was hard MACE (defined as “cardiovascular death, nonfatal myocardial infarction, or nonfatal stroke”).
Follow-up visits continued at 4 and 12 months and
annually thereafter until approximately 1,612 primary
efficacy endpoint events occurred, after which patients
made a final end-of-study visit.
After a median follow-up of 4.9 years
there were 1,606 primary end point
events
Icosapent ethyl significantly reduced
rates of first occurrence of the primary
end point vs. placebo (HR 0.75; 95%
CI: 0.68, 0.83; p<0.0001).
Icosapent ethyl significantly reduced
rates of second occurrence of the
primary end point vs. placebo (HR 0.68;
95% CI: 0.60, 0.78; p<0.0001).
Total key secondary endpoint event
rates were significantly reduced to 32
from 44 per 1,000 patient-years for
icosapent ethyl versus placebo,
respectively (RR 0.72; 95% CI: 0.63,
0.82; p<0.0001)
Times to first, second, third or fourth
occurrence of the primary endpoint
were significantly reduced with
Icosapent ethyl
Summary
Icosapent ethyl is a derivative of
EPA. Recent studies have questioned
the role of omega-3 supplementation
in primary and secondary prevention
of CVD, and it is clear from these
that one of the issues has potentially
been the dose of EPA and DHA used.
REDUCE-IT used a dose of 4000
mg/d. This trial was also not focussed
on LDL-C. Ongoing trials such as
STRENGTH, RESPECT EPA, &
EVAPORATE will reveal more
information on the role of omega-3
supplementation and CVD.
Supplementary material Heart
doi: 10.1136/heartjnl-2019-315499–731.:724 106 2020;Heart, et al. Butler T

Anti-hypertensive medication: 95.3%
Anti-platelet medication: 79.7%
Anticoagulant: 9.4%
No antithrombotic: 14.3%
ACEi: 51.7%
ARB: 27.1%
Beta blocker: 71.0%
Placebo
Age: 64 (57.0-69.0) years
Age ≥ 65 years: 46.6%
Male: 70.8%
White: 90.2%
BMI: 30.8 (27.9-34.7) kg/m2
BMI ≥ 30 kg/m2: 57.8%
CV risk category: 70.7% secondary;
29.3% primary
Ezetimibe use: 6.4%
Statin Intensity: 6.5% low, 63.0%
moderate, 30.0% high, 0.5% missing
Diabetes: 0.7% T1, 57.8% T2, no
diabetes 41.4%, missing 0.1%
hsCRP: 2.2 (1.1-4.5) mg/L
TAG: 2.4 (2.0-3.1) mmol/L
HDL-C: 1.0 (0.9-1.2) mmol/L
LDL-C: 2.0(1.6-2.3) mmol/L
Prior Atherosclerotic Coronary
Artery Disease and Related
Morbidities: 58.5%
Prior Atherosclerotic Cerebrovascular
Disease and Related Morbidities:
16.2%
Prior Atherosclerotic Peripheral
Artery Disease: 9.5%
Prior Non-Atherosclerotic
Cardiovascular Disease: 89.1%
Prior Cardiac Arrhythmias: 5.9%
Prior Non-Cardiac/Non-
Atherosclerotic Vascular Disorders:
87.2%
Anti-diabetic medication: 53.7%
Anti-hypertensive medication: 95.2%
Anti-platelet medication: 79.1%
Anticoagulant: 9.5%
No antithrombotic: 14.7%
ACEi: 52.1%
ARB: 26.8%
Beta blocker: 70.4%
Supplementary material Heart
doi: 10.1136/heartjnl-2019-315499–731.:724 106 2020;Heart, et al. Butler T

Online Supplementary Table 2 Food Groups and their association with CV outcomes
Study Participant characteristics Study Design Measures and time points Key observations
Aune et al.[25]
Potentially relevant records: 46,082
Excluded 44,823 based on title or
abstract
Full-texts assessed for eligibility:
1259
Excluded 934 as reported other
exposures than vitamin C, E, or
carotenoids
325 relevant papers assessed.
230 excluded due to reviews, cross-
sectional studies, or supplement use.
Articles in final meta-analysis: 99 (69
cohort studies)
Follow-up ranged from 4-32 years
Meta-analysis of prospective cohort studies
assessing relationship between blood
concentrations of vitamin C, E, and
carotenoids with risk of CHD, stroke, CVD,
total cancer, and all-cause mortality
Articles sourced from PubMed and EMBASE
to February 2017
PRIMSA criteria followed for reporting of
meta analyses
Quality of evidence assessed using
Newcastle-Ottawa scale
Study bias assessed using funnel plots and
Egger’s test
Inclusion criteria unclear
Primary outcomes were risk of CHD, stroke, CVD, total
cancer, and all-cause mortality
11 studies reported dietary vitamin C
intake in relation to CHD. Pooled
analysis (240,824 participants)
suggested a significant 12% reduction
per 100 mg/d (RR 0.88; 95% CI: 0.79,
0.98) in CHD risk with increased
vitamin C intake
12 studies reported dietary vitamin C
intake in relation to stroke. Pooled
analysis (296,066 participants)
suggested a significant 8% reduction
per 100 mg/d (RR 0.92; 95% CI: 0.87,
0.98) in stroke risk with increased
vitamin C intake. There was substantial
heterogeneity observed in studies
10 studies reported vitamin C intake in
relation to CVD. Pooled analysis
(296,066 participants) suggested a
significant 11% reduction per 100 mg/d
(RR 0.89; 95% CI: 0.85, 0.94) in stroke
risk with increased vitamin C intake
16 studies reported vitamin C intake in
relation to total mortality. Pooled
analysis (296,066 participants)
suggested a significant 11% reduction
per 100 mg/d (RR 0.89; 95% CI: 0.85,
0.94) in stroke risk with increased
vitamin C intake
16 studies reported blood vitamin C
concentration in relation to CHD.
Pooled analysis (7514 participants)
suggested a significant 26% reduction
(RR 0.89; 95% CI: 0.85, 0.94) in CHD
Supplementary material Heart
doi: 10.1136/heartjnl-2019-315499–731.:724 106 2020;Heart, et al. Butler T

risk per 50 μmol/L increase in vitamin
C concentration
16 studies reported blood vit C
concentration in relation to stroke.
Pooled analysis (27,843 participants)
suggested a significant 30% reduction
(RR 0.70; 95% CI: 0.61, 0.81) in CHD
risk per 50 μmol/L increase in vitamin
C concentration
6 studies reported blood vitamin C
concentration in relation to stroke.
Pooled analysis (45,273 participants)
suggested a significant 24% reduction
(RR 0.76; 95% CI: 0.61, 0.81) in stroke
risk per 50 μmol/L increase in vitamin
C concentration
8 studies reported blood vit C
concentration in relation to total
mortality. Pooled analysis (48,060
participants) suggested a significant
28% reduction (RR 0.72; 95% CI: 0.66,
0.79) in mortality risk per 50 μmol/L increase in vitamin C concentration
5 studies reported total dietary
carotenoids in relation to CHD. Pooled
analysis (91,838 participants) suggested
a significant 15% reduction (RR 0.85;
95% CI: 0.77, 0.93) in CVD risk per
5000 μg/d increase in carotenoids intake
2 studies reported total dietary
carotenoids in relation to CVD. Pooled
analysis (135,971 participants)
suggested a significant 20% reduction
(RR 0.80; 95% CI: 0.70, 0.90) in CVD
risk per 5000 μg/d increase in carotenoids intake
5 studies reported total dietary
carotenoids in relation to mortality.
Pooled analysis (189,079 participants)
suggested a significant 12% reduction
(RR 0.88; 95% CI: 0.83, 0.93) in CVD
Supplementary material Heart
doi: 10.1136/heartjnl-2019-315499–731.:724 106 2020;Heart, et al. Butler T
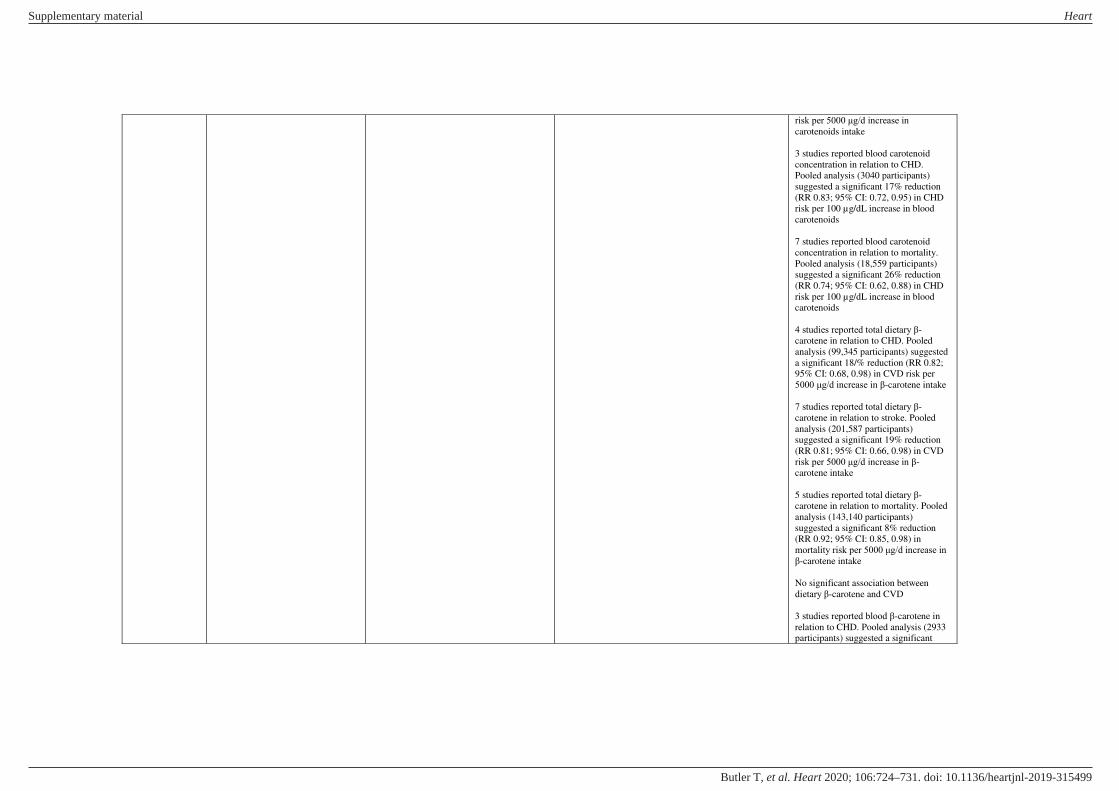
risk per 5000 μg/d increase in carotenoids intake
3 studies reported blood carotenoid
concentration in relation to CHD.
Pooled analysis (3040 participants)
suggested a significant 17% reduction
(RR 0.83; 95% CI: 0.72, 0.95) in CHD
risk per 100 µg/dL increase in blood
carotenoids
7 studies reported blood carotenoid
concentration in relation to mortality.
Pooled analysis (18,559 participants)
suggested a significant 26% reduction
(RR 0.74; 95% CI: 0.62, 0.88) in CHD
risk per 100 µg/dL increase in blood
carotenoids
4 studies reported total dietary β-
carotene in relation to CHD. Pooled
analysis (99,345 participants) suggested
a significant 18/% reduction (RR 0.82;
95% CI: 0.68, 0.98) in CVD risk per
5000 μg/d increase in β-carotene intake
7 studies reported total dietary β-
carotene in relation to stroke. Pooled
analysis (201,587 participants)
suggested a significant 19% reduction
(RR 0.81; 95% CI: 0.66, 0.98) in CVD
risk per 5000 μg/d increase in β-
carotene intake
5 studies reported total dietary β-
carotene in relation to mortality. Pooled
analysis (143,140 participants)
suggested a significant 8% reduction
(RR 0.92; 95% CI: 0.85, 0.98) in
mortality risk per 5000 μg/d increase in β-carotene intake
No significant association between
dietary β-carotene and CVD
3 studies reported blood β-carotene in
relation to CHD. Pooled analysis (2933
participants) suggested a significant
Supplementary material Heart
doi: 10.1136/heartjnl-2019-315499–731.:724 106 2020;Heart, et al. Butler T

20% reduction (RR 0.80; 95% CI: 0.66,
0.97) in CVD risk per 25 µg/dL increase
in β-carotene
3 studies reported blood β-carotene in
relation to stroke. Pooled analysis
(30,144 participants) suggested a
significant 15% reduction (RR 0.85;
95% CI: 0.74, 0.97) in CVD risk per 25
µg/dL increase in β-carotene
8 studies reported blood β-carotene in
relation to CVD. Pooled analysis
(24,428 participants) suggested a
significant 14% reduction (RR 0.86
95% CI: 0.78, 0.96) in CVD risk per 25
µg/dL increase in β-carotene
7 studies reported blood β-carotene in
relation to mortality. Pooled analysis
(23,141 participants) suggested a
significant 19% reduction (RR 0.81;
95% CI: 0.72, 0.90) in mortality risk per
25 µg/dL increase in β-carotene
3 studies reported blood β-
cryptoxanthinin relation to mortality.
Pooled analysis (14,985 participants)
suggested a significant 16% reduction
(RR 0.84; 95% CI: 0.76, 0.94) in
mortality risk per 15 µg/dL increase in
β-cryptoxanthin.
No significant association existed
between blood β-cryptoxanthin and
CHD, stroke, or CVD
No significant associations were
observed between dietary lycopene and
CHD, stroke, CVD, or mortality.
No significant associations were
observed between blood lycopene and
CHD, stroke, CVD, or mortality.
No significant associations were
observed between dietary vitamin E and
CHD, stroke, CVD, or mortality.
Supplementary material Heart
doi: 10.1136/heartjnl-2019-315499–731.:724 106 2020;Heart, et al. Butler T

4 studies reported blood α-Tocopherol
concentration in relation to stroke.
Pooled analysis (69,386 participants)
suggested a 10% reduction (RR 0.90;
95% CI: 0.86, 0.95) in stroke risk per
500 μg/dL increase in blood α-
Tocopherol
9 studies reported blood α-Tocopherol
concentration in relation to mortality.
Pooled analysis (52,376 participants)
suggested a 6% reduction (RR 0.94;
95% CI: 0.89, 0.99) in mortality risk per
500 μg/dL increase in blood α-
Tocopherol
Blood α-Tocopherol was not
significantly associated with CHD or
CVD
Summary
This meta-analysis showed an inverse
association between dietary intake
and blood concentration of vitamin C
and risk of CHD, stroke, CVD, and
all-cause mortality. Dietary
carotenoid intake as well as intake of
specific carotenoids (β-carotene,
lycopene) were inversely associated
with CHD, stroke, and mortality,
whereas blood concentrations of
carotenoids (total, β-carotene, α-
carotene, lycopene, β-cryptoxanthin)
were inversely associated with CVD,
total cancer, and/or all-cause
mortality.
Yip et al.[26]
Potentially relevant records: 4736
Screened 959 abstracts
Full-text articles assessed for
suitability: 87
Excluded 23 due to not meta
analyses, were comparative risk
assessment of used biomarkers
Articles in final meta analysis: 64
Review of evidence from systematic reviews
and meta analyses examining the association
between fruit and vegetable intake and the
burden of disease
Search PubMed, Ovid, EBSCOhost, Google
Scholar databases, Australian Institute of
Health and Welfare, and World Cancer
Research Fund International websites (April
2018)
Primary outcomes were incidence and/or mortality RR,
odds ratio, or HR over a given time span for high-vs low
intakes. Secondary outcomes included incidence and/or
mortality RR, odds ratio, or hazard ratio over a time span
per gram(s) of fruit and/or vegetable intake
For each 100 g/d increases in fruit
intake, there was a 14% decreased risk
of stroke (RR 0.86; 95 % CI 0.84, 0.88).
Risk of CVD was decreased by 10% for
each 100 g/d increase in fruit intake
(RR 0.90; 95% CI: 0.88, 0.92)
Supplementary material Heart
doi: 10.1136/heartjnl-2019-315499–731.:724 106 2020;Heart, et al. Butler T

None of the included studies were
based on RCT data
Follow up periods not reported.
Quality assessment of studies performed
using Assessing the Methodological Quality
of Systematic Reviews (AMSTAR) checklist.
For cohort studies the Newcastle-Ottawa
Quality Assessment Scale for Cohort Studies
was used
Inclusion criteria were
Only meta analyses examining the direct
associations of fruit and/or vegetables intake
with burden of disease were considered
Studies must quantify the pooled RR directly
associated with dietary fruit and/or
vegetables as in grams or servings.
Studies were excluded if they showed only
associations of subgroups (i.e. celery and
mushrooms), used biomarkers (either
biomarkers of fruit and vegetable intake or
biomarkers of disease), examined cooking
methods, or if they investigated specific
disease interventions
CHD risk was reduced by 9% for every
100 g/d increase in fruit intake (RR
0.91; 95% CI: 0.89, 0.93)
Risk of hypertension was reduced by
3% for each 100 g/d increase in fruit
(RR 0.97; 95% CI: 0.96, 0.99)
All-cause mortality risk was reduced by
11% for every 100 g/d of fruit intake
(RR 0.89; 95% CI: 0.88, 0.90).
In general, clear increases in protective
associations were observed within the
first 300 g/day of intakes but little
further increase thereafter.
Each 100 g/d increase in tinned fruit
was associated with a 19% increase in
all-cause mortality (RR 1.19; 95% CI:
1.06, 1.26).
In those consuming ≥34 g/d vs. <17 g/d
tinned fruit there was a 23% increased
risk of CVD mortality (RR 1.23; 95%
CI: 1.05, 1.43)
For each 100 g/d increase in vegetables
there was a 14% decrease in CHD (RR
0.86; 95% CI: 0.84, 0.89).
Risk of stroke was decreased by 12%
(RR 0.88; 95% CI: 0.80, 0.95) for every
100 g/d increase in vegetables.
CVD risk was decreased by 7% (RR
0.93; 95% CI: 0.92, 0.95) for each 100
g/d increase in vegetables.
CVD mortality was reduced by 5% and
all-cause mortality by 13% (RR 0.95;
95% CI: 0.91, 0.99 and RR 0.87; 95%
CI: 0.84, 0.90, respectively) for each
100g increase in vegetables.
Clear increases in different degrees of
protective associations were observed
Supplementary material Heart
doi: 10.1136/heartjnl-2019-315499–731.:724 106 2020;Heart, et al. Butler T

within the first 300 g/day of intakes but
little further increase thereafter.
For fruit and vegetables combined, each
100 g/d increases was associated with a
8% decreased risk for all-cause
mortality (RR 0.91; 95% CI: 0.90,
0.93).
CVD mortality risk was reduced by 7%
(RR 0.93; 95% CI: 0.89, 0.97) for each
100 g/d increase in fruit and vegetables.
Risk of stroke was decreased by 7% for
each 100 g/d increase in fruit and
vegetables (RR 0.93; 95% CI: 0.91,
0.95)
CVD risk was decreased by 4% for each
100 g/d increase in fruit and vegetables
(RR 0.96; 95% CI: 0.94, 0.98)
Risk of CHD was decreased by 4% for
each 100 g/d increase in fruit and
vegetables (RR 0.96; 95% CI: 0.95,
0.97)
Risk of hypertension was decreased by
1% for each 100 g/d increase in fruit
and vegetables (RR 0.99; 95% CI: 0.99,
0.99)
Clear increases in protective
associations were observed within the
first 300 g/day of intake, little further
increase thereafter.
Summary
Evidence from this study shows
increased fruit and vegetable intakes
are associated with reduced burden
of CVDs. In this analysis increased
consumption of tinned fruit was
associated with increased all-cause
and CVD mortality.
Supplementary material Heart
doi: 10.1136/heartjnl-2019-315499–731.:724 106 2020;Heart, et al. Butler T

Bechthold et
al.[27]
Potentially relevant records: 16,623
Excluded 16,382 after title/abstract
screening
Full texts assessed: 261
Excluded 138 due to not relevant
exposure/outcome, not relevant study
design, secondary prevention, or meta
analysis
Articles in final meta-analysis: 123
Whole grain: 16
Refined grain: 8
Vegetables: 32
Fruits: 30
Nuts: 12
Legumes: 13
Eggs: 16
Dairy: 24
Fish: 47
Red meat: 15
Processed meat: 13
Sugar sweetened beverages: 9
Meta-analysis of prospective studies
examining association between different food
groups and risk of CHD, stroke, and HF
Articles sourced from PUBMED and
EMBASE (until March 2017), plus hand
searching of reference lists review articles or
previous meta analyses.
Used MOOSE guidelines for the conduct of
meta analyses.
Inclusion criteria were:
Prospective design
Must contain information on 1 of 12
predefined food groups
Participants ≥ 18 years
Considering CHD including myocardial
infarction and other coronary artery diseases
(like angina); stroke (haemorrhagic,
ischemic); and HF as outcomes
Exclusion criteria
studies including populations suffering from
chronic disease
studies reporting only fatal outcomes
Studies aggregating outcomes as total CVD,
and not reporting on CHD, stroke or HF
separately
Applied the NutriGrade scoring system (max
10 points) which comprises the following
items: (i) risk of bias/study quality/study
limitations (max. 2 points), (ii) precision
(max. 1 point), (iii) heterogeneity (max. 1
point), (iv) directness (max. 1 point), (v)
publication bias (max. 1 point), (vi) funding
bias (max. 1 point), (vii) effect size (max. 2
points), and (viii) dose-response (max. 1
point)
Primary outcomes included CHD (including MI and
other coronary artery diseases (like angina)); stroke
(haemorrhagic, ischemic); and HF
Wholegrains
7 studies (6,834 cases), 7 studies
(11,114 cases) and 5 studies (6,455
cases) were included in high vs. low
intake for CHD, stroke, and HF,
respectively.
Compared with low intakes, high
intakes of wholegrain were associated
with lower risk of CHD (RR 0.85; 95%
CI: 0.81, 0.90), stroke (RR 0.91; 95%
CI: 0.82, 1.02) and HF (RR 0.91; 95%
CI: 0.85, 0.97).
Each additional daily 30 g of whole
grains were inversely associated with
risk of CHD (RR 0.95; 95% CI: 0.92,
0.98, and HF (RR 0.96; 95% CI: 0.95,
0.97)
Risk of CHD decreased by 17% with
increasing intake of whole grains up to ∼100 g/d. No benefit for increasing
intake was apparent above this intake
Refined Grains
5 studies (3286 cases), 6 studies (11,434
cases) and 1 study (1018 cases) were
included in high vs. low intake for
CHD, stroke, and HF, respectively
Compared with low intakes, high
intakes of refined grains were associated
with increased risk of CHD (RR 1.11;
95% CI: 0.99, 1.25). No association was
observed for stroke or HF
Vegetables
19 studies (19,402 cases), 16 studies
(12,442 cases) and 3 study (6,267 cases)
were included in high vs. low intake for
CHD, stroke, and HF, respectively
Compared with low intakes, a high
intakes of vegetables was associated
with lower risk of CHD (RR 0.92; 95%
CI: 0.87, 0.98) and stroke (RR 0.87;
Supplementary material Heart
doi: 10.1136/heartjnl-2019-315499–731.:724 106 2020;Heart, et al. Butler T
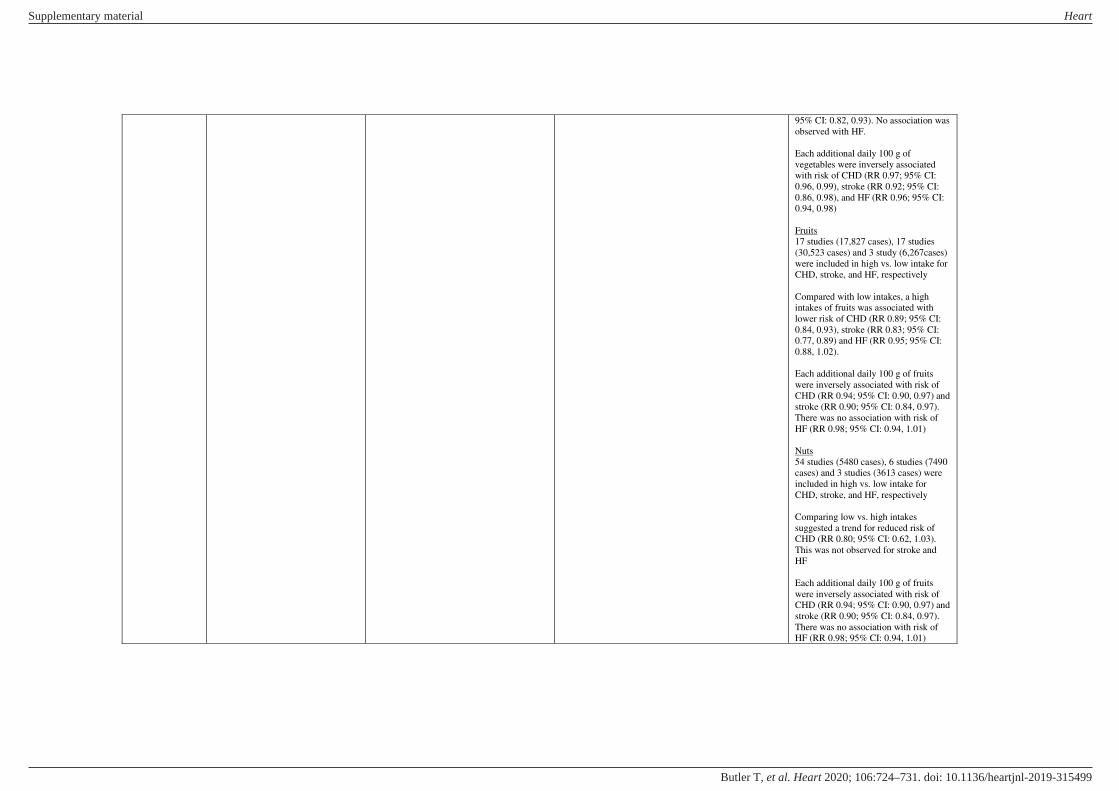
95% CI: 0.82, 0.93). No association was
observed with HF.
Each additional daily 100 g of
vegetables were inversely associated
with risk of CHD (RR 0.97; 95% CI:
0.96, 0.99), stroke (RR 0.92; 95% CI:
0.86, 0.98), and HF (RR 0.96; 95% CI:
0.94, 0.98)
Fruits
17 studies (17,827 cases), 17 studies
(30,523 cases) and 3 study (6,267cases)
were included in high vs. low intake for
CHD, stroke, and HF, respectively
Compared with low intakes, a high
intakes of fruits was associated with
lower risk of CHD (RR 0.89; 95% CI:
0.84, 0.93), stroke (RR 0.83; 95% CI:
0.77, 0.89) and HF (RR 0.95; 95% CI:
0.88, 1.02).
Each additional daily 100 g of fruits
were inversely associated with risk of
CHD (RR 0.94; 95% CI: 0.90, 0.97) and
stroke (RR 0.90; 95% CI: 0.84, 0.97).
There was no association with risk of
HF (RR 0.98; 95% CI: 0.94, 1.01)
Nuts
54 studies (5480 cases), 6 studies (7490
cases) and 3 studies (3613 cases) were
included in high vs. low intake for
CHD, stroke, and HF, respectively
Comparing low vs. high intakes
suggested a trend for reduced risk of
CHD (RR 0.80; 95% CI: 0.62, 1.03).
This was not observed for stroke and
HF
Each additional daily 100 g of fruits
were inversely associated with risk of
CHD (RR 0.94; 95% CI: 0.90, 0.97) and
stroke (RR 0.90; 95% CI: 0.84, 0.97).
There was no association with risk of
HF (RR 0.98; 95% CI: 0.94, 1.01)
Supplementary material Heart
doi: 10.1136/heartjnl-2019-315499–731.:724 106 2020;Heart, et al. Butler T

Legumes
10 studies (8228 cases) and 6 studies
(6333 cases) were included in high vs.
low intake for CHD and stroke,
respectively
Comparing the highest to the lowest
categories of legume intake, an inverse
association between legume intake and
risk of CHD (RR 0.91; 95% CI: 0.84,
0.99), but not with risk of stroke (RR
0.98; 95% CI: 0.88, 1.10)
A small inverse association was
observed for each additional daily
intake of 50 g of legumes and risk of
CHD (RR 0.96; 95% CI: 0.92, 1.01),
but not for stroke (RR 1.00; 95% CI:
0.88, 1.13)
Eggs
11 studies (14,370 cases), 6 studies
(6333 cases), and 4 studies (5059 cases)
were included in high vs. low intake for
CHD, stroke, and HF respectively.
Comparing the highest to the lowest
categories of egg intake, no association
between egg intake and risk of CHD
(RR 0.99; 95% CI: 0.94, 1.05) or risk of
stroke (RR 0.99; 95% CI: 0.93, 1.05)
was observed. A positive association
between egg intake and risk of HF (RR
1.25; 95% CI: 1.12, 1.39) was present
There was no association between each
increment of 50 g of daily egg intake
and risk of CHD (RR 1.00; 95% CI:
0.95, 1.06) or stroke (RR 0.99; 95% CI:
0.93, 1.05) but with risk of HF (RR
1.16; 95% CI: 1.03, 1.31)
Dairy
13 studies (15,790 cases), 12 studies
(16,887 cases), and 3 studies (4057
cases) were included in high vs. low
Supplementary material Heart
doi: 10.1136/heartjnl-2019-315499–731.:724 106 2020;Heart, et al. Butler T

intake for CHD, stroke, and HF
respectively.
Comparing the highest to the lowest
categories of dairy intake, no
associations were observed between
dairy intake and risk of CHD (RR 0.99;
95% CI: 0.92, 1.07), stroke (RR 0.96;
95% CI: 0.90, 1.01), or HF (RR 1.00;
95% CI: 0.90,1.10)
Each additional daily 200 g of dairy
were not associated with risk of CHD
(RR 0.99; 95% CI: 0.96, 1.02) or stroke
(RR 0.98; 95% CI: 0.96, 1.00), but were
positively associated with risk of HF
(RR 1.08; 95% CI: 1.01, 1.15).
No significant differences could be
observed for low-fat and high-fat dairy
and risk of CHD and stroke.
Fish
22 studies (16,732 cases), 20 studies
(14,360 cases), and 8 studies (7945
cases) were included in high vs. low
intake for CHD, stroke, and HF
respectively.
Comparing the highest to the lowest
categories, a small inverse association
between fish intake and risk of CHD
(RR 0.94; 95% CI: 0.88,1.02) or stroke
(RR 0.95; 95% CI: 0.89, 1.01), and a
stronger inverse association between
fish intake and risk of HF (RR 0.89;
95% CI: 0.80, 0.99) was observed
Each additional daily 100 g of fish were
inversely associated with risk of CHD
(RR 0.88; 95% CI: 0.79, 0.99), stroke
(RR 0.86; 95% CI: 0.75, 0.99), and HF
(RR 0.80; 95% CI: 0.67, 0.95)
Red Meat
3 studies (6659 cases), 7 studies (10,541
cases), and 5 studies (9229 cases) were
included in high vs. low intake for
CHD, stroke, and HF, respectively.
Supplementary material Heart
doi: 10.1136/heartjnl-2019-315499–731.:724 106 2020;Heart, et al. Butler T

Comparing the highest to the lowest
categories, a positive association
between red meat intake and risk of
CHD (RR 1.16; 95% CI: 1.08, 1.24,),
stroke (RR 1.16; 95% CI: 1.08, 1.25),
and HF (RR 1.12; 95% CI: 1.04, 1.21)
was observed
Each additional daily 100 g of red meat
were positively associated with risk of
CHD (RR 1.15; 95% CI: 1.08,1.23,),
stroke (RR 1.12; 95% CI: 1.06, 1.17),
and HF (RR 1.08; 95% CI: 1.02, 1.14)
Processed meat
5 studies (7038 cases), 6 studies (9492
cases), and 3 studies (7077 cases) were
included in high vs. low intake for
CHD, stroke, and HF, respectively.
Comparing the highest to the lowest
categories, a positive association
between processed meat intake and risk
of CHD (RR 1.15; 95% CI: 0.99, 1.33),
stroke (RR 1.16; 95% CI: 1.07, 1.26),
and HF (RR 1.27; 95% CI: 1.14, 1.41)
Each additional daily 50 g of processed
meat were positively associated with
risk of CHD (RR 1.27; 95% CI: 1.09,
1.49), stroke (RR 1.17; 95% CI: 1.02,
1.34), and HF (RR 1.12; 95% CI: 1.05,
1.19)
Sugar-sweetened beverages
5 studies (8470 cases), 7 studies (11,187
cases), and 2 studies (8603 cases) were
included in high vs. low intake for
CHD, stroke, and HF, respectively.
Comparing the highest to the lowest
categories, a positive association
between SSB intake and risk of CHD
(RR 1.10; 95% CI: 1.01, 1.20) and
stroke (RR 1.09; 95% CI: 1.01, 1.18),
but no association with HF risk (RR
Supplementary material Heart
doi: 10.1136/heartjnl-2019-315499–731.:724 106 2020;Heart, et al. Butler T
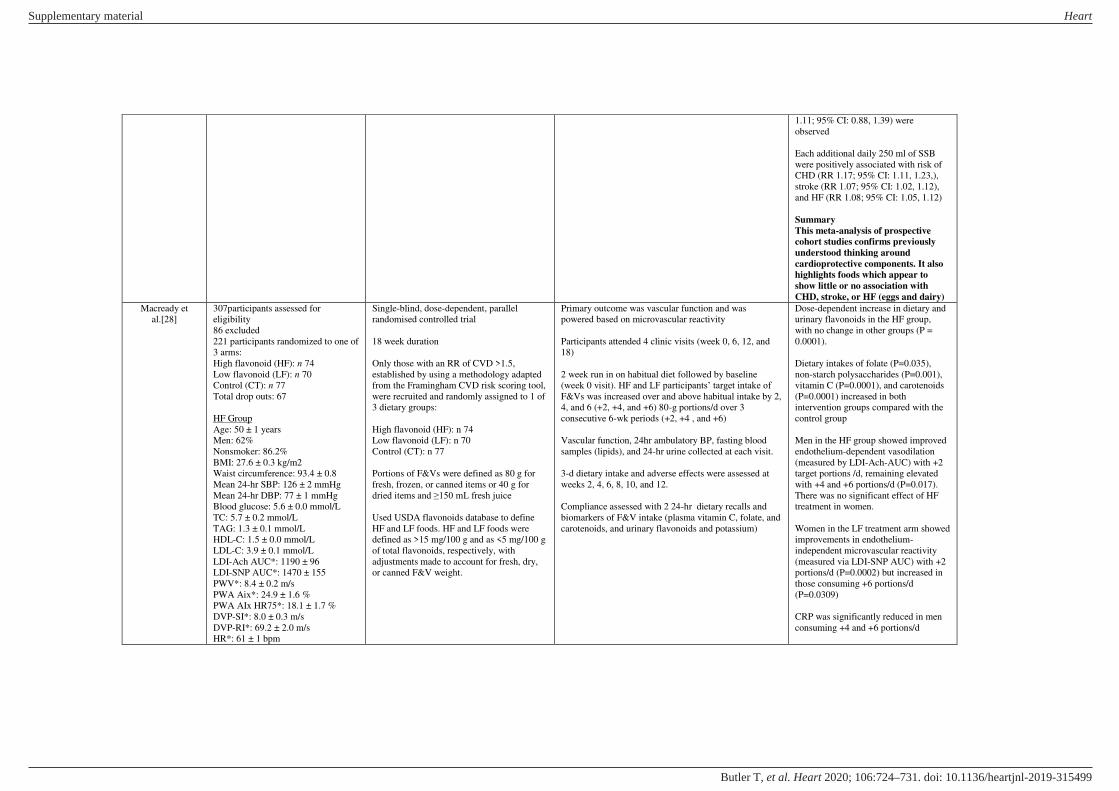
1.11; 95% CI: 0.88, 1.39) were
observed
Each additional daily 250 ml of SSB
were positively associated with risk of
CHD (RR 1.17; 95% CI: 1.11, 1.23,),
stroke (RR 1.07; 95% CI: 1.02, 1.12),
and HF (RR 1.08; 95% CI: 1.05, 1.12)
Summary
This meta-analysis of prospective
cohort studies confirms previously
understood thinking around
cardioprotective components. It also
highlights foods which appear to
show little or no association with
CHD, stroke, or HF (eggs and dairy)
Macready et
al.[28]
307participants assessed for
eligibility
86 excluded
221 participants randomized to one of
3 arms:
High flavonoid (HF): n 74
Low flavonoid (LF): n 70
Control (CT): n 77
Total drop outs: 67
HF Group
Age: 50 ± 1 years
Men: 62%
Nonsmoker: 86.2%
BMI: 27.6 ± 0.3 kg/m2
Waist circumference: 93.4 ± 0.8
Mean 24-hr SBP: 126 ± 2 mmHg
Mean 24-hr DBP: 77 ± 1 mmHg
Blood glucose: 5.6 ± 0.0 mmol/L
TC: 5.7 ± 0.2 mmol/L
TAG: 1.3 ± 0.1 mmol/L
HDL-C: 1.5 ± 0.0 mmol/L
LDL-C: 3.9 ± 0.1 mmol/L
LDI-Ach AUC*: 1190 ± 96
LDI-SNP AUC*: 1470 ± 155
PWV*: 8.4 ± 0.2 m/s
PWA Aix*: 24.9 ± 1.6 %
PWA AIx HR75*: 18.1 ± 1.7 %
DVP-SI*: 8.0 ± 0.3 m/s
DVP-RI*: 69.2 ± 2.0 m/s
HR*: 61 ± 1 bpm
Single-blind, dose-dependent, parallel
randomised controlled trial
18 week duration
Only those with an RR of CVD >1.5,
established by using a methodology adapted
from the Framingham CVD risk scoring tool,
were recruited and randomly assigned to 1 of
3 dietary groups:
High flavonoid (HF): n 74
Low flavonoid (LF): n 70
Control (CT): n 77
Portions of F&Vs were defined as 80 g for
fresh, frozen, or canned items or 40 g for
dried items and ≥150 mL fresh juice
Used USDA flavonoids database to define
HF and LF foods. HF and LF foods were
defined as >15 mg/100 g and as <5 mg/100 g
of total flavonoids, respectively, with
adjustments made to account for fresh, dry,
or canned F&V weight.
Primary outcome was vascular function and was
powered based on microvascular reactivity
Participants attended 4 clinic visits (week 0, 6, 12, and
18)
2 week run in on habitual diet followed by baseline
(week 0 visit). HF and LF participants’ target intake of F&Vs was increased over and above habitual intake by 2,
4, and 6 (+2, +4, and +6) 80-g portions/d over 3
consecutive 6-wk periods (+2, +4 , and +6)
Vascular function, 24hr ambulatory BP, fasting blood
samples (lipids), and 24-hr urine collected at each visit.
3-d dietary intake and adverse effects were assessed at
weeks 2, 4, 6, 8, 10, and 12.
Compliance assessed with 2 24-hr dietary recalls and
biomarkers of F&V intake (plasma vitamin C, folate, and
carotenoids, and urinary flavonoids and potassium)
Dose-dependent increase in dietary and
urinary flavonoids in the HF group,
with no change in other groups (P =
0.0001).
Dietary intakes of folate (P=0.035),
non-starch polysaccharides (P=0.001),
vitamin C (P=0.0001), and carotenoids
(P=0.0001) increased in both
intervention groups compared with the
control group
Men in the HF group showed improved
endothelium-dependent vasodilation
(measured by LDI-Ach-AUC) with +2
target portions /d, remaining elevated
with +4 and +6 portions/d (P=0.017).
There was no significant effect of HF
treatment in women.
Women in the LF treatment arm showed
improvements in endothelium-
independent microvascular reactivity
(measured via LDI-SNP AUC) with +2
portions/d (P=0.0002) but increased in
those consuming +6 portions/d
(P=0.0309)
CRP was significantly reduced in men
consuming +4 and +6 portions/d
Supplementary material Heart
doi: 10.1136/heartjnl-2019-315499–731.:724 106 2020;Heart, et al. Butler T
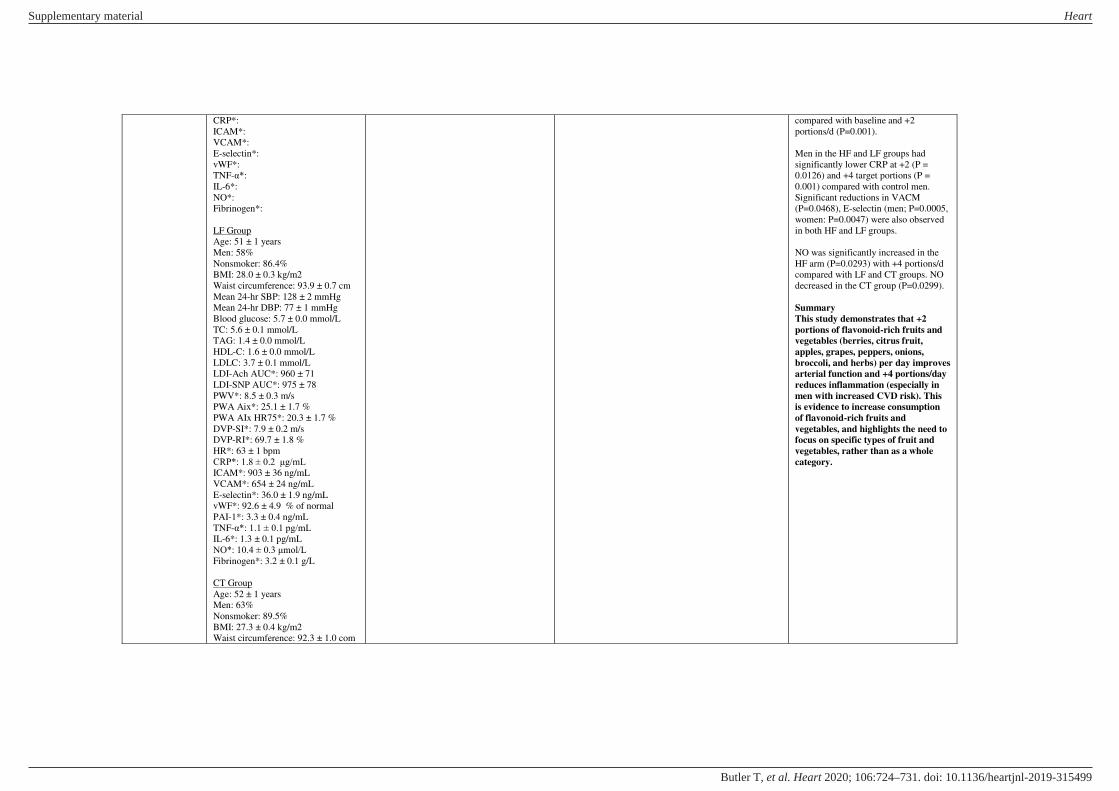
CRP*:
ICAM*:
VCAM*:
E-selectin*:
vWF*:
TNF-α*: IL-6*:
NO*:
Fibrinogen*:
LF Group
Age: 51 ± 1 years
Men: 58%
Nonsmoker: 86.4%
BMI: 28.0 ± 0.3 kg/m2
Waist circumference: 93.9 ± 0.7 cm
Mean 24-hr SBP: 128 ± 2 mmHg
Mean 24-hr DBP: 77 ± 1 mmHg
Blood glucose: 5.7 ± 0.0 mmol/L
TC: 5.6 ± 0.1 mmol/L
TAG: 1.4 ± 0.0 mmol/L
HDL-C: 1.6 ± 0.0 mmol/L
LDLC: 3.7 ± 0.1 mmol/L
LDI-Ach AUC*: 960 ± 71
LDI-SNP AUC*: 975 ± 78
PWV*: 8.5 ± 0.3 m/s
PWA Aix*: 25.1 ± 1.7 %
PWA AIx HR75*: 20.3 ± 1.7 %
DVP-SI*: 7.9 ± 0.2 m/s
DVP-RI*: 69.7 ± 1.8 %
HR*: 63 ± 1 bpm
CRP*: 1.8 ± 0.2 μg/mL
ICAM*: 903 ± 36 ng/mL
VCAM*: 654 ± 24 ng/mL
E-selectin*: 36.0 ± 1.9 ng/mL
vWF*: 92.6 ± 4.9 % of normal
PAI-1*: 3.3 ± 0.4 ng/mL
TNF-α*: 1.1 ± 0.1 pg/mL
IL-6*: 1.3 ± 0.1 pg/mL
NO*: 10.4 ± 0.3 μmol/L
Fibrinogen*: 3.2 ± 0.1 g/L
CT Group
Age: 52 ± 1 years
Men: 63%
Nonsmoker: 89.5%
BMI: 27.3 ± 0.4 kg/m2
Waist circumference: 92.3 ± 1.0 com
compared with baseline and +2
portions/d (P=0.001).
Men in the HF and LF groups had
significantly lower CRP at +2 (P =
0.0126) and +4 target portions (P =
0.001) compared with control men.
Significant reductions in VACM
(P=0.0468), E-selectin (men; P=0.0005,
women: P=0.0047) were also observed
in both HF and LF groups.
NO was significantly increased in the
HF arm (P=0.0293) with +4 portions/d
compared with LF and CT groups. NO
decreased in the CT group (P=0.0299).
Summary
This study demonstrates that +2
portions of flavonoid-rich fruits and
vegetables (berries, citrus fruit,
apples, grapes, peppers, onions,
broccoli, and herbs) per day improves
arterial function and +4 portions/day
reduces inflammation (especially in
men with increased CVD risk). This
is evidence to increase consumption
of flavonoid-rich fruits and
vegetables, and highlights the need to
focus on specific types of fruit and
vegetables, rather than as a whole
category.
Supplementary material Heart
doi: 10.1136/heartjnl-2019-315499–731.:724 106 2020;Heart, et al. Butler T
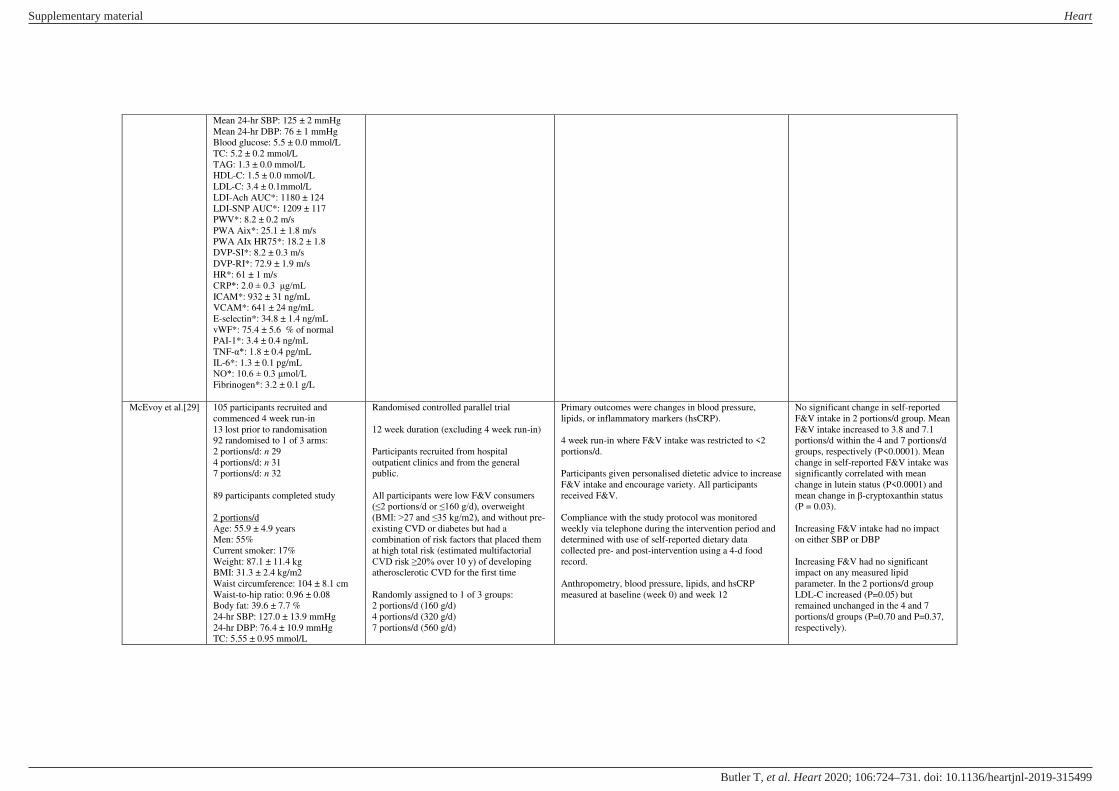
Mean 24-hr SBP: 125 ± 2 mmHg
Mean 24-hr DBP: 76 ± 1 mmHg
Blood glucose: 5.5 ± 0.0 mmol/L
TC: 5.2 ± 0.2 mmol/L
TAG: 1.3 ± 0.0 mmol/L
HDL-C: 1.5 ± 0.0 mmol/L
LDL-C: 3.4 ± 0.1mmol/L
LDI-Ach AUC*: 1180 ± 124
LDI-SNP AUC*: 1209 ± 117
PWV*: 8.2 ± 0.2 m/s
PWA Aix*: 25.1 ± 1.8 m/s
PWA AIx HR75*: 18.2 ± 1.8
DVP-SI*: 8.2 ± 0.3 m/s
DVP-RI*: 72.9 ± 1.9 m/s
HR*: 61 ± 1 m/s
CRP*: 2.0 ± 0.3 μg/mL
ICAM*: 932 ± 31 ng/mL
VCAM*: 641 ± 24 ng/mL
E-selectin*: 34.8 ± 1.4 ng/mL
vWF*: 75.4 ± 5.6 % of normal
PAI-1*: 3.4 ± 0.4 ng/mL
TNF-α*: 1.8 ± 0.4 pg/mL
IL-6*: 1.3 ± 0.1 pg/mL
NO*: 10.6 ± 0.3 μmol/L
Fibrinogen*: 3.2 ± 0.1 g/L
McEvoy et al.[29]
105 participants recruited and
commenced 4 week run-in
13 lost prior to randomisation
92 randomised to 1 of 3 arms:
2 portions/d: n 29
4 portions/d: n 31
7 portions/d: n 32
89 participants completed study
2 portions/d
Age: 55.9 ± 4.9 years
Men: 55%
Current smoker: 17%
Weight: 87.1 ± 11.4 kg
BMI: 31.3 ± 2.4 kg/m2
Waist circumference: 104 ± 8.1 cm
Waist-to-hip ratio: 0.96 ± 0.08
Body fat: 39.6 ± 7.7 %
24-hr SBP: 127.0 ± 13.9 mmHg
24-hr DBP: 76.4 ± 10.9 mmHg
TC: 5.55 ± 0.95 mmol/L
Randomised controlled parallel trial
12 week duration (excluding 4 week run-in)
Participants recruited from hospital
outpatient clinics and from the general
public.
All participants were low F&V consumers
(≤2 portions/d or ≤160 g/d), overweight (BMI: >27 and ≤35 kg/m2), and without pre-
existing CVD or diabetes but had a
combination of risk factors that placed them
at high total risk (estimated multifactorial
CVD risk ≥20% over 10 y) of developing atherosclerotic CVD for the first time
Randomly assigned to 1 of 3 groups:
2 portions/d (160 g/d)
4 portions/d (320 g/d)
7 portions/d (560 g/d)
Primary outcomes were changes in blood pressure,
lipids, or inflammatory markers (hsCRP).
4 week run-in where F&V intake was restricted to <2
portions/d.
Participants given personalised dietetic advice to increase
F&V intake and encourage variety. All participants
received F&V.
Compliance with the study protocol was monitored
weekly via telephone during the intervention period and
determined with use of self-reported dietary data
collected pre- and post-intervention using a 4-d food
record.
Anthropometry, blood pressure, lipids, and hsCRP
measured at baseline (week 0) and week 12
No significant change in self-reported
F&V intake in 2 portions/d group. Mean
F&V intake increased to 3.8 and 7.1
portions/d within the 4 and 7 portions/d
groups, respectively (P<0.0001). Mean
change in self-reported F&V intake was
significantly correlated with mean
change in lutein status (P<0.0001) and
mean change in β-cryptoxanthin status
(P = 0.03).
Increasing F&V intake had no impact
on either SBP or DBP
Increasing F&V had no significant
impact on any measured lipid
parameter. In the 2 portions/d group
LDL-C increased (P=0.05) but
remained unchanged in the 4 and 7
portions/d groups (P=0.70 and P=0.37,
respectively).
Supplementary material Heart
doi: 10.1136/heartjnl-2019-315499–731.:724 106 2020;Heart, et al. Butler T
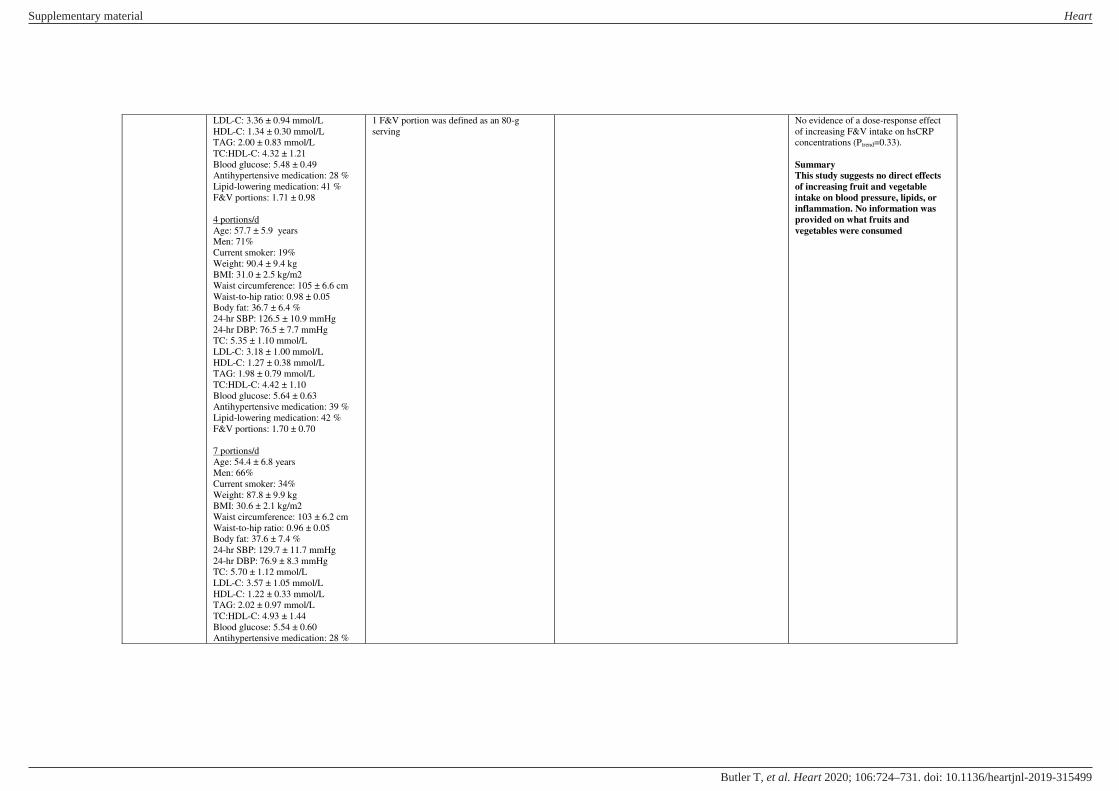
LDL-C: 3.36 ± 0.94 mmol/L
HDL-C: 1.34 ± 0.30 mmol/L
TAG: 2.00 ± 0.83 mmol/L
TC:HDL-C: 4.32 ± 1.21
Blood glucose: 5.48 ± 0.49
Antihypertensive medication: 28 %
Lipid-lowering medication: 41 %
F&V portions: 1.71 ± 0.98
4 portions/d
Age: 57.7 ± 5.9 years
Men: 71%
Current smoker: 19%
Weight: 90.4 ± 9.4 kg
BMI: 31.0 ± 2.5 kg/m2
Waist circumference: 105 ± 6.6 cm
Waist-to-hip ratio: 0.98 ± 0.05
Body fat: 36.7 ± 6.4 %
24-hr SBP: 126.5 ± 10.9 mmHg
24-hr DBP: 76.5 ± 7.7 mmHg
TC: 5.35 ± 1.10 mmol/L
LDL-C: 3.18 ± 1.00 mmol/L
HDL-C: 1.27 ± 0.38 mmol/L
TAG: 1.98 ± 0.79 mmol/L
TC:HDL-C: 4.42 ± 1.10
Blood glucose: 5.64 ± 0.63
Antihypertensive medication: 39 %
Lipid-lowering medication: 42 %
F&V portions: 1.70 ± 0.70
7 portions/d
Age: 54.4 ± 6.8 years
Men: 66%
Current smoker: 34%
Weight: 87.8 ± 9.9 kg
BMI: 30.6 ± 2.1 kg/m2
Waist circumference: 103 ± 6.2 cm
Waist-to-hip ratio: 0.96 ± 0.05
Body fat: 37.6 ± 7.4 %
24-hr SBP: 129.7 ± 11.7 mmHg
24-hr DBP: 76.9 ± 8.3 mmHg
TC: 5.70 ± 1.12 mmol/L
LDL-C: 3.57 ± 1.05 mmol/L
HDL-C: 1.22 ± 0.33 mmol/L
TAG: 2.02 ± 0.97 mmol/L
TC:HDL-C: 4.93 ± 1.44
Blood glucose: 5.54 ± 0.60
Antihypertensive medication: 28 %
1 F&V portion was defined as an 80-g
serving
No evidence of a dose-response effect
of increasing F&V intake on hsCRP
concentrations (Ptrend=0.33).
Summary
This study suggests no direct effects
of increasing fruit and vegetable
intake on blood pressure, lipids, or
inflammation. No information was
provided on what fruits and
vegetables were consumed
Supplementary material Heart
doi: 10.1136/heartjnl-2019-315499–731.:724 106 2020;Heart, et al. Butler T

Lipid-lowering medication: 25 %
F&V portions: 1.62 ± 0.81
Zhong et al.[31] Total participants: n = 29,615
Mean age: 51.6 ± 13.5 years
ARIC:
Men: 45.6%,
Women: 54.4%
Age: 54.3±5.8 years
Ethnicity: Black 24%, White 76%
Current smoker: 26.3%
BMI: 27.7 ± 5.3kg/m2
SBP: 121.1 ± 18.7 mmHg
HDL-C: 1.3 ± 0.4 mmol/L
Non-HDL-C: 4.25 ± 1.44 mmol/L
Diabetes: 10.8 %
Antihypertensive medication: 31%
Lipid lowering medication: 3%
Hormonal therapy: 10.1%
Total energy 1534 kcals/d (IQR
1189-1960), Egg intake 0.14/d (IQR
0.07-0.43), dietary cholesterol 227
mg/d (IQR 0-6.2), alcohol 0g/d (IQR
0-6.2), aHEI**-2010 score 40.6±8.7
CARDIA:
Men: 43.6%
Women: 56.4%
Age: 25.7±3.1 years
Ethnicity: Black 48%, White 52%
Current smoker: 29.8%
BMI: 24.6 ± 5.1kg/m2
SBP: 110.4 ± 10.9mmHg
HDL-C: 1.4 ± 0.3 mmol/L
Non-HDL-C: 3.2 ± 0.9 mmol/L
Diabetes: 0.8%
Antihypertensive medication: 2.5%
Lipid lowering medication: 0%
Hormone therapy: 2.5%
Total energy 2460 kcal/d (IQR 1802-
3348) egg intake 0.42/d (IQR 0.17-
0.87), dietary cholesterol 384 ± 259-
567 mg/d, alcohol 1.2 g/d (IQR 0-
13.2), aHEI-2010 score 43.4 ± 11.1
FHS
Meta-analysis of prospective cohort studies
Participants taken from the Atherosclerosis
Risk in Communities (ARIC) Study,
Coronary Artery Risk Development in Young
Adults (CARDIA) Study, Framingham Heart
Study (FHS), Framingham Offspring Study
(FOS), Jackson Heart Study (JHS), and the
Multi-Ethnic Study of Atherosclerosis
(MESA)
Exclusion criteria: CVD at baseline,
participants consuming <500 Kcals/day and
> 6000 Kcals/day, or missing data from study
variables.
Primary outcomes were incident CVD (including fatal
and non-fatal CHD, stroke, heart failure and other CVD
deaths), and all-cause mortality.
Each study assessed self-reported usual dietary intake
(dietary assessment method not reported but all cohorts
used different dietary assessment tools (except the two
Framingham cohorts)
Diet data were harmonized cohort by cohort, only
baseline measures were included in the study (start dates
between 1985 and 2005).
Consumption frequencies were converted into estimated
numbers per day using the middle value (e.g. 3-4
times/week =0.5 times per day). One serving was
standardised across cohorts and food groups were
constructed using the same definitions. Ingredients from
mixed dishes were considered and appropriate portions
determined for each cohort.
Models adjusted for age, sex, race/ethnicity, education
total energy, smoking status, physical activity score,
alcohol intake, co-use of hormone therapy, BMI,
diabetes, systolic BP, use of anti-hypertensive
medication, HDL-C, non-HDL-C, and use of lipid
lowering medication
To further evaluate whether dietary cholesterol or egg
intake within different dietary patterns altered the
association with incident CVD and all-cause mortality,
major food groups were adjusted individually or
incorporated into 3 diet pattern scores: alternate Healthy
Eating Index 2010 (aHEI- 2010) score, alternate
Mediterranean Diet (MedDiet) score or Dietary
Approaches to Stop Hypertension (DASH).
Median follow up 17.5 years, interquartile range 13.0-
21.7, maximum 31.3 years (1985-2016)
Mean cholesterol intake was 285±184
mg/d
Mean egg consumption was 0.34±0.46
eggs/d
Higher consumption of dietary
cholesterol or eggs was significantly
associated with higher risk of incident
CVD and all-cause mortality in a dose
dependant manner.
Each additional 300mg of dietary
cholesterol consumed per day was
significantly associated with higher risk
of incident CVD (HR 1.17; 95%CI
1.09, 1.26, adjusted ADR 3.24%;
95%CI 1.39, 5.08*) and all-cause
mortality (HR 1.18; 95% CI: 1.10,
1.26], adjusted ARD 4.43%; 95% CI:
2.51, 6.36).
*each additional 300mg cholesterol per
day is associated with a 3.24% greater
absolute risk of CVD over the follow-up
period (i.e. 32 additional cases of CVD
per 1000 participants).
Each additional half egg consumed per
day was significantly associated with
higher risk of incident CVD (adjusted
HR 1.06; 95% CI: 1.03, 1.10], adjusted
ARD 1.11%; 95% CI: 0.32, 1.89) and
all-cause mortality (adjusted HR 1.08;
95% CI: 1.04-1.11, adjusted ARD
1.93%; 95% CI: 1.01,2.76)
Association between dietary cholesterol
and incident CVD and all-cause
mortality were no longer significant
after adjusting for consumption of eggs,
processed and unprocessed meat. The
dietary cholesterol content of eggs fully
explained the association between egg
consumption and incident CVD, and
Supplementary material Heart
doi: 10.1136/heartjnl-2019-315499–731.:724 106 2020;Heart, et al. Butler T

Men: 34.2%
Women: 65.8%,
Age: 73.4 ± 3 years
Ethnicity: White 100%
Current smoker: 10.2%
BMI: 26.6 ± 4.7kg/m2
SBP: 146 ± 20.6 mmHg
HDL-C: 1.3 ± 0.4 mmol/L
Non-HDL-C: 4.4 ± 1.0 mmol/L
Diabetes: 9.6 %
Antihypertensive medication: 43%
Lipid lowering medication: 5.9%
Hormone therapy: 4.9%
Total energy 1676 kcal/d (IQR 1802-
3348), egg intake 0.14/d (IQR 0.07-
0.43), dietary cholesterol 221 mg/d
(IQR 152-308), alcohol 1.2 g/d (IQR
0-13.2), aHEI-2010 score 50.9 ± 9.6
FOS
Men: 45.4%
Women: 54.6%
Age: 73.4±3 years
Ethnicity: White 100%
Current smoker: 19.2%
BMI: 27.3 ± 4.8kg/m2
SBP: 125 ± 18.1 mmHg
HDL-C: 1.3 ± 0.4 vmmol/L
Non-HDL-C: 4.0 ± 1.0 mmol/L
Diabetes: 6 %
Antihypertensive medication: 17%
Lipid lowering medication: 6.2%
Hormone therapy: 10.3%
Total energy 1786 kcal/d (IQR 1413-
2233), egg intake 0.14/d (IQR 0.07-
0.43), dietary cholesterol 209mg/d,
(IQR 153-280), alcohol 3.2 g/d (IQR
0-13.2), aHEI-2010 score 45.8±9.4
JHS
Men: 37.7%
Women: 62.3%,
Ethnicity: Black 100%
Age: 49.3 ± 10.6 years
Current smoker: 11.9%
BMI: 31.9 ± 7.3 kg/m2
SBP: 124.4 ± 15.3 mmHg
HDL-C: 1.3 ± 0.4 mmol/L
largely explained the association
between egg consumption and all-cause
mortality.
The significant associations of dietary
cholesterol consumption with CVD and
all-cause mortality were independent of
the fat amount and quality of the diet
Authors found the effect of egg and
dietary cholesterol remained after
accounting for the beneficial effect of
different dietary models; aHEI-2010
score (HR 1.18; 95% CI: 1.10, 1.26),
MedDiet (HR 1.18; 95% CI: 1.10,
1.26), DASH (HR 1.19; 95% CI: 1.11,
1.27).
Summary
This is a statistically strong study
representing the ethnically diverse US
population. However, the authors
themselves report that the effect of
increasing egg intake on incident
CVD is modest and the clinical
significance of this unknown. The
study findings were based on a single
measure of self-reported dietary
intake at baseline when the average
follow-up time was 17 years. This
does not take into account any
changes to habitual cholesterol or egg
intake during that time. The results
are very much in contrast to the null
effects of egg consumption of CVD risk in other recent studies.
Supplementary material Heart
doi: 10.1136/heartjnl-2019-315499–731.:724 106 2020;Heart, et al. Butler T

Non-HDL-C: 3.8 ± 1.0 mmol/L
Diabetes: 11%
Antihypertensive medication: 40.3%
Lipid lowering medication: 7.3%
Hormone therapy: 14%
Total energy 1999 kcal/d (IQR 1446-
2736), egg intake 0.32/d (IQR 0.09-
0.65), dietary cholesterol 306mg/d
(IQR 196-473), alcohol 0.1 g/d (IQR
0-1.7) aHEI-2010 score 51 ± 9.8
MESA
Men: 47.6%
Women: 52.4%
Age: 61.4±9.6 years
Ethnicity: Black 26.6%, Hispanic
22.2%,Chinese 11.8 %, White 39.4%
Education: < high school 17.8%, high
school 17.4%, ≥college64.9%
Current smoker: 13.1%
BMI: 28.3 ± 5.4kg/m2
SBP: 125.9 ± 20.9mmHg
HDL-C: 1.3 ± 0.4 mmol/L
Non-HDL-C: 3.7 ± 0.7 mmol/L
Diabetes: 12.4%
Antihypertensive medication: 36.3 %
Lipid lowering medication: 16.1 %
Hormone therapy: 15.5 %
Total energy 1515 kcal/d (IQL 1095-
2065), egg intake 0.14/d (IQR 0.04-
0.29), dietary cholesterol 209 mg/d
(IQR 133-326), alcohol, 0.5g/d (IQR
0.1-5.3), aHEI-2010 score 51 ± 9.8
Qin et al.[32] 512 896 Chinese participants in
original cohort.
Participants recruited between 2004-
2008 from 10 geographical locations.
Excluded participants with baseline
cancer, CHD or stroke, self-reported
diabetes of on-site fasting plasma
glucose ≥ 7.0 mmol/L
Never/rarely
Participants: n 42,046
Age: 52.3 ± 10.8 years
Men: 33.9 %
Prospective cohort study (China Kadoorie
Biobank (CKB) Study.
Baseline assessment of habitual frequency of
egg consumption over the previous year was
used to inform groups:
never or rarely
1 to 3 days per month
1 to 3 days per week
4 to 6 days per week
daily
No details on habitual diet were provided
Primary outcomes were morbidity or mortality from
CVD, IHD, haemorrhagic stroke and ischaemic stroke, as
well as major coronary events (MCE) including fatal
IHD death and incident non-fatal MI.
Baseline data collected between 2004 and 2008 to
completion, which occurred at diagnosis of CVD
endpoint, death, loss to follow-up or 31st December 2015
(whichever came first).
Used a non-validated, qualitative food frequency
questionnaire to assess diet data
Covariates collected at baseline questionnaire, including
anthropometric data, socio-demographic information,
Median follow-up 8.9 years (IQR 2.15
years)
At baseline 13.1% of participants
reported daily consumption of eggs
(usual amount 0.76 eggs/day) and 9.1%
reported never or rare consumption.
Among the 461,213 subjects, there were
83,977 CVD incident cases, 9,985 CVD
deaths and 5,103 MCE.
Compared to non-consumers, daily egg
consumption was associated with lower
risk of CVD (HR 0.89; 95% CI: 0.87,
0.92).
Supplementary material Heart
doi: 10.1136/heartjnl-2019-315499–731.:724 106 2020;Heart, et al. Butler T
BMI: 23.7 ± 3.5 kg/m2
Current drinking: 19.3 %
Current smoking: 34.1 %
Physical activity: 21.5 13.5 MET h/d
Hypertension: 36.9 %
Family history of CVD: 20.2 %
Diet pattern
New affluence: 10.3 %
Traditional southern: 64.6 %
Multivitamin use: 2.7 %
1–3 days/month
Participants: n 92,568
Age: 51.2 ± 10.6 years
Men: 38.9 %
BMI: 23.5 ± 3.3 kg/m2
Current drinking: 17.9 %
Current smoking: 32.6 %
Physical activity: 22.1 ± 14.4 MET
h/d
Hypertension: 34.1 %
Family history of CVD: 19.3 %
Diet pattern
New affluence: 10.2 %
Traditional southern: 64.1 %
Multivitamin use: 2.6 %
1–3 days/week
Participants: n 2,169,00
Age: 50.2 ± 10.3 years
Men: 42.2 %
BMI: 23.5 ± 3.3 kg/m2
Current drinking: 18.6 %
Current smoking: 32.1 %
Physical activity: 21.9 ±14.1 MET
h/d
Hypertension: 32.2 %
Family history of CVD: 19.6 %
Diet pattern
New affluence: 19.0 %
Traditional southern: 56.6 %
Multivitamin use: 3.4 %
4–6 days/week
Participants: n 49,182
Age: 49.7 ± 10.3 years
Men: 42.3 %
BMI: 23.5 ± 3.3 kg/m2
lifestyle behaviours (smoking, alcohol intake, physical
activity and diet), medical history (self reported HTN
and use of BP lowering medication, aspirin and statins,
family history of CHD or stroke
Logistic regression or multiple linear regression (for
continuous variable) was conducted to compare age, sex-
, site adjusted proportions or means of baseline
characteristics by frequency of egg intake.
HR and 95% CI were estimated for the associations
between egg consumption and CVD. The multivariate
model was adjusted for all covariates listed in participant
characteristics.
Multivariate-adjusted HR (95% CI) for
IHD was 0.88 (0.84-0.93), MCE 0.86
(0.76-0.97, haemorrhagic stroke 0.74
(0.67-0.82), and ischaemic stroke 0.90
(0.85-0.95).
Daily consumers had an 11% lower risk
of IHD, 18% lower risk of CVD death,
and 28% lower risk of haemorrhagic
stroke death compared to non-
consumers.
Each one-egg increment per week was
associated with an 8% lower risk of
haemorrhagic stroke (HR 0.92; 95% CI:
0.90, 0.95).
Similar associations were observed for
CVD and haemorrhagic stroke mortality
HRs (daily consumption vs non
consumption) were 0.82 (95% CI: 0.75,
0.89) and 0.72 (95% CI: 0.62, 0.84),
respectively. The inverse associations
with mortality from IHD and ischaemic
stroke were non-significant.
Further analysis demonstrated that egg
consumption was not associated with
morbidity of mortality of any CVD
endpoint among diabetic patients
(diagnosed during study).
Among Chinese adults, a moderate level
of egg consumption (up to <1 egg per
day) was significantly associated with
lower risk of CVD.
Summary
Inconsistent with other studies. There
is potential misclassification of egg
consumption due to a non-validated
FFQ and recall issues, change of
habitual egg consumption after
developing disease (reverse causality).
This study did not contain any groups
that eat more than one egg per day,
and so no association could be made with >1 egg per day and CVD.
Supplementary material Heart
doi: 10.1136/heartjnl-2019-315499–731.:724 106 2020;Heart, et al. Butler T
Current drinking: 18.5 %
Current smoking: 31.5 %
Physical activity: 21.9 ± 13.2 MET
h/d
Hypertension: 30.5 %
Family history of CVD: 20.3 %
Diet pattern
New affluence: 35.6 %
Traditional southern: 41.0 %
Multivitamin use: 4.4 %
7 days/week
Participants: n 60,427
Age: 51.6 ± 10.9 years
Men: 44.2 %
BMI: 23.4 ± 3.4 kg/m2
Current drinking: 21.0 %
Current smoking: 32.7 %
Physical activity: 21.7 ± 13.9 MET
h/d
Hypertension: 29.0 %
Family history of CVD: 21.0 %
Diet pattern
New affluence: 55.6 %
Traditional southern: 23.7 %
Multivitamin use: 6.5 %
Alexander et
al.[33]
Potentially relevant records: 245
After duplicates: 150
Excluded 84 due to study design,
experimental or non-english
Full texts assessed: 66
Excluded 49 due to diet pattern,
missing RR for eggs, or study
population with disease
Number of studies in qualitative
synthesis: 17
Articles in final meta analysis: 15
Approximately 276,000 participants
for stroke outcome and 308,000
participants for CHD outcome
Studies primarily conducted in the
US, with others in Japan, Australia,
Spain, and UK.
Systematic review and meta-analysis
Searched PubMed (August 2015), EMBASE,
and Cochrane Collaboration reports
Followed Preferred Reporting Items for
Systematic Reviews and Meta-
Analyses (PRISMA) guidelines for reporting
of systematic reviews and meta-analyses
Bias assessed using Eggers’s regression method
Inclusion criteria were
Prospective design
Human populations
Published in English
Provide risk estimates and measure of
variance for egg intake and CV outcomes
(CHD and stroke)
Primary outcomes were incident stroke, incident CHD
including mortality, incident coronary events,
incident MI, incident haemorrhagic stroke, incident CVD,
IHD mortality, stroke mortality, incident hospitalized or
fatal HF, ischaemic stroke
Follow-up of 6-26 years
Relative risks comparing the highest to the lowest
categories of egg intake were combined across all studies
to produce summary associations. Generally these were 1
egg per day vs < 2 eggs per week.
Random effects meta-analysis was used to generate
summary relative risk estimates (SRREs) for high vs low
intake and stratified intake dose-response analysis.
Heterogeneity was examined in subgroups where
sensitivity and regression analysis were conducted on
increasing egg intake.
Stroke
Comparing high (1 egg/d). vs. low (<2
eggs/week) egg intake, a significant
12% lower risk of stroke was observed
(SRRE 0.88; 95% CI: 0.81, 0.97).
Heterogeneity between studies was low
Subgroup analysis based on location of
study indicated a significant reduction
in stroke risk in US studies (SRRE 0.90;
95% CI: 0.82, 0.99) but not in studies
performed in Japan (SRRE 0.82; 95%
CI: 0.58, 1.18)
CHD
Comparing high vs low egg intake, a
non-significant SRRE 0.97 (95% CI:
0.88, 1.07) was observed.
Subgroup analysis based on location
showed no association between egg
intake and CHD in US studies (SRRE
Supplementary material Heart
doi: 10.1136/heartjnl-2019-315499–731.:724 106 2020;Heart, et al. Butler T
7 studies included in the meta-
analysis of egg intake and stroke
7 studies included in the meta-
analysis for CHD.
Studies adjusted for CHD and stroke
risk factors such as age, race, BMI,
physical activity, smoking, alcohol
and BP. Some studies in the meta-
analysis included participants with
T2Dm, HTN and hyperlipidaemia.
Studies were excluded if they were case–control, cross-sectional, ecologic and
experimental animal studies, or case reports,
case series, commentaries, and letters to the
editor.
0.99; 95% CI: 0.90, 1.10) or studies
undertaken in Japan (SRRE 0.83; 95%
CI: 0.61,1.11).
Daily (or more) intake of eggs was not
associated with risk of CHD (SRRE
0.99; 95% CI: 0.89, 1.09). No apparent
trend was observed in the stratified
intake dose–response analyses for egg
consumption and CHD risk
Summary
These finding are relatively consistent
with those of Shin et al and Rong et
al. Also, some studies included in
these meta-analysis report increased
risks between egg consumption and
CHD and stroke risk among people
with diabetes, however,
methodological reasons such as not
capturing any changes in dietary
intake and lifestyle behaviours
following a diabetes diagnosis may
bias results. Many of these
associations are not statistically
significant and may not reflect an
independent relationship. More
studies are needed which take into
account the overall dietary patterns
and foods consumed with eggs that
may increase risk of T2DM.
Rong et al.[34]
Potentially relevant records: 1440
After duplicates: 1317
Excluded 1301 due to study design,
non-human, or did not study CHD or
stroke as outcome
Full texts assessed: 16
Excluded 8 due to insufficient data,
fewer than 3 categories of egg intake
Articles in final meta analysis: 8
6 studies (9 reports) examined CHD
as an outcome
6 studies (8 reports) considered stroke
Meta-analysis of prospective cohort studies
examining the association between egg intake
and CHD or stroke
Searched PubMed and EMBASE (June
2013). Used reference lists from relevant
papers and review articles
Used MOOSE guidelines for the conduct of
meta analyses.
Quality assessed using the Newcastle-Ottawa
scale
Begg and Egger tests for publication bias
Inclusion criteria were
Primary outcomes were CHD, CHD mortality, MI, IHD,
IHD mortality, stroke and stroke mortality
Length of follow-up was 8 to 26 years
Summary RR for CHD for an increase
in one egg per day was 0.99 (95% CI:
0.85, 1.15, Ptrend=0.88).
RR for stroke for an increment of one
egg consumed per day was 0.91 (95%
CI: 0.81-1.02, Ptrend=0.10).
This meta-analysis did not identify any
association between egg consumption
and risk of CHD or stroke. A higher
intake of eggs (up to one per day) was
not associated with increased risk of
CHD or stroke.
In a sub-group analysis of diabetic
populations, the RR of CHD comparing
Supplementary material Heart
doi: 10.1136/heartjnl-2019-315499–731.:724 106 2020;Heart, et al. Butler T

263,938 participants for CHD
outcome and 210,404 participants for
stroke outcome
Studies primarily conducted in the
US
Prospective design
Egg consumption was the exposure
Outcomes of CHD or stroke
Relative risk and 95% CI reported for at least
3 quantitative categories of egg intake
Studies were excluded if they were reviews,
editorials, non-human studies, and letters
without sufficient data
Articles reporting both CHD and stroke were
treated as two separate reports as were results
stratified by gender.
the highest with the lowest egg
consumption was 1.54 (95% CI: 1.14-
2.09; P=0.01).
Diabetic subjects with a higher egg
consumption had a 25% (95% CI: 0.57,
0.99, P=0.04) lower risk of
haemorrhagic stroke. RR for ischaemic
and total stroke in persons with diabetes
were 0.91 (95% CI: 0.82, 1.01) and 0.80
(95% CI: 0.29, 2.15), respectively.
Associations between egg consumption
and risk of coronary heart disease and
stroke were similar in subgroup
analyses, which were defined by sex,
study location, number of cases or
participants, duration of follow-up,
repeated egg consumption
measurements, study quality, and
whether diet variables or cholesterol
levels were controlled for in models
Summary
Studies with larger sample sizes and
longer follow-up times are required
to confirm these sub group results. .
In long-term follow up, subjects may
have changed diet; approximately
half of the studies had updated diet
information during the follow-up, but
others have intake date from baseline
only.
Shin et al.[35] Potentially relevant records: 72
Excluded 53 due to study design,
non-human, or did not study CVD,
mortality, or T2DM as outcome
Full texts assessed: 19
Excluded 3 due to not reporting HR
with 95% CI or use of continuous
variable for egg intake
Articles in final meta analysis: 16
8 studies examined CVD as an
outcome; 4 studies IHD and 5 studies
stroke
Meta-analysis of prospective cohort studies
examining the association between egg intake
and CHD or stroke
Searched PubMed and EMBASE (March
2013).
Used MOOSE guidelines for the conduct of
meta analyses.
Inclusion criteria were
Prospective design
Egg consumption was the exposure
Outcomes of CHD or stroke
Primary outcomes were CVD, IHD, mortality, T2DM
and stroke
Egg consumption assessed by using a self-administered
or interview-based FFQ and categorized into 3–6 groups.
CVD risk
In 348,420 participants there were 9389
cases of incident CVD; from 239,729
participants there were 5401 cases of
stroke; and from 241,900 participants
there were 4189
Comparison of the highest egg
consumption category (≥1 egg/day) with the lowest (≤1 egg per week or never) resulted in a pooled HR of:
0.96 (95% CI: 0.8, 1.05) for overall
CVD.
Mortality
Supplementary material Heart
doi: 10.1136/heartjnl-2019-315499–731.:724 106 2020;Heart, et al. Butler T

6 studies considered mortality, with 3
examining IHD mortality and 3
examining stroke mortality
3 studies considered diabetes as an
outcome
4 reported CVD in persons with
diabetes
3 examined mortality in persons with
diabetes
For CVD, the number of participants
and duration of the follow-up ranged
from 1600 to 90,735 and from 6 to 20
years, respectively
For mortality, number of individuals
and duration of the follow-up ranged
from 4077 to 37,130 and from 9 to 20
y, respectively.
For T2DM number of participants
and duration of follow-up ranged
from 1669 to 36,295 and from 11 to
20 y, respectively
In persons with T2DM, number of
patients and duration of follow-up
ranged from 341 to 5672 and from 7
to 20 y, respectively
Hazard ratios and 95% CI reported for at
least 3 quantitative categories of egg intake
Studies were excluded if they were reviews,
editorials, non-human studies, and letters
without sufficient data
Articles reporting both CHD and stroke were
treated as two separate reports as were results
stratified by gender.
In 103,202 participants there were 510
deaths from IHD and 1818 deaths from
stroke.
Comparison of the highest egg
consumption category (≥1 egg/day) with the lowest (≤1 egg per week or never) resulted in pooled HR of:
1.13 (95% CI: 0.95, 1.33) for overall
mortality, 0.98 (95% CI: 0.77, 1.24) for
IHD mortality, and 0.92 (95% CI: 0.56,
1.50) for stroke mortality
Risk of Diabetes
In 69,297 participants there were 4889
cases of T2DM.
Comparison of the highest egg
consumption category (≥1 egg/day) with the lowest (≤1 egg per week or never) resulted in pooled HR of 1.42
(95% CI: 1.09, 1.86)
Risk of CVD and mortality in those
with T2DM
In 7549 participants, comparing highest
(≥1 egg/day) with the lowest (≤1 egg per week or never) category of egg
consumption the pooled HR was 1.69;
95% CI: 1.09, 2.62). Egg consumption
was not linked with mortality.
Summary
Egg consumption was not associated
with increased risk of CVD and
cardiac mortality in the general
population. However, this study
observed an increased risk of
incidence of T2DM with higher egg
consumption, and increased risk of
CVD in subjects with diabetes
Patterson et
al.[36]
Total participants at 1997: n 38,984
Excluded participants with cancer,
CVD, diabetes, or those with
unusually high or low energy intake
(n 6010)
Prospective cohort design.
Participants taken from Swedish
Mammography Cohort with baseline data
gathered in 1997
Primary outcome was incidence of MI
Diet measured at baseline using validated 96-item FFQ.
FFQ was validated against the mean intake of four 7-d
weighed diet records.
Over an average follow up of 11.6 years
there were 1392 cases of the primary
endpoint. Comparing highest vs lowest
quintiles, women in the highest quintile
of total dairy foods were more likely to
Supplementary material Heart
doi: 10.1136/heartjnl-2019-315499–731.:724 106 2020;Heart, et al. Butler T

Final sample: n 33,636 women
Q1
Participants: n 6798
Age: 52.9 years
Never smoked: 58.4 %
Past smoker: 25.7 %
Current smoker: 26.3 %
Physical activity: 42.2 MET h/d
Waist-to-hip ratio >0.8: 46.3
BMI: 25.0 kg/m2
Alcohol consumption
0-<2.5 g ethanol/d: 46.9 %
2.5-<15.0 g ethanol/d: 43.4 %
≥15.0 g ethanol/d: 9.7 %
High blood pressure: 19.8 %
Elevated cholesterol: 8.7 %
Family history of MI: 13.4 %
Aspirin use: 41.2 %
HRT use (ever): 49.4 %
Q2
Participants: n 6912
Age: 61 years
Never smoked: 52.4 %
Past smoker: 23.1 %
Current smoker: 22.6 %
Physical activity: 42.4 MET h/d
Waist-to-hip ratio >0.8: 46.1 %
BMI: 24.9 kg/m2
Alcohol consumption
0-<2.5 g ethanol/d: 44.1 %
2.5-<15.0 g ethanol/d: 47.5 %
≥15.0 g ethanol/d: 8.4 %
High blood pressure: 19.2 %
Elevated cholesterol: 7.5 %
Family history of MI: 12.9 %
Aspirin use: 42.3 %
HRT use (ever): 51.2 %
Q3
Participants: n 6629
Age: 61.6 years
Never smoked: 54.3 %
Past smoker: 22.1 %
Current smoker: 22.0 %
Physical activity: 42.5 MET h/d
All women were followed from baseline until
date of first MI, death, or end of the follow-
up period
Participants grouped on quintiles of total
dairy intake
Q1: 2.2 servings/d
Q2: 3.5 servings/d
Q3: 4.5 servings/d
Q4: 6.0 servings/d
Q5: 8.4 servings/d
Total dairy intake was the sum of milk [full-
fat (≥3.0% fat), semi-skimmed (≤1.5% fat), skimmed (0.5% fat), and pancakes], cultured
milk/yogurt [full-fat (≥3.0% fat) and low-fat
(≤1.5% fat)], cheese [full-fat (>17% fat),
low-fat (≤17% fat), and cottage cheese/quark], cream and crème fraiche (full-
fat and low-fat) intakes.
Subgroup analysis performed by assigning
participants to 5 groups based on the same
cut-offs used for quintiles of total dairy food
intake but using a sum of dairy food that
excluded cheese (i.e., the sum of milk,
cultured milk/yogurt, and cream).
Q1
Fruit and vegetables 366 g/d, whole grain
foods 91 g/d, total dairy 181 g, milk 44 %
total dairy, cultured milk/yoghurt 35 % total
dairy, cheese 18 % total dairy, cream and
crème fraiche 3.3 % total dairy
Q2
Fruit and vegetables 390 g/d, whole grain
foods 104 g/d, total dairy 297 g, milk 41 %
total dairy, cultured milk/yoghurt 40 % total
dairy, cheese 18 % total dairy, cream and
crème fraiche 1.5 % total dairy
Q3
Fruit and vegetables 394 g/d, whole grain
foods 114 g/d, total dairy 384 g, milk 41 %
total dairy, cultured milk/yoghurt 38 % total
dairy, cheese 20 % total dairy, cream and
crème fraiche 1.3 % total dairy
Incident cases of MI (fatal and nonfatal; International
Classification of Diseases, 10th edition, code I21) from
baseline (September 15, 1997) through December 31,
2008, from the Cause of Death Registry and through
December 31, 2009, from the National Hospital
Discharge Registry by computerized record linkage of
the cohort population to the registries using the national
registration number that each resident in Sweden is
assigned
Models adjusted for smoking status, physical activity,
waist-to-hip ratio, alcohol consumption, diagnosis of
hypertension, diagnosis of high cholesterol, family
history of myocardial infarction, education, aspirin
usage, hormone therapy usage, energy intake, dairy food
groups and consumption of fruit and vegetables and
whole-grain foods.
be highly educated, and have higher
intakes of whole grain food.
Total dairy food consumption (8.4
servings/d) was inversely associated
with risk of MI (HR 0.77; 95% CI: 0.63,
0.95, Ptrend=0.047).
Milk and cultured milk/yoghurt were
not associated with risk of MI in
multivariate-adjusted models (HR 1.14;
95% CI: 0.95, 1.36, Ptrend=0.115, and
HR 0.89; 95% CI: 0.75, 1.05,
Ptrend=0.149, respectively).
Women in the highest quintile of cheese
intake (6.0 servings/d) had a
significantly lower risk of MI vs. low
cheese consumers (HR 0.74; 95% CI:
0.60, 0.91, Ptrend=0.006).
When cheese was removed from total
dairy variable, total diary was not
associated with MI (HR for highest vs.
lowest quintile 0.83; 95% CI: 0.57,
1.21).
At intakes reported in the study (0.4
servings/d), cream and full-fat crème
fraiche were not associated with MI risk
Women who reported using butter on
bread but not in cooking had a 34%
significantly higher risk compared with
women who did not use butter at all
The association for total dairy food was
attenuated and became non-significant
after adjustment for calcium and
phosphorous (HR for the highest vs. the
lowest quintile: 0.85; 95% CI: 0.62,
1.16 and 0.83; 95% CI: 0.63, 1.06,
respectively. The association for cheese
was attenuated and became non-
significant after adjustment for calcium
(HR for the highest vs. the lowest
quintile: 0.81; 95% CI: 0.62, 1.05).
Supplementary material Heart
doi: 10.1136/heartjnl-2019-315499–731.:724 106 2020;Heart, et al. Butler T

Waist-to-hip ratio >0.8: 45.9 %
BMI: 25.0 kg/m2
Alcohol consumption
0-<2.5 g ethanol/d: 44.4 %
2.5-<15.0 g ethanol/d: 47.3 %
≥15.0 g ethanol/d: 8.3 %
High blood pressure: 18.9 %
Elevated cholesterol: 7.4 %
Family history of MI: 13.2 %
Aspirin use: 43.8 %
HRT use (ever): 50.5 %
Q4
Participants: n 6573
Age: 61.9 years
Never smoked: 53.8 %
Past smoker: 22.6 %
Current smoker: 22.0 %
Physical activity: 42.7 MET h/d
Waist-to-hip ratio >0.8: 46.0 %
BMI: 24.8 kg/m2
Alcohol consumption
0-<2.5 g ethanol/d: 44.9 %
2.5-<15.0 g ethanol/d: 46.9 %
≥15.0 g ethanol/d: 8.2 %
High blood pressure: 18.7 %
Elevated cholesterol: 6.8 %
Family history of MI: 13.1 %
Aspirin use: 43.7 %
HRT use (ever): 51.4 %
Q5
Participants: n 6724
Age: 61.7 years
Never smoked: 52.4 %
Past smoker: 22.0 %
Current smoker: 24.1 %
Physical activity: 42.0 MET h/d
Waist-to-hip ratio >0.8: 45.7 %
BMI: 24.8 kg/m2
Alcohol consumption
0-<2.5 g ethanol/d: 46.8 %
2.5-<15.0 g ethanol/d: 44.3 %
≥15.0 g ethanol/d: 8.9 %
High blood pressure: 18.4 %
Elevated cholesterol: 6.7 %
Family history of MI: 13.4 %
Aspirin use: 45.3 %
Q4
Fruit and vegetables 406 g/d, whole grain
foods 121 g/d, total dairy 461 g, milk 40 %
total dairy, cultured milk/yoghurt 37 % total
dairy, cheese 21 % total dairy, cream and
crème fraiche 1.1 % total dairy
Q5
Fruit and vegetables 423 g/d, whole grain
foods 140 g/d, total dairy 673 g, milk 38 %
total dairy, cultured milk/yoghurt 37 % total
dairy, cheese 24 % total dairy, cream and
crème fraiche 0.8
Total low-fat or full fat milk intake was
not associated with MI risk (comparing
highest vs. lowest HR 1.03; 95% CI:
0.89, 1.18, Ptrend=0.660 and HR 1.10
95% CI: 0.92, 1.31, Ptrend=0.283,
respectively).
Higher intakes of full fat cheese (4.0
servings/d) was associated with a
significantly lower risk of MI (HR
comparing highest vs. lowest: 0.83;
95% CI: 0.68, 1.01, Ptrend=0.035).
Adjusting for calcium attenuated this
association.
Summary
This cohort study showed a non-
linear association between dairy
intake and risk of MI, and
subsequent analysis showed different
types of dairy food have different
associations with risk of MI. A high
intake of cheese was associated with a
significantly lower risk of MI,
whereas the use of butter on bread
was associated with an increased risk.
Studies should focus on individual
dairy components in future analysis
Supplementary material Heart
doi: 10.1136/heartjnl-2019-315499–731.:724 106 2020;Heart, et al. Butler T

HRT use (ever): 51.2 %
Alexander et
al.[37]
Potentially relevant records: 5928
Screened 5928 by title
After duplicates 1649
Excluded 1596 due to study design or
clinical outcomes
Full texts assessed: 53
Excluded 21 due to calcium
supplementation or diet pattern
Articles in final meta analysis: 31
None of the included studies were
based on RCT data
Studies published between 1996-2015
with baseline dietary assessment
between 1965 – 2001
Study countries included USA,
Europe, the Nordic countries,
Australia and Japan
Over 1,000,000 total participants
Systematic review and meta-analysis of
prospective cohort studies investigating dairy
consumption and CVD
Searched PubMed and EMBASE. Additional
records found through screening
bibliographies
Followed PRISMA guidelines for reporting
of systematic reviews and meta-analyses
Exposure was total dairy intake, specific
dairy products (e.g. milk, cheese, yoghurt),
Ca from dairy products (reported as an
analytical variable in the individual studies)
and low- and full-fat dairy intake
Inclusion criteria were
Prospective design
Adult population
English language
Provide risk estimates and measures of
variance for dairy intake and CVD
Studies were excluded if they studied dietary
patterns i.e. dairy product patterns and CVD
outcomes
Primary outcomes included CVD, CHD and stroke.
Results expressed as summary relative risk estimates
(SRREs)
Total Diary Intake
4 studies reported a composite of ‘total dairy intake’ with ‘total CVD’. Comparing low and high intakes, total
dairy intake was associated with a 12%
lower risk of total CVD (SRRE 0.88;
95% CI: 0.75, 1.04)
7 studies total dairy intake and CHD
reporting a SRRE of 0.91 (95% CI: 0.80
- 1.04). Significant heterogeneity was
reported. Subgroup analysis of US-only
studies showed no relationship between
total dairy and risk of CHD (SRRE
0.99; 95% CI: 0.92, 1.07).
Studies with a follow-up ≤15 years showed a significant SRRE for CHD
risk (0.81; 95% CI: 0.71, 0.93). Studies
with a follow-up ≥15 years showed no relationship.
No clear relationship was observed for
either full-fat diary or low-fat diary and
CHD risk (SRRE 1·05; 95 % CI 0·93,
1·19, and SRRE 0·90; 95 % CI 0·82,
0·98, respectively)
7 studies reported on the association
between total diary and stroke. Total
dairy was significantly inversely related
to stroke (SRRE 0·91; 95 % CI 0·83,
0·99). There was modest heterogeneity
which was explained by duration of
follow-up, fat content, and amount
consumed. Studies with a follow-up ≥15 years resulted in an SRRE of 0.88 (95%
CI: 0·82, 0·95). Both full-fat dairy
intake (SRRE 0·91; 95 % CI 0·84, 0·99)
and low-fat dairy intake (SRRE 0·90;
95 % CI 0·83,0·96) were associated
inversely and significantly with stroke.
Milk
Supplementary material Heart
doi: 10.1136/heartjnl-2019-315499–731.:724 106 2020;Heart, et al. Butler T

4 studies reported milk in association
with total CVD. The SSRE was 0.94
(95% CI: 0.86, 1.03).
6 studies reported the association
between total milk and CHD.
Comparing low and high intakes total
milk was not associated with CHD risk
(SRRE 1.05; 95% CI: 0.95, 1.16).
Subgroup analysis considering location
or suggested a lower risk in UK-based
studies (SSRE 0.84; 95% CI: 0.67, 1.05)
and a positive association in women
(SSRE 1.15; 95% CI: 1.00, 1.33).
7 studies reported the association
between total milk and stroke.
Comparing low and high intakes total
milk was not significantly associated
with risk of stroke (SRRE 0.90; 95% CI
0.79, 1.02) although there was
substantial heterogeneity. No effect was
observed in subgroup analysis
considering sex or duration of follow-up
Cheese
3 studies suggested an inverse non-
statistically significant association with
total CVD (SRRE 0.89; 95% CI: 0.78,
1.01).
5 studies showed a significant inverse
relationship between cheese intake and
CHD risk (SRRE 0.82; 95% CI: 0.72,
0.93). >1.5 servings of cheese was
associated with significant inverse
SRRE (0.86; 95% CI: 0.79, 0.94).
4 studies showed a significant inverse
association with cheese intake and risk
of stroke (SRRE 0.87; 95% CI: 0.77,
0.99). Similar responses were observed
to CHD risk, with >1.5 servings
associated with lower risk of stroke
(SRRE 0.92; 95% CI: 0.87, 0.97).
3 studies examined the relationship
between yoghurt and total CVD, and 4
Supplementary material Heart
doi: 10.1136/heartjnl-2019-315499–731.:724 106 2020;Heart, et al. Butler T
studies examined the relationship with
CHD. Yoghurt intake was not
associated with either outcome.
Calcium from dairy products
In 4 studies diary calcium was not
associated significantly with total CHD
(SRRE 0.94; 95% CI: 0.82, 1.08).
Comparing low vs. high, diary calcium
was significantly and inversely
associated with lower risk of stroke
(SRRE 0.69; 95% CI: 0.60, 0.81).
Summary
Evidence from this meta analysis
suggests that specific dairy
components may be associated with
lower risk of CHD and stroke. This is
important given the content of dairy
(SFA, protein) and demonstrates the
importance of considering the whole
food matrix, rather than individual
nutrients.
Soedamah-Muthu
et al.[38]
No information provided on number
of articles searched for in this
updated systematic review and meta
analysis, only number of newly added
texts
Previous meta analysis relevant to
this updated one include:
Gijsbers L, Ding EL, Malik VS, de
Goede J, Geleijnse JM, Soedamah-
Muthu SS. Consumption of dairy
foods and diabetes incidence: a dose-
response meta-analysis of
observational studies. Am J Clin
Nutr. 2016;103(4):1111–1124
Guo J, Astrup A, Lovegrove JA,
Gijsbers L, Givens DI, Soedamah-
Muthu SS. Milk and dairy
consumption and risk of
cardiovascular diseases and all-cause
mortality: dose-response meta-
analysis of prospective cohort studies.
Systematic review and meta-analysis of
prospective cohort studies investigating dairy
consumption and cardiometabolic disease
Searched PubMed (July 2018). Additional
records found through reference lists of
recent reviews.
Followed PRISMA guidelines for reporting
of systematic reviews and meta-analyses
Exposure was total dairy intake, specific
dairy products (e.g. milk, cheese, yoghurt),
Ca from dairy products (reported as an
analytical variable in the individual studies)
and low- and full-fat dairy intake
Inclusion criteria were
Prospective design
Adult population
Reported data on dairy consumption in
relation to T2DM, CHD, and stroke
Primary outcomes included diabetes and CHD 26 cohort studies examined the
relationship between total dairy (per
200 g/d) and diabetes. There was a
borderline significant association
between total dairy and risk of diabetes
(RR 0.97; 95% CI: 0.95, 1.00).
Per 200 g/d increment in low fat dairy
was associated with a 4% lower risk of
diabetes (RR 0.96; 95% CI: 0.92, 1.00).
Comparing 80 g/d vs.0 g/d of yoghurt,
there was an inverse significant
association with diabetes (RR 0.86;
95% CI: 0.83, 0.90).
Substantial heterogeneity was noted in
all studies for diabetes outcome.
15 cohorts were included for the
association between total dairy and milk
in relation to CHD. Total dairy or milk
was not association with incident CHD
per 200 g/d increment (RR 1.00; 95%
Supplementary material Heart
doi: 10.1136/heartjnl-2019-315499–731.:724 106 2020;Heart, et al. Butler T

Eur J Epidemiol. 2017 Apr;
32(4):269-287.
de Goede J, Soedamah-Muthu SS,
Pan A, Gijsbers L, Geleijnse JM.
Dairy consumption and risk of stroke:
a systematic review and updated
dose-response meta-analysis of
prospective cohort studies. J Am
Heart Assoc. 2016;5(5).
10.1161/JAHA.115.002787
Studies were excluded if they were on
animals, children <18 years of age, or patient
populations
If dairy intake was only reported in servings,
without the actual portion size, portion sizes
of 177 g for total, low-fat, and full-fat dairy;
244 g for total, low-fat and full-fat milk; 244
g for yogurt; and 43 g for cheese were used
to estimate grams per day
CI: 0.98, 1.03 and RR 1.01; 95% CI:
0.97, 1.04, respectively).
Total dairy was not significantly
associated with stroke (RR 0.98; 95%
CI: 0.96, 1.01). Low fat and full fat
diary had a similar significant inverse
relationship per 200g/d increment with
stroke (RR 0.97; 95% CI: 0.95, 0.99,
and RR 0.96; 95% CI: 0.93, 0.99,
respectively). An increment of 200 g/d
of milk intake was associated with an
8% lower risk of stroke (RR 0.92; 95%
CI: 0.88, 0.97).
Summary
In this updated meta-analysis of
observational studies examining diary
intake with T2DM, CHD, and stroke,
yoghurt intake was inversely
associated with diabetes, and total
dairy or milk was not associated with
CHD. This study suggests a neutral
or small beneficial associations
between dairy components and
cardiometabolic disease.
Buziau et al.[39]
Total participants: n 8748
For T2DM cohort: n 7633
For CVD cohort: n 7679
Tertile of energy-adjusted dairy
intake
T1
Participants: n 2916
Age: 52.5 ± 1.5 years
BMI
<25 kg/m2: 42 %
25-29 kg/m2: 31.7 %
≥ 30 kg/m2: 26.3 %
Never smoked: 58.4 %
Past smoker: 25.7 %
Current smoker: 26.3 %
Alcohol*
Non-drinker: 13.9 %
Rarely drinker: 26.9 %
Low-risk drinker: 52.2 %
Risky drinker: 7.0 %
Prospective cohort design.
Participants taken from The Australian
Longitudinal Study on Women’s Health
Study used women from 1946–1951 cohort
Group on tertiles of energy-adjusted total
dairy intake
Maximum follow-up of 15 years
Dairy products (g/d) were classified as
“yogurt,” “total cheese” (all types of cheese), “total fermented dairy” (sum of yogurt and total cheese), “total nonfermented dairy” (all types of milk), and “total dairy” (sum of total fermented dairy and nonfermented dairy).
T1
Total dairy 204-233 g/d,
Primary outcomes were self-reported physician-
diagnosed T2DM and CVD
Diet measured using validated 101-item FFQ and a 10-
point scale (ranging from never to ≥3 times/d), except for milk (quantity of milk/d). Australian Food Composition
Database (NUTTAB95) was used to compute energy and
nutrient intakes
BMI, weight, and physical activity were self-reported
Models were adjusted for age, education, smoking status,
alcohol consumption, and physical activity level, BMI,
dietary variables and total energy intake.
To minimize the possibility of reverse causality, ORs
were estimated, excluding women with self-reported
disease diagnosis within the first 3 y of follow-up
Women in the highest
tertile of energy-adjusted total dairy
intake were more likely to
have a lower BMI and to be higher
educated, a never smoker,
classified as rarely drinker, and
physically active.
During follow-up, 701 cases of T2DM
were reported. Women in highest tertile
of yoghurt intake had lower odds of
developing T2DM (OR 0.81; 95% 0.67,
0.99, Ptrend=0.041). Adjustment for diet
variables attenuated this relationship
(OR 0.88; 95% CI: 0.71, 1.08,
Ptrend=0.21). Other categories (total
cheese, total fermented dairy intake,
total nonfermented dairy, and total
dairy) were not associated with T2DM
risk in fully adjusted models
Supplementary material Heart
doi: 10.1136/heartjnl-2019-315499–731.:724 106 2020;Heart, et al. Butler T

Physical activity
<600 MET min/wk: 60.8 %
600-1199 MET min/wk: 18.4 %
≥1200 MET min/wk: 20.8 %
T2
Participants: n 2916
Age: 52.5 ± 1.5 years
BMI
<25 kg/m2: 44.5 %
25-29 kg/m2: 32.9 %
≥ 30 kg/m2: 22.6 %
Never smoked: 62.1 %
Past smoker: 24.7 %
Current smoker: 13.2 %
Alcohol*
Non-drinker: 11.9 %
Rarely drinker: 25.7 %
Low-risk drinker: 56.5 %
Risky drinker: 5.6 %
Physical activity
<600 MET min/wk: 55.0
600-1199 MET min/wk: 21.0 %
≥1200 MET min/wk: 24.0 %
T3
Participants: n 2916
Age: 52.5 ± 1.5 years
BMI
<25 kg/m2: 45.8 %
25-29 kg/m2: 33.3 %
≥ 30 kg/m2: 20.9 %
Never smoked: 62.1 %
Past smoker: 24.1 %
Current smoker: 13.8 %
Alcohol*
Non-drinker: 11.2 %
Rarely drinker: 28.7 %
Low-risk drinker: 56.1 %
Risky drinker: 4.1 %
Physical activity
<600 MET min/wk: 53.1 %
600-1199 MET min/wk: 22.9 %
≥1200 MET min/wk: 24.1%
*rarely drinker” (any alcohol consumption <1 time/mo), “low-risk
1610 ± 543 kcal/d, total fat 36.6 ± 5.6 % total
energy, SFA 14.4 ± 3.3 % total energy,
MUFA 13.1 ± 2.4 % total energy, PUFA 5.8
± 1.9 % total energy, protein 20.5 ± 3.7 %
total energy, total carbohydrate 43.6 ± 7.2 %
total energy, sugars 18.4 ± 5.7 % total
energy, starch 24.9 ± 5.1 total energy, fibre
20.0 ± 8.0 % total energy, alcohol 10 ± 14
g/d, fruit 282 ± 200 g/d, vegetables 139 ± 63
g/d, whole-grain bread 34 ± 14 g/d, red meat
48 ± 46 g/d, processed meat 20 ± 22 g/d, fish
38 ± 44 g/d, sugar-sweetened beverages 0.6 ±
0.9 servings/d, coffee 1.3 ± 1.2 servings/d,
tea 1.5 ± 1.2 servings/d
T2
Total dairy 281-395 g/d
1569 ± 528 kcal/d, total fat 34.5 ± 5.6 % total
energy, SFA 13.6 ± 3.4 % total energy,
MUFA 12.1 ± 2.3 % total energy, PUFA 5.6
± 2.0 % total energy, protein 20.8 ± 3.2 %
total energy, total carbohydrate 45.4 ± 6.4 %
total energy, sugars 21.0 ± 5.4 % total
energy, starch 24.1 ± 4.6 % total energy,
fibre 20.0 ± 8.0 % total energy, alcohol 10 ±
13 g/d, fruit 289 ± 179 g/d, vegetables 133 ±
59 g/d, whole-grain bread 35 ± 16 g/d, red
meat 40 ± 36 g/d, processed meat 17 ± 16
g/d, fish 34 ± 37 g/d, sugar-sweetened
beverages 0.5 ± 0.7 servings/d, coffee 1.4 ±
1.2 servings/d, tea 1.6 ± 1.2 servings/d
T3
Total dairy 420-631 g/d
1555 ± 477 kcal/d, total fat 32.6 ± 6.1 % total
energy, SFA 13.1 ± 3.7 % total energy,
MUFA 11.3 ± 2.3 % total energy, PUFA 5.2
± 2.1 % total energy, protein 21.7 ± 3.2 %
total energy, total carbohydrate 46.5 ± 6.0 %
total energy,
sugars 23.4 ± 5.4 % total energy, starch 22.8
± 4.6 total energy, fibre 20 ± 78 % total
energy, alcohol 9 ± 13 g/d, fruit 293 ± 176
g/d, vegetables 130 ± 57 g/d, whole-grain
bread 34 ± 16 g/d, red meat 34 ± 32 g/d,
processed meat 15 ± 14 g/d, fish 32 ± 35 g/d,
sugar-sweetened beverages 0.4 ± 0.7
835 cases of new CVD occurred during
follow-up. Comparing highest vs.
lowest tertiles, women with the highest
intake of yoghurt and total fermented
dairy had significantly lower risk of
CVD compared (OR 0.84; 95% CI:
0.70, 1.00, Ptrend=0.05, and OR 0.80;
95% CI: 0.67, 0.97, Ptrend=0.017,
respectively). Adjustment for other
dietary variable and total energy
attenuated this relationship for yoghurt
and total fermented dairy (OR 0.87;
95% CI: 0.72,1.04, Ptrend=0.13, and
OR 0.83; 95% CI: 0.69, 1.00,
Ptrend=0.048). No association was seen
for total cheese, total nonfermented
dairy, or total dairy.
Summary
In this prospective cohort study,
higher intakes of total fermented
dairy and lower risk of CVD. Dairy
may also be a marker of a healthy
diet, as women in this cohort who
consumed that highest total dairy also
had lowest prevalence of obesity, and
consumed higher quantities of
vegetables, and lower amounts of
SFA, sugar-sweetened beverages, and
processed meats.
.
Supplementary material Heart
doi: 10.1136/heartjnl-2019-315499–731.:724 106 2020;Heart, et al. Butler T

drinker” (≤14 drinks/wk), and “risky drinker” (≥15 to 28
drinks/wk)”
servings/d, coffee 1.5 ± 1.2 servings/d, tea
1.7 ± 1.2 servings/d
Fontecha et
al.[40]
Potentially relevant records: 2940
After duplicates: 2172
Full texts assessed: 31
Full texts assessed: 53
Excluded 15 due to texts being
narrative reviews or not reporting
data for dairy products consumption
Articles in final overview of reviews
for CVD events: 17
Reports published between 2004-
2017.
Sample size ranged from 2350 to
764,917 with participants followed
for 5-83 years.
Age ranged from 8-103 years
11 studies reported total dairy
9 on regular vs. low fat
2 fermented dairy information
9 studies on milk consumption
2 on high vs low fat milk
consumption
2 on nonfermented milk consumption
1 on fermented milk consumption
Cheese, butter and cream considered
in 9 studies
For updated meta analysis: 12
Overview of systematic reviews and meta-
analyses
Searched MEDLINE, EMBASE, Cochrane
Central Register of
Controlled Trials, Cochrane Database of
Systematic Reviews, and Web of Science
databases from their inception to April 2018.
Reference lists were also reviewed
Followed Meta-analysis of
Observational Studies in Epidemiology
(MOOSE) and Preferred Reporting Items for
Systematic Reviews and Meta-
Analyses (PRISMA) guidelines for reporting
of systematic reviews and meta-analyses
Bias assessed using AMSTAR 2.
Only systematic reviews and meta-analyses
addressing the relation between dairy product
consumption and cardiovascular outcomes
were considered. Meta-analyses had to
include longitudinal studies, written in
English, and followed systematic review
methodology
For RCTs on biomarkers, prospective,
parallel and cross-over designs were eligible.
Studies were required to provide a dietary
supplement or specific diet containing dairy.
Studies were excluded if a supplement could
confound the effect of the milk or dairy
product administered.
Primary outcomes for CV events were cardiovascular
outcomes were incidence and mortality of CVD, CHD,
and stroke. Some studies reported risk of IHD, MI, HF,
and ischaemic and haemorrhagic stroke
For RCTs and biomarkers of cardiometabolic risk
SBP), DBP, and plasma lipids (TC, LDL-C, HDL-C, and
TAGs) were considered
The maximum number of
cardiovascular events, including fatal
and nonfatal outcomes, was 11,019 for
CVD, 37,049 for CHD, and 39,352 for
stroke
Total dairy products
Collectively, total dairy intake was not
associated with CVD
5 meta-analyses reported risk of CHD
(total, incidence or mortality). Total
dairy was neutral for CHD risk with
similar results for high fat dairy. A
significant lower risk was found for
low-fat products (RR 0.90; 95% CI:
0.82, 0.98).
1 meta-analysis indicated total dairy
was associated with a lower risk of MI
(RR 0.83; 95% CI: 0.66, 0.99).
4 meta-analyses considered a dose-
response relationship between total
dairy and CHD. 3 studies found no
differences with an increase of 200 g/d.
1 study showed significantly reduced
risk with increments of 300 and 600 g/d
(RR 0.88; 95% CI: 0.80, 0.96 and RR
0.90; 95% CI: 0.79, 0.94, respectively).
7 meta-analyses reported the association
between stroke and total dairy intake. 6
studies found a significant inverse
association between total dairy intake
and stroke.
5 meta-analyses reported the association
between regular- and low-fat dairy and
stroke. Both high fat and low fat dairy
was inversely associated with stroke.
4 meta-analyses examined the link with
total dairy intake and ischaemic stroke
risk. 1 meta-analysis found a significant
Supplementary material Heart
doi: 10.1136/heartjnl-2019-315499–731.:724 106 2020;Heart, et al. Butler T

inverse association (RR 0.79 95% CI:
0.68 – 0.91) with 3 reporting no
association.
Milk
2 meta-analyses reported associations
between milk and CVD incidence, with
1 showing a protective effect (RR 0.84;
95% CI: 0.78, 0.90).
2 meta-analyses showed no association
between milk intake and increased CHD
or IHD risk
5 studies analysed fatal and non-fatal
stroke in association with total milk
intake. 1 reported a significant inverse
relationship (RR 0.83; 95% CI: 0.77,
0.90) with 4 showing no association.
Dose response analysis for milk was
reported in 2 meta-analyses.
Incremental intakes of 200 g/d were
associated with lower CVD (RR 0.94;
95% CI: 0.89, 0.96) but no relationship
was found with 244g/d increments, or
increased milk intake and CHD
incidence.
1 study suggested higher risk of
haemorrhagic stroke for each 200 g/d
increment of high-fat milk vs low-fat
milk (RR 1.04; 95% CI: 1.02, 1.06).
Cheese
3 meta-analyses analysed the
relationship between high vs. low
cheese intake and CVD risk. One study
suggested an inverse association (RR
0.90; 95% CI: 0.82, 0.99) and 2 showed
no association. No associations were
observed with either high- or low-fat
cheese and CVD risk, or dose-responses
of 10 g/d or 50 g/d.
2 studies showed a significantly
reduced risk for CHD associated with
increased cheese intake, and 2 showed
Supplementary material Heart
doi: 10.1136/heartjnl-2019-315499–731.:724 106 2020;Heart, et al. Butler T

no association. There were no
differences with either high- or low-fat
cheese and associations (null) will CHD
risk. Dose-responses for cheese intake
of 50 g/d and 75 g/d were associated
with lower CHD risk.
5 studies reported on the association
between cheese intake and stroke. 4
studies showed a significant inverse
association with stroke, and 1 showed
no significant association. 1 dose
response analysis of cheese intake and
risk of stroke showed a significantly
lower risk of stroke when cheese intake
was increased by 50 g/d or 75 g/d (RR
0.86; 95% CI: 0.77, 0.99, and RR 0.92;
95% CI: 0.87, 0.97, respectively).
Yoghurt and Fermented products
2 meta-analyses reported on the
association between yoghurt intake and
CVD, showing no significant
association. No significant association
was also observed between yoghurt and
CHD risk (3 meta-analyses), or risk of
stroke (2 meta-analyses). Increments of
50 or 100 g/d were not associated with
fatal and non-fatal CHD events
1 study suggested consumption of
fermented milk was significantly
inversely associated with risk of stroke
(RR 0.80; 95% CI: 0.71, 0.89), and an
increment of 200 g/d of fermented dairy
was associated with lower risk of CVD,
but not CHD risk
Butter and Cream
No significant association were found
for butter and CVD (1 meta-analysis),
CHD (2 meta-analyses), and stroke (4
meta-analyses).
Dairy Products and Cardiometabolic
Biomarkers
Increased fermented dairy intake was
associated with lower TC and LDL-C in
Supplementary material Heart
doi: 10.1136/heartjnl-2019-315499–731.:724 106 2020;Heart, et al. Butler T

4 meta-analyses. 1 meta-analysis found
no differences in LDL-C when
comparing whole-fat dairy with low-fat
dairy products.
8 studies examined the effect of dairy
consumption on blood pressure. 6
reported a significant decreased in SBP
and 5 reported a significant decreased in
DBP.
In updated meta-analysis, no significant
changes in TC (-0.06 mmol/L; 95% CI:
-0.19, 0.07 mmol/L), LDL-C (-0.06
mmol/L; 95% CI: -0.16, 0.03 mmol/L)
were seen relating to total dairy
consumption. Heterogeneity was high
for TC and LDL-C
Dairy product consumption did not
result in significant changes in SBP (-
0.41 mmHg; 95% CI: -1.73, 0.91) or
DBP (−0.77 mmHg; 95% CI: -1.81,
0.27). Heterogeneity was low for BP
trials.
Summary
This is the most comprehensive study
to date combining multiple systematic
reviews and meta-analyses, multiple
types of dairy, in addition to
biomarkers and hard CV end-points.
The main findings suggest that total
dairy products (either regular or low-
fat) have a null or slightly beneficial
association with CV health (risk of
CVD, CHD, or stroke). Thus advice
to limit them based on their SFA
content may not be beneficial, and
more research is needed into
fermented dairy.
Zhao et al.[41]
Potentially relevant records: 2768
Excluded 2515 due to unreported
outcomes for diseases of interest or
quantifying alcohol exposure
65 studies excluded for not being
original.
Updated Meta-Analysis of Cohort Studies
quantifying the association between alcohol
consumption and CHD mortality.
Searched PubMed and EMBASE (March
2013).
Primary outcome was presence or absence of mortality
from CHD. CHD defined as per ICD-10; I20-I25 as per
WHO, 2010
Weighted RR estimates adjusted for between-study
variation, abstainer group biases, mean age, sex of study
population, alcohol measure accuracy ethnicity (mainly
Pooled 269 risk estimates showed a
significantly higher risk among former
drinkers (RR 1.25; 95% CI: 1.03, 1.51,
P=0.0215) and a significantly lower risk
among low-, medium-, and high-volume
drinkers (RR 0.80; 95% CI: 0.69, 0.93;
0.80; 95% CI: 0.69, 0.94; and 0.86; 95%
Supplementary material Heart
doi: 10.1136/heartjnl-2019-315499–731.:724 106 2020;Heart, et al. Butler T
88 studies excluded due to the
combining morbidity and mortality,
no alcohol categories, restricted to
sample with pre-existing conditions,
duplicate/published in different
journals.
87 studies excluded for meta-analysis
of all-cause of mortality.
Articles in final meta-analysis: 45
45 unique studies selected included
269 estimates of the risk relationship
between level of alcohol consumption
and CHD mortality.
There were 2,913,140 subjects of all
ages, ethnicity and medical
conditions and 65,476 deaths
available for the analysis
17 reported RR estimates for men and
women separately, 21 for men only, 2
for women only, and 5 for both sexes
combined.
Only 7 studies (53 risk estimates)
were free from abstainer bias.
25 studies (132 risk estimates) had
both former and occasional drinker
bias, 8 studies (41 risk estimates) had
only former drinker bias, and 5
studies (43 risk estimates) had only
occasional drinker bias.
5 studies were conducted in Asian
countries (3 in China, 2 in Japan) and
40 in countries with mainly White
populations (22 in the United States,
18 in Australia or European
countries).
Followed PRISMA guidelines followed for
identifying relevant studies.
Inclusion criteria were:
Studies must be prospective in design
Published in English
Report mortality from CHD as an outcome
Minimum of three levels of alcohol
consumption quantified for human subjects
Studies were excluded if they did not meet
inclusion criteria
Participants grouped based on daily alcohol
use in grams of ethanol assessed at baseline
and compared with a reference group of
variously defined “nondrinkers”: Former drinkers now completely abstaining;
Current occasional drinkers: up to one drink
per week (<1.30 g per day);
Current low-volume drinkers: up to two
drinks or 1.30–24.99 g per day;
Current medium-volume drinkers: up to four
drinks or 25–44.99 g per day;
Current high-volume drinkers: up to six
drinks or 45–64.99 g per day;
Current higher volume drinkers: six drinks,
65 g, or more per day.
Studies were classified on the presence or
absence of abstainer biases by whether
abstainers included both occasional drinkers
and former drinkers, abstainers included
occasional drinkers only, abstainers included
former drinkers only, and abstainers included
neither occasional drinkers nor former
drinkers.
Subgroups of studies were stratified by
gender, mean age, and ethnicity and control
for heart health in order to explore variation
in the effects of alcohol use on CHD
mortality according to different values of
these variables.
White vs. not), control of heart health at baseline,
socioeconomic status, and smoking status in individual
studies.
Covariates included the presence of former and/or
occasional drinker biases, mean age of cohort at baseline,
gender of study participants, primarily White ethnicity of
study population or not, alcohol measure accuracy,
control of social status, smoking status, and indication of
prior heart conditions
CI: 0.73, 1.01, respectively,) compared
with abstainers
The mean estimates indicated
significantly decreased risk of CHD
mortality among male drinkers who
drank 1.3–24.99 g/d (RR 0.86; 95% CI:
0.74, 0.99, P=0.0382) and 25-44.99 g/d
(RR 0.84; 95% CI: 0.72, 0.97,
P=0.162).
In women, those who drank 1.3–24.99
and day had a lower risk of CHD
mortality compared with abstainers (RR
0.81; 95% CI: 0.66, 0.99, P=0.443).
However, fully adjusted RRs were
significantly higher among both male
former (RR 1.37; 95% CI: 1.12, 1.67,
P=0.0026) and marginally higher
among male occasional drinkers (RR
1.24; 95% CI: 1.00, 1.55, P=0.0526) but
not for women.
Fully adjusted models for the studies
with mean age older than age 55 years
at baseline showed significantly
increased RRs for former drinkers (RR
1.34; 95% CI 1.08, 1.65, P=0.0078 and
decreased RRs for low (RR 0.81; 95%
CI: 0.69, 0.95, P=0.0080), medium (RR
0.77; 95% CI: 0.66, 0.90, P=0.0015)
and all current drinkers (RR 0.83; 95%
CI: 0.75, 0.92, P=0.0074).
In participants aged 19-55 years,
compared to abstainers both former
drinkers and occasional drinkers had a
significantly increased risk of CHD
mortality (RR 1.45; 95% CI: 1.08, 1.95,
P=0.0136, and RR 1.44; 95% CI: 1.09,
1.89, P=0.101, respectively.
In studies that controlled for heart-
health at baseline (i.e. excluded
participants with heart conditions) fully-
adjusted models showed no significant
associations between alcohol intake and
Supplementary material Heart
doi: 10.1136/heartjnl-2019-315499–731.:724 106 2020;Heart, et al. Butler T

CHD mortality. The only significant
association was observed comparing
former drinkers vs. abstainers (RR 1.39;
95% CI: 1.03, 1.86, P=0.0295).
In studies that included all participants
(i.e. did not control for heart health at
baseline), compared with abstainers
decreased RRs for current low volume
(0.78; 95% CI: 0.68,0.89, P=0.0005),
medium volume (0.76; 95% CI: 0.66,
0.88, P=0.0002), high volume (0.84,
95% CI: 0.72, 0.99, P=0.0319), and all
current drinkers (0.83, 95% CI: 0.76,
0.91, P=0.0041) were observed.
In studies that were regarded as higher
quality (n=5; free from former drinker
bias, controlled for smoking, had a
mean age up to 60 years, followed up to
a mean age of 55 years, and had
adequate measures of alcohol
exposures) comparing former drinkers
vs. abstainers was the only category to
show a positive association with risk of
CHD mortality (RR 1.40; 95% CI: 1.08,
1.84, P=0.0186)
Fully adjusted models showed a
significantly increased risk among
former drinkers (RR 1.28) and
decreased risk among low- (RR 0.81)
and medium-volume drinkers (RR 0.83)
compared with abstainers in the White
populations. In Asian populations, the
RR estimates were similar to the White
populations but were not significant.
Summary
In this analysis of prospective cohort
studies, CHD risk was significantly
lower in individuals classed as low-
and medium-volume drinkers, and
did not suggest high intakes of alcohol
were associated with increased risk.
However alcohol intake was self-
reported at 1 time point – not
capturing changes during life – or
Supplementary material Heart
doi: 10.1136/heartjnl-2019-315499–731.:724 106 2020;Heart, et al. Butler T
risk estimates were based on small
study populations (i.e. heavy drinkers
in Asian populations). Because of
additional confounding variables and
this study is not able to support the
concept that alcohol intake is
cardioprotective
Larsson et al.[42] Initial sample: 48,850 men, 39,227
women.
Sample excluded due to missing
personal identification number, death,
diagnosis of ischaemic heart disease,
HF, or cancer before baseline, and
not provided information on alcohol
consumption.
Analysis sample: 40,590 men, 4,022
women.
Age: 45–79 years old men, 49–83
years women.
All participants free of IHD and HF
at baseline
COSM
Never Drinkers
Participants: n 1844
Age: 64.3 years
BMI: 25.6 kg/m2
Postsecondary education: 15.8 %
Family history of MI: 11.4 %
Current smokers: 6.4 %
Walk/bicycle = 40 min/day: 33 %
Exercise = 2 h/week: 53.6 %
Aspirin use = 7 tablets/week: 4.2 %
Hypertension: 20.4 %
Hypercholesterolemia: 9.4 %
Diabetes: 9 %
Atrial fibrillation: 1.7 %
mDASH diet score: 20.6
Former Drinkers
Participants: n 2357
Age: 63.7 years
BMI: 26.1 kg/m2
Postsecondary education: 11.6 %
Family history of MI: 16 %
Current smokers: 32.1 %
Walk/bicycle = 40 min/day: 37.3 %
Participants taken from the Cohort of
Swedish Men (COSM) and Swedish
Mammography Cohort (SMC).
Men were categorised into eight groups
according to their alcohol drinking status and
number of drinks consumed per week: never
(lifetime abstainers), former, current
drinkers: occasional drinkers <1, numbers of
drinks between 1–6, 7–14, 15–21, 22–28, and
28 per week. Because of lower alcohol
consumption in women than in men, the two
highest categories were collapsed into one
category (i.e. highest category >21
drinks/week).
Primary outcomes were risk of MI and HF. Outcomes
were determined from the Swedish National Patient
Register and the Swedish Cause of Death Register. ICD-
10 code I21 used to define MI and and I50 and I11.0 for
HF.
Validated FFQs at baseline were given in 1997. Patients
were followed–up until December 2010. Average alcohol
consumption in the past year prior to baseline was
assessed with six questions on alcoholic beverages,
including:
class I beer (alcohol by volume, 2.25%), class II beer
(2.8–3.5%), class III beer (>3.5%), wine (12%), strong
wine (>18%), and liquor.
Weekly alcohol consumption was calculated by
multiplying the frequency of consumption
of each alcoholic beverage by the amount consumed per
occasion. One drink was defined as 12 g alcohol
(ethanol).
Covariates data on education, family history of
myocardial infarction, smoking, weight, height, physical
activity, aspirin use, history of hypertension,
hypercholesterolemia, and diabetes were identified using
the baseline questionnaire, participants provided. Self-
reported history of hypertension and diabetes was
complemented with data on diagnosis of these diseases in
the Swedish National Patient and Diabetes Registers.
Data on atrial fibrillation were acquired from the
Swedish National Patient Register.
Follow -up time from January 1, 1998 until the first of
the following.
Multivariable models were adjusted for age (as the time
scale in all analyses), education, family history of
myocardial infarction before 60 years of age; smoking;
BMI; walking/bicycling; exercise; use of aspirin; and
history of hypertension; Hypercholesterolemia; diabetes;
and atrial fibrillation. The multivariable model was also
Compared with individuals consuming
small (<1drink/wk) amounts of alcohol,
heavy drinkers (> 28 drinks/wk in men
and > 21 drinks/wk in women) were
younger and less active, more likely to
be current smokers, and have a family
history of MI.
In women, hypertension was more
prevalent in never and former drinkers
than in heavy drinkers
During the 12 years of follow-up there
were 3678 cases of MI in men and 1500
cases of MI in women. 1905 men and
1328 women were diagnosed with HF.
Alcohol consumption was statistically
significantly inversely associated with
risk of MI in both men and women (P
for trend < 0.001). In multivariable
analysis compared with <1 drink/wk
men who consumed >28 drinks/wk had
a lower risk of MI (HR 0.70; 95% CI:
0.15, 0.67). In women who consumed
>15-21 drinks/week the HR was 0.32
(95% CI: 0.15, 0.67). In women, heavy
intakes of alcohol (>21 drinks/wk)
attenuated the inverse relationship
between alcohol and risk of MI.
Alcohol intake was not associated with
incident HF in either men or women
although heavy intakes were associated
with increased risk in men (HR 1.45;
95% CI: 1.09, 1.93). This was not
observed in women.
In men the HRs for <1 drink/wk, 1-6
drinks/wk, 7-14 drinks/wk, 15-21
drinks/wk and 22-28 drinks/wk were
1.07 (95% CI: 0.91, 1.26), 1.12 (95%
Supplementary material Heart
doi: 10.1136/heartjnl-2019-315499–731.:724 106 2020;Heart, et al. Butler T

Exercise = 2 h/week: 57.9 %
Aspirin use = 7 tablets/week: 8.8 %
Hypertension: 25.5 %
Hypercholesterolemia: 15.1 %
Diabetes: 13 %
Atrial fibrillation: 3.2 %
mDASH diet score: 20.4
<1 drink/wk
Participants: n 3572
Age: 62 years
BMI: 25.8 kg/m2
Postsecondary education: 14.9 %
Family history of MI: 14.7 %
Current smokers: 20.9 %
Walk/bicycle = 40 min/day: 33.7 %
Exercise = 2 h/week: 56.5 %
Aspirin use = 7 tablets/week: 5.7 %
Hypertension: 23.2 %
Hypercholesterolemia: 12.4 %
Diabetes: 9 %
Atrial fibrillation: 1.9 %
mDASH diet score: 20.5
1-6 drinks/wk
Participants: n 16,423
Age: 59.8 years
BMI: 25.6 kg/m2
Postsecondary education: 16.6 %
Family history of MI: 14.2 %
Current smokers: 23.2 %
Walk/bicycle = 40 min/day: 32.9 %
Exercise = 2 h/week: 58.6 %
Aspirin use = 7 tablets/week: 5.7 %
Hypertension: 21.6 %
Hypercholesterolemia: 12.9 %
Diabetes: 7.6 %
Atrial fibrillation:1.9 %
mDASH diet score: 20.9
7-14 drinks/wk
Participants: n 10,001
Age: 57.7 years
BMI: 25.6 kg/m2
Postsecondary education: 19.8 %
Family history of MI: 14.2 %
Current smokers: 25.4 %
Walk/bicycle = 40 min/day: 32 %
controlled for overall diet using a modified Dietary
Approaches to Stop Hypertension diet
score (mDASH diet score) ranges from 7 (minimal
adherence) to 35 (maximal adherence).
CI: 0.94, 1.34), 0.92 (95% CI: 0.72,
1.17), and 1.12 (95% CI: 0.82, 1.55),
respectively.
In women the HRs for <1 drink/wk, 1-6
drinks/wk, 7-14 drinks/wk, 15-21
drinks/wk and >21 drinks/wk were 0.93
(95% CI: 0.81, 1.06), 0.90 (95% CI:
0.70, 1.16), 0.62 (95% CI: 0.29, 1.31),
and 0.73 (95% CI: 0.32, 1.63),
respectively.
In men, risk of HF was higher in never
and former drinkers (HR 1.24; 95% CI:
0.99, 1.54 and 1.40, 95% CI: 1.15, 1.71,
respectively). The relationship was
absent in women
Summary
This study shows divergent
associations between alcohol intake
and risk of MI or HF. The difference
between men and women’s HF risk may be due to a small number of
women who drank heavily, thus
meaning lower statistical power.
Similarly the intake of ethanol may
have been inadequate to have an
impact on BP. This is shown by the
baseline data where the prevalence of
hypertension is lower in the heavy
drinking group than the light
drinkers. Similar to other studies a
limitation is that alcohol consumption
was self-reported and measured at
baseline only, and other types of CVD
(or comorbidities) were not examined
Supplementary material Heart
doi: 10.1136/heartjnl-2019-315499–731.:724 106 2020;Heart, et al. Butler T

Exercise = 2 h/week: 60.7 %
Aspirin use = 7 tablets/week: 5.6 %
Hypertension: 21.6 %
Hypercholesterolemia: 13.4 %
Diabetes: 6.6 %
Atrial fibrillation: 2.1 %
mDASH diet score: 20.9
15-21 drinks/wk
Participants: n 3586
Age: 56.7 years
BMI: 25.9 kg/m2
Postsecondary education: 20.1 %
Family history of MI: 14.6 %
Current smokers: 30.1 %
Walk/bicycle = 40 min/day: 32 %
Exercise = 2 h/week: 57.8 %
Aspirin use = 7 tablets/week: 6.6 %
Hypertension: 22.8 %
Hypercholesterolemia: 15.3 %
Diabetes: 6.4 %
Atrial fibrillation: 2.2 %
mDASH diet score: 20.7
22-28 drinks/wk
Participants: n 1332
Age: 56.4 years
BMI: 26.1 kg/m2
Postsecondary education: 20.4 %
Family history of MI: 14.6 %
Current smokers: 34.3 %
Walk/bicycle = 40 min/day: 29.9 %
Exercise = 2 h/week: 58.4 %
Aspirin use = 7 tablets/week: 6.9 %
Hypertension: 24.4 %
Hypercholesterolemia: 14.9 %
Diabetes: 6.7 %
Atrial fibrillation: 2 %
mDASH diet score: 20.4
>28 drinks/wk
Participants: n 1475
Age: 56.5 years
BMI: 26.2 kg/m2
Postsecondary education: 17.6 %
Family history of MI: 16.5 %
Current smokers: 42.5 %
Walk/bicycle = 40 min/day: 29.5 %
Supplementary material Heart
doi: 10.1136/heartjnl-2019-315499–731.:724 106 2020;Heart, et al. Butler T

Exercise = 2 h/week: 53.6 %
Aspirin use = 7 tablets/week: 7.9 %
Hypertension: 27.9 %
Hypercholesterolemia: 16.9 %
Diabetes: 9.2 %
Atrial fibrillation: 1.9 %
mDASH diet score: 19.9
SMC
Never Drinkers
Participants: n 4126
Age: 67.6 years
BMI: 25.9 kg/m2
Postsecondary education: 12.4 %
Family history of MI: 16.7 %
Current smokers: 10.2 %
Walk/bicycle = 40 min/day: 35.9 %
Exercise = 2 h/week: 52.6 %
Aspirin use = 7 tablets/week: 9.7 %
Hypertension: 22.3 %
Hypercholesterolemia: 7.8 %
Diabetes: 6 %
Atrial fibrillation: 1.1 %
mDASH diet score: 22.1
Former Drinkers
Participants: n 908
Age: 62.3 years
BMI: 25.4 kg/m2
Postsecondary education: 14.3 %
Family history of MI: 19.7 %
Current smokers: 38 %
Walk/bicycle = 40 min/day: 35.3 %
Exercise = 2 h/week: 52.2 %
Aspirin use = 7 tablets/week: 12.7 %
Hypertension: 26.4 %
Hypercholesterolemia: 7.6 %
Diabetes: 7.7 %
Atrial fibrillation: 2.2 %
mDASH diet score: 21.8
<1 drink/week
Participants: n 8076
Age: 63.2 years
BMI: 25.4 kg/m2
Postsecondary education: 15 %
Family history of MI: 17.3 %
Current smokers: 21.4 %
Supplementary material Heart
doi: 10.1136/heartjnl-2019-315499–731.:724 106 2020;Heart, et al. Butler T

Walk/bicycle = 40 min/day: 37.6 %
Exercise = 2 h/week: 55.6 %
Aspirin use = 7 tablets/week: 9.4 %
Hypertension: 21.6 %
Hypercholesterolemia: 8.4 %
Diabetes: 4.8 %
Atrial fibrillation: 1.1 %
mDASH diet score: 22.5
1-6 drinks/week
Participants: n 16,382
Age: 59.6 years
BMI: 24.7 kg/m2
Postsecondary education: 21.5 %
Family history of MI: 16.4 %
Current smokers: 24.5 %
Walk/bicycle = 40 min/day: 35.9 %
Exercise = 2 h/week: 58.9 %
Aspirin use = 7 tablets/week: 8.2 %
Hypertension: 19.3 %
Hypercholesterolemia: 7.6 %
Diabetes: 2.7 %
Atrial fibrillation: 1 %
mDASH diet score: 22.9
7-14 drinks/wk
Participants: n 3628
Age: 57.6 years
BMI: 24.5 kg/m2
Postsecondary education: 28.4 %
Family history of MI: 16.1 %
Current smokers: 31.1 %
Walk/bicycle = 40 min/day: 36 %
Exercise = 2 h/week: 57.5 %
Aspirin use = 7 tablets/week: 9.6 %
Hypertension: 18.4 %
Hypercholesterolemia: 6.7 %
Diabetes: 2.3 %
Atrial fibrillation: 0.9 %
mDASH diet score: 22.6
15-21 drinks/wk
Participants: n 609
Age: 56.9 kg/m2
BMI: 24.5 kg/m2
Postsecondary education: 34.5 %
Family history of MI: 17.1 %
Current smokers: 36 %
Supplementary material Heart
doi: 10.1136/heartjnl-2019-315499–731.:724 106 2020;Heart, et al. Butler T

Walk/bicycle = 40 min/day: 37.2 %
Exercise = 2 h/week: 56.4 %
Aspirin use = 7 tablets/week: 7.2 %
Hypertension: 16 %
Hypercholesterolemia: 7.8 %
Diabetes: 1.5 %
Atrial fibrillation: 0.7 %
mDASH diet score: 22.2
>21 drinks/wk
Participants: n 293
Age: 58 years
BMI: 25 kg/m2
Postsecondary education: 29.4 %
Family history of MI: 17.8 %
Current smokers: 39.7 %
Walk/bicycle = 40 min/day: 31.6 %
Exercise = 2 h/week: 48.4 %
Aspirin use = 7 tablets/week: 10.2 %
Hypertension: 20.5 %
Hypercholesterolemia: 7.6 %
Diabetes: 5.5 %
Atrial fibrillation: 1.2 %
mDASH diet score: 21.7
O’Neill et al.[43]
Initially participant records 62,799.
19,277 participants were excluded
due to attrition or having experienced
a CHD event prior to the study
baseline. 8390 participants were not
included due to incomplete data
linkage.
Total participants: n 35,132
62.1% male
EPIC-N
Record count: 7462
Age: 68.3 ± 8.0 years
Male: 42.5 %
Non smoker: 50.3 %
Current smoker: 4.4%
Ex-smoker: 43.9 %
Unknown: 1.4 %
BMI: 25.7 ± 3.6 kg/m2
High blood pressure: 29.2 %
Drinker type:
Consistent non-drinker: 5.7 %
Meta-analysis of six cohort studies using
individual participant data.
Participants taken from 5 British cohort
studies: the European Prospective
Investigation of Cancer, Norfolk Cohort
(EPIC-N); the Medical Research Council’s National Survey of Health and Development
1946 (NSHD); West of Scotland Twenty-07:
1930s (T07-1930s); West of Scotland
Twenty-07: 1950s (T07-1950s) and
Whitehall II (WII) and an additional French
cohort: Gaz et Electricité (GAZEL)
Participants grouped based on weekly alcohol
intake:
Consistent non-drinker: 0 g at each wave of
data collection;
Former drinker 0 g at last wave but intake >0
g at any earlier wave;
Consistently moderate Male: 1–168 g at each
wave, Female: 1–112 g at each wave;
Primary outcome was CHD incidence, determined from
linked health records and survey data. Secondary
outcomes included CHD mortality.
CHD events included ICD-9: 410-414 and ICD-10: I20-
I25. Non-fatal CHD events were identified using the
Royal College of General Practitioners’ codebook (codes 1940, 1945 and 195
Survival time was calculated for all participants as time
(in years) between the end of the alcohol assessment
period and date of CHD event, death from non-CHD
causes, study dropout or last date of data linkage (study
specific), whichever occurred first.
Initial model accounting weekly alcohol intake and for
age, sex and intake assessment interval, followed by an
extended model that additionally included smoking status
(no smoker, current smoker, ex- smoker, unknown) and
socioeconomic status (high position, intermediate, low,
unknown) covariates. Additional clinical data were
obtained on BMI and self-reported high blood pressure
or use of antihypertensive medication. All covariates
In pooled analysis, 4.9% of total
participants experienced an incident
(fatal or non-fatal) CHD event after a
median follow-up of 12.6 ± 4.3 years
0.9% of participants died due to CHD
(mean follow-up 13.7 ± 4.1 years).
With alcohol defined according to a
single intake measurement (none,
moderate, or heavy), there was no
significance difference in risk of
incident CHD between moderate and
heavy consumers. Those identified as
“none” had a significantly increased risk in comparison to those who drank
within recommended amounts (HR
1.29; 95% CI: 1.11, 1.43)
In comparison to consistent moderate
drinkers, consistent non-drinkers,
former drinkers, and inconsistent
moderate drinkers had an increased risk
Supplementary material Heart
doi: 10.1136/heartjnl-2019-315499–731.:724 106 2020;Heart, et al. Butler T

Former drinker: 22.6 %
Consistent moderate drinker: 43.8 %
Inconsistent moderate drinker: 7.1 %
Consistent heavy drinker: 3.0 %
Inconsistent heavy drinker: 4.0 %
Unknown: 13.8 %
Intake interval: 12.9 ± 1.9
GAZEL
Record count: 14,247
Age: 57.4 ± 3.5 years
Male: 74.1 %
Non smoker: 69.9 %
Current smoker: 13.1%
Ex-smoker: 13.1 %
Unknown: 3.9 %
BMI: 25.8 ± 3.6 kg/m2
High blood pressure: 26.9 %
Drinker type:
Consistent non-drinker: 5.6 %
Former drinker: 9.4 %
Consistent moderate drinker: 31.1%
Inconsistent moderate drinker: 18.8
%
Consistent heavy drinker: 11.5 %
Inconsistent heavy drinker: 9.7 %
Unknown: 13.9 %
Intake interval: 10.0 ± 0.1
NSHD (1946)
Record count: 2979
Age: 53.3 ± 1.1 years
Male: 49.2 %
Non smoker: 25.7 %
Current smoker: 36.7 %
Ex-smoker: 35.8 %
Unknown: 1.9 %
BMI: 27.4 ± 4.8 kg/m2
High blood pressure: 66.8 %
Drinker type:
Consistent non-drinker: 7.0 %
Former drinker: 9.4 %
Consistent moderate drinker: 19.8 %
Inconsistent moderate drinker: 20.0
%
Consistent heavy drinker: 3.1 %
Inconsistent heavy drinker: 8.1 %
Unknown: 32.5 %
Inconsistently moderate Male: 1–168 g for
most but not all waves, Female: 1–112 g for
most but not all waves;
Consistently heavy Male: >168 g at each
wave, Female: >112 g at each wave
Inconsistently heavy Male: >168 g for most
but not all waves
Female: >112 g for most but not all waves
Age-stratified modelling of the longitudinal
drinker typology was also performed between
participants aged ≤55 vs >55 years at this
study’s baseline to compare associations with the incident CHD outcome
A single one-off measure of alcohol intake
was analyzed (none, moderate or heavy
consumption)
were assessed at the commencement of the follow-up
period for all CHD during follow up, all CHD person
years, fatal CHD during follow up, and fatal CHD person
year.
of incident CHD (HR 1.47; 95% CI:
1.21, 1.78; 1.31; 95% CI: 1.13, 1.52;
and 1.18; 95% CI: 1.02, 1.37,
respectively). These relationships were
attenuated when BMI, and hypertension
were included in the model
When analysed according to age (up to
55 years or above 55 years), consistent
non-drinkers aged <55 years and former
drinkers showed increased risk of CHD
compared to consistent moderate
drinkers (HR 1.97; 95% CI: 1.29, 3.02;
HR 1.60; 95% CI: 1.09, 2.37,
respectively).
In those aged >55, consistent non-
drinkers, former drinkers, and
inconsistent moderate drinkers all
displayed increased risk of CHD (HR
1.38; 95% CI: 1.11, 1.71, HR 1.27; 95%
CI: 1.08, 1.51, and HR 1.25; 95% CI:
1.06, 1.48, respectively).
In men, former drinkers were at
significantly greater risk of incident
CHD compared to consistently
moderate drinkers after maximal
adjustment for confounding factors (HR
1.29; 95% CI: 1.06, 1.56).
In women, former drinkers (HR 1.38;
95% CI: 1.07, 1.78) and consistent non-
drinkers (HR 1.91; 95% CI: 1.43, 2.55) showed increased risk compared to their
consistently moderate intake
counterparts
With fatal CHD as the outcome, similar
relationships were observed. Non-
drinkers had a significantly increased
risk of fatal CHD in comparison to
moderate drinkers (HR 1.44; 95% CI:
1.08, 1.93). No association was
observed for heavy drinkers.
Supplementary material Heart
doi: 10.1136/heartjnl-2019-315499–731.:724 106 2020;Heart, et al. Butler T
Intake interval: 17.0 ± 0.0
T07 (1930s)
Record count: 869
Age: 64.4 ± 1.2 years
Male: 42.6 %
Non smoker: 36.0 %
Current smoker: 31.3%
Ex-smoker: 32.0 %
Unknown: 0.7 %
BMI: 26.7 ± 4.4 kg/m2
High blood pressure: 17.5 %
Drinker type:
Consistent non-drinker: 13.6 %
Former drinker: 10.7 %
Consistent moderate drinker: 21.7 %
Inconsistent moderate drinker: 16.2
%
Consistent heavy drinker: 3.0 %
Inconsistent heavy drinker: 4.7 %
Unknown: 30.4 %
Intake interval: 8.2 ± 1.0
T07 (1950s)
Record count: 1002
Age: 45.2 ± 1.2 years
Male: 44.3 %
Non smoker: 41.5 %
Current smoker: 34.4 %
Ex-smoker: 23.6 %
Unknown: 0.5 %
BMI: 26.4 ± 4.6 kg/m2
High blood pressure: 5.4 %
Drinker type:
Consistent non-drinker: 8.7 %
Former drinker: 9.3 %
Consistent moderate drinker: 25.7 %
Inconsistent moderate drinker: 17.6
%
Consistent heavy drinker: 3.0 %
Inconsistent heavy drinker: 7.4 %
Unknown: 26.8 %
Intake interval: 9.1 ± 1.0
WII
Record count: 8573
Age: 55.7 ± 6.0 years
Male: 67.8 %
In contrast to CHD incidence,
inconsistent moderate drinkers did not
have an increased risk of fatal CHD
(HR 1.04; 95% CI: 0.72, 1.52). Only
former drinkers displayed a
significantly elevated risk (HR 1.54;
95% CI: 1.07, 2.22). The HR was
similar for non-consistent and former
drinkers (1.52 and 1.54, respectively).
Increased risk was not observed in
inconsistent moderate, heavy, or
inconsistent heavy drinkers although
CIs were large in the latter group.
Only women consistent non-drinkers
displayed a significantly increased risk
of fatal CHD (HR 2.62; 95% CI: 1.25,
5.49)
Summary
This meta-analysis suggests that risk
of CHD is higher in those who either
never consume alcohol or used to
consume alcohol, in comparison to
those with moderate consumption in
line with Government
recommendations. Those individuals
who drank moderately, but were
inconsistent, also had higher risk of
CHD suggesting that this may relate
to patterns of intake i.e. binge
drinking. Collectively, these data
show consistency is important. In his
study drinking trajectories were
based on volume and researchers
were not able to examine the effects
of heavy drinking episodes. For
accurate determination of the role
alcohol has in CVD/CHD risk,
patterns of consumption, type,
volume all should be considered.
This finding suggests that the absence
of an effect in heavy drinkers should
be interpreted with caution, given the
known risk associate with large
alcohol consumption and that the
adherence for low alcohol could have
Supplementary material Heart
doi: 10.1136/heartjnl-2019-315499–731.:724 106 2020;Heart, et al. Butler T

Non smoker: 38.7 %
Current smoker: 8.3 %
Ex-smoker: 31.4 %
Unknown: 21.6 %
BMI: 26.1 ± 3.9 kg/m2
High blood pressure: 17.2 %
Drinker type:
Consistent non-drinker: 5.9 %
Former drinker: 6.8 %
Consistent moderate drinker: 31.2 %
Inconsistent moderate drinker: 17.8
%
Consistent heavy drinker: 3.0 %
Inconsistent heavy drinker: 6.3 %
Unknown: 25.8 %
Intake interval: 11.2 ± 0.8
health benefits in reducing long term
CHD
Leong et al.[44] Initially participant records: 12,461
Individuals with a first MI; 14,637
Hospital controls: 58 %
Community controls: 36 %
Other: 3 % of controls (World Health
Organization’s Monitoring of Trends and Determinants in Cardiovascular
Disease -MONICA study and an
undocumented source).
Excluded 54 controls and 266 cases
due to missing records on alcohol
consumption.
Analysis sample: 12,195 cases and
14,583 controls.
Cases:
Total participants: n 12,195
Age: 58 ± 12 years
Male: 76 %
Geographic region
Western Europe: 5 %
Eastern and Central Europe: 14 %
Middle East: 13 %
Africa: 4 %
South Asia: 14 %
China and Hong Kong: 25 %
Southeast Asia and Japan: 8 %
Case–control study on patterns of alcohol
consumption and risk of MI.
Data obtained from MI undertaken in from
52 countries in Asia, Europe, the Middle
East, Africa, Australia, and North and South
America.
Alcohol exposure was characterised by
asking the frequency of alcohol beverage
consume: <1 time per month, <1 time per
week, 1–2 times per week, 3–4 times per
week, 5–6 times per week. Daily Alcohol use
was defined as the consumption of ≥1 alcoholic beverage within the previous 12
months. It was also asked how many
alcoholic beverages were consumed in the 24
hours before the onset of MI symptoms and
in the period 24 to 48 hours before the onset
of MI symptoms. Heavy episodic drinking:
≥6 alcoholic drinks within 24 hours before
MI.
Also assessed if a period of heavy drinking
may act as a trigger for acute MI. Time for
trigger was identified as 24 hours prior to MI.
24 – 48 hours prior to MI was considered as
control
Primary outcome was risk of MI
Information on age, ethnicity, dietary patterns, physical
activity, tobacco use, marital status, education,
employment, psychosocial factors and cardiovascular
risk factors was obtained. Height, weight, waist, and hip
circumference were measured in a standardized manner.
Serum TC, HDL-C, TAG, and ApoB and A1
concentrations were measured in a core laboratory; low-
density LDL-C concentration was calculated from these
measurements. Smoking was classified as current, former
(no smoking within the previous year), or never. Marital
status was considered single, married/common-law
partner, separated/ divorced, and widowed. Participants’ highest level of education was categorised as less than
grade 9, grades 9 to 12, or university/ college/ trade
school.
Logistic regression was used to evaluate the relationship
between MI and alcohol use to account for the paired
recruitment of cases and controls within ±5 years of age
of each other. The effect of alcohol exposure
was adjusted for Dietary Risk score, exercise, smoking,
marital status, employment, education level, depression,
stress at work or at home, and financial stress
Analysis was stratified by geographic region, and the
estimates for each region were meta-analysed.
Alcohol consumption within the
previous year was associated with a
significantly lower risk of MI. The
fully-adjusted OR was 0.87 (95% CI:
0.80, 0.94; P=0.001).
Subgroup analysis based sex suggested
a lower risk of MI in women (OR 0.73;
95% CI: 0.61, 0.78; P<0.001) but not
men.
The protective association of alcohol
against MI was greater in individuals
≥45 years of age. For those aged 45-65
years the OR was 0.85 (95% CI: 0.76,
0.95) and for those aged >65 years the
OR was 0.87 (95% CI: 0.75, 1.01).
Alcohol use in European/North
America/Australian/New Zealand
populations was associated with a lower
risk of MI (OR 0.71; 95% CI: 0.59,
0.85). In South Asian populations this
was associated with increased risk (OR
1.4, 95% CI: 1.1, 1.8). Country-base
analysis indicated respective ORs for
Sri Lanka, Pakistan, Nepal, India, and
Bangladesh of 1.4 (95% CI: 0.30, 6.6),
1.2 (95% CI: 0.61, 2.2), 0.85 (95% CI:
0.42, 1.7), 1.3 (95% CI: 0.80, 2.1), and
Supplementary material Heart
doi: 10.1136/heartjnl-2019-315499–731.:724 106 2020;Heart, et al. Butler T

Australia and New Zealand: 5 %
South America and Mexico: 10 %
North America: 2 %
Consumed alcohol in previous year:
45 %
Current smoker: 45 %
N cigarettes smoked per day among
ever smokers
<20: 43 %
≥20: 57 %
Diabetes mellitus: 18 %
Hypertension: 39 %
Daily fruit or vegetable consumption:
80 %
Dietary Risk score: −4.1 ± 5.4
Undertakes leisure-time exercise: 15
%
Home or work stress
None: 25 %
Some periods: 48 %
Several periods: 19 %
Permanent: 8 %
Financial stress
Little or none: 44 %
Moderate: 41 %
Severe: 15 %
Depressed: 8 %
Marital status
Never: 3 %
Married/common-law partner: 82 %
Separated/divorced: 4 %
Widowed: 11 %
Education
<Grade 9: 45 %
Grade 9–12: 26 %
>Grade 12: 29 %
Employment
Employed: 50 %
Retired: 35 %
Unemployed: 6 %
Home duties: 9 %
BMI: 26.1 ± 4.15 kg/m2
Waist-to-hip ratio: 0.93 ± 0.084
ApoB: 0.95 (0.78–1.1) mmol/L
ApoA1: 1.1 (0.96–1.3) mmol/L
ApoB/ApoA1 ratio: 0.86 (0.70–1.1)
Total cholesterol: 5.2 (4.4–6.0)
mmol/L
Models adjusted for age (categorized as <45, 45–65, and
>65 years), sex, geographic region, dietary Risk score,
exercise, smoking, marital status, employment, education
level, depression, stress at work or at home, financial
stress, body mass index, waist-to-hip ratio, serum ratio of
ApoB to ApoA1; TC, HDL-C, LDL-C, and TAG
concentrations, and history of hypertension or diabetes
mellitus.
1.0 (95% CI: 0.40, 2.7). In participants
of South Asian origin living outside of
the South Asian countries, the OR for
MI with alcohol use was 0.80 (95% CI:
0.53, 1.2; P=0.3).
The inverse association between alcohol
intake and MI was absent when alcohol
intake exceeded >4 times/week.
Compared with non-drinkers, ORs for
<1x/week, 1-4x/week and >4x/week
were 0.89 (95% CI: 0.81, 0.96), 0.84
(95% CI: 0.75-0.94), and 0.88 (95% CI:
0.76, 1.01), respectively.
Consuming any alcohol in the hazard
period (up to 24 hours prior to MI) was
not associated with increased MI risk
(OR 1.0; 95% CI: 0.91, 1.2; P=0.7).
Heavy drinking (≥6 drinks) during the hazard period was associated with
increased risk of MI (OR 1.4; 95% CI:
1.1, 1.9; P=0.001). Using sex-specific
definition of heavy drinking (≥5 drinks for men and (≥4 drinks for women) showed similar associations (OR 1.4;
95% CI: 1.2, 1.8; P=0.001). The
association between heavy drinking and
risk of MI was more pronounced in
those aged over 45 years; ORs for those
<45, 45–65, and >65 years of age were
0.84 (95% CI: 0.51, 1.4; P=0.5), 1.6
(95% CI: 1.1, 2.2; P=0.01), and 5.3
(95% CI: 1.6, 18; P=0.008).
Summary
In this study moderate alcohol intake
was inversely associated with risk of
MI in most geographical locations
studied, however alcohol intake was
positively associated with risk of MI
in South Asian populations. Small
quantities of alcohol in the 24 hour
period prior to MI did not appear to
be associated with increase of MI.
However heavy drinking was
associated with increased risk,
Supplementary material Heart
doi: 10.1136/heartjnl-2019-315499–731.:724 106 2020;Heart, et al. Butler T

HDL-C: 0.99 (0.82–1.2) mmol/L
LDL-C: 3.3 (2.7–4.0) mmol/L
TAG: 1.6 (1.1–2.3) mmol/L
Controls
Total participants: n 14,583
Age: 57 ± 12 years
Male: 74 %
Geographic region
Western Europe: 5 %
Eastern and Central Europe: 13 %
Middle East: 12 %
Africa: 5 %
South Asia: 15 %
China and Hong Kong: 21 %
Southeast Asia and Japan: 8 %
Australia and New Zealand: 5 %
South America and Mexico: 13 %
North America: 3 %
Consumed alcohol in previous year:
47 %
Current smoker: 26 %
N cigarettes smoked per day among
ever smokers
<20: 57 %
≥20: 43 %
Diabetes mellitus: 7 %
Hypertension 7 %
Daily fruit or vegetable consumption:
85 %
Dietary Risk score: −5.3 ± 5.4
Undertakes leisure-time exercise: 23
%
Home or work stress
None: 27 %
Some periods: 53 %
Several periods: 16 %
Permanent: 4 %
Financial stress
Little or none: 49 %
Moderate: 39 %
Severe: 12 %
Depressed: 7 %
Marital status
Never: 5 %
Married/common-law partner: 82 %
Separated/divorced: 4 %
Widowed: 9 %
especially in older individuals, and is
supported by mechanistic work that
shows increases in blood pressure and
clotting following a heavy drinking
episode.
Supplementary material Heart
doi: 10.1136/heartjnl-2019-315499–731.:724 106 2020;Heart, et al. Butler T

Education
<Grade 9: 38 %
Grade 9–12: 25 %
>Grade 12: 37 %
Employment
Employed: 55 %
Retired: 31 %
Unemployed: 5 %
Home duties: 9 %
BMI: 25.8 ± 4.15 kg/m2
Waist-to-hip ratio: 0.91 ± 0.084
ApoB: 0.90 (0.76–1.1) mmol/L
ApoA1: 1.2 (1.0–1.4) mmol/L
ApoB/ApoA1 ratio: 0.75 (0.60–0.93)
TC: 5.1 (4.3–5.9) mmol/L
HDL-C: 1.0 (0.82–1.3) mmol/L
LDL-C: 3.1 (2.5–3.8) mmol/L
TAGs: 1.6 (1.1–2.4) mmol/L
Wood et al.[45]
Total participants: n 599,912
Total sample in analysis: 83 studies
Age: 57 ± 9 years
Male: 56 %
Current smoker: 21 %
Emerging Risk Factors Collaboration
Assessment period: June 2017
Initial sample: 142 studies, 2,334,435
participants.
Sample excluded due to missing
information available on drinking
status, drinking amount, plus-age,
sex, history of diabetes and smoking,
baseline of CVD, 1 year of follow-up,
non or ex-drinkers at baseline survey.
Analysis sample: 81 studies
Total participants: n 247,504
Age: 57.1 (8.7) years
Male: 66 %
Smoking status
Not current: 65 %
Current: 35 %
Diabetes: 4 %
BMI: 26.1 (3.8) km/m2
HDL-C: 1.40 (0.41) mmol/L
TC: 5.8 (1.7) mmol/L
SBP: 136.5 (19.0) mmHg
Data from three large-scale data sources:
Emerging Risk Factors Collaboration
(EFRC), EPIC-CVD, and the UK Biobank.
Baseline alcohol consumption was
categorised into eight predefined groups
according to the amount in grams consumed
per week: >0–≤25, >25–≤50, >50–≤75, >75–≤100, >100–≤150, >150–≤250, >250–≤350, and >350 g per week. Data were harmonised
across the contributing studies using a
conversion of 1 unit=8 g of pure alcohol to a
standard scale of grams per week, enabling a
common analytical approach despite
variation in the methods used (e.g., self-
administered vs interview-led questionnaires;
food frequency questionnaires vs dietary
recall surveys), and in consumption scales
over different periods of ascertainment.
Alcohol type (wine, beer, and spirits),
consumption frequency (≤2 days per week or >2 days per week) and episodic heavy
drinking (binge drinkers ≥100 g per drinking
occasion or non-binge drinkers <100 g per
drinking occasion) were investigated.
Primary outcomes was association between alcohol
intake and all-cause mortality, total CVD, and specific
CV subtypes (stroke, MI, CHD, HF and other CV deaths)
HRs were adjusted for usual levels of available potential
confounders or mediators: body-mass index (BMI); SBP;
HDL-C; LDL-C; TC; fibrinogen; baseline measures for
smoking amount (in pack-years); level of education
reached (no schooling or primary education only vs
secondary education vs university); occupation (not
working vs manual vs office vs other); self-reported
physical activity level (inactive vs moderately inactive vs
moderately active vs active); self-reported general health
(scaled 0–1 where low scores indicate poorer health);
self-reported red meat consumption; self-reported use of
anti-hypertensive drugs.
40,310 deaths from all-causes,
(including 11,762 vascular and 15,150
neoplastic deaths)39,018 first incident
CVD outcomes, including 12,090 stroke
events, 14,539 MI events, 7990
coronary disease events excluding MI,
2711 HF events, and 1121 deaths from
other CVDs.
Approximately 50% reported drinking
more than 100 g of alcohol per week,
and 8.4% drank more than 350 g per
week.
Baseline alcohol consumption was
positively correlated with male sex,
smoking status and amount, systolic
blood pressure, HDL-C level,
fibrinogen, and lower socioeconomic
status with a median 96 g/week.
A positive, curvilinear association
between alcohol intake and all-cause
mortality was observed, with lowest risk
in those consuming <100 g/week.
With all CVD outcomes as an outcome,
a J-shaped relationship existed.
However subgroup analysis suggested
Supplementary material Heart
doi: 10.1136/heartjnl-2019-315499–731.:724 106 2020;Heart, et al. Butler T
Weekly alcohol consumption: 87·7
(2.2–522.4) g/week
>0–≤25 g per week: 22 %
>25–≤50 g per week: 14 %
>50–≤75 g per week: 11%
>75–≤100 g per week: 7 %
>100–≤150 g per week: 15%
>150–≤250 g per week: 13 %
>250–≤350 g per week: 10 %
≤350 g per week: 10 %
EPIC-CVD
Assessment period: April 2018
Initial sample: 23 European centres
from 10 countries involving 35,455
participants.
Sample excluded due to missing
information available on drinking
status, drinking amount, plus-age,
sex, history of diabetes and smoking,
baseline of CVD, 1 year of follow-up,
non or ex-drinkers at baseline survey.
Analysis sample: 22 European
centres from 9 countries
Total participants: n 26,036
Weekly alcohol consumption: 61.9
(2.6–404.0) g/week
>0–≤25 g per week: 30 %
>25–≤50 g per week: 14 %
>50–≤75 g per week: 11 %
>75–≤100 g per week: 9 %
>100–≤150 g per week: 10%
>150–≤250 g per week: 12 %
>250–≤350 g per week: 7 %
≤350 g per week: 7 %
UK Biobank
Assessment period: May 2017
Initial sample: 502,627 participants.
Sample excluded due to missing
information available on drinking
status, drinking amount, plus-age,
sex, history of diabetes and smoking,
baseline of CVD, 1 year of follow-up,
non or ex-drinkers at baseline survey.
Total participants: n 326,372
Weekly alcohol consumption: 103.9
(11.8–420.8) g/week
Cumulative survival from 40 years of age
onwards in different categories of baseline
alcohol consumption were also calculated.
Results were modelled from age 40 years and
enabled estimation of years of life lost
between light drinkers (defined as those
consuming >0–≤100 g/week of alcohol) and pre-defined groups of >100–≤200, >200–≤350, and >350 g per week.
different associations between alcohol
intake and types of CVD.
The relationship between alcohol intake
and all-cause mortality was greater in
those who consumed more beer or
spirits as opposed to wine, and in those
drinking alcohol less frequently (i.e.
binge drinkers). Similar observations
were seen for CVD and subtypes,
although to a lesser extent.
Compared with the 0-25 g/week,
alcohol consumed had positive and
linear associations with stroke (HR per
100 g/week higher consumption 1.14;
95% CI: 1.10, 1.17), coronary disease
excluding MI (1.06; 95% CI: 1.00,
1.11), HF (1.09; 95% CI: 1.03, 1.15),
fatal hypertensive disease (1.24; 95%
CI: 1.15, 1.33), and fatal aortic
aneurysm (1.15; 95% CI: 1.03, 1.28).
For MI, there was an inverse log-linear
relationship (0.94; 95% CI: 0.91, 0.97).
In comparison to those who reported
drinking >0–≤100 g (mean usual 56 g) alcohol per week, those who reported
drinking >100–≤200 g (mean usual 123 g) per week, >200–≤350 g (mean usual
208 g) per week or >350 g (mean usual
367 g) per week had shorter life
expectancy at age 40 years of
approximately 6 months, 1–2 years, or
4–5 years respectively.
Men who reported consuming above the
UK upper limit of 112 g per week had a
shorter life expectancy at age 40 years
of 1.6 years (95% CI: 1.3, 1.8),
compared with men who reported
drinking below these respective upper
limits. Thus, men who reported drinking
less than 100 g alcohol per week had
approximately a 1–2 years longer life
expectancy at age 40 years than those
who reported drinking 196 g per week.
Supplementary material Heart
doi: 10.1136/heartjnl-2019-315499–731.:724 106 2020;Heart, et al. Butler T

>0–≤25 g per week: 12 %
>25–≤50 g per week: 12 %
>50–≤75 g per week: 13 %
>75–≤100 g per week: 11 %
>100–≤150 g per week: 17%
>150–≤250 g per week: 18 %
>250–≤350 g per week: 8 %
≤350 g per week: 8 %
Women who reported drinking above
either the UK threshold (112 g per
week) had approximately 1.3 (1.1, 1.5)
years shorter life expectancy at age 40
years compared with women who
reported drinking below these
thresholds.
Summary
This study showed that among
current drinkers, the threshold for
lowest risk of all-cause mortality was
approximately 100 g per week. No
clear thresholds were found for CVD
subtypes other than MI. Importantly
this study suggests different
relationships between alcohol and
subtypes of CVD, in part mediated by
changes in risk factors. For example,
alcohols known stimulatory effect on
BP may explain the positive
relationship between alcohol intake
and stroke, but the HDL-C-raising
effect may account for the inverse
association with risk of MI. As with
other studies of this type, results are
limited by the nature of how alcohol
intake was determined (self-reported)
and the potential for reverse
causality.
These data support adoption of lower
limits of alcohol consumption than
are recommended in most current
guidelines.
Supplementary material Heart
doi: 10.1136/heartjnl-2019-315499–731.:724 106 2020;Heart, et al. Butler T

Online Supplementary Table 3 Whole diet approaches to be considered for CVD prevention
Study Participant characteristics Study Design Measures and time points Key observations
Li et al.[46] Total participants: n 4398
2258 from Nurses’ Health study (NHS)
and 1840 men from Health Professional
Follow-Up study (HPFS)
Included men and women who were
free of CVD, stroke, or cancer at the
time of enrolment, survived a first MI
during follow-up, and had no history of
stroke at the time of initial MI onset
Women
Q1
Participants: n 439
Age at diagnosis: 64.7 ± 8.7 years
BMI: 27.2 ± 6.1 kg/m2
Physical activity: 8.4 ± 15.6 MET h/wk
Never smoked: 32 %
Past smoker:48 %
Current smoker: 20 %
Diabetes: 23 %
High blood pressure: 69 %
Elevated cholesterol: 68 %
Lipid-lowering medication: 43 %
CABG Surgery: 52 %
Q3
Participants: n 476
Age at diagnosis: 64.8 ± 8.6 years
BMI: 27.0 ± 5.5 kg/m2
Physical activity: 15.1 ± 20.3 MET
h/wk
Never smoked: 33 %
Past smoker: 55 %
Current smoker: 11 %
Diabetes: 22 %
High blood pressure: 68 %
Elevated cholesterol: 77 %
Lipid-lowering medication: 50 %
Prospective cohort design
Participants taken from Nurses' Health
Study the Health Professional Follow-
Up Study
Participants grouped into quintiles of
AHEI2010
Women
Q1:
AHEI2010
Post-MI: 38.9 ± 4.5
Pre-MI: 42.8 ± 8.6
1716 ± 511 kcal/d, SFA 10.4 ± 3.0 %
total energy, omega 3 fats 0.6 ± 0.2 %
total energy, TFA 1.8 ± 0.7 % total
energy, alcohol 4.2 ± 12.8 g/d, folate
intake 404 ± 196 µg/d, cereal fibre 5.0 ±
2.5 g/d
red and processed meats 1.3 ± 0.9
servings/d, nuts and legumes 0.3 ± 1.3
servings/d, sugar-sweetened beverages
1.5 ± 1.1 servings/d, total vegetables 2.3
± 1.3 servings/d, total fruits 1.1 ± 0.8
servings/d, fruit juice 1.0 ± 0.8
servings/d
Q3:
AHEI2010
Post-MI: 53.6 ± 1.6
Pre-MI: 51.45 ± 8.5
1579 ± 520 kcal/d, SFA 9.1 ± 2.7 % total
energy, omega 3 fats 0.7 ± 0.2 % total
energy, TFA 1.4 ± 0.6 % total energy.
alcohol 3.5 ± 7.4 g/d, folate intake 507 ±
268 µg/d, cereal fibre 6.1 ± 2.7 g/d, red
and processed meats 1.0 ± 0.6
servings/d, nuts and legumes 0.3 ± 0.3
Primary outcomes were all-cause and
CVD mortality. CVD mortality was
defined as fatal CHD, and fatal stroke.
Food intakes determined using
validated FFQ every 4 years.
Nutrient content was calculated from
the FFQ using USDA National Nutrient
Database for Standard Reference (v 10-
23)
Diet quality was measured using
Alternative Healthy Eating Index 2010
(AHEI2010)
For each 11 component of AHEI2010,
a maximum score of 10 was given for:
red meat and processed meat (< 1
servings/day), nuts and legume (1
servings/day), sugar-sweetened
beverages and fruit juice (< 1 servings
per month), total vegetables (> 5
servings/day), total fruit (> 4
servings/day), PUFA (> 10% energy),
TFA (< 0.5% energy), alcohol
(women:0.5 – 1.5 drinks/day, men:1.5
– 2.5 drinks/day), long-chain (n-3) fats
(EPA+DHA), 250 mg/day), whole
grains (women: 75 g/day, men: 90
g/day), sodium (lowest decile, mg/d).
A minimum score of 0 was given for:
red meat and processed meat (≥ 1.5 servings/day), nuts and legume (0
servings/day), sugar-sweetened
beverages and fruit juice (≥ 1 servings per day), total vegetables (0
servings/day), total fruit (0
During follow-up, there were 882 all-
cause and 336 CVD deaths for women,
and 451 all-cause and 222 CV deaths
for men.
Median survival time after MI was 8.7
years for women and 9.0 years for men
In women, greater AHEI2010 was
associated with significantly lower all-
cause mortality (HR 0.66; 95% CI:
0.49, 0.88; Ptrend<0.001). This was not
observed in men (HR 0.98; 95% CI:
0.66, 1.44; Ptrend=0.72).
Pooled results suggested increased
adherence to AHEI2010 was associated
with lower all-cause mortality (HR
0.76; 95% CI: 0.60, 0.96; Ptrend=0.02).
During the post-MI period, MI
survivors who were in the fifth quintile
of the AHEI2010 had a better prognosis
A greater increase in the AHEI2010
score from pre- to post-MI was
significantly associated with lower all-
cause (pooled HR 0.71; 95% CI: 0.56,
0.91; Ptrend=0.006) and cardiovascular
mortality (pooled HR 0.60; 95% CI:
0.41, 0.86; Ptrend=0.006)
Removal of alcohol did not significantly
affect the relationship between Post-MI
AHEI2010 and pooled all-cause
mortality (HR 0.73; 95% CI: 0.58, 0.93;
Ptrend=0.01). Removal of alcohol from
the AHEA2010 attenuated the
Supplementary material Heart
doi: 10.1136/heartjnl-2019-315499–731.:724 106 2020;Heart, et al. Butler T
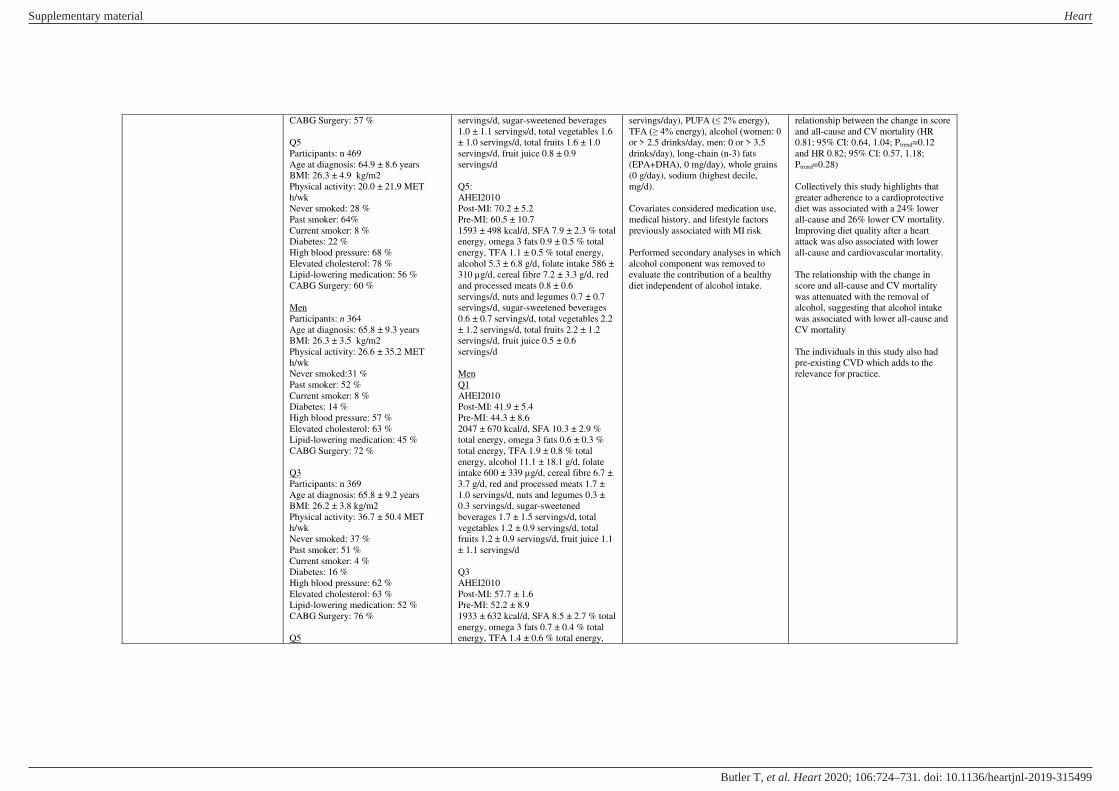
CABG Surgery: 57 %
Q5
Participants: n 469
Age at diagnosis: 64.9 ± 8.6 years
BMI: 26.3 ± 4.9 kg/m2
Physical activity: 20.0 ± 21.9 MET
h/wk
Never smoked: 28 %
Past smoker: 64%
Current smoker: 8 %
Diabetes: 22 %
High blood pressure: 68 %
Elevated cholesterol: 78 %
Lipid-lowering medication: 56 %
CABG Surgery: 60 %
Men
Participants: n 364
Age at diagnosis: 65.8 ± 9.3 years
BMI: 26.3 ± 3.5 kg/m2
Physical activity: 26.6 ± 35.2 MET
h/wk
Never smoked:31 %
Past smoker: 52 %
Current smoker: 8 %
Diabetes: 14 %
High blood pressure: 57 %
Elevated cholesterol: 63 %
Lipid-lowering medication: 45 %
CABG Surgery: 72 %
Q3
Participants: n 369
Age at diagnosis: 65.8 ± 9.2 years
BMI: 26.2 ± 3.8 kg/m2
Physical activity: 36.7 ± 50.4 MET
h/wk
Never smoked: 37 %
Past smoker: 51 %
Current smoker: 4 %
Diabetes: 16 %
High blood pressure: 62 %
Elevated cholesterol: 63 %
Lipid-lowering medication: 52 %
CABG Surgery: 76 %
Q5
servings/d, sugar-sweetened beverages
1.0 ± 1.1 servings/d, total vegetables 1.6
± 1.0 servings/d, total fruits 1.6 ± 1.0
servings/d, fruit juice 0.8 ± 0.9
servings/d
Q5:
AHEI2010
Post-MI: 70.2 ± 5.2
Pre-MI: 60.5 ± 10.7
1593 ± 498 kcal/d, SFA 7.9 ± 2.3 % total
energy, omega 3 fats 0.9 ± 0.5 % total
energy, TFA 1.1 ± 0.5 % total energy,
alcohol 5.3 ± 6.8 g/d, folate intake 586 ±
310 µg/d, cereal fibre 7.2 ± 3.3 g/d, red
and processed meats 0.8 ± 0.6
servings/d, nuts and legumes 0.7 ± 0.7
servings/d, sugar-sweetened beverages
0.6 ± 0.7 servings/d, total vegetables 2.2
± 1.2 servings/d, total fruits 2.2 ± 1.2
servings/d, fruit juice 0.5 ± 0.6
servings/d
Men
Q1
AHEI2010
Post-MI: 41.9 ± 5.4
Pre-MI: 44.3 ± 8.6
2047 ± 670 kcal/d, SFA 10.3 ± 2.9 %
total energy, omega 3 fats 0.6 ± 0.3 %
total energy, TFA 1.9 ± 0.8 % total
energy, alcohol 11.1 ± 18.1 g/d, folate
intake 600 ± 339 µg/d, cereal fibre 6.7 ±
3.7 g/d, red and processed meats 1.7 ±
1.0 servings/d, nuts and legumes 0.3 ±
0.3 servings/d, sugar-sweetened
beverages 1.7 ± 1.5 servings/d, total
vegetables 1.2 ± 0.9 servings/d, total
fruits 1.2 ± 0.9 servings/d, fruit juice 1.1
± 1.1 servings/d
Q3
AHEI2010
Post-MI: 57.7 ± 1.6
Pre-MI: 52.2 ± 8.9
1933 ± 632 kcal/d, SFA 8.5 ± 2.7 % total
energy, omega 3 fats 0.7 ± 0.4 % total
energy, TFA 1.4 ± 0.6 % total energy,
servings/day), PUFA (≤ 2% energy), TFA (≥ 4% energy), alcohol (women: 0 or > 2.5 drinks/day, men: 0 or > 3.5
drinks/day), long-chain (n-3) fats
(EPA+DHA), 0 mg/day), whole grains
(0 g/day), sodium (highest decile,
mg/d).
Covariates considered medication use,
medical history, and lifestyle factors
previously associated with MI risk
Performed secondary analyses in which
alcohol component was removed to
evaluate the contribution of a healthy
diet independent of alcohol intake.
relationship between the change in score
and all-cause and CV mortality (HR
0.81; 95% CI: 0.64, 1.04; Ptrend=0.12
and HR 0.82; 95% CI: 0.57, 1.18;
Ptrend=0.28)
Collectively this study highlights that
greater adherence to a cardioprotective
diet was associated with a 24% lower
all-cause and 26% lower CV mortality.
Improving diet quality after a heart
attack was also associated with lower
all-cause and cardiovascular mortality.
The relationship with the change in
score and all-cause and CV mortality
was attenuated with the removal of
alcohol, suggesting that alcohol intake
was associated with lower all-cause and
CV mortality
The individuals in this study also had
pre-existing CVD which adds to the
relevance for practice.
Supplementary material Heart
doi: 10.1136/heartjnl-2019-315499–731.:724 106 2020;Heart, et al. Butler T

Participants: n 362
Age at diagnosis: 66.0 ± 9.0 years
BMI: 25.3 ± 3.5 kg/m2
Physical activity: 41.2 ± 35.1 MET
h/wk
Never smoked: 39 %
Past smoker: 47 %
Current smoker: 4 %
Diabetes: 12 %
High blood pressure: 50 6%
Elevated cholesterol: 70 %
Lipid-lowering medication: 57 %
CABG Surgery: 79 %
alcohol 8.0 ± 11.5 g/d, folate intake 710
± 357 µg/d, cereal fibre 7.8 ± 3.1 g/d,
red and processed meats 1.4 ± 0.8
servings/d, nuts and legumes 0.5 ± 0.5
servings/d, sugar-sweetened beverages
1.4 ± 1.3 servings/d, total vegetables 2.0
± 1.4 servings/d, total fruits 2.0 ± 1.4
servings/d, fruit juice 1.1 ± 1.1
servings/d
Q5:
AHEI2010
Post-MI: 74.1 ± 5.6
Pre-MI: 63.0 ± 9.0
1889 ± 577 kcal/d, SFA 7.0 ± 2.4 % total
energy, omega 3 fats 1.0 ± 0.6 % total
energy, TFA 1.0 ± 0.5 % total energy,
alcohol 9.7 ± 9.6 g/d, folate intake 838 ±
454 µg/d, cereal fibre 9.6 ± 4.2 g/d, red
and processed meats 1.0 ± 0.7
servings/d, nuts and legumes 1.0 ± 0.9
servings/d, sugar-sweetened beverages
0.8 ± 0.9 servings/d, total vegetables 2.7
± 1.8 servings/d, total fruits 2.7 ± 1.8
servings/d, fruit juice 0.7 ± 0.7
servings/d
Lopez-Garcia et al.[47] Total participants: n 17,415
11,278 from Nurses’ Health study (NHS) and 6137 men from Health
Professional Follow-Up study (HPFS)
Included men and women with non-
fatal CV event
Ethnicity not reported
SBP and DBP not reported
Plasma Glucose not reported
Men
Q1
Participants: n 1586
Age: 68±9 years
BMI: 26.5±3.8 kg/m2
Current smoker: 9%
Physical activity: 27.3±33.8 MET
hrs/wk
Aspirin: 55%
Diuretic: 12%
B-Blocker: 22%
Calcium Channel Blocker: 21%
Prospective cohort design
Participants taken from Nurses' Health
Study the Health Professional Follow-
Up Study
Followed STROBE criteria for reporting
data from observational studies
Participants grouped into quintiles of
alternative Mediterranean Diet Score s
(aMED) score
Men
Q1:
aMED Score 2.19 ± 0.83
SFA 10.3 ± 2.9% total energy, TFA 1.7
± 0.7 % total energy, MUFA 11.6 ± 3.3
% total energy, PUFA 5.4 ± 1.7 % total
energy, omega 3 0.14 ± 0.03 % total
energy, vegetable protein 5.0 ± 1.1 %
total energy, vegetables 1.9 ± 1.1
servings/d, legumes 0.3 ± 0.3
Primary endpoint was death from any
cause, CVD mortality, and cancer
mortality
Food intakes determined using
validated FFQ every 4 years.
Nutrient content was calculated from
the FFQ using USDA National Nutrient
Database for Standard Reference (v 10-
23)
CV events defined as MI, stroke,
angina pectoris, CABG and angioplasty
aMED score calculated by awarding 1
point if intake was above cohort
median for vegetables, legumes, fruit,
nuts, whole-grain cereals, fish, and
MUFAs:SFAs, and 1 point for intake
below cohort median for red and
processed meats. Alcohol intake of 5 to
Following a median follow-up of 7.7
years for mean and 5.8 years for women
there were 1142 and 666 deaths from
CVD in mean and women, respectively.
In men, a higher aMED score was
associated with a significant reduction
in all-cause and cardiovascular
mortality. This relationship was not
observed in women (due to adjustment
for physical activity).
In pooled estimates, greater aMED
scores was associated with decreased
all-cause mortality (Ptrend=<0.001)
A 2-point increased in aMED was
associated with a 7% reduction in risk
of all-cause mortality (0.93; 95% CI:
0.89, 0.9).
Supplementary material Heart
doi: 10.1136/heartjnl-2019-315499–731.:724 106 2020;Heart, et al. Butler T

Other BP medication: 11%
Lipid modifying medication: 24%
Q2
Participants: n 1239
Age: 69 ± 9 years
BMI: 26.3 ± 3.6 kg/m2
Current smoker: 9%
Physical activity: 28.9 ± 32.1 MET
hrs/wk
Aspirin: 46%
Diuretic: 11%
B-Blocker: 19%
Calcium Channel Blocker: 18%
Other BP medication: 9%
Lipid modifying medication: 23%
Q3
Participants: n 1032
Age: 68 ± 8years
BMI: 26.0 ± 3.5kg/m2
Current smoker: 9%
Physical activity: 31.8 ± 31.4 MET
hrs/wk
Aspirin: 60%
Diuretic: 11%
B-Blocker: 21%
Calcium Channel Blocker: 22%
Other BP medication: 10%
Lipid modifying medication: 29%
Q4
Participants: n 938
Age: 69 ± 9 years
BMI: 26.1 ± 3.6kg/m2
Current smoker: 9%
Physical activity: 35.8 ± 37.0 MET
hrs/wk
Aspirin: 52%
Diuretic: 8%
B-Blocker: 19%
Calcium Channel Blocker: 19%
Other BP medication: 7%
Lipid modifying medication: 23%
Q5
Participants: n 1342
Age: 69 ± 8years
servings/day, fruit 1.8 ± 1.1 servings/d,
nuts 0.2 ± 0.3 servings/d, whole grain
0.9 ± 1.0 servings/d, fish 0.2 ± 0.2
servings/d, MUFA:SFA 1.1 ± 0.2, red
and processed meat 0.9 ± 0.7 servings/d,
alcohol 9.0 ± 15.7 g/d.
Q2
aMED Score 3.77 ± 0.39
SFA 9.0 ± 2.7 % total energy, TFA 1.5 ±
0.7 % total energy, MUFA 11.1 ± 3.2 %
total energy, PUFA 5.6 ± 1.7% total
energy, omega 3 0.17 ± 0.19 % total
energy, vegetable protein 5.6 ± 1.2 %
total energy, vegetables 2.5 ± 1.5
servings/d, legumes 0.4 ± 0.3
servings/day, fruit 2.4 ± 1.6 servings/d,
nuts 0.4 ± 0.5 servings/d, whole grain
1.4 ± 1.2 servings/d, fish 0.3 ± 0.2
servings/d, MUFA:SFA 1.2 ± 0.2, red
and processed meat 0.8 ± 0.7 servings/d,
alcohol 9.9 ± 15.3 g/d.
Q3
aMED Score 4.85 ± 0.33
SFA 8.1 ± 2.6% total energy, TFA 1.3 ±
0.6 % total energy, MUFA 10.5 ± 3.3 %
total energy, PUFA 5.6 ± 1.7 % total
energy, omega 3 0.18 ± 0.22% total
energy, vegetable protein 6.0 ± 1.3 %
total energy, vegetables 3.1 ± 1.6
servings/d, legumes 0.5 ± 0.4
servings/day, fruit 2.8 ± 1.6 servings/d,
nuts 0.5 ± 0.6 servings/d, whole grain
1.7 ± 1.4 servings/d, fish 0.4 ± 0.4
servings/d, MUFA:SFA 1.3 ± 0.3, red
and processed meat 0.7 ± 0.7 servings/d,
alcohol 9.5 ± 14.3 g/d.
Q4
aMED Score 5.70 ± 0.43
SFA 8.0 ± 2.6% total energy, TFA 1.3 ±
0.6 % total energy, MUFA 10.6 ± 3.3 %
total energy, PUFA 5.7 ± 1.7 % total
energy, omega 3 0.21 ± 0.23 % total
energy, vegetable protein 6.2 ± 1.4 %
total energy, vegetables 3.8 ± 2.1
servings/d, legumes 0.6 ± 0.5
15 g/d for women and 10 to 15 g/d for
men received 1 point.
Multivariable models were adjusted for
age, BMI, smoking status, physical
activity, parental history of MI before
age 65 y, menopausal status and use of
hormone therapy in women,
multivitamin use, and medication use
(aspirin, diuretics, β-blockers, calcium
channel blockers, angiotensin-
converting enzyme inhibitors, other
antihypertensive medication, statins
and other cholesterol lowering drugs,
insulin, and oral antidiabetic
medication)
Impact of alcohol was assessed by
adjusting for alcohol intake (never,
0.1–4.9, 5.0–14.9, or ≥15.0 g/d) and similarly with olive oil (never or <1
time/mo, 1–3 times/mo, 1 time/wk, or
≥2 times/wk
For men, MUFA:SFA showed an
inverse relationship with mortality. In
women, whole-grain intake,
MUFA:SFA ratio, and moderate alcohol
intake showed an inverse association
Results did not differ when stratified on
BMI (> or < 30 kg/m2) or activity level,
or smoking status.
Adjusting for alcohol intake slightly
attenuated the relationship between
aMED score and all-cause mortality
(pooled adjusted RR for all-cause and
cardiovascular mortality for a 2-point
increase in the aMED score: 0.95 [95%
CI: 0.90, 1.00] and 0.99 [95% CI: 0.89,
1.10], respectively).
Adjustment for olive-oil did not change
the associated between a 2-point
increase in aMED and total and
cardiovascular mortality (0.93; 95% CI:
0.89, 0.98 and 0.97: 95% CI: 0.89, 1.06,
respectively). Only 14.3% of mean and
10.3% of women consumed olive oil ≥2 times/wk.
Summary
Collectively these data show an
association between a reduction in
mortality with increased adherence to
a Mediterranean-style diet in men
and women with a history of CVD.
The lack of effect with individual
components likely suggest a
synergistic effect and reinforces
previous discussions regarding diet
components such as whole grains.
The individuals in this study also had
pre-existing CVD which adds to the
relevance for practice.
Supplementary material Heart
doi: 10.1136/heartjnl-2019-315499–731.:724 106 2020;Heart, et al. Butler T

BMI: 25.7 ± 3.5 kg/m2
Current smoker: 9%
Physical activity: 40.9 ± 38.1 MET
hrs/wk
Aspirin: 50%
Diuretic: 6%
B-Blocker: 19%
Calcium Channel Blocker: 16%
Other BP medication: 8%
Lipid modifying medication: 25%
Women
Q1
Participants: n 2274
Age: 68±9 years
BMI: 26.9 ± 6.6 kg/m2
Current smoker: 16%
Physical activity: 9.4 ± 14.4 MET
hrs/wk
Aspirin: 65%
Diuretic: 14%
B-Blocker: 24%
Calcium Channel Blocker: 17%
ACEi: 11%
Other BP medication: 10%
Statins: 23%
Other lipid modifying medication: 4%
Insulin: 5%
Oral antidiabetic drugs: 6%
Q2
Participants: n 1970
Age: 67 ± 9 years
BMI: 26.7 ± 6.5 kg/m2
Current smoker: 14%
Physical activity: 11.0 ± 18.8 MET
hrs/wk
Aspirin: 68%
Diuretic: 14%
B-Blocker: 26%
Calcium Channel Blocker: 19%
ACEi: 12%
Other BP medication: 8%
Statins: 26%
Other lipid modifying medication: 3%
Insulin: 5%
Oral antidiabetic drugs: 7%
servings/day, fruit 3.1 ± 1.7 servings/d,
nuts 0.5 ± 0.7 servings/d, whole grain
1.9 ± 1.4 servings/d, fish 0.4 ± 0.3
servings/d, MUFA:SFA 1.3 ± 0.3, red
and processed meat 0.68 ± 0.7
servings/d, alcohol 10.4 ± 13.5 g/d.
Q5
aMED Score 7.05 ± 0.79
SFA 7.0 ± 2.0% total energy, TFA 1.2 ±
0.5 % total energy, MUFA 10.4 ± 3.2 %
total energy, PUFA 5.8 ± 1.7 % total
energy, omega 3 0.25 ± 0.26 % total
energy, vegetable protein 6.7 ± 1.4 %
total energy, vegetables 4.5 ± 2.1
servings/d, legumes 0.7 ± 0.6
servings/day, fruit 3.8 ± 1.8 servings/d,
nuts 0.7 ± 0.8 servings/d, whole grain
2.3 ± 1.5 servings/d, fish 0.5 ± 0.3
servings/d, MUFA:SFA 1.5 ± 0.3, red
and processed meat 0.5 ± 0.5 servings/d,
alcohol 11.0 ± 11.6 g/d.
Women
Q1
aMED Score 2.19 ± 0.83
SFA 11.5 ± 3.2% total energy, TFA 1.9
± 0.7 % total energy, MUFA 11.8 ± 3.3
% total energy, PUFA 5.4 ± 1.7 % total
energy, omega 3 0.09 ± 0.12 % total
energy, vegetable protein 4.8 ± 1.2 %
total energy, vegetables 1.6 ± 0.9
servings/d, legumes 1.9 ± 3.3
servings/day, fruit 1.4 ± 1.0 servings/d,
nuts 0.1 ± 0.3 servings/d, whole grain
0.7 ± 1.0 servings/d, 0.1 ± 0.1
servings/d, MUFA:SFA 1.0 ± 0.2, red
and processed meat 0.9 ± 0.8 servings/d,
alcohol 3.6 ± 9.9 g/d.
Q2
aMED Score 3.77 ± 0.39
SFA 10.3 ± 3.2 % total energy, TFA 1.7
± 0.7 % total energy, MUFA 11.5 ± 3.8
% total energy, PUFA 5.6 ± 1.8% total
energy, omega 3 0.11 ± 0.15 % total
energy, vegetable protein 5.3 ± 1.4 %
total energy, vegetables 2.1 ± 1.4
Supplementary material Heart
doi: 10.1136/heartjnl-2019-315499–731.:724 106 2020;Heart, et al. Butler T

Q3
Participants: n 2103
Age: 67 ± 8 years
BMI: 26.5 ± 6.3 kg/m2
Current smoker: 12%
Physical activity: 13.4 ± 16.8 MET
hrs/wk
Aspirin: 67%
Diuretic: 17%
B-Blocker: 26%
Calcium Channel Blocker: 21%
ACEi: 12%
Other BP medication: 10%
Statins: 26%
Other lipid modifying medication: 4%
Insulin: 5%
Oral antidiabetic drugs: 6%
Q4
Participants: n 1978
Age: 67 ± 8 years
BMI: 26.6 ± 6.1 kg/m2
Current smoker: 8%
Physical activity: 14.1 ± 16.9 MET
hrs/wk
Aspirin: 71%
Diuretic: 15%
B-Blocker: 26%
Calcium Channel Blocker: 21%
ACEi: 13%
Other BP medication: 9%
Statins: 26%
Other lipid modifying medication: 3%
Insulin: 5%
Oral antidiabetic drugs: 6%
Q5
Participants: n 2953
Age: 67 ± 8years
BMI: 26.2 ± 5.7 kg/m2
Current smoker: 7%
Physical activity: 18.8 ± 22.4 MET
hrs/wk
Aspirin: 72%
Diuretic: 15%
B-Blocker: 26%
Calcium Channel Blocker: 21%
ACEi: 12%
servings/d, legumes 1.9 ± 3.1
servings/day, fruit 1.9 ± 1.4 servings/d,
nuts 0.2 ± 0.4 servings/d, whole grain
1.0 ± 1.3 servings/d, fish 0.2 ± 0.2
servings/d, MUFA:SFA 1.1 ± 0.3, red
and processed meat 0.8 ± 0.7 servings/d,
alcohol 4.3 ± 9.9 g/d.
Q3
aMED Score 4.85 ± 0.33
SFA 9.7 ± 3.1 % total energy, TFA 1.6 ±
0.7 % total energy, MUFA 11.4 ± 3.9 %
total energy, PUFA 5.6 ± 1.8 % total
energy, omega 3 0.12 ± 0.13 % total
energy, vegetable protein 5.6 ± 1.3 %
total energy, vegetables 2.6 ± 1.5
servings/d, legumes 2.0 ± 3.2
servings/day, fruit 2.3 ± 1.4 servings/d,
nuts 0.3 ± 0.5 servings/d, whole grain
1.3 ± 1.4 servings/d, fish 0.2 ± 0.2
servings/d, MUFA:SFA 1.2 ± 0.3, red
and processed meat 0.8 ± 0.8 servings/d,
alcohol 4.3 ± 9.4 g/d.
Q4
aMED Score 5.70 ± 0.43
SFA 9.0 ± 2.9% total energy, TFA 1.5 ±
0.6 % total energy, MUFA 11.1 ± 3.6 %
total energy, PUFA 5.7 ± 1.8 % total
energy, omega 3 0.15 ± 0.15 % total
energy, vegetable protein 5.9 ± 1.4 %
total energy, vegetables 3.1 ± 1.7
servings/d, legumes 2.1 ±
3.2servings/day, fruit 2.6 ± 1.5
servings/d, nuts 0.4 ± 0.5 servings/d,
whole grain 1.5 ± 1.5 servings/d, fish 0.3
± 0.3 servings/d, MUFA:SFA 1.2 ± 0.3,
red and processed meat 0.7 ± 0.6
servings/d, alcohol 4.0 ± 8.1 g/d.
Q5
aMED Score 7.05 ± 0.79
SFA 8.0 ± 2.4% total energy, TFA 1.3 ±
0.6 % total energy, MUFA 11.0 ± 3.5%
total energy, PUFA 6.0 ± 1.8 % total
energy, omega 3 0.18 ± 0.17 % total
energy, vegetable protein 6.4 ± 1.5 %
total energy, vegetables 4.2 ± 1.9
Supplementary material Heart
doi: 10.1136/heartjnl-2019-315499–731.:724 106 2020;Heart, et al. Butler T

Other BP medication: 9%
Statins: 29%
Other lipid modifying medication: 4%
Insulin: 3%
Oral antidiabetic drugs: 5%
servings/d, legumes 2.2 ± 3.2
servings/day, fruit 3.3 ± 1.6 servings/d,
nuts 0.5 ± 0.6 servings/d, whole grain
2.1 ± 1.7 servings/d, fish 0.4 ± 0.3
servings/d, MUFA:SFA 1.4 ± 0.4, red
and processed meat 0.6 ± 0.6 servings/d,
alcohol 4.9 ± 8.0 g/d.
Martínez-González et al.[48]
Articles in final meta-analysis: 27
Total number of participants in analysis:
271,479
Exposure to MedDiet assessed using
range of screening tools
Cumulative MA of observational studies
(prospective cohort and clinical trials)
Articles sourced from PubMed, Embase,
Google Scholar, and Web of Science till
May 2017
Inclusion criteria were:
Studies must be clinical trial or
prospective cohort studies, original
articles, primary prevention of mortality
or incidence of CVD through the
MedDiet, exposure must be adherence to
MedDiet, and outcome was mortality
from CVD or incidence of CV events
(defined as CHD or stroke)
Excluded studies that did not meet
inclusion criteria, those which did not
consider adherence to MedDiet on CV
incidence or mortality from CVD.
Computed a relative risk with 95%
confidence interval for an increase of
two points in adherence to the MedDiet
No comments on assessment of study
quality or publication bias
Primary outcomes CVD mortality or
incidence of CV events
Collected information on study design,
sample size and sample characteristics,
dietary assessment method, average
duration of follow-up, number of non-
fatal and fatal events, and results and
covariates in the fully adjusted model
Follow-up ranged from 4.8-17.3 years.
Each 2-point increment in a 0-9
MedDiet was associated with an 11%
reduction in CVD risk (RR 0.89; 95%
CI: 0.86, 0.91).
Lyon Heart Study and PREDIMED
accounted for 0.62% and 1.32% of total
evidence
Summary
Data form prospective cohort studies
and clinical trials suggest that
increased adherence to a
Mediterranean diet is associated with
reduced CV mortality or incidence of
CVD. The study does not include the
updated PREDIMED study published
in 2018. This would not change the
outcomes of this review
Chiavaroli et al.[49]
Potentially relevant records: 125
After duplicates: 77
Excluded 60 due to not being systematic
review and meta analysis, or did not
assess effect of DASH on CV outcomes
Full-texts assessed for eligibility: 14
Excluded 10 due to not being most
recent systematic review and meta
analysis, no pairwise meta-analysis
performed, no cardiometabolic
outcomes reported
Umbrella review of systematic reviews
and meta analyses examining the DASH
diet and cardiometabolic outcomes.
Articles sourced from Medline and
Embase (inception to January 3 2019).
Quality of evidence was assessed using
GRADE and reporting of evidence
following Preferred Reporting Items for
Primary outcome was incident CVD in
prospective cohort studies and SBP in
trials. Secondary outcomes included
incident CHD, stroke, and diabetes in
prospective cohort studies. Secondary
outcomes in controlled trials included
DBP, blood lipids, glycaemic control,
insulin, adiposity, and inflammation
1 meta analysis of prospective studies
assessed the relationship between
DASH diet and CVD incidence
(including 783,732 participants with
32,927 events). Consumption of the
DASH diet was associated with a 20%
reduction in CVD incidence (RR 0.80;
95% CI: 0.76, 0.85).
1 meta analysis of prospective studies
assessed the relationship between
Supplementary material Heart
doi: 10.1136/heartjnl-2019-315499–731.:724 106 2020;Heart, et al. Butler T
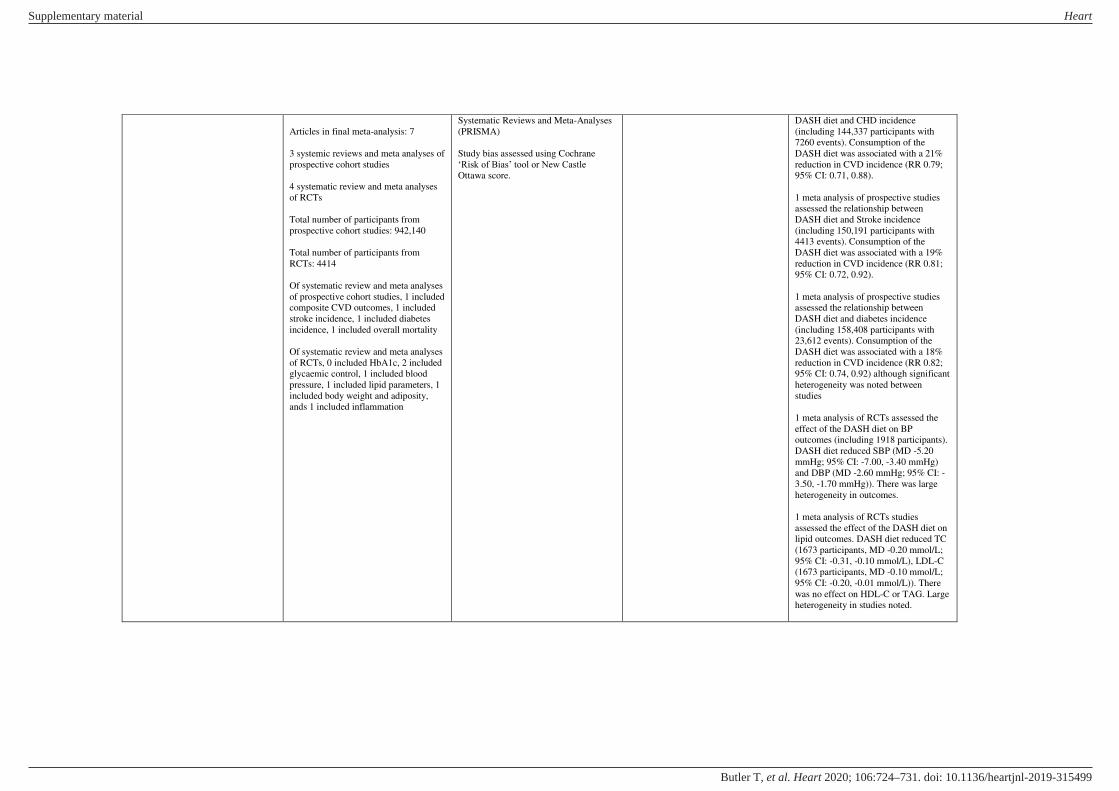
Articles in final meta-analysis: 7
3 systemic reviews and meta analyses of
prospective cohort studies
4 systematic review and meta analyses
of RCTs
Total number of participants from
prospective cohort studies: 942,140
Total number of participants from
RCTs: 4414
Of systematic review and meta analyses
of prospective cohort studies, 1 included
composite CVD outcomes, 1 included
stroke incidence, 1 included diabetes
incidence, 1 included overall mortality
Of systematic review and meta analyses
of RCTs, 0 included HbA1c, 2 included
glycaemic control, 1 included blood
pressure, 1 included lipid parameters, 1
included body weight and adiposity,
ands 1 included inflammation
Systematic Reviews and Meta-Analyses
(PRISMA)
Study bias assessed using Cochrane
‘Risk of Bias’ tool or New Castle Ottawa score.
DASH diet and CHD incidence
(including 144,337 participants with
7260 events). Consumption of the
DASH diet was associated with a 21%
reduction in CVD incidence (RR 0.79;
95% CI: 0.71, 0.88).
1 meta analysis of prospective studies
assessed the relationship between
DASH diet and Stroke incidence
(including 150,191 participants with
4413 events). Consumption of the
DASH diet was associated with a 19%
reduction in CVD incidence (RR 0.81;
95% CI: 0.72, 0.92).
1 meta analysis of prospective studies
assessed the relationship between
DASH diet and diabetes incidence
(including 158,408 participants with
23,612 events). Consumption of the
DASH diet was associated with a 18%
reduction in CVD incidence (RR 0.82;
95% CI: 0.74, 0.92) although significant
heterogeneity was noted between
studies
1 meta analysis of RCTs assessed the
effect of the DASH diet on BP
outcomes (including 1918 participants).
DASH diet reduced SBP (MD -5.20
mmHg; 95% CI: -7.00, -3.40 mmHg)
and DBP (MD -2.60 mmHg; 95% CI: -
3.50, -1.70 mmHg)). There was large
heterogeneity in outcomes.
1 meta analysis of RCTs studies
assessed the effect of the DASH diet on
lipid outcomes. DASH diet reduced TC
(1673 participants, MD -0.20 mmol/L;
95% CI: -0.31, -0.10 mmol/L), LDL-C
(1673 participants, MD -0.10 mmol/L;
95% CI: -0.20, -0.01 mmol/L)). There
was no effect on HDL-C or TAG. Large
heterogeneity in studies noted.
Supplementary material Heart
doi: 10.1136/heartjnl-2019-315499–731.:724 106 2020;Heart, et al. Butler T

2 RCTs showed DASH diet reduced
HbA1c (654 participants, MD -0.53%
(95% CI: -0.62, -0.43%)).
1 meta analysis of RCTs studies
assessed the effect of the DASH diet on
glucose outcomes (blood glucose,
insulin, and HOMA-IR). DASH diet
reduced insulin (760 participants, MD -
0.15 μU/mL; 95% CI: -0.22 to -0.08
μU/mL)). There was no effect seen on blood glucose of HOMA-IR
1 meta analysis of RCTs studies
assessed the effect of the DASH diet on
body weight. DASH diet reduced
bodyweight (1211 participants, MD
-1.42 kg; 95% CI: -2.03, -0.82 kg)).
1 meta analysis of RCTs studies
assessed the effect of the DASH diet on
CRP. No effect was seen but subgroup
analysis showed an effect when
compared to unhealthy or usual diets
(MD -9.62 nmol/L; 95% CI: -15.62,
−3.62 nmol/L) or when follow-up was ≥ 8 weeks
Summary
This study shows that adoption of the
DASH diet is associated with reduced
incident stroke, CVD, and CHD. The
DASH diet shows modest effects on
CV risk factors such as cholesterol,
insulin, and inflammation. DASH is
high in fruits and vegetables, whole
grains, fish and poultry, and limiting
fatty meats, and SSBs
Kim et al.[50] Total participants: n 12,168
Characteristics based on plant-based
diet scores:
Q1
Participants: n 2717
Age: 53.7±5.8 years
Women: 42.3%
BMI <25kg/m2: 19.5%
Prospective cohort study and meta-
analysis
Participants taken from the
Atherosclerosis Risk in Communities
(ARIC) study.
Established 4, plant‐based diet scores
(plant-based diet index [PDI], healthy
plant‐based diet index [hPDI], less
healthy [unhealthy] plant‐based diet
Primary outcome was all-cause
mortality (defined as deaths attributable
to any cause), CV mortality, and
incident CV disease (defined as
composite outcome of CHD, stroke,
and HF)
Diet data collected using a 66-item
semi-quantitative
Median follow-up of 25 years, there
were 1565 deaths from CVD and 5436
deaths from all-causes.
Those in highest quintiles of PDI, hPDI,
and pro-vegetarian index were more
likely to be women, white, more
physically active, less likely to be
obese, have diabetes or hypertension
Supplementary material Heart
doi: 10.1136/heartjnl-2019-315499–731.:724 106 2020;Heart, et al. Butler T

BMI 25-30kg/m2: 22.6%
BMI ≥30kg/m2: 27.5%
Current smoker: 33.8%
Activity index: 2.3±0.7
High blood pressure: 36.5%
Diabetes: 11.5%
Fasting glucose: 6.1±2.4 mmol/L
Lipid-lowering medication: 1.2%
eGFR: 105.2±16.4 mL/min/1.73m2
Ethnicity: 43.2% Black
Q2
Participants: n 2864
Age: 53.7±5.6 years
Women: 55.2%
BMI <25kg/m2: 21.7%
BMI 25-30kg/m2: 24.4%
BMI ≥30kg/m2: 24.7%
Current smoker: 27.8%
Activity index: 2.4±0.8
High blood pressure: 32.3%
Diabetes: 11.4%
Fasting glucose: 6.1±2.4 mmol/L
Lipid-lowering medication: 1.3%
eGFR: 103.3±15.8 mL/min/1.73m2
Ethnicity: 31.3% Black
Q3
Participants: n 2308
Age: 53.7±5.7 years
Women: 60%
BMI <25kg/m2: 18.9%
BMI 25-30kg/m2: 18.4%
BMI ≥30kg/m2: 19.4%
Current smoker: 23.2%
Activity index: 2.4±0.8
High blood pressure: 31.2%
Diabetes: 10.5%
Fasting glucose: 6.0±2.1 mmol/L
Lipid-lowering medication: 2.5%
eGFR: 102.9±14.9 mL/min/1.73m2
Ethnicity: 24.1% Black
Q4
Participants: n 1992
Age: 54.2±5.7 years
Women: 61.5%
BMI <25kg/m2: 16.9%
BMI 25-30kg/m2: 17.2%
index [uPDI], and provegetarian diet
index). hPDI included whole grains,
fruits, vegetables, nuts, legumes, tea, and
coffee. uPDI included fruit juices,
refined grain, potatoes, sugar‐sweetened
beverages, sweets, and desserts.
Higher PDI scores represented higher
intakes of healthy and less healthy plant
foods. Higher hPDI scores represented
higher intakes of healthy plant foods,
and lower intakes of less-healthy plant
foods. Higher uPDI scores represented
higher intakes of less healthy plant
foods, and lower intakes of healthy plant
foods. Higher pro-vegetarian diet scores
represented higher intakes of plant foods
(regardless of healthfulness). Higher
scores of all four scores represented
lower intakes of animal foods.
PDI Score Quintiles
Q1
PDI Score (median): 44 (28-46)
Healthy Plant Food: 5.4±2.8 servings/d
Unhealthy Healthy Plant Food: 4.6±2.3
servings/d
1715 ± 593 kcal/d, carbohydrates 43.7 ±
8.0 % total energy, total fat 35.4 ± 5.9 %
total energy, SFA 13.2 ± 2.7 % total
energy, MUFA 13.9 ± 2.6 % total
energy, PUFA 4.9 ± 1.2 % total energy,
total protein 18.7 ± 3.9 % total energy,
animal protein 15.2 ± 3.9 % total energy,
plant protein 3.6 ± 0.8 % total energy,
fibre 8.3 ± 2.7 g/1000 kcal, animal
foods: 5.6 ± 2.8 servings/d, fruits and
vegetables 2.8 ± 1.7 servings/d, red and
processed meats 1.5 ± 0.8 servings/d,
dairy 1.8 ± 1.4 servings/d, fish or
seafood 0.3 ± 0.3 servings/d, margarine
1.0 ± 0.9 servings/d, alcohol 68.9 ±
137.9 g/wk
Q2:
PDI Score (median): 49 (47–50)
Healthy Plant Food: 6.3±2.9 servings/d
FFQ at visit 1 and visit 3. The Harvard
Nutrient Database was used to derive
nutrient intakes from the FFQ
responses.
Participants examined at follow-up
visits, with the second visit occurring
between 1990 and 1992, the third
between 1993 and 1995, the fourth
between 1996 and 1998, the fifth
between 2011 and 2013, and the sixth
between 2016 and 2017.
Models adjusted for BMI, age, race and
gender, ARIC test centre, total energy
consumption, alcohol intake, margarine
intake, total cholesterol, lipid-lowering
medication, renal function, diabetes,
cigarette smoking, and education level
when compared to those in the lowest
quintiles
Those in the highest quintile of uPDI
were more likely to be male, younger,
smoke, obese, and have HTN
Those in highest quintiles of PDI, hPDI,
and pro-vegetarian index consumed
more fruits and vegetables, less red and
processed meat, more plant protein and
carbohydrate (as percentage of total
energy), fibre, and micronutrients such
as potassium, magnesium and iron.
Those in the highest quintile of uPDI
consumed less fruit and vegetables,
more red and processed meat, and had a
higher intake of total energy and
carbohydrate as a percentage of energy.
In fully adjusted models, compared with
Q1 the highest quintile of PDI was
associated with a 16% lower risk of
incident CVD (HR 0.84; 95% CI: 0.76,
0.94; Ptrend<0.001), a 31% lower risk of
CVD mortality (HR 0.69; 95% CI: 0.58,
0.81; Ptrend<0.001), and a 24% lower
risk of all-cause mortality (HR 0.76;
95% CI: 0.69, 0.83; Ptrend<0.001)
In fully adjusted models, compared with
Q1 the highest quintile of hPDI was
associated with a 16% lower risk of
CVD mortality (HR 0.84; 95% CI: 0.71,
1.01; Ptrend=0.03), and a 9% lower risk
of all-cause mortality (HR 0.91; 95%
CI: 0.83, 1.00; Ptrend=0.03)
In fully adjusted models, compared with
Q1 the highest quintile of pro-
vegetarian diet index was associated
with a 15% lower risk of incident CVD
(HR 0.85; 95% CI: 0.77, 0.94;
Ptrend<0.001), a 32% lower risk of CVD
mortality (HR 0.68; 95% CI: 0.58, 0.80;
Ptrend0.001), and a 18% lower risk of all-
Supplementary material Heart
doi: 10.1136/heartjnl-2019-315499–731.:724 106 2020;Heart, et al. Butler T

BMI ≥30kg/m2: 13.7%
Current smoker: 19.2%
Activity index: 2.5±0.8
High blood pressure: 30.6%
Diabetes: 9.4%
Fasting glucose: 5.9±1.8 mmol/L
Lipid-lowering medication: 3.4%
eGFR: 102.1±13.9 mL/min/1.73m2
Ethnicity: 19.2% Black
Q5
Participants: n 2287
Age: 53.9±5.8 years
Women: 60.6%
BMI <25kg/m2: 22.8%
BMI 25-30kg/m2: 17.3%
BMI ≥30kg/m2:14.6%
Current smoker: 19.2%
Activity index: 2.6±0.8
High blood pressure: 27.0%
Diabetes: 7.0%
Fasting glucose: 5.7±1.6 mmol/L
Lipid-lowering medication: 3.8%
eGFR: 101.9±13.2 mL/min/1.73m2
Ethnicity: 12.9% Black
Characteristics based on Pro-Vegetarian
index score
Q1
Participants: n 2970
Age: 53.4±5.7 years
Women: 46.5%
BMI <25kg/m2: 21.8%
BMI 25-30kg/m2: 24.3%
BMI ≥30kg/m2: 28.9%
Current smoker: 32.9%
Activity index: 2.3±0.8
High blood pressure: 34.1%
Diabetes: 10.4%
Fasting glucose: 6.1±2.3 mmol/L
Lipid-lowering medication: 1.1%
eGFR: 104.5±15.9 mL/min/1.73m2
Ethnicity: 35.5% Black
Q2
Participants: n 2687
Age: 53.7±5.7 years
Women: 55.5%
Unhealthy Healthy Plant Food: 4.7±2.4
servings/d
1569 ± 555 kcal/d, carbohydrates 47.4 ±
7.8 % total energy, total fat 33.3 ± 5.7 %
total energy, SFA 12.2 ± 2.4 % total
energy, MUFA 13.0 ± 2.6 % total
energy, PUFA 4.9 ± 1.2 % total energy,
total protein 18.5 ± 3.9 % total energy,
animal protein 14.4 ± 3.8 % total
energy, plant protein 4.2 ± 0.9 % total
energy, fibre 10.1 ± 3.0 g/1000 kcal,
animal foods: 4.5 ± 2.0 servings/d, fruits
and vegetables 2.8 ± 1.7 servings/d, red
and processed meats 1.2 ± 0.7
servings/d, dairy 1.6 ± 1.2 servings/d,
fish or seafood 0.3 ± 0.3 servings/d,
margarine 1.0 ± 0.9 servings/d, alcohol
45.2 ± 95.2 g/wk
Q3:
PDI Score (median): 52 (51–53)
Healthy Plant Food: 7.0±2.9 servings/d
Unhealthy Healthy Plant Food: 4.9±2.4
servings/d
1548 ± 537 kcal/d, carbohydrates 50.0 ±
7.4% total energy, total fat 32.0 ± 5.7 %
total energy, SFA 11.5 ± 2.3 % total
energy, MUFA 12.4 ± 2.5 % total
energy, PUFA 4.9 ± 1.2 % total energy,
total protein 18.3 ± 3.7 % total energy,
animal protein 13.8 ± 3.6 % total energy,
plant protein 4.6 ± 0.9 % total energy,
fibre 11.4 ± 3.3 g/1000 kcal, animal
foods: 4.0 ± 1.8 servings/d, fruits and
vegetables 3.1 ± 1.7 servings/d, red and
processed meats 1.0 ± 0.7 servings/d,
dairy 1.5 ± 1.1 servings/d, fish or
seafood 0.3 ± 0.3 servings/d, margarine
1.0 ± 0.9 servings/d, alcohol 36.4 ± 80.7
g/wk
Q4:
PDI Score (median): 55 (54–56)
Healthy Plant Food: 7.7±2.8 servings/d
Unhealthy Healthy Plant Food: 5.1±2.4
servings/d
1573 ± 524 kcal/d, carbohydrates 52.1 ±
7.2 % total energy, total fat 30.7 ± 5.9 %
total energy, SFA 10.9 ± 2.3 % total
cause mortality (HR 0.82; 95% CI: 0.76
– 0.89; Ptrend<0.001)
No significant associations were
observed with uPDI and any of the
primary outcomes
Food group analysis showed that higher
intakes of whole grains were associated
with lower incidence of CVD, CVD
mortality, and all-cause mortality.
Refined grains showed no association.
Higher intake of red and processed meat
and eggs was associated with increased
risk of CVD incidence, CVD mortality,
and all-cause mortality.
Increased poultry appeared to be
significantly associated with reduced
all-cause mortality. Fish or seafood, or
diary was not significantly associated
with any outcomes.
Individual components such as
vegetables, fruits, nut, and legumes
were not significantly associated with
any of the outcomes. Higher intake of
potatoes, which were classified as less
healthy plant foods for hPDI and uPDI,
was inversely associated with incident
CVD and all‐cause mortality
Summary
Overall this study shows that a
healthy-plant based diets conveys a
modest reduction in CV incidence,
mortality, and all-cause mortality.
A poorly constructed plant-based diet
containing refined grains, fruit juices
and increased sweets and desserts is
not associated with any benefit to CV
health, although in this study it was
not associated with increased risk.
This may be due to the scoring of
potatoes and how they are consumed
Supplementary material Heart
doi: 10.1136/heartjnl-2019-315499–731.:724 106 2020;Heart, et al. Butler T
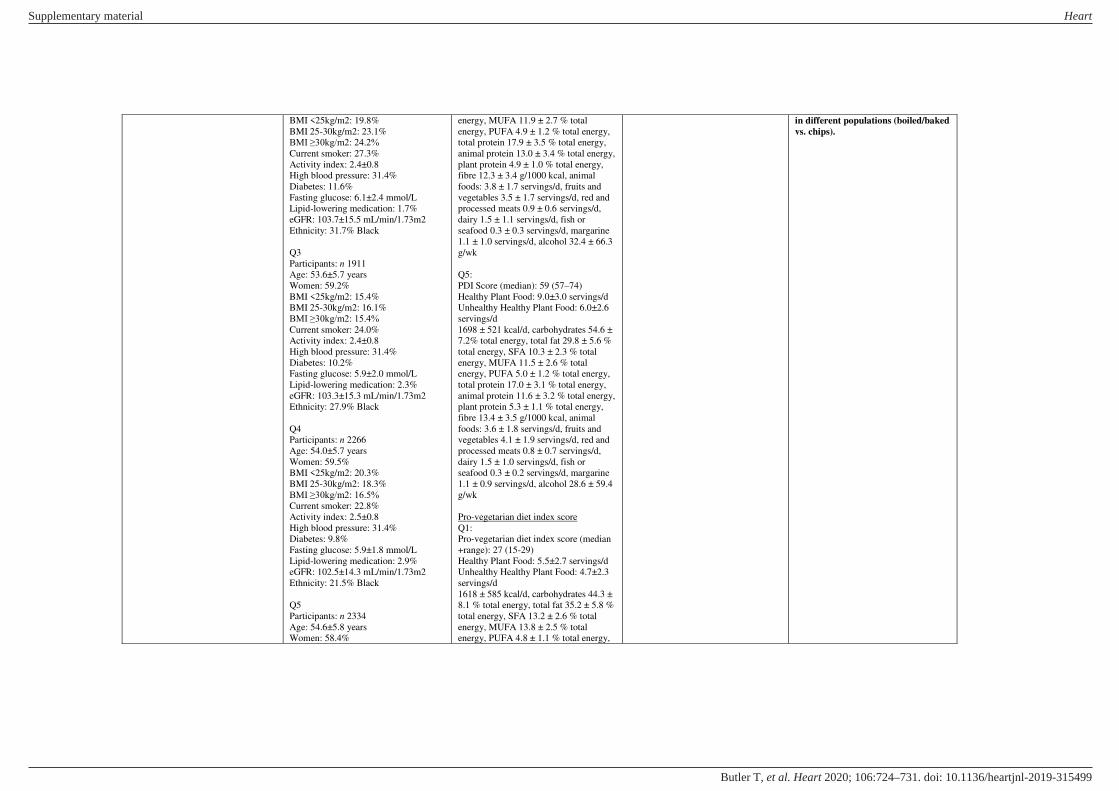
BMI <25kg/m2: 19.8%
BMI 25-30kg/m2: 23.1%
BMI ≥30kg/m2: 24.2%
Current smoker: 27.3%
Activity index: 2.4±0.8
High blood pressure: 31.4%
Diabetes: 11.6%
Fasting glucose: 6.1±2.4 mmol/L
Lipid-lowering medication: 1.7%
eGFR: 103.7±15.5 mL/min/1.73m2
Ethnicity: 31.7% Black
Q3
Participants: n 1911
Age: 53.6±5.7 years
Women: 59.2%
BMI <25kg/m2: 15.4%
BMI 25-30kg/m2: 16.1%
BMI ≥30kg/m2: 15.4%
Current smoker: 24.0%
Activity index: 2.4±0.8
High blood pressure: 31.4%
Diabetes: 10.2%
Fasting glucose: 5.9±2.0 mmol/L
Lipid-lowering medication: 2.3%
eGFR: 103.3±15.3 mL/min/1.73m2
Ethnicity: 27.9% Black
Q4
Participants: n 2266
Age: 54.0±5.7 years
Women: 59.5%
BMI <25kg/m2: 20.3%
BMI 25-30kg/m2: 18.3%
BMI ≥30kg/m2: 16.5%
Current smoker: 22.8%
Activity index: 2.5±0.8
High blood pressure: 31.4%
Diabetes: 9.8%
Fasting glucose: 5.9±1.8 mmol/L
Lipid-lowering medication: 2.9%
eGFR: 102.5±14.3 mL/min/1.73m2
Ethnicity: 21.5% Black
Q5
Participants: n 2334
Age: 54.6±5.8 years
Women: 58.4%
energy, MUFA 11.9 ± 2.7 % total
energy, PUFA 4.9 ± 1.2 % total energy,
total protein 17.9 ± 3.5 % total energy,
animal protein 13.0 ± 3.4 % total energy,
plant protein 4.9 ± 1.0 % total energy,
fibre 12.3 ± 3.4 g/1000 kcal, animal
foods: 3.8 ± 1.7 servings/d, fruits and
vegetables 3.5 ± 1.7 servings/d, red and
processed meats 0.9 ± 0.6 servings/d,
dairy 1.5 ± 1.1 servings/d, fish or
seafood 0.3 ± 0.3 servings/d, margarine
1.1 ± 1.0 servings/d, alcohol 32.4 ± 66.3
g/wk
Q5:
PDI Score (median): 59 (57–74)
Healthy Plant Food: 9.0±3.0 servings/d
Unhealthy Healthy Plant Food: 6.0±2.6
servings/d
1698 ± 521 kcal/d, carbohydrates 54.6 ±
7.2% total energy, total fat 29.8 ± 5.6 %
total energy, SFA 10.3 ± 2.3 % total
energy, MUFA 11.5 ± 2.6 % total
energy, PUFA 5.0 ± 1.2 % total energy,
total protein 17.0 ± 3.1 % total energy,
animal protein 11.6 ± 3.2 % total energy,
plant protein 5.3 ± 1.1 % total energy,
fibre 13.4 ± 3.5 g/1000 kcal, animal
foods: 3.6 ± 1.8 servings/d, fruits and
vegetables 4.1 ± 1.9 servings/d, red and
processed meats 0.8 ± 0.7 servings/d,
dairy 1.5 ± 1.0 servings/d, fish or
seafood 0.3 ± 0.2 servings/d, margarine
1.1 ± 0.9 servings/d, alcohol 28.6 ± 59.4
g/wk
Pro-vegetarian diet index score
Q1:
Pro-vegetarian diet index score (median
+range): 27 (15-29)
Healthy Plant Food: 5.5±2.7 servings/d
Unhealthy Healthy Plant Food: 4.7±2.3
servings/d
1618 ± 585 kcal/d, carbohydrates 44.3 ±
8.1 % total energy, total fat 35.2 ± 5.8 %
total energy, SFA 13.2 ± 2.6 % total
energy, MUFA 13.8 ± 2.5 % total
energy, PUFA 4.8 ± 1.1 % total energy,
in different populations (boiled/baked
vs. chips).
Supplementary material Heart
doi: 10.1136/heartjnl-2019-315499–731.:724 106 2020;Heart, et al. Butler T

BMI <25kg/m2: 22.7%
BMI 25-30kg/m2: 18.2%
BMI ≥30kg/m2:18.9%
Current smoker: 16.8%
Activity index: 2.6±0.8
High blood pressure: 29.4%
Diabetes: 8.2%
Fasting glucose: 5.5±1.8 mmol/L
Lipid-lowering medication: 3.8%
eGFR: 101.6±13.6 mL/min/1.73m2
Ethnicity: 16.5% Black
total protein 18.7 ± 4.0 % total energy,
animal protein 15.2 ± 4.0 % total energy,
plant protein 3.5 ± 0.8 % total energy,
fibre 8.0 ± 2.3 g/1000 kcal, animal
foods: 5.2 ± 2.3 servings/d, fruits and
vegetables 2.1 ± 1.4 servings/d, red and
processed meats 1.4 ± 0.8 servings/d,
dairy 1.8 ± 1.3 servings/d, fish or
seafood 0.3 ± 0.3 servings/d, margarine
1.0 ± 0.9 servings/d, alcohol 60.3 ±
123.4 g/wk
Q2:
Pro-vegetarian diet index score (median
+range): 31 (30/32)
Healthy Plant Food: 6.3±2.8 servings/d
Unhealthy Healthy Plant Food: 4.8±2.4
servings/d
1567 ± 561 kcal/d, carbohydrates 47.7 ±
7.9 % total energy, total fat 33.3 ± 5.7 %
total energy, SFA 12.2 ± 2.4 % total
energy, MUFA 13.0 ± 2.6 % total
energy, PUFA 4.9 ± 1.2 % total energy,
total protein 18.4 ± 3.9 % total energy,
animal protein 14.3 ± 3.8 % total
energy, plant protein 4.2 ± 0.8 % total
energy, fibre 10.0 ± 2.7 g/1000 kcal,
animal foods: 4.4 ± 2.0 servings/d, fruits
and vegetables 2.7 ± 1.6 servings/d, red
and processed meats 1.2 ± 0.8
servings/d, dairy 1.6 ± 1.2 servings/d,
fish or seafood 0.3 ± 0.3 servings/d,
margarine 1.0 ± 0.9 servings/d, alcohol
43.1 ± 89.3 g/wk
Q3:
Pro-vegetarian diet index score (median
+range): 33 (33-34)
Healthy Plant Food: 6.9±2.8 servings/d
Unhealthy Healthy Plant Food: 4.9±2.4
servings/d
1574 ± 551 kcal/d, carbohydrates 49.7 ±
7.6% total energy, total fat 32.2 ± 5.7 %
total energy, SFA 11.6 ± 2.3 % total
energy, MUFA 12.5 ± 2.6 % total
energy, PUFA 4.9 ± 1.2 % total energy,
total protein 18.2 ± 3.7 % total energy,
animal protein 13.7 ± 3.6 % total energy,
Supplementary material Heart
doi: 10.1136/heartjnl-2019-315499–731.:724 106 2020;Heart, et al. Butler T

plant protein 4.5 ± 0.9 % total energy,
fibre 11.3 ± 3.0 g/1000 kcal, animal
foods: 4.2 ± 1.9 servings/d, fruits and
vegetables 3.1 ± 1.6 servings/d, red and
processed meats 1.0 ± 0.7 servings/d,
dairy 1.6 ± 1.2 servings/d, fish or
seafood 0.3 ± 0.3 servings/d, margarine
1.0 ± 0.9 servings/d, alcohol 39.4 ± 87.9
g/wk
Q4:
Pro-vegetarian diet index score (median
+range): 36 (35-37)
Healthy Plant Food: 7.5±2.9 servings/d
Unhealthy Healthy Plant Food: 5.2±2.5
servings/d
1619 ± 527 kcal/d, carbohydrates 51.6 ±
7.5 % total energy, total fat 31.0 ± 5.8 %
total energy, SFA 11.0 ± 2.3 % total
energy, MUFA 12.0 ± 2.6 % total
energy, PUFA 5.0 ± 1.2 % total energy,
total protein 17.8 ± 3.6 % total energy,
animal protein 13.0 ± 3.5 % total energy,
plant protein 4.8 ± 0.9 % total energy,
fibre 12.2 ± 3.1 g/1000 kcal, animal
foods: 4.0 ± 1.8 servings/d, fruits and
vegetables 3.6 ± 1.7 servings/d, red and
processed meats 0.9 ± 0.6 servings/d,
dairy 1.5 ± 1.1 servings/d, fish or
seafood 0.3 ± 0.3 servings/d, margarine
1.1 ± 0.9 servings/d, alcohol 38.9 ± 91.1
g/wk
Q5:
Pro-vegetarian diet index score (median
+range): 40 (38-40)
Healthy Plant Food: 9.0±3.1 servings/d
Unhealthy Healthy Plant Food: 5.6±2.6
servings/d
1739 ± 514 kcal/d, carbohydrates 54.4 ±
7.4% total energy, total fat 29.5 ± 5.8 %
total energy, SFA 10.1 ± 2.2 % total
energy, MUFA 11.5 ± 2.7 % total
energy, PUFA 5.1 ± 1.2 % total energy,
total protein 17.4 ± 3.2 % total energy,
animal protein 11.9 ± 3.3 % total energy,
plant protein 5.5 ± 1.1 % total energy,
fibre 14.1 ± 3.6 g/1000 kcal, animal
Supplementary material Heart
doi: 10.1136/heartjnl-2019-315499–731.:724 106 2020;Heart, et al. Butler T

foods: 3.7 ± 1.8 servings/d, fruits and
vegetables 4.5 ± 2.0 servings/d, red and
processed meats 0.9 ± 0.7 servings/d,
dairy 1.5 ± 1.0 servings/d, fish or
seafood 0.2 ± 0.3 servings/d, margarine
1.2 ± 1.0 servings/d, alcohol 31.4 ± 68.5
g/wk
Athinarayanan et al.[51]
2 year follow-up data
Total participants: n=349
Continuous Care Intervention
n=262
Age: 53.8±8.4 years
Female: 66.79±2.92 %
BMI: 40.42±8.81 kg
Waist Circumference: 124.5±14.3 cm
Weight: 114.56±0.60 kg
Spine bone mineral density: 1.20 ± 0.16
g/cm2
Central abdominal fat: 5.77±1.69 kg
Android:gynoid ratio: 1.27±0.33
Lower extremity lean mass: 18.45±4.05
kg
Years since T2 Diabetes Diagnosis:
8.44±7.22
HbA1c: 7.6±1.5 %
C-peptide: 4.36±2.15 nmol/L
Plasma glucose: 9.1±0.2 mmol/L
Insulin: 27.73±1.26 mIU/L
HOMA-IR: 9.09±0.41
MetS (prevalence): 88.6±2.0 %
SBP: 131.9±14.1 mmHg
DBP: 82.1±8.3 mmHg
TC: 4.7±1.1 mmol/L
LDL-C: 2.7±0.9 mmol/L
HDL-C: 1.1±0.3 mmol/L
TAG: 2.2±1.6 mmol/L
ALT: 30.65±22.7 U/L
AST: 23.69±15.19 U/L
ALP: 74.11±22.14 U/L
Bilirubin: 9.2±3.6 µmol/L
NAFLD-Liver Fat Score: 3.43±3.84
NAFLD-Fibrosis Score: -0.23±1.36
eGFR: 80.48±13.62 mL/s/m2
Creatinine: 0.88±0.01 µmol/L
TSH: 2.32±1.74 mIU/L
Open label, non-randomized controlled
study.
Intervention consisted of a personalised
nutrition recommendation designed to
maintain nutritional ketosis.
Continuous Care Intervention (CCI)
Dietary protein was set at 1.5 g/kg of an
“ideal” body weight and titrated against blood ketone levels. Fats were included
to satiety and participants were
encouraged to consume adequate intake
of omega-3 (EPA and DHA) and omega
6 (LA), with the remainder from MUFA
and SFA. Each participant was
instructed to consumer 3-5 serving of
non-starchy vegetables and adequate
mineral and fluid intakes. Participants
were advised to consume a multivitamin,
1000-2000 IU Vit D3, and up to 1000
mg omega-3 daily. Participants in this
group selected how they wishes to
receive their education: 1) group
education sessions or 2) web-based
viewed through an app.
Usual Care (UC)
Patients with T2 diabetes referred to
local diabetes education programme and
were counselled by RDs on diabetes
self-management, nutrition, and lifestyle.
No detail is provided on the specific
macronutrients consumed, or the sources
of protein of fa tin the diet.
Primary outcomes were retention,
HbA1c, weight, fasting glucose and
insulin, HOMA-IR or c-peptide.
Secondary outcomes included lipids,
liver markers, calculated liver scores
(fibrosis and fatty-liver), kidney
function tests, thyroid function (TSH
and free T4), inflammatory markers
(hs-CRP and WBC), and changes in
medication use and insulin dose.
Prevalence and resolution of T2
diabetes, MetS, liver steatosis and
fibrosis were assessed at baseline and 2
years
Anthropometry was performed at
baseline, 1-year and 2 year follow-up.
Missing values were estimated from 40
imputations from logistic regression
HbA1C decreased by 0.9 units
(P<0.0001) during the 2 year period.
HbA1C increased by 0.4 units in the
usual care group
Fasting glucose, HOMA-IR and insulin
all significantly (P<0.0001) decreased
in the CCI group, and either stayed the
same or increased in the usual care
group.
Weight decreased by -11.94±0.96 kg in
the CCI group (P<0.0001) and increased
in the usual care group (+1.28±1.63 kg).
Central abdominal fat and the
android:gynoid ratio all improved over
the 2 year period.
At 2 years, 74% of CCI group achieved
5% weight loss compared to 14% of the
UC group.
Diabetes medication (excluding
metformin) decreased significantly in
the CCI group over the 2 year period
(56.9% to 26.8%, P<0.0001). Those
individuals taking insulin observed a
significant reduction in daily insulin
units (81.9 to 15.5 U/day, P<0.0001) in
the CCI group.
A significant (P<0.0001) reduction in
SBP and DBP was observed in the CCI
group, but not in the usual care group.
SBP decreased by -5.8±1.2 mmHg and
DBP decreased by 3.1±1.2 mmHg.
HDL-C and LDL-C all significantly
(P<0.001) increased in the CCI group.
HDL-C increased by 0.29±0.07 mmol/L
Supplementary material Heart
doi: 10.1136/heartjnl-2019-315499–731.:724 106 2020;Heart, et al. Butler T
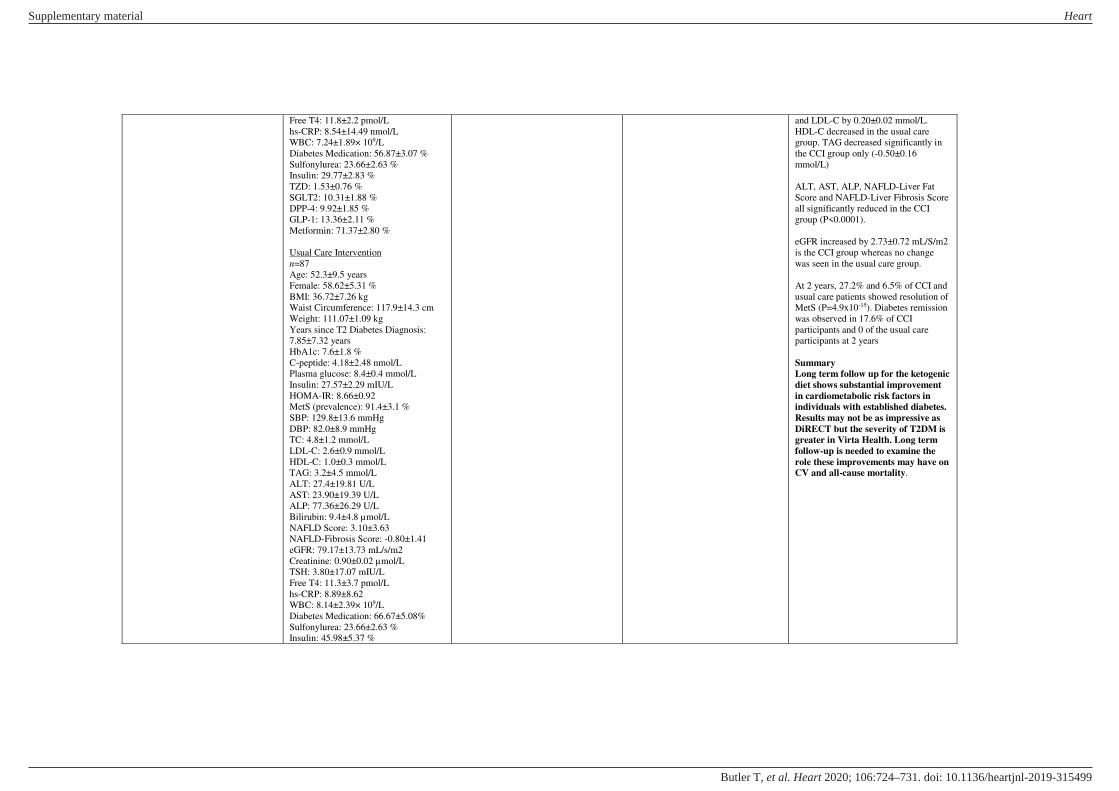
Free T4: 11.8±2.2 pmol/L
hs-CRP: 8.54±14.49 nmol/L
WBC: 7.24±1.89× 10⁹/L
Diabetes Medication: 56.87±3.07 %
Sulfonylurea: 23.66±2.63 %
Insulin: 29.77±2.83 %
TZD: 1.53±0.76 %
SGLT2: 10.31±1.88 %
DPP-4: 9.92±1.85 %
GLP-1: 13.36±2.11 %
Metformin: 71.37±2.80 %
Usual Care Intervention
n=87
Age: 52.3±9.5 years
Female: 58.62±5.31 %
BMI: 36.72±7.26 kg
Waist Circumference: 117.9±14.3 cm
Weight: 111.07±1.09 kg
Years since T2 Diabetes Diagnosis:
7.85±7.32 years
HbA1c: 7.6±1.8 %
C-peptide: 4.18±2.48 nmol/L
Plasma glucose: 8.4±0.4 mmol/L
Insulin: 27.57±2.29 mIU/L
HOMA-IR: 8.66±0.92
MetS (prevalence): 91.4±3.1 %
SBP: 129.8±13.6 mmHg
DBP: 82.0±8.9 mmHg
TC: 4.8±1.2 mmol/L
LDL-C: 2.6±0.9 mmol/L
HDL-C: 1.0±0.3 mmol/L
TAG: 3.2±4.5 mmol/L
ALT: 27.4±19.81 U/L
AST: 23.90±19.39 U/L
ALP: 77.36±26.29 U/L
Bilirubin: 9.4±4.8 µmol/L
NAFLD Score: 3.10±3.63
NAFLD-Fibrosis Score: -0.80±1.41
eGFR: 79.17±13.73 mL/s/m2
Creatinine: 0.90±0.02 µmol/L
TSH: 3.80±17.07 mIU/L
Free T4: 11.3±3.7 pmol/L
hs-CRP: 8.89±8.62
WBC: 8.14±2.39× 10⁹/L
Diabetes Medication: 66.67±5.08%
Sulfonylurea: 23.66±2.63 %
Insulin: 45.98±5.37 %
and LDL-C by 0.20±0.02 mmol/L.
HDL-C decreased in the usual care
group. TAG decreased significantly in
the CCI group only (-0.50±0.16
mmol/L)
ALT, AST, ALP, NAFLD-Liver Fat
Score and NAFLD-Liver Fibrosis Score
all significantly reduced in the CCI
group (P<0.0001).
eGFR increased by 2.73±0.72 mL/S/m2
is the CCI group whereas no change
was seen in the usual care group.
At 2 years, 27.2% and 6.5% of CCI and
usual care patients showed resolution of
MetS (P=4.9x10⁻¹⁵). Diabetes remission
was observed in 17.6% of CCI
participants and 0 of the usual care
participants at 2 years
Summary
Long term follow up for the ketogenic
diet shows substantial improvement
in cardiometabolic risk factors in
individuals with established diabetes.
Results may not be as impressive as
DiRECT but the severity of T2DM is
greater in Virta Health. Long term
follow-up is needed to examine the
role these improvements may have on CV and all-cause mortality.
Supplementary material Heart
doi: 10.1136/heartjnl-2019-315499–731.:724 106 2020;Heart, et al. Butler T

TZD: 1.15±1.15 %
SGLT2: 14.94±3.84 %
DPP-4: 8.05±2.93 %
GLP-1: 16.09±3.96 %
Metformin: 60.92±5.26 %
No statistically significant difference in
any baseline parameter between groups
Ethnicity and medication use not
reported
Supplementary material Heart
doi: 10.1136/heartjnl-2019-315499–731.:724 106 2020;Heart, et al. Butler T

Table legends
Table 1
AA, arachidonic acid; ALA, alpha linolenic acid; ApoA1, apolipoprotein A1; ApoB,
apolipoprotein B; ACEi, angiotensin converting enzyme inhibitor; ARB, angiotensin receptor
blocker; ASM, appendicular skeletal muscle mass; BMI, body mass index; BP, blood pressure;
CHD, coronary heart disease; CHS, cardiovascular health study frailty score; CRP, c-reactive
protein; CVD, cardiovascular disease; DBP, diastolic blood pressure; DGLA, Dihomo-γ-
linolenic acid; DHA, docosahexaenoic acid; DM, diabetes mellitus; eGFRcycC, estimated
glomerular filtration rate from cystatin C measurements; eGFRcr-cysC, estimated glomerular
filtration rate from creatinine and cystatin C measurements; EPA, eicosapentaenoic acid; FFQ,
food frequency questionnaire; HOMA-IR, homeostatic model assessment of insulin resistance;
GLA, gamma-Linolenic acid; HDL-C, high density lipoprotein cholesterol; HTN,
hypertension; LA, linoleic acid; low carbohydrate diet, LCD; LCDS, low carbohydrate score;
LDL-C, low density lipoprotein cholesterol; MACCE, major adverse cardiac and
cerebrovascular events; MD, mean difference; MetS, metabolic syndrome; MI, myocardial
infarction; MNA, mini nutritional assessment; MUFA, monounsaturated fat; PUFA,
polyunsaturated fat; QoL, quality of life; RAS, renin-angiotensin system; SBP, systolic blood
pressure; SFA, saturated fat; T2DM, type 2 diabetes; TAG, triacylglycerol; TC, total
cholesterol; TFA, trans fatty acid; , VLDL, very low density lipoprotein; WMD, weighted mean
difference
Supplementary material Heart
doi: 10.1136/heartjnl-2019-315499–731.:724 106 2020;Heart, et al. Butler T

Table 2
aHEI, alternate healthy eating index; ApoA1, apolipoprotein A1; ApoB, apolipoprotein B;
BMI, body mass index; CHD, coronary heart disease; CVD, cardiovascular disease; DASH,
dietary approaches to stop hypertension; DBP, diastolic blood pressure; DVP-SI, digital
volume pulse–stiffness index; DVP-RI, digital volume pulse–reflection index; FFQ, food
frequency questionnaire; F&V, fruits and vegetables, HDL-C, high density lipoprotein
cholesterol; HF, heart failure; HRT, hormone replacement therapy; hsCRP, high-sensitivity C-
reactive protein ICAM, intercellular adhesion molecule; IHD, ischaemic heart disease; LDI-
Ach, laser Doppler imaging with acetylcholine; LDI-SNP, laser Doppler imaging with sodium
nitroprusside; LDL-C, low density lipoprotein cholesterol; MCE, major coronary events;
mDASH; modified DASH; MedDiet, Mediterranean Diet; MI, myocardial infarction; MUFA,
monounsaturated fat; NO, nitric oxide; PAI-1, plasminogen activator inhibitor-1; PUFA,
polyunsaturated fat; PWA AIx, pulse wave analysis augmentation index; PWA AIx HR75,
pulse wave analysis augmentation index with correction to a heart rate of 75 beats/min; PWV,
pulse wave velocity; SBP, systolic blood pressure; SFA, saturated fat; TAG, triacylglycerol;
TC, total cholesterol; TFA, trans fatty acid; VCAM, vascular cell adhesion molecule; vWF,
von Willebrand factor
Supplementary material Heart
doi: 10.1136/heartjnl-2019-315499–731.:724 106 2020;Heart, et al. Butler T
Table 3
aHEI, alternate healthy eating index; ALT, alanine aminotransferase; alternative
Mediterranean diet (aMED); AST, aspartate aminotransferase; ALP, alkaline phosphatase;
ApoA1, ACEi, angiotensin convertor enzyme inhibitor; apolipoprotein A1; ApoB,
apolipoprotein B; BP, blood pressure; BMI, body mass index; CABG, coronary artery bypass
graft; CHD, coronary heart disease; CVD, cardiovascular disease; DASH, dietary approaches
to stop hypertension; DBP, diastolic blood pressure; DPP-4, Dipeptidyl peptidase 4; eGFR,
estimated glomerular filtration rate; FFQ, food frequency questionnaire; GLP-1, Glucagon-like
peptide-1; HDL-C, high density lipoprotein cholesterol; HOMA-IR, homeostatic model
assessment of insulin resistance; hPDI, healthy plant-based diet index; HF, heart failure;
hsCRP, high-sensitivity C-reactive protein; HTN, hypertension; IHD, ischaemic heart disease;
LDL-C, low density lipoprotein cholesterol; MD, mean difference; MedDiet, Mediterranean
Diet; MetS, metabolic syndrome; MI, myocardial infarction; MUFA, monounsaturated fat;
NAFLD, non-alcoholic fatty liver disease; PDI, plant-based diet index; PUFA, polyunsaturated
fat; SBP, systolic blood pressure; SFA, saturated fat; SGLT2, Sodium-glucose co-transporter-
2; TAG, triacylglycerol; TC, total cholesterol; TFA, trans fatty acid; TSH, thyroid stimulating
hormone; TZD, thiazolidinediones; uPDI, unhealthy plant-based diet index; WBC, white blood
cells
Supplementary material Heart
doi: 10.1136/heartjnl-2019-315499–731.:724 106 2020;Heart, et al. Butler T