online social networks anatomy: on the analysis of...
TRANSCRIPT

Online Social Networks Anatomy: on the Analysis
of Facebook and WhatsApp in Cellular Networks
Pierdomenico Fiadino, Pedro Casas, Mirko Schiavone, Alessandro D’Alconzo
Telecommunications Research Center Vienna - FTW
{surname}@ftw.at
Abstract—Online Social Networks (OSNs) have rapidly be-come an integral part of our daily lives, and hundreds of millionsof people are nowadays remotely connected trough popular OSNssuch as Facebook, Google+, Twitter and WhatsApp. While muchhas been said and studied about the social aspects of OSNs, little isknown about the network side of OSNs, specially regarding theirnetwork and traffic footprints, as well as their content deliveryinfrastructures. In this paper we study these networking aspectsof OSNs, vivisecting the most popular OSNs in western countries:Facebook and WhatsApp. By analyzing two large-scale traffictraces collected at the cellular network of a major EuropeanISP, we characterize and compare the networking behavior ofFacebook and WhatsApp, considering not only the traffic flowsbut also the network infrastructures hosting them. Our studyserves the main purpose of better understanding how major OSNsare provisioned in today’s Internet. To the best of our knowledge,this is the first paper providing such an analysis using large-scalemeasurements in cellular networks.
Keywords—Online Social Networks; Content Delivery Networks;Network Measurements; Facebook; WhatsApp; Cellular Networks.
I. INTRODUCTION
A big share of today’s Internet ecosystem is shaped bythe success and influence of the most popular on-line services(e.g., video and audio streaming, social networking, on-linegaming, etc.). Online Social Networks (OSNs) such as Face-book make part of such highly popular services. Facebook isthe most popular and widely spread OSN in Europe and theUS, with hundreds of millions of users worldwide sharing andaccessing content on a daily basis [5]. Facebook content ismainly hosted by the well known Akamai Content DeliveryNetwork (CDN) [15], which represents the most dynamic andwidely deployed CDN today, with more than 137,000 serversin more than 85 countries across nearly 1,200 networks.
There also other types of modern OSNs which are be-coming extremely popular, and are also changing the waywe use and think of the Internet. Among those, WhatsApp isdoubtlessly the leading modern OSN today. Initially developedas an instant messaging application, WhatsApp is today adominant player in the communication and social sharing ofmultimedia contents worldwide; with half a billion users, ithas become the fastest-growing company in history in termsof users [1].
The research leading to these results has received funding from the EuropeanUnion under the FP7 Grant Agreement n. 318627, “mPlane”.
In this paper we focus on the characterization of thetraffic and the content delivery infrastructure of Facebook andWhatsApp. While many studies have been conducted on theanalysis of the interactions among users and the popularity ofOSNs, little is known today about the networking and trafficcharacteristics of such services. Shedding light on issues suchas usage patterns, content location, hosting organizations, andaddressing dynamics is highly valuable to network operators,to better understand how these OSNs work and perform, tobetter adapt and manage their own networks, and also tohave means to analyze and track their evolution inside theirnetworks. Our study is based on an extensive analysis ofnetwork traffic flows observed at the core of an operationalEuropean cellular network. The main findings of our studyare as follows:
(1) While Facebook’s content is hosted in multiplegeographical locations and it is provisioned throughhighly dynamic addressing mechanisms, WhatsApp hostinginfrastructure is fully centralized at cloud servers exclusivelylocated in the US, independently of the geographical locationof the users. Such a geographical footprint makes userstraffic to be hosted in countries other than their local ones,potentially raising concerns about privacy or legal jurisdiction.
(2) The highly dynamic and distributed content deliverymechanisms used by Facebook are becoming more spread interms of hosting locations and hosting organizations, whichmight have a direct impact on the transport costs faced by theISP providing the Internet access.
(3) While WhatsApp is mainly used as a text-messagingservice in terms of transmitted flows (more than 93%), video-sharing accounts for about 36% of the exchanged volumein uplink and downlink, and photo-sharing/audio-messagingfor about 38%. Such a usage of WhatsApp suggests thatthe application is not only taking over the traditional SMSservice of cellular network providers, but it is also heavilyloading the access network, particularly in the uplink direction.
(4) Despite the complexity of the underlying hostinginfrastructures, traffic volumes and flows in both OSNs followa very predictable time-of-day pattern, enabling potentialscheduling mechanisms and dynamic traffic engineeringpolicies to optimize the resources of the access network forsuch massive applications.
(5) Both OSNs are vulnerable to large-scale outages,suggesting that ISPs are not always to be blamed bycustomers when bad user experience events occur.ISBN 978-3-901882-68-5 © 2015 IFIP

The remainder of the paper is organized as follows: Sec. IIpresents an overview on the previous papers on Internetservices and OSNs characterization. Sec. III describes theanalyzed datasets and the methodologies we used in our study.In Sec. IV we analyze the content delivery infrastructuresof both OSNs. Sec. V reports on the characterization ofthe generated traffic flows, whereas Sec. VI focuses on thecontent addressing and distribution dynamics. Sec. VII reviewsthe occurrence of popular outages occurred in both OSNs,complementing the traffic characterization. Discussion of theobtained results and their practical implications are presentedin Sec. VIII. Finally, Sec. IX concludes this work.
II. RELATED WORK
The study and characterization of the Internet traffic hostedand delivered by the top content providers has gained importantmomentum in the last few years [6], [7], [10], [15]. In [6],authors show that most of today’s inter-domain traffic flowsdirectly between large content providers, CDNs, and the end-users, and that more than 30% of the inter-domain trafficvolume is delivered by a small number of content providers andhosting organizations. Several studies have focused on CDNarchitectures and CDN performance [10], [15]. In particular,[10] focuses on user-content latency analysis at the GoogleCDN, and [15] provides a comprehensive study of the AkamaiCDN architecture.
The analysis of OSNs has been a very fertile domain inthe last few years [19]–[24]. Authors in [19] study the power-law and scale-free properties of the interconnection graphs ofFlickr, YouTube, LiveJournal, and Orkut, using application-level crawled datasets. In [20], authors present a study onthe privacy characteristics of Facebook. Some papers [21],[22] study the new Google+ OSN, particularly in terms ofpopularity of the OSN, as well as the evolution of connectivityand activity among users. Authors in [23], [24] focus on thetemporal dynamics of OSNs in terms of user-interconnectionsand visited links, using again public crawled data from popularOSNs such as Facebook, Twitter, as well as a large ChineseOSN. All these papers rely on crawled web-data and do nottake into account the traffic and networking aspects of OSNs.In [5] we have started the analysis of the network-side charac-teristics of large OSNs such as Facebook, particularly focusingon the study of the interplays among the multiple CDNs anddomains hosting and delivering the content. In this paper wetake a step further, by focusing on the temporal dynamics ofthe traffic delivery and the traffic flow characteristics.
WhatsApp is a relatively new service, and its study hasbeen so far quite limited. Some recent papers have partiallyaddressed the characterization of its traffic [2], [3], but usingvery limited datasets (i.e., no more than 50 devices) andconsidering an energy-consumption perspective. We have beenrecently working on the analysis of WhatsApp through largescale network measurements [1], [4], considering in particularthe performance of the service, both in terms of networkthroughput and quality as perceived by the end users. In [4]we studied the Quality of Experience (QoE) requirements forWhatsApp, reporting the results obtained from subjective QoElab tests. In this paper we do not focus on the performanceof WhatsApp but on its traffic and hosting infrastructure,extending the initial results obtained in [1].
III. DATASETS AND ANALYSIS METHODOLOGY
Our study is conducted on top of two large-scale networktraffic traces collected at the core of a European national-wide cellular network in mid 2013 and early 2014. Flowsare monitored at the well known Gn interface, and analyzedthrough the stream data warehouse DBStream [11]. Facebooktraffic is carried on top of HTTP (we do not consider HTTPSfor the study of Facebook, as its usage in 2013 was verylimited in mobile devices), so we rely on a HTTP-basedtraffic classification tool for cellular traffic called HTTPTag[12] to unveil the corresponding Facebook flows. HTTPTagclassification consists in applying pattern matching techniquesto the hostname field of the HTTP requests. The Facebookdataset consists of one month of HTTP flow traces collected inmid 2013. To preserve user privacy, any user related data (e.g.,IMSI, MSISDN) are removed on-the-fly, whereas any payloadcontent beyond HTTP headers is discarded on the fly.
The WhatsApp dataset consists of a complete week ofWhatsApp traffic flow traces collected at exactly the samevantage point in early 2014. In the case of WhatsApp allcommunications are encrypted, so we extended the HTTPTagclassification tool to additionally analyze the DNS requests,similar to [17]. In a nutshell, every time a user issues aDNS request for a Fully Qualified Domain Name (FQDN)associated to WhatsApp, HTTPTag creates an entry mappingthis user to the server IPs provided in the DNS reply. Eachentry is time stamped and contains the TTL replied by theDNS server. Using these mappings, all the subsequent flowsbetween this user and the identified servers are assumed to beWhatsApp flows. To avoid miss-classifications due to out-of-date mappings, every entry expires after a TTL-based time-out. To increase the robustness of the approach, the list ofIPs is augmented by adding the list of server IPs signingthe TLS/SSL certificates with the string *.whatsapp.net.Indeed, our measurements revealed that WhatsApp uses thisstring to sign all its communications. Finally, we use reverseDNS queries to verify that the list of filtered IPs actuallycorresponds to a WhatsApp domain.
To identify the FQDNs used by the WhatsApp service, werely on manual inspection of hybrid measurements. We activelygenerate WhatsApp text and media flows at end devices (bothAndroid and iOS), and passively observe them at two instru-mented access gateways. We especially paid attention to theDNS traffic generated by the devices. Not surprising, our mea-surements revealed that WhatsApp servers are associated to thedomain names whatsapp.net (for supporting the service)and whatsapp.com (for the company website). In addition,different third level domain names are used to handle differenttypes of traffic (control, text messages, and multimedia mes-sages). Control and text messages are handled by chat serversassociated to the domains {c|d|e}X.whatsapp.net (Xis an integer changing for load balancing), whereas mul-timedia contents are handled by multimedia (mm) serversassociated to the domains mmsXYZ.whatsapp.net andmmiXYZ.whatsapp.net for audio and photo transfers, andmmvXYZ.whatsapp.net for videos. As we see next, chatand mm servers have very different network footprints. Whileconnections to chat servers are characterized by low data-rateand long duration (specially due to the control messages),media transfers are transmitted in short and heavy flows.
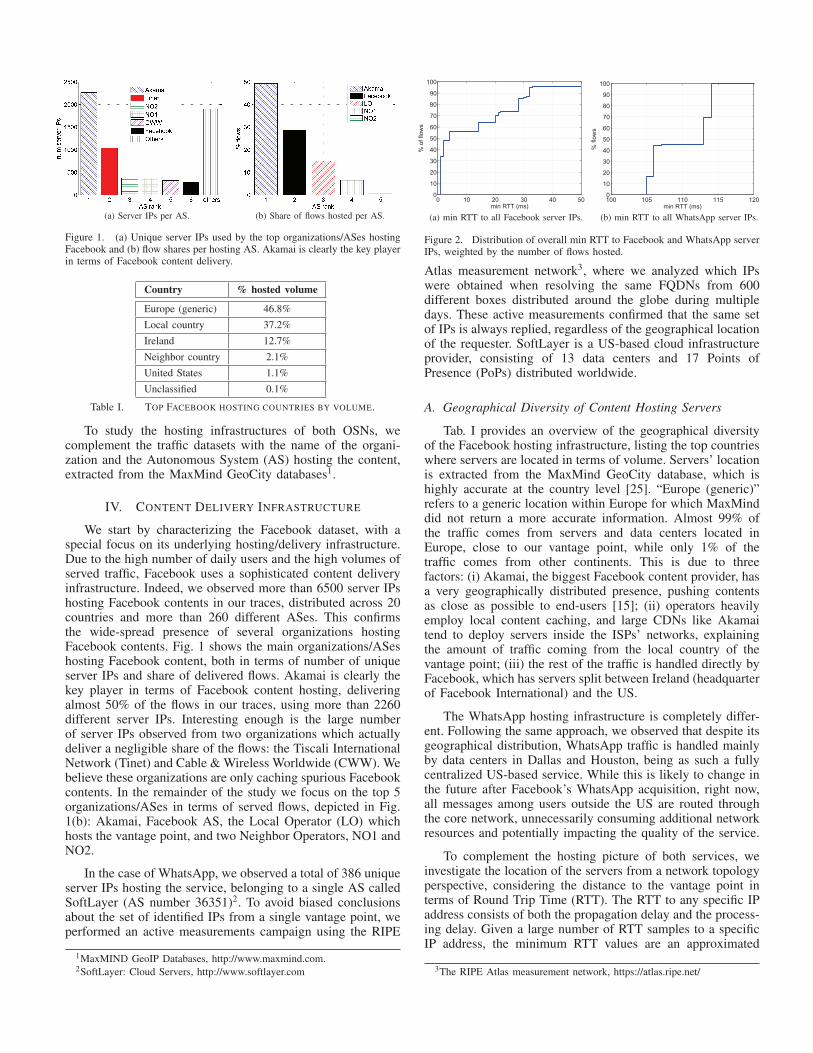
(a) Server IPs per AS. (b) Share of flows hosted per AS.
Figure 1. (a) Unique server IPs used by the top organizations/ASes hostingFacebook and (b) flow shares per hosting AS. Akamai is clearly the key playerin terms of Facebook content delivery.
Country % hosted volume
Europe (generic) 46.8%
Local country 37.2%
Ireland 12.7%
Neighbor country 2.1%
United States 1.1%
Unclassified 0.1%
Table I. TOP FACEBOOK HOSTING COUNTRIES BY VOLUME.
To study the hosting infrastructures of both OSNs, wecomplement the traffic datasets with the name of the organi-zation and the Autonomous System (AS) hosting the content,extracted from the MaxMind GeoCity databases1.
IV. CONTENT DELIVERY INFRASTRUCTURE
We start by characterizing the Facebook dataset, with aspecial focus on its underlying hosting/delivery infrastructure.Due to the high number of daily users and the high volumes ofserved traffic, Facebook uses a sophisticated content deliveryinfrastructure. Indeed, we observed more than 6500 server IPshosting Facebook contents in our traces, distributed across 20countries and more than 260 different ASes. This confirmsthe wide-spread presence of several organizations hostingFacebook contents. Fig. 1 shows the main organizations/ASeshosting Facebook content, both in terms of number of uniqueserver IPs and share of delivered flows. Akamai is clearly thekey player in terms of Facebook content hosting, deliveringalmost 50% of the flows in our traces, using more than 2260different server IPs. Interesting enough is the large numberof server IPs observed from two organizations which actuallydeliver a negligible share of the flows: the Tiscali InternationalNetwork (Tinet) and Cable & Wireless Worldwide (CWW). Webelieve these organizations are only caching spurious Facebookcontents. In the remainder of the study we focus on the top 5organizations/ASes in terms of served flows, depicted in Fig.1(b): Akamai, Facebook AS, the Local Operator (LO) whichhosts the vantage point, and two Neighbor Operators, NO1 andNO2.
In the case of WhatsApp, we observed a total of 386 uniqueserver IPs hosting the service, belonging to a single AS calledSoftLayer (AS number 36351)2. To avoid biased conclusionsabout the set of identified IPs from a single vantage point, weperformed an active measurements campaign using the RIPE
1MaxMIND GeoIP Databases, http://www.maxmind.com.2SoftLayer: Cloud Servers, http://www.softlayer.com
0 10 20 30 40 500
10
20
30
40
50
60
70
80
90
100
min RTT (ms)
% o
f flow
s
100 105 110 115 1200
10
20
30
40
50
60
70
80
90
100
min RTT (ms)
% f
low
s
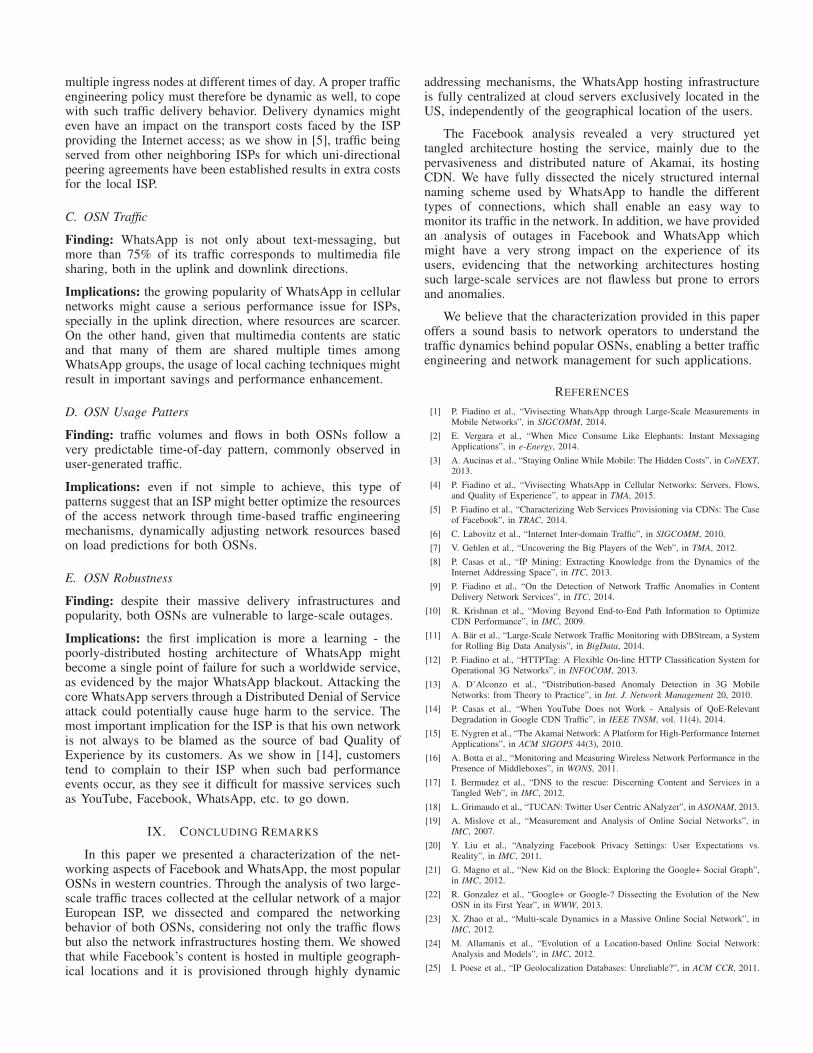
(a) min RTT to all Facebook server IPs. (b) min RTT to all WhatsApp server IPs.
Figure 2. Distribution of overall min RTT to Facebook and WhatsApp serverIPs, weighted by the number of flows hosted.
Atlas measurement network3, where we analyzed which IPswere obtained when resolving the same FQDNs from 600different boxes distributed around the globe during multipledays. These active measurements confirmed that the same setof IPs is always replied, regardless of the geographical locationof the requester. SoftLayer is a US-based cloud infrastructureprovider, consisting of 13 data centers and 17 Points ofPresence (PoPs) distributed worldwide.
A. Geographical Diversity of Content Hosting Servers
Tab. I provides an overview of the geographical diversityof the Facebook hosting infrastructure, listing the top countrieswhere servers are located in terms of volume. Servers’ locationis extracted from the MaxMind GeoCity database, which ishighly accurate at the country level [25]. “Europe (generic)”refers to a generic location within Europe for which MaxMinddid not return a more accurate information. Almost 99% ofthe traffic comes from servers and data centers located inEurope, close to our vantage point, while only 1% of thetraffic comes from other continents. This is due to threefactors: (i) Akamai, the biggest Facebook content provider, hasa very geographically distributed presence, pushing contentsas close as possible to end-users [15]; (ii) operators heavilyemploy local content caching, and large CDNs like Akamaitend to deploy servers inside the ISPs’ networks, explainingthe amount of traffic coming from the local country of thevantage point; (iii) the rest of the traffic is handled directly byFacebook, which has servers split between Ireland (headquarterof Facebook International) and the US.
The WhatsApp hosting infrastructure is completely differ-ent. Following the same approach, we observed that despite itsgeographical distribution, WhatsApp traffic is handled mainlyby data centers in Dallas and Houston, being as such a fullycentralized US-based service. While this is likely to change inthe future after Facebook’s WhatsApp acquisition, right now,all messages among users outside the US are routed throughthe core network, unnecessarily consuming additional networkresources and potentially impacting the quality of the service.
To complement the hosting picture of both services, weinvestigate the location of the servers from a network topologyperspective, considering the distance to the vantage point interms of Round Trip Time (RTT). The RTT to any specific IPaddress consists of both the propagation delay and the process-ing delay. Given a large number of RTT samples to a specificIP address, the minimum RTT values are an approximated
3The RIPE Atlas measurement network, https://atlas.ripe.net/

2 4 6 8 10 12 14 16 18 20 22 240
200
400
600
800
1000
Time of day (hourly time bins)
SR
V I
Ps p
er
hour
All
Akamai
NO1
NO2
(a) # hourly unique IPs in Facebook.
2 4 6 8 10 12 14 16 18 20 22 240
200
400
600
800
1000
Time of day (hourly time bins)
SR
V I
Ps p
er
hour
(b) # hourly unique IPs in WhatsApp.
00 12 000
50
100
150
200
250
300
350
time (10 min resolution)
srv
IP
s
all IPs
mm
mmv
mmi
mms
chat
web
(c) # IPs in WhatsApp per content type.
Figure 3. Active servers daily hosting Facebook and WhatsApp. Server IPs used by WhatsApp are further discriminated by type of content.
Service AS/Organization # IPs #/24 #/16
All 6551 891 498
Akamai 2264 132 48
Facebook AS 294 57 5
LO 26 8 6
NO1 368 26 14
NO2 374 33 9
WhatsApp SoftLayer (AS 36351) 386 51 30
Table II. NUMBER OF IPS AND PREFIXES HOSTING FACEBOOK ANDWHATSAPP. PREFIXES ARE NOT FULLY COVERED/OWN BY THE ASES BUT
USED FOR AGGREGATION AND COUNTING PURPOSES.
measure of the propagation delay, which is directly related tothe location of the underlying server. Cellular networks usuallyemploy Performance Enhancement Proxies (PEPs) to speed-upHTTP traffic, and therefore, passive min RTT measurements ontop of HTTP traffic provide incorrect results [16]. We thereforeconsider an active measurement approach, running standardpings from the vantage point to get an estimation of the minRTT to the servers, similar to [8].
Fig. 2 plots the cumulative distribution of the minimumRTT to (a) the server IPs hosting Facebook and (b) the serverIPs hosting WhatsApp. Values are weighted by the numberof flows served from each IP, to get a better picture ofwhere the traffic is coming from. As a further confirmationof the geographical diversity in Facebook, the distributionof min RTT presents some steps or “knees”, suggesting theexistence of different data centers and/or hosting locations.The largest majority of Facebook flows are served by closeserves, located at less than 5 ms from the vantage point. In thecase of WhatsApp, the min RTT is always bigger than 100ms,confirming that WhatsApp servers are located outside Europe.Fig. 2(b) shows that the service is evenly handled between twodifferent yet potentially very close locations at about 106 msand 114 ms, which is compatible with our previous findingsof WhatsApp servers located in Dallas and Houston.
B. IP Address Space of Content Servers
We study now the server diversity through an analysis ofthe IP address spaces covered by both OSNs as observed inour traces. Tab. II summarizes the number of unique server IPshosting Facebook and WhatsApp, as well as the /24 and /16IP blocks or prefixes covered by the top organizations hostingFacebook and WhatsApp. Akamai and Facebook togetheraccount for about 2560 servers scattered around almost 200
/24 IP blocks, revealing again their massively distributedinfrastructure. Even if WhatsApp servers are geographicallyco-located, the range of server IPs handling the content ishighly distributed, and consists of 386 unique IPs covering51 different /24 prefixes. However, only a few of them areactually hosting the majority of the flows, and the samehappens for Facebook.
Fig. 3 shows the daily usage of these IPs on a single day,considering the number of unique server IPs per hour. Thenumber of active IPs serving Facebook flows from Akamaifollows the daily utilization of the network, peaking at theheavy-load time range. Interestingly, the IPs exposed by Face-book AS are constantly active and seem loosely correlated withthe network usage. This comes from the fact that Facebook ASservers normally handle all the Facebook dynamic contents [7],which include the user sessions keep-alive. Something similarhappens in WhatsApp, where the number of active IPs remainspractically constant during the day, mainly due to the samekeep-alive effect of chat and control sessions. However, if welook a bit closer, we can see some important differences whenseparately analyzing WhatsApp chat and mm servers.
Fig. 3(c) shows the dynamics of the active IPs used byWhatsApp on a single day, but using now a finer-grainedtemporal aggregation of 10 minutes instead of one hour, anddiscriminating by server type. The mm category is further splitinto photos/audio (mmi and mms) and video (mmv). Note thatno less than 200 IPs are active even in the lowest load hours.When analyzing the active IPs per traffic type, we observethat more than 200 IPs serve WhatsApp mm flows duringpeak hours. In addition, we see how all the chat servers areconstantly active (there are about 150 of them), as they keepthe state of active devices to quickly push messages.
V. NETWORK TRAFFIC ANALYSIS
Let us know focus on the characteristics of the traffic flowscarrying Facebook and WhatsApp contents. Fig. 4 depicts thevolume share of Facebook contents hosted by each org./AS,as well as the flow size distributions. Akamai hosts more than65% of the total volume observed in our traces, followed byFacebook AS itself with about 19%. Comparing the volumeshares in Fig. 4(a) with the flow shares in Fig. 1(b) evidences aclear distinction on the content sizes handled by both Akamaiand Facebook AS: while Akamai hosts the bigger flows,Facebook AS serves only a small share of the service content.

10−3
10−2
10−1
100
0
10
20
30
40
50
60
70
80
90
100
Flow Size (MB − log scale)
% f
low
s
Akamai
LO1
NO1
NO2
(a) Shares of hosted volume per org./AS. (b) Distribution of flow sizes.
Figure 4. Hosted volume and distribution of flow sizes per organization.
Indeed, as previously flagged by other studies [7], Akamaiserves the static contents of the Facebook service (e.g., photos,songs, videos, etc.), whereas the Facebook AS covers almostexclusively the dynamic contents (e.g., chats, tags, sessioninformation, etc.).
To further explore this distinction, Fig. 4(b) reports thedistribution of the flow sizes served per organization. TheCDF reveals that Akamai clearly serves bigger flows thanFacebook AS. The remaining ASes tend to host bigger flowsthan Facebook AS, which is coherent with the fact that ISPscaching is generally done for bigger objects, aiming at reducethe load on the core network.
In terms of WhatsApp traffic, Fig. 5 reports the character-istics of the corresponding flows in terms of size and duration.Fig. 5(a) shows a scatter plot reporting the flow duration vs.the flow size, discriminating by chat and mm flows. Whereasmm messages are sent over dedicated connections, resultingin short-lived flows, text messages are sent over the sameconnection used for control data, resulting in much longerflows. For example, some chat flows are active for as much as62 hours. Fig. 5(b) indicates that more than 50% of the mmflows are bigger than 70 KB, with an average flow size of 225KB. More than 90% of the chat flows are smaller than 10 KB,with an average size of 6.7 KB. In terms of duration, Fig. 5(c)shows that more than 90% of the mm flows last less than 1min (mean duration of 1.8 min), whereas chat flows last onaverage as much as 17 minutes. The flow duration distributionadditionally reveals some clear steps at exactly 10, 15 and24 minutes, suggesting the usage of an application time-outto terminate long idle connections. This behavior is actuallydictated by the operating system of the device [1].
VI. CONTENT DELIVERY DYNAMICS
The characterization performed in previous sections mainlyconsiders the static characteristics of the traffic delivery in bothOSNs. In this section we focus on the temporal dynamics ofthe content delivery. Fig. 6 shows the dynamics of WhatsAppfor three consecutive days, including the fraction of flows andtraffic volume shares, discriminating by chat and mm traffic.Fig. 6(a) shows the flow count shares, revealing how chat flowsare clearly dominating. Once again we stop in the mmi andmms servers, which seem to always handle the same share offlows, suggesting that both space names are used as a meanto balance the load in terms of photos and audio messages.Finally, Figs. 6(b) and 6(c) reveal that even if the mm volumeis higher than the chat volume, the latter is comparable to thephotos and audio messaging volume, specially in the uplink.Tab. III summarizes these shares of flows and traffic volume.
features chat mm mmv mmi mms
# bytesdown 16.6% 83.0% 38.8% 12.8% 29.8%
# bytesup 29.5% 70.2% 35.2% 15.0% 17.9%
# flows 93.4% 6.2% 0.3% 2.9% 2.9%
# bytesdown# bytesdown+up
60.6% 76.3% 75.1% 70.0% 81.9%
Table III. VOLUME AND FLOWS PER TRAFFIC CATEGORY.
Given that the content delivery infrastructure of Facebookis much richer then the one of WhatsApp in terms of geo-graphical distribution, we study now the temporal evolution ofthe servers selected for provisioning the Facebook flows. Tobegin with, we focus on the temporal evolution of the minRTT, as reported in Fig. 2. Fig. 7(a) depicts the temporalvariation of the CDF for all the Facebook flows and for acomplete day, considering a single CDF every three hoursperiod. The CDFs are rather stable during the day, but presentsome slight variations during the night and early morning. Toget a better picture of such dynamics, Fig. 7(b) depicts thehourly evolution of the min RTT for all the Facebook flowsduring 3 consecutive days, being the first day the one analyzedin Fig. 7(a). Each column in the figure depicts the PDF ofthe min RTT for all the served flows, using a heat map-likeplot (i.e., the darker the color, the more concentrated the PDFin that value). The flagged variations are observed during thefirst day, with some slight shifts between 6am and 12am fromservers at 14ms and 20ms. The heat map also reveals someperiodic flow shifts between 9pm and midnight from serversat 20ms, but impacting a small fraction of flows. Fig. 7(c)presents the same type of heat map for Facebook flows, butconsidering a dataset of 2012 from the same vantage point[8]. The temporal patterns in 2012 show a much strongerperiodic load balancing cycle, focused in a small number ofhosting regions at 7ms, 14ms, and 37ms. Comparing the resultsfrom 2012 with those in 2013 suggests that Facebook contentdelivery is becoming more spread in terms of hosting locations,and load balancing cycles are becoming a-priori less marked.However, when deeply analyzing the complete dataset of 2013,conclusions are rather different.
To drill down deeply into this issue, we analyze thedynamics of the content delivery for the complete Facebookdataset, spanning 28 consecutive days. Instead of consideringthe variations of the min RTT, we consider now the variationson the number of flows served by the observed IPs. Changesin the distribution of the number of flows coming from thecomplete set of 6551 server IPs reflect variations in the waycontent is accessed and served from the hosting infrastructureobserved in our traces. For this analysis, we consider a timegranularity of one hour, and therefore compute the distributionof the number of flows provided per server IP in consecutivetime slots of one hour, for the complete 28 days. This resultsin a time-series with a total of 24 × 28 = 672 consecutivedistributions. To quantify how different are two distributions inthe resulting time-series, we use a symmetric and normalizedversion of the Kullback-Leibler divergence described in [13].
To visualize the results of the comparison for the completetime span of 28 days, we use a graphical tool proposedin [13], referred to as Temporal Similarity Plot (TSP). TheTSP allows pointing out the presence of temporal patternsand (ir)regularities in distribution time-series by graphical

(a) Flow duration vs. size.
100
101
102
103
104
0
10
20
30
40
50
60
70
80
90
100
flow size (KB)
% f
low
s
all flows
chat
mm
(b) Flow size.
0 10 20 30 400
10
20
30
40
50
60
70
80
90
100
flow duration (min)
% f
low
s
all flows
chat
mm
(c) Flow duration.
Figure 5. Characterization of WhatsApp flows. Whereas mm messages are sent over short-lived flows, text messages result in longer and much smaller flows.
00 12 00 12 00 12 000
10
20
30
40
50
60
70
80
90
100
time (10 min resolution)
num
flo
ws (
norm
aliz
ed)
all IPs
mm
mmv
mmi
mms
chat
(a) Flows.
00 12 00 12 00 12 000
10
20
30
40
50
60
70
80
90
100
time (10 min resolution)
byte
s d
ow
n (
norm
aliz
ed)
all IPs
mm
mmv
mmi
mms
chat
(b) Bytes down.
00 12 00 12 00 12 000
10
20
30
40
50
60
70
80
90
100
time (10 min resolution)
byte
s u
p (
norm
aliz
ed)
all IPs
mm
mmv
mmi
mms
chat
(c) Bytes up.
Figure 6. WhatsApp traffic dynamics. mmi and mms servers constantly handle the same share of flows, suggesting that both space names are used as a meansto balance the load in terms of photos and audio messages.
0 10 20 30 40 500
10
20
30
40
50
60
70
80
90
100
min RTT (ms)
% f
low
s
0−3
3−6
6−9
9−12
12−15
15−18
18−21
21−24
(a) min RTT daily dynamics in 2013.
00 12 00 12 00 12 000
5
10
15
20
25
30
35
40
Time of the day (hour)
min
RT
T (
ms)
0
20
40
60
80
100
(b) min RTT dynamics in 2013
Time of the day (hour)
min
RT
T (
ms)
00 12 00 12 00 12 000
5
10
15
20
25
30
35
40
(c) min RTT dynamics in 2012
Figure 7. Temporal variations of the min RTT to Facebook servers. In the heat maps of Figs. (a) and (c), the darker the color, the bigger the fraction of flowsserved from the corresponding min RTT value.
inspection. In a nutshell, a TSP is a symmetrical heatmap-like plot, in which the value {i, j} reflects how similar arethe two distributions at time ti and tj . We refer the interestedreader to [13] for a detailed description of the TSP tool.
Fig. 8 gives an example of TSP for the distributions of allthe Facebook flows across all the server IP addresses providingFacebook content, over the 28 days. Each plot is a matrixof 672 × 672 pixels; the color of each pixel {i, j} showshow similar are the two distributions at times ti and tj : bluerepresents low similarity, whereas red corresponds to highsimilarity. By construction, the TSP is symmetric around the45◦ diagonal, and it can be interpreted either by columns or byrows. For example, if we read the TSP by rows, for every valuej in the y-axis, the points to the left [right] of the diagonal
represent the degree of similarity to past [future] distributions.
The three TSPs in Fig. 8 represent the distribution varia-tions for (a) all the observed IPs, (b) the Akamai IPs and (c) theFacebook AS IPs. Let us begin by the TSP for all the observedserver IPs in Fig. 8(a). The regular “tile-wise” texture withinperiods of 24 hours evidences the presence of daily cycles, inwhich similar IPs are used to serve a similar number of flows.The lighter zones in these 24 hour periods correspond to thetime of the day, whereas the dark blue zones correspond tothe night-time periods when the traffic load is low. The lowsimilarity (blue areas) at night (2am-5am) is caused by thelow number of served flows, which induces larger statisticalfluctuations in the computed distributions. This pattern repeatsalmost identical for few days, forming multiple macro-blocks

(a) All IPs hosting Facebook (b) Akamai (c) Facebook AS
Figure 8. TSP of hourly flow count distributions over 28 days for all the observed IPs hosting Facebook, Akamai IPs, and Facebook AS IPs. A blue pixel at{i, j} means that the distributions at times ti and tj are very different, whereas a red pixel corresponds to high similarity.
around the main diagonal of size ranging from 2 up to 6 days.This suggests that during these periods, the same sets of IPsare used to deliver the flows, with slight variations duringthe night periods, similarly to what we observed in Fig. 7(a).However, the analysis of the entire month reveals the presenceof a more complex temporal strategy in the (re)usage of theIP address space. For example, there is a reuse of (almost)the same address range between days 10-12 and days 15-16. Interestingly, we observe a sharp discontinuity on days18-19, as from there on, all the pixels are blue (i.e., all thedistributions are different from the past ones).
To get a better understanding of such behaviors, Figs. 8(b)and 8(c) split the analysis for Akamai and Facebook AS IPsonly. The figures reveal a different (re)usage policy of theIPs hosting the contents. In particular, Akamai uses the sameservers for 4 to 7 days (see multi-days blocks around the maindiagonal). When it changes the used addresses, the shift is notcomplete as we can observe the macro-blocks slowly fadingout over time. This suggests a rotation policy of the addressspace of Akamai, on a time-scale of weeks. On the other hand,Facebook AS does not reveal such a clear temporal allocationpolicy. It alternates periods of high stability (e.g. between days4 and 10) with highly dynamic periods (e.g., from day 18onward). It is interesting noticing that Facebook AS is theresponsible for the abrupt change in the distributions observedfrom the 18th day on, in the TSP of the overall traffic.
VII. ANALYSIS OF LARGE-SCALE OUTAGES ON OSNS
The complex and large-scale server architectures used byFacebook and WhatsApp are not flawless and in some casesthe service goes down, heavily impacting the users. The lastpart of the study focuses on the analysis of some of thesemajor outages detected in Facebook and WhatsApp traffic.
Fig. 9(a) depicts a very interesting event we detected in theFacebook traffic served by Akamai, using the methodologiesand tools presented in [9]. As we discovered in [9], this eventcorresponds to a large outage in Akamai servers during a timeframe of about 2 hours in September 2013. The total volumeserved by Akamai, Facebook AS and LO abruptly drops duringthis outage, being Akamai the organization showing the highestchange. No other organization takes over the dropped traffic,suggesting the occurrence of an outage.
06:00 12:00 18:00 00:00 06:00 12:00 18:00 00:000
100
200
300
400
time [hh:mm]
HT
TP
5X
X e
rror
messages
06:00 12:00 18:00 00:00 06:00 12:00 18:00 00:000
0.2
0.4
0.6
0.8
1
Volu
me (
byte
s/t
ime b
in)
− n
orm
Akamai
LO
NO
(a) Facebook outages in September 2013.
06:00 12:00 18:00 00:00 06:00 12:00 18:00 00:000
0.2
0.4
0.6
0.8
1
Volu
me (
byte
s/t
ime b
in)
− n
orm
06:00 12:00 18:00 00:00 06:00 12:00 18:00 00:000
20
40
60
80
time [hh:mm]
HT
TP
5X
X e
rror
messages
Akamai
LO
NO1
(b) Facebook outages in October 2013.
Figure 9. Outages in Facebook. In both (a) and (b), the upper Fig. shows thedownlink traffic volume per AS, and the lower one shows the HTTP servererror message counts (e.g. 5XX).
To further understand the root causes of the abrupt drop,Fig. 9(a) additionally plots the time series of the countof HTTP server error messages (i.e., 5XX HTTP answers)corresponding to the Facebook HTTP flows served by theaforementioned ASes. The high increase in the counts forAkamai is impressive, meaning that during the volume drop,the HTTP web traffic hosted by Akamai was not available formany of users. The increase of the 5XX messages continues forabout half an hour after the apparent recovery, flagging sometransient effects which might be linked to the re-start of someservers. Interestingly, there are no noticeable variations in thecounts for the other ASes, suggesting that the outage is only

part of the Akamai CDN and is not related to the Facebookservice itself. Fig. 9(b) shows a second outage of very similarcharacteristics detected about one month later, suggesting thatthe Facebook OSN is prone to bad experience issues. Accord-ing to an international press release4, this Facebook outagewas caused by maintenance issues, and impacted millions ofFacebook users on more than 3.000 domains.
To conclude, we focus on the analysis of the major What-sApp worldwide outage reported since its beginning as ob-served in our traces. The outage occurred in February the 22ndof 2014, and had a strong attention in the medias worldwide.The event is not only clearly visible in our traces, but canalso be correlated with the user reactions on social networks.Through the online downdetector service5, and following theapproach proposed in [18], we accessed and processed thecounts of tweeter feeds containing the keyword “whatsapp”,coupled with keywords reflecting service impairments such as“outage”, “is down”, etc.. We refer to these as error tweets.
Fig. 10 depicts the time series of the share of bytesexchanged with the servers, the share of flows, as well asthe number of error tweets during two consecutive daysencompassing the outage. The traffic drastically dropped onthe 22nd at around 19:00 CEST (event B), and slowly startedrecovering after midnight, with some transient anomalousbehaviors in the following hours (events C and D). Trafficvolumes in both directions did not drop completely to zerobut some non-negligible fraction of the traffic was still beingexchanged, suggesting an overloading problem of the hostinginfrastructure. In terms of number of flows, there is a clearramp-up on the flow counts. Very interestingly, there is aclear correlation between the events B, C and D and thenumber of WhatsApp-related error tweets. Users reacted inthe OSN immediately after the beginning of the outage, withthe viral effect reaching its highest point after one hour. Thereis an additional outage event marked as A, which is clearlyobservable in the error tweet counts and has exactly the samesignature of events B, C and D, i.e., a drop in the traffic volumeand an increase in the flows count.
VIII. DISCUSSION AND IMPLICATIONS OF RESULTS
Let us now focus on the interpretation of the findingspresented so far. In this section we provide a comprehensivediscussion of the main take aways of the study, and particularlyelaborate on their implications for network dimensioning, op-eration and management tasks. Discussion is structured alongfive specific topics covering the contributions flagged in Sec. I:(i) geographical location of OSN servers and contents; (ii)dynamics of the content delivery; (iii) traffic characteristics;(iv) dynamics of the OSNs’ usage; (v) robustness of the OSNs.
A. Geolocation of OSN Servers
Finding: our study reveals that even if both OSNs are verypopular worldwide, their networking hosting infrastructuresfollow very different paradigms: based on Akamai’s perva-siveness, Facebook is hosted by a highly distributed networkarchitecture, whereas WhatsApp follows a fully centralized
4http://www.theguardian.com/technology/2013/oct/21/facebook-problems-status-updates5https://downdetector.com/
50
100
byte
s d
ow
n (
%)
50
100
byte
s u
p (
%)
0 6 12 18 0 6 12 18 00
500
1.000
time (hours)
# e
rror
tweets
0
50
100
# f
low
s (
%)
bytes down
bytes up
# total flows
error tweets
CBA D
Figure 10. The WhatsApp worldwide outage. The traffic trends suggest anoverloading problem of the hosting infrastructure.
hosting architecture at cloud servers exclusively located in theUS, independently of the geographical location of the users.
Implications: the first direct implication is in terms of serviceperformance. WhatsApp flows suffer an important additionallatency for users outside the US, which might impact theirQuality of Experience. Being Brazil, India, Mexico and Russiathe fastest growing countries in terms of users6, such a central-ized hosting infrastructure is likely to become a problematicbottleneck in the near future. On the contrary, Facebook latencydue to propagation is highly reduced, enabling the usage oflatency-sensitive applications on top of this OSN (e.g., videoconversations or cloud gaming). The second implication is interms of traffic management. The Softlayer servers identified inthe study are exclusively used by WhatsApp, making it verysimple for an ISP to identify WhatsApp flows by server IPaddress, similarly to [8]. While we do not expect it to happen,a cellular ISP might intentionally degrade the performance ofWhatsApp flows to discourage its usage, similarly to whatmany operators have done in the past with Skype traffic7.The final implication is about data privacy. The geo-locationof OSN servers makes users traffic to be hosted in countriesother than their local ones, thus data locality is probably notmaintained (in the case of WhatsApp, this is 100% confirmed).In the light of the ever increasing concerns related to privacyand data security, such a geographical distribution might evencause legal jurisdiction issues due to different data privacyprotection laws in different countries.
B. Content Delivery Dynamics
Finding: the highly dynamic and distributed content deliverymechanisms used by Facebook are becoming more spread interms of hosting locations and hosting organizations.
Implications: this makes of Facebook a very challengingsource of traffic for network dimensioning and traffic engineer-ing. Indeed, it is very difficult for an ISP to properly engineerits own network when surges of traffic come from potentially
6WhatsApp Blog, http://blog.whatsapp.com/7“Comcast Blocks Some Internet Traffic”, the Whashington Post, 2007.
multiple ingress nodes at different times of day. A proper trafficengineering policy must therefore be dynamic as well, to copewith such traffic delivery behavior. Delivery dynamics mighteven have an impact on the transport costs faced by the ISPproviding the Internet access; as we show in [5], traffic beingserved from other neighboring ISPs for which uni-directionalpeering agreements have been established results in extra costsfor the local ISP.
C. OSN Traffic
Finding: WhatsApp is not only about text-messaging, butmore than 75% of its traffic corresponds to multimedia filesharing, both in the uplink and downlink directions.
Implications: the growing popularity of WhatsApp in cellularnetworks might cause a serious performance issue for ISPs,specially in the uplink direction, where resources are scarcer.On the other hand, given that multimedia contents are staticand that many of them are shared multiple times amongWhatsApp groups, the usage of local caching techniques mightresult in important savings and performance enhancement.
D. OSN Usage Patters
Finding: traffic volumes and flows in both OSNs follow avery predictable time-of-day pattern, commonly observed inuser-generated traffic.
Implications: even if not simple to achieve, this type ofpatterns suggest that an ISP might better optimize the resourcesof the access network through time-based traffic engineeringmechanisms, dynamically adjusting network resources basedon load predictions for both OSNs.
E. OSN Robustness
Finding: despite their massive delivery infrastructures andpopularity, both OSNs are vulnerable to large-scale outages.
Implications: the first implication is more a learning - thepoorly-distributed hosting architecture of WhatsApp mightbecome a single point of failure for such a worldwide service,as evidenced by the major WhatsApp blackout. Attacking thecore WhatsApp servers through a Distributed Denial of Serviceattack could potentially cause huge harm to the service. Themost important implication for the ISP is that his own networkis not always to be blamed as the source of bad Quality ofExperience by its customers. As we show in [14], customerstend to complain to their ISP when such bad performanceevents occur, as they see it difficult for massive services suchas YouTube, Facebook, WhatsApp, etc. to go down.
IX. CONCLUDING REMARKS
In this paper we presented a characterization of the net-working aspects of Facebook and WhatsApp, the most popularOSNs in western countries. Through the analysis of two large-scale traffic traces collected at the cellular network of a majorEuropean ISP, we dissected and compared the networkingbehavior of both OSNs, considering not only the traffic flowsbut also the network infrastructures hosting them. We showedthat while Facebook’s content is hosted in multiple geograph-ical locations and it is provisioned through highly dynamic
addressing mechanisms, the WhatsApp hosting infrastructureis fully centralized at cloud servers exclusively located in theUS, independently of the geographical location of the users.
The Facebook analysis revealed a very structured yettangled architecture hosting the service, mainly due to thepervasiveness and distributed nature of Akamai, its hostingCDN. We have fully dissected the nicely structured internalnaming scheme used by WhatsApp to handle the differenttypes of connections, which shall enable an easy way tomonitor its traffic in the network. In addition, we have providedan analysis of outages in Facebook and WhatsApp whichmight have a very strong impact on the experience of itsusers, evidencing that the networking architectures hostingsuch large-scale services are not flawless but prone to errorsand anomalies.
We believe that the characterization provided in this paperoffers a sound basis to network operators to understand thetraffic dynamics behind popular OSNs, enabling a better trafficengineering and network management for such applications.
REFERENCES
[1] P. Fiadino et al., “Vivisecting WhatsApp through Large-Scale Measurements in
Mobile Networks”, in SIGCOMM, 2014.
[2] E. Vergara et al., “When Mice Consume Like Elephants: Instant Messaging
Applications”, in e-Energy, 2014.
[3] A. Aucinas et al., “Staying Online While Mobile: The Hidden Costs”, in CoNEXT,
2013.
[4] P. Fiadino et al., “Vivisecting WhatsApp in Cellular Networks: Servers, Flows,
and Quality of Experience”, to appear in TMA, 2015.
[5] P. Fiadino et al., “Characterizing Web Services Provisioning via CDNs: The Case
of Facebook”, in TRAC, 2014.
[6] C. Labovitz et al., “Internet Inter-domain Traffic”, in SIGCOMM, 2010.
[7] V. Gehlen et al., “Uncovering the Big Players of the Web”, in TMA, 2012.
[8] P. Casas et al., “IP Mining: Extracting Knowledge from the Dynamics of the
Internet Addressing Space”, in ITC, 2013.
[9] P. Fiadino et al., “On the Detection of Network Traffic Anomalies in Content
Delivery Network Services”, in ITC, 2014.
[10] R. Krishnan et al., “Moving Beyond End-to-End Path Information to Optimize
CDN Performance”, in IMC, 2009.
[11] A. Bar et al., “Large-Scale Network Traffic Monitoring with DBStream, a System
for Rolling Big Data Analysis”, in BigData, 2014.
[12] P. Fiadino et al., “HTTPTag: A Flexible On-line HTTP Classification System for
Operational 3G Networks”, in INFOCOM, 2013.
[13] A. D’Alconzo et al., “Distribution-based Anomaly Detection in 3G Mobile
Networks: from Theory to Practice”, in Int. J. Network Management 20, 2010.
[14] P. Casas et al., “When YouTube Does not Work - Analysis of QoE-Relevant
Degradation in Google CDN Traffic”, in IEEE TNSM, vol. 11(4), 2014.
[15] E. Nygren et al., “The Akamai Network: A Platform for High-Performance Internet
Applications”, in ACM SIGOPS 44(3), 2010.
[16] A. Botta et al., “Monitoring and Measuring Wireless Network Performance in the
Presence of Middleboxes”, in WONS, 2011.
[17] I. Bermudez et al., “DNS to the rescue: Discerning Content and Services in a
Tangled Web”, in IMC, 2012.
[18] L. Grimaudo et al., “TUCAN: Twitter User Centric ANalyzer”, in ASONAM, 2013.
[19] A. Mislove et al., “Measurement and Analysis of Online Social Networks”, in
IMC, 2007.
[20] Y. Liu et al., “Analyzing Facebook Privacy Settings: User Expectations vs.
Reality”, in IMC, 2011.
[21] G. Magno et al., “New Kid on the Block: Exploring the Google+ Social Graph”,
in IMC, 2012.
[22] R. Gonzalez et al., “Google+ or Google-? Dissecting the Evolution of the New
OSN in its First Year”, in WWW, 2013.
[23] X. Zhao et al., “Multi-scale Dynamics in a Massive Online Social Network”, in
IMC, 2012.
[24] M. Allamanis et al., “Evolution of a Location-based Online Social Network:
Analysis and Models”, in IMC, 2012.
[25] I. Poese et al., “IP Geolocalization Databases: Unreliable?”, in ACM CCR, 2011.