online retailers find a reason to celebrate in dismal economy
TRANSCRIPT
ForeSee Results Holiday E-Retail Satisfaction Index (US)
Online Retailers Find a Reason to Celebrate in Dismal Economy
December 30, 2009
by Larry FreedPresident and CEO, ForeSee Results
© 2009 ForeSee Results
2 • ForeSee Results Holiday E-Retail Satisfaction Index (US) 2009
www.ForeSeeResults.com
The following paper contains data, commentary, and analysis on the following:
I. Overview: Discussion of aggregate-level findings and analysis of the data. Visitor satisfaction with the top 40 retail websites (by sales volume, according to Internet Retailer’s June 2009 issue) has reached an all-time high in the US, up 7% since last year. Most retailers included in the past two years saw a year-over-year increase, though some gains seem to be actually re-bounding from 2008 declines many e-retailers experienced during the height of the recession. Still, this is remarkable progress by a still-maturing industry.
II. Satisfaction Scores by Company: Forty of the top online retailers in the US (based on annual sales volume) are scored on the study’s 100-point satisfaction scale. Amazon continues to lead the Index with a score of 87, the highest score ForeSee has ever charted in any of its E-Retail Satisfaction Indices. Websites for Macy’s, SonyStyle, The Gap, The Home Shopping Network, and Overstock.com have seen the greatest increases in satisfaction since last year, with all five registering year-over-year increases of 10% or more.
III. Why Measure Satisfaction? Academic studies show that the methodology used for this study, developed at the University of Michigan, predicts future financial success and even stock pric-es. This research quantifies that when compared to less satisfied online shoppers, highly sat-isfied shoppers are 65% more likely to purchase online, 44% more likely to purchase offline, 70% more likely to recommend, and 49% more likely to return.
IV. How to Improve Satisfaction: In aggregate, US retailers should focus on improving Price (ei-ther actual prices or just customers’ perceptions of both product prices and shipping costs) as well as the availability, variety, and appeal of Merchandise. Prescriptions for improvement vary greatly from site to site; the aggregate findings do not apply to every individual company.
V. Putting the Pieces Together: Improvements to specific website elements can drive consum-ers’ satisfaction and future behavior, such as the likelihood to purchase (online or offline), recommend, or return to the site.
VI. Research Methodology: This study includes nearly 10,000 survey responses conducted with visitors to the top 40 US e-commerce sites in November and December 2009.
VII. Forthcoming Research: Additional analysis based on this research will be available in Janu-ary and February on topics like mobile commerce, free shipping, social media, and more.
3 • ForeSee Results Holiday E-Retail Satisfaction Index (US) 2009
www.ForeSeeResults.com
Overview
Online retail continues to experience significant expansion in the US, fulfilling the growth expecta-tions of many in the industry. In fact, hard on the heels of a dismal economic year and sagging online sales at the beginning of the fourth quarter, US retailers are being given an unexpected and surpris-ing gift this holiday season. According to the ForeSee Results E-Retail Satisfaction Index (US Holiday Edition) online satisfaction in the US is up nearly 7% year over year, from 74 in 2008 to 79 on the study’s 100-point scale. Since satisfaction predicts revenue, the top retailers measured in this study could have a merrier holiday than some are expecting, though many smaller e-retailers (not included in this study) are seeing considerable erosion of market share and revenues this year. As a side note, satisfaction was also up significantly in the UK edition of the E-Retail Satisfaction Index, which can be accessed at www.ForeSeeResults.com.
The holiday shopping season is the most critical time of the year in e-retail, even more critical than the balance of the calendar year for many online retailers. Because e-retailers draw such a large percentage of their annual sales during this brief window of time, end-of-year sales more often than not deter-mine the fiscal health of even the soundest of organizations. While this tumultuous economic period is challenging all levels of industry, e-retailers are uniquely positioned to take advantage of customers’ skittishness with traditional retail options and appeal to an entire new customer base while solidifying relationships with existing ones. The online channel continues to be one of the few success stories in the retail economy, meaning that retail websites are more essential and capable than ever before.
For the past five years, ForeSee Results has conducted the ForeSee Results E-Retail Satisfaction Index (US Holiday Edition) an analysis of customer satisfaction with the top 40 online retailers in the United States (according to sales volume) during the holiday shopping season. This report provides year-over-year comparisons of both aggregate satisfaction and satisfaction with individual retailers. ForeSee Results uses the academic methodology of the American Customer Satisfaction Index (ACSI), developed at the University of Michigan, which shows that customer satisfaction is predictive of financial performance and an influencer of future customer behavior, such as online and offline sales and recommendations. Further explanation of the methodology used in this study can be found at the end of this paper.
The year-over-year increase in satisfaction for many individual retailers can be explained by several key factors:
1) E-retail is actually improving. Many US e-retailers have embraced the findings that improving online customer experience has a demonstrable and tangible effect on their bottom lines and made changes to online shopping that are in part responsible for their increase in satisfaction. We asked all of the companies with the biggest increases in satisfaction what they thought was responsible for the jump, and got several responses:
• Kent Anderson, president of Macys.com says the site has done a significant amount of work to improve the site’s merchandise offering, functionality, accuracy, quality and fresh-ness of content over the last year, while also working diligently through customer data to proactively find and solve customer problems. These changes are in part responsible for macys.com’s increase of 9 points and 13% year over year. In order to improve functional-ity and ease of shopping, macys.com added “finders” and buying guides, product reviews,
4 • ForeSee Results Holiday E-Retail Satisfaction Index (US) 2009
www.ForeSeeResults.com
intelligent cross-sell capability, and hundreds of product videos. Macys.com has dramati-cally increased its non-selling content on the site via Come Together (hunger relief) this fall, Believe (which raised funds for Make-A-Wish) this holiday, Style Source, and Shop for a Better World (baskets and related products made by widows of the Rwandan genocide).
• Tom Aiello at Sears.com (up 7% and 5 points from last year) says that the leading multi-channel retailer has strategically highlighted consumer choice in the past year, in terms of channel (store, website, call center, and an innovative mobile shopping site), product (adding inventory to the website with limited or nonexistent inventory in stores, such as books, music, movies, and wireless phones), payment options (Sears added Express checkout with PayPal and eBillme), language (Spanish or English), and order fulfilment (customers can buy online and have it shipped, pick it up in the store, or pick it up curb side at some locations).
• Lewis Goldman, senior vice president of brand marketing at 1-800-Flowers.com said that the leading online florist has improved the quality and delivery of products by focusing on a florist network that enables florists to provide a better customer experience. 1-800-Flow-ers.com has also worked on more proactively communicating with customers who may experience a delay due to inclement weather. Additionally, the website added new product images and the ability to review products on the site, functionality that ForeSee Results re-search has shown increases customer satisfaction. This combination of new features and functionality is in part responsible for the website’s year-over-year increase of six points and 8.3%, an impressive gain.
2) Many e-retailers experienced declines last year during the recession, so many of this year’s increases reflect a recovery of lost ground. Many e-retailers that have large year-over-year increases are simply recouping last year’s losses. However, some have truly made huge strides over the past few years.
3) This study measures only the top 40 e-retailers by sales volume. Therefore, it is not reflective of the retail industry overall. Our client data, our benchmarks, and other industry research from Comscore and others show again and again that the best e-retailers are getting better and many of the rest are getting worse. While we see nice increases for many companies in the Top 40, it doesn’t mean the industry overall is getting better. This index improved, in part, because it includes only the best of the best. ForeSee Results benchmarks that include a wider range of large, medium, and small online retailers tell a very different story.
4) Scores were up more dramatically for first-time visitors than for repeat visitors (though re-peat visitors’ scores are also up). Since first-time visitors are typically far less satisfied than repeat visitors, this increase is a good sign that retail websites, as a whole, have truly improved their visitors’ experiences
5) The study shows that the overall increase can be partly attributed to improvements to content and functionality among the top 40 e-retailers. However, the two elements with the highest impact on satisfaction in the future are price and merchandise, and so for many e-retailers, continued improvements will hinge on attention to the latter two areas.
5 • ForeSee Results Holiday E-Retail Satisfaction Index (US) 2009
www.ForeSeeResults.com
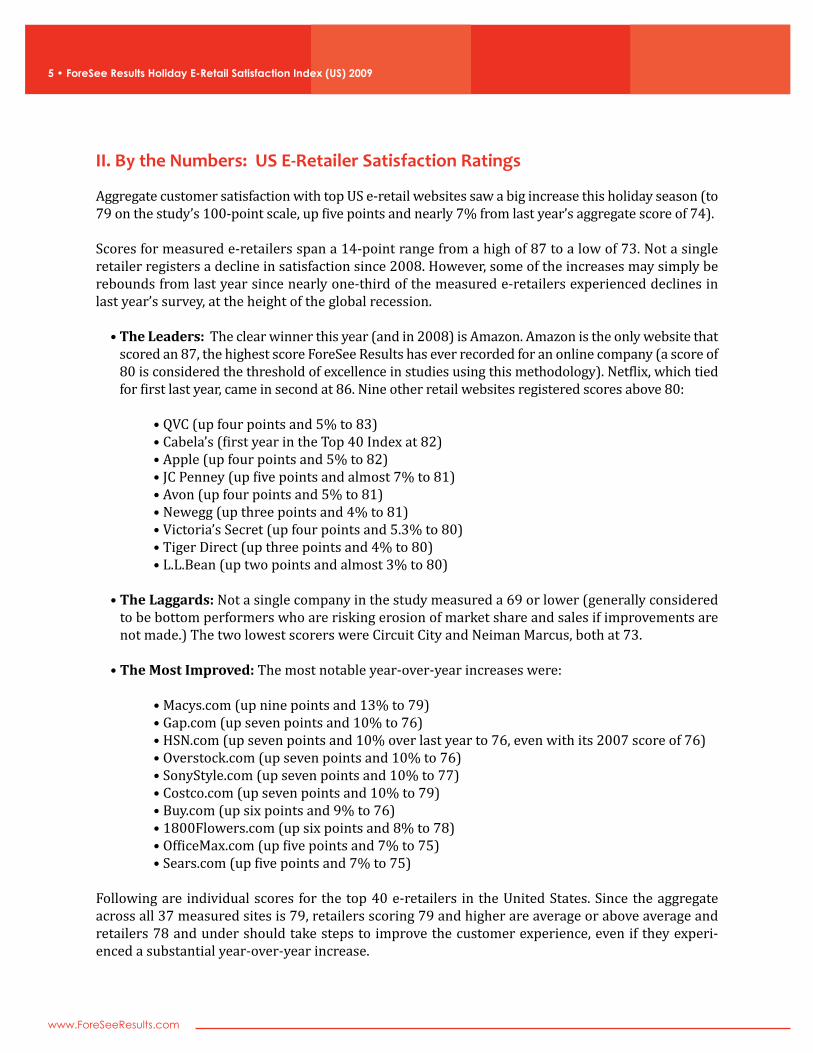
II. By the Numbers: US E-Retailer Satisfaction Ratings
Aggregate customer satisfaction with top US e-retail websites saw a big increase this holiday season (to 79 on the study’s 100-point scale, up five points and nearly 7% from last year’s aggregate score of 74).
Scores for measured e-retailers span a 14-point range from a high of 87 to a low of 73. Not a single retailer registers a decline in satisfaction since 2008. However, some of the increases may simply be rebounds from last year since nearly one-third of the measured e-retailers experienced declines in last year’s survey, at the height of the global recession.
• The Leaders: The clear winner this year (and in 2008) is Amazon. Amazon is the only website that scored an 87, the highest score ForeSee Results has ever recorded for an online company (a score of 80 is considered the threshold of excellence in studies using this methodology). Netflix, which tied for first last year, came in second at 86. Nine other retail websites registered scores above 80:
• QVC (up four points and 5% to 83) • Cabela’s (first year in the Top 40 Index at 82) • Apple (up four points and 5% to 82) • JC Penney (up five points and almost 7% to 81) • Avon (up four points and 5% to 81) • Newegg (up three points and 4% to 81) • Victoria’s Secret (up four points and 5.3% to 80) • Tiger Direct (up three points and 4% to 80) • L.L.Bean (up two points and almost 3% to 80)
• The Laggards: Not a single company in the study measured a 69 or lower (generally considered to be bottom performers who are risking erosion of market share and sales if improvements are not made.) The two lowest scorers were Circuit City and Neiman Marcus, both at 73.
• The Most Improved: The most notable year-over-year increases were:
• Macys.com (up nine points and 13% to 79) • Gap.com (up seven points and 10% to 76) • HSN.com (up seven points and 10% over last year to 76, even with its 2007 score of 76) • Overstock.com (up seven points and 10% to 76) • SonyStyle.com (up seven points and 10% to 77) • Costco.com (up seven points and 10% to 79) • Buy.com (up six points and 9% to 76) • 1800Flowers.com (up six points and 8% to 78) • OfficeMax.com (up five points and 7% to 75) • Sears.com (up five points and 7% to 75)
Following are individual scores for the top 40 e-retailers in the United States. Since the aggregate across all 37 measured sites is 79, retailers scoring 79 and higher are average or above average and retailers 78 and under should take steps to improve the customer experience, even if they experi-enced a substantial year-over-year increase.
6 • ForeSee Results Holiday E-Retail Satisfaction Index (US) 2009
www.ForeSeeResults.com
Figure 1: Shopper Satisfaction with Top 40 Online Retailers in the US
Website Holiday 2006
Holiday 2007
Holiday 2008
Holiday 2009
% Change Since 2008
% Change Since 2007
AGGREGATE 75 74 74 79 6.8% 6.8%
Amazon.com 84 82 84 87 3.6% 6.1%
Netflix.com 86 86 84 86 2.4% 0.0%
QVC.com 80 80 79 83 5.1% 3.8%
Apple.com 79 79 78 82 5.1% 3.8%
Cabelas.com NM NM NM 82 NA NM
Avon.com 76 79 77 81 5.2% 2.5%
JCP.com (JC Penney) 76 75 76 81 6.6% 8.0%
Newegg.com 78 77 78 81 3.8% 5.2%
LLBean.com 80 80 78 80 2.6% 0.0%
TigerDirect.com 76 77 77 80 3.9% 3.9%
VictoriasSecret.com NM NM 76 80 5.3% NM
Costco.com 69 72 72 79 9.7% 9.7%
Dell.com 77 74 74 79 6.8% 6.8%
Macys.com 71 71 70 79 12.9% 11.3%
MusiciansFriend.com NM NM NM 79 NA NM
Nordstrom.com 74 74 74 79 6.8% 6.8%
Walmart.com 73 74 78 79 1.3% 6.8%
Williams-Sonoma.com 77 75 74 79 6.8% 5.3%
Zappos.com 75 78 75 79 5.3% 1.3%
1800Flowers.com 74 71 72 78 8.3% 9.9%
Shopping.hp.com 78 75 76 78 2.6% 4.0%
Target.com 74 72 75 78 4.0% 8.3%
BestBuy.com 73 74 73 77 5.5% 4.1%
Blockbuster.com NM NM 72 77 6.9% NM
OfficeDepot.com 73 71 72 77 6.9% 8.5%
SonyStyle.com 73 70 70 77 10.0% 10.0%
Staples.com 73 73 77 77 0.0% 5.5%
Buy.com 72 70 70 76 8.6% 8.6%
Gap.com 74 NM 69 76 10.1% NM
HSN.com 75 76 69 76 10.1% 0.0%
Overstock.com 71 70 69 76 10.1% 8.6%
Chadwicks.com 76 73 73 75 2.7% 2.7%
OfficeMax.com NM 68 70 75 7.1% 10.3%
Sears.com 73 70 70 75 7.1% 7.1%
ToysRUs.com 71 72 NM 75 NA 4.2%
CircuitCity.com 74 73 NM 73 NA 0.0%
NeimanMarcus.com 73 72 69 73 5.8% 1.4%
*not measured in 2009 due to insufficient sample size: Quixtar.com, CDW.com, PCConnection.com

7 • ForeSee Results Holiday E-Retail Satisfaction Index (US) 2009
www.ForeSeeResults.com
There are several different ways for an e-retailer to put its score in context by using the benchmark-ing abilities provided by the ACSI methodology. E-retailers can compare their own score in the follow-ing ways in order to determine whether they are leading the pack or falling short:
• Comparison to the overall aggregate for US e-retailers (79). Any retailer falling below 79 is risking loyalty, recommendations, sales, and market share. By this measure, 18 of the 37 mea-sured e-retailers are underperforming their US peers.
• Comparison to US top performers. A consumer’s expectations are going to be set by their visits to other sites, and most customers have experience with the best sites on this list. Furthermore, as a result of the difficult economy, every purchase is a far more considered purchase than what we have historically seen. Therefore, e-retailers are no longer competing mainly against direct competitors; they’re competing against all retailers for purchase dollars. By this measure, ev-eryone but Amazon and Netflix has work to do. If the rest of the pack continues to improve, even Amazon and Netflix will have to continue to work hard and innovate to stay on top.
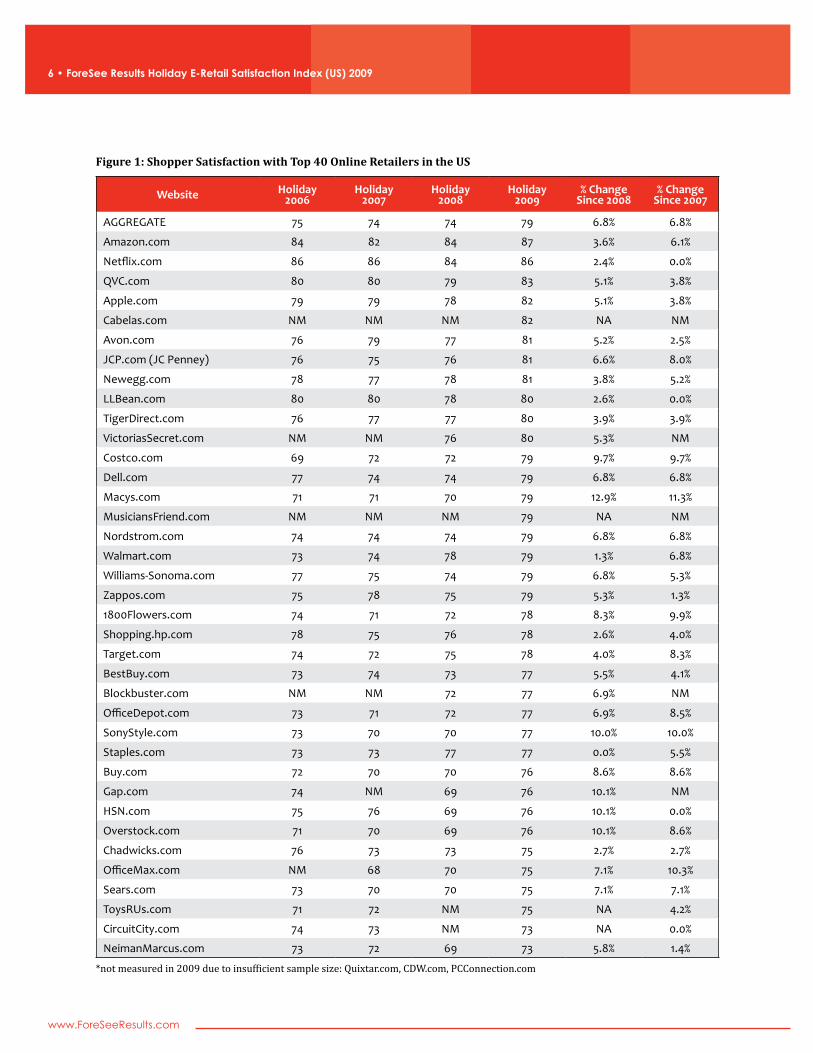
• Comparison to direct competitors. All retailers in the Index are classified by product category (apparel and accessories, computers and electronics, mass merchants, etc.). It can be useful for retailers to see where they stand in terms of product and channel competition:
• Eleven of the e-retailers in the Index are classified as mass merchants, and three of the eleven score over 80 (Amazon.com, JCPenney.com, and QVC.com). The aggregate for all mass merchants is 79, up five points and 7% from last year. Any mass merchant scoring 78 or lower is in danger of losing business to those scoring above 79.
• There are eight e-retailers in the Index classified as computer and/or electronics retailers, led by perennial customer favorite Apple.com. The aggregate for this category is 78, up four points and 5.4% since last year. Computer and electronics e-retailers need to score 78 or above to remain competitive.
• There are seven apparel and/or accessories websites in the Index with an aggregate score
of 77, up four points since last year. Any apparel retailer with an online customer satis-faction score of 76 or under must improve in order to keep pace. LLBean.com and Victo-riasSecret.com tie for the top spot with 80.
8 • ForeSee Results Holiday E-Retail Satisfaction Index (US) 2009
www.ForeSeeResults.com
Figure 2: Satisfaction by Product Category
Website Satisfaction Holiday 2009 Website Satisfaction
Holiday 2009 Website Satisfaction Holiday 2009
Mass Merchant Aggregate 79
Computers and Electronics
Aggregate78
Apparel and Accessories Aggregate
77
Amazon.com 87 Apple.com 82 LLBean.com 80
QVC.com 83 Newegg.com 81 VictoriasSecret.com 80
JCPenney.com 81 TigerDirect.com 80 Nordstrom.com 79
Costco.com 79 Dell.com 79 Zappos.com 79
Macys.com 79 Shopping.hp.com 78 Gap.com 76
Walmart.com 79 BestBuy.com 77 Chadwicks.com 75
Target.com 78 SonyStyle.com 77 NeimanMarcus.com 73
Buy.com 76 CircuitCity.com 73
HSN.com 76
Overstock.com 76
Sears.com 75
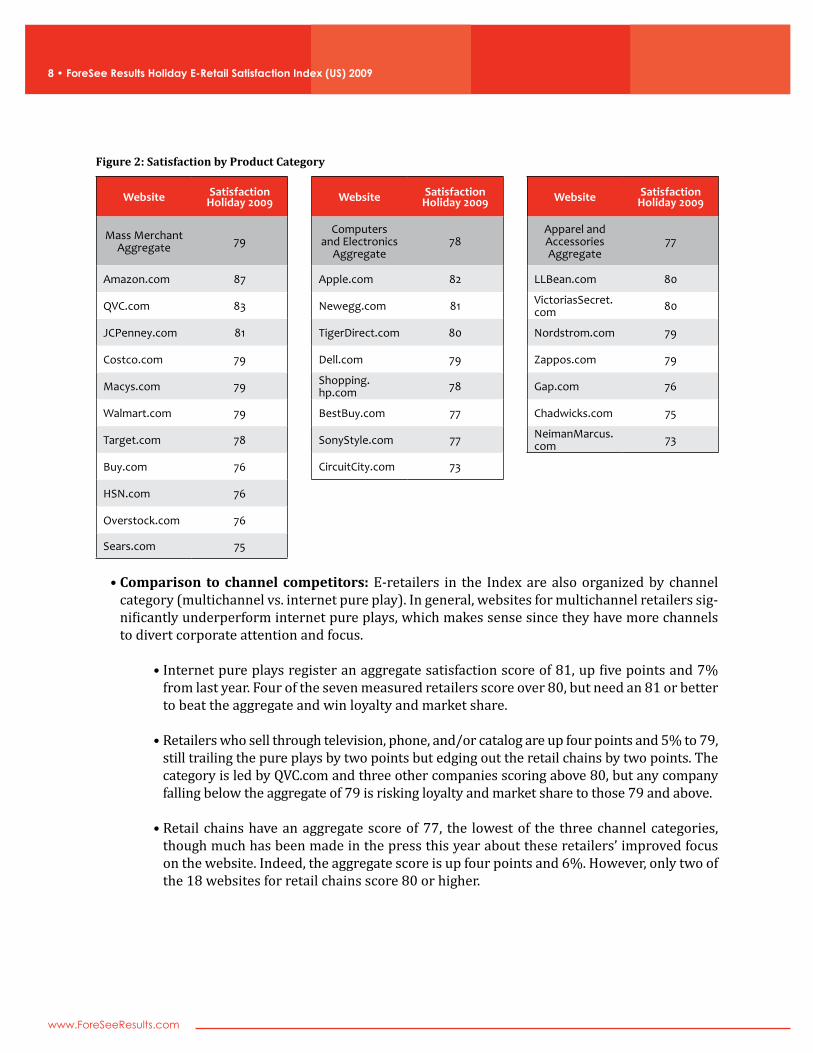
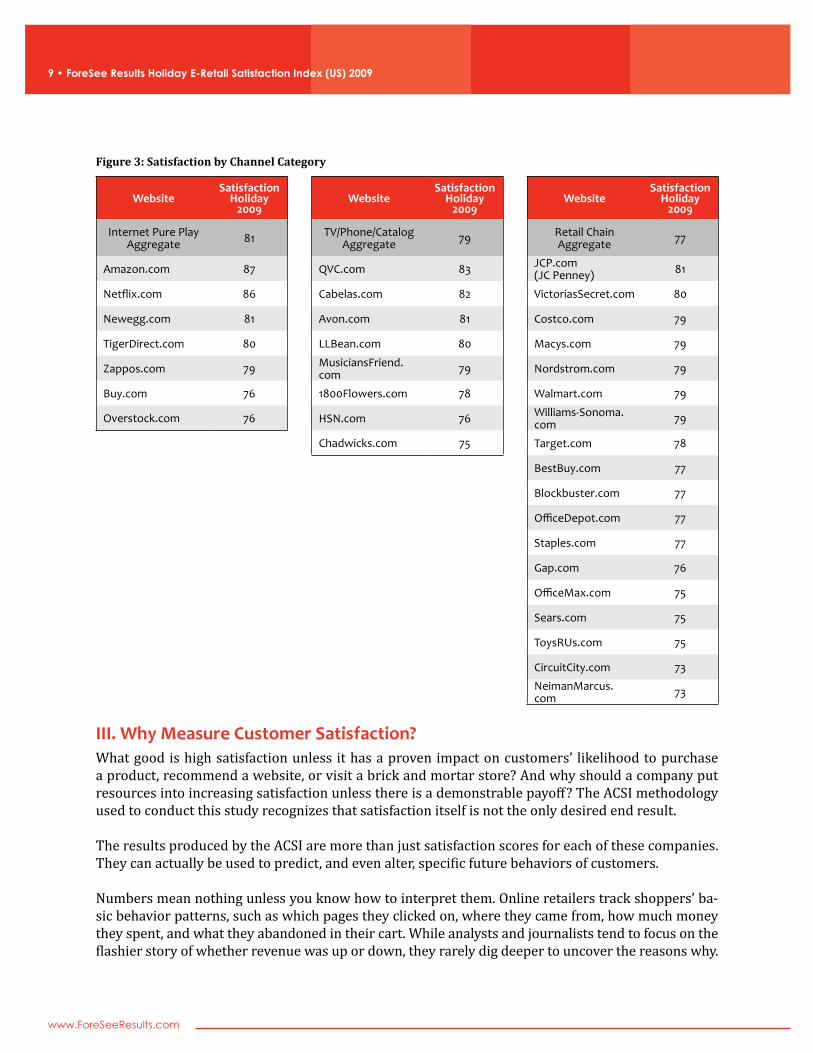
• Comparison to channel competitors: E-retailers in the Index are also organized by channel category (multichannel vs. internet pure play). In general, websites for multichannel retailers sig-nificantly underperform internet pure plays, which makes sense since they have more channels to divert corporate attention and focus.
• Internet pure plays register an aggregate satisfaction score of 81, up five points and 7% from last year. Four of the seven measured retailers score over 80, but need an 81 or better to beat the aggregate and win loyalty and market share.
• Retailers who sell through television, phone, and/or catalog are up four points and 5% to 79, still trailing the pure plays by two points but edging out the retail chains by two points. The category is led by QVC.com and three other companies scoring above 80, but any company falling below the aggregate of 79 is risking loyalty and market share to those 79 and above.
• Retail chains have an aggregate score of 77, the lowest of the three channel categories, though much has been made in the press this year about these retailers’ improved focus on the website. Indeed, the aggregate score is up four points and 6%. However, only two of the 18 websites for retail chains score 80 or higher.
9 • ForeSee Results Holiday E-Retail Satisfaction Index (US) 2009
www.ForeSeeResults.com
Figure 3: Satisfaction by Channel Category
WebsiteSatisfaction
Holiday 2009
WebsiteSatisfaction
Holiday 2009
WebsiteSatisfaction
Holiday 2009
Internet Pure Play Aggregate 81 TV/Phone/Catalog
Aggregate 79 Retail Chain Aggregate 77
Amazon.com 87 QVC.com 83 JCP.com (JC Penney) 81
Netflix.com 86 Cabelas.com 82 VictoriasSecret.com 80
Newegg.com 81 Avon.com 81 Costco.com 79
TigerDirect.com 80 LLBean.com 80 Macys.com 79
Zappos.com 79 MusiciansFriend.com 79 Nordstrom.com 79
Buy.com 76 1800Flowers.com 78 Walmart.com 79
Overstock.com 76 HSN.com 76 Williams-Sonoma.com 79
Chadwicks.com 75 Target.com 78
BestBuy.com 77
Blockbuster.com 77
OfficeDepot.com 77
Staples.com 77
Gap.com 76
OfficeMax.com 75
Sears.com 75
ToysRUs.com 75
CircuitCity.com 73
NeimanMarcus.com 73
III. Why Measure Customer Satisfaction?What good is high satisfaction unless it has a proven impact on customers’ likelihood to purchase a product, recommend a website, or visit a brick and mortar store? And why should a company put resources into increasing satisfaction unless there is a demonstrable payoff? The ACSI methodology used to conduct this study recognizes that satisfaction itself is not the only desired end result.
The results produced by the ACSI are more than just satisfaction scores for each of these companies. They can actually be used to predict, and even alter, specific future behaviors of customers.
Numbers mean nothing unless you know how to interpret them. Online retailers track shoppers’ ba-sic behavior patterns, such as which pages they clicked on, where they came from, how much money they spent, and what they abandoned in their cart. While analysts and journalists tend to focus on the flashier story of whether revenue was up or down, they rarely dig deeper to uncover the reasons why.
10 • ForeSee Results Holiday E-Retail Satisfaction Index (US) 2009
www.ForeSeeResults.com
Using hits, clicks, time spent, or revenue reports alone to determine how well the online retail indus-try performed during the 2009 holiday shopping season leaves many critical questions unanswered. For example, revenue figures do not reveal the contribution of websites to other sales channels or how to make loyal year-round customers of holiday shoppers. Clicks don’t reveal whether a shop-per went deep into a site because they were engaged or because they couldn’t easily find what they wanted. Getting inside the minds of site browsers and assessing their satisfaction provides a critical perspective on how to maximize the contribution of the website to drive overall sales, customer sat-isfaction, and loyalty both during the holiday season and throughout the year.
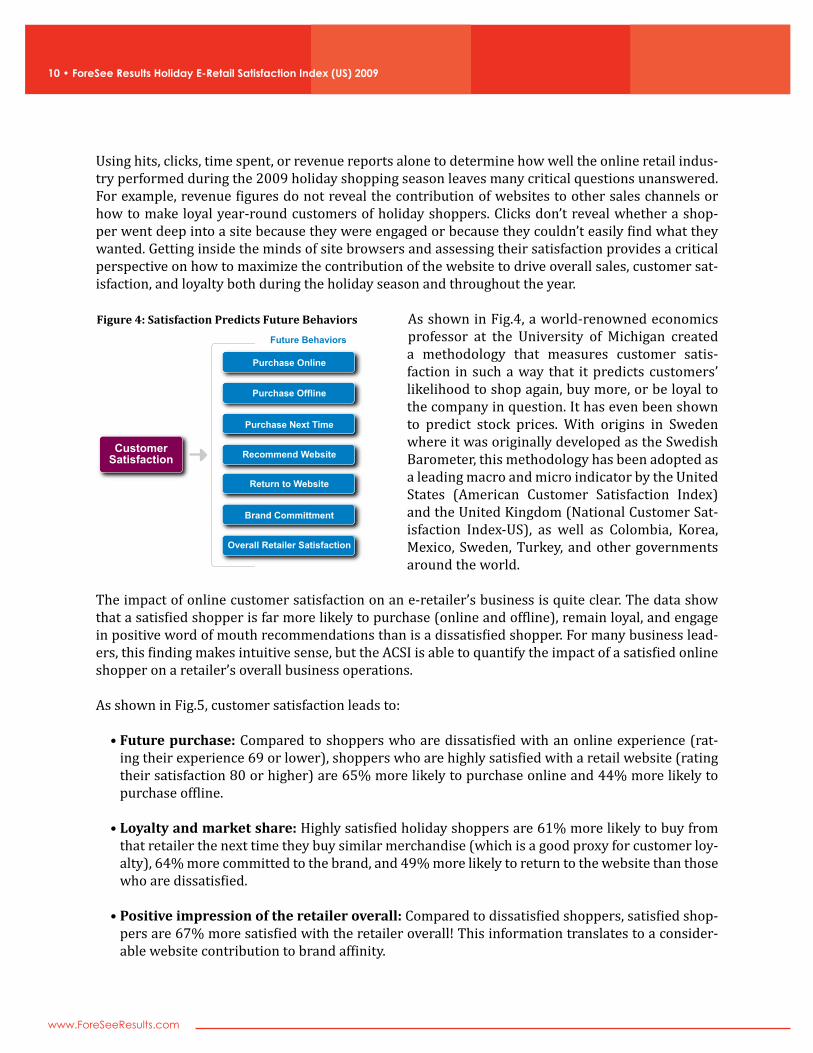
As shown in Fig.4, a world-renowned economics professor at the University of Michigan created a methodology that measures customer satis-faction in such a way that it predicts customers’ likelihood to shop again, buy more, or be loyal to the company in question. It has even been shown to predict stock prices. With origins in Sweden where it was originally developed as the Swedish Barometer, this methodology has been adopted as a leading macro and micro indicator by the United States (American Customer Satisfaction Index) and the United Kingdom (National Customer Sat-isfaction Index-US), as well as Colombia, Korea, Mexico, Sweden, Turkey, and other governments around the world.
The impact of online customer satisfaction on an e-retailer’s business is quite clear. The data show that a satisfied shopper is far more likely to purchase (online and offline), remain loyal, and engage in positive word of mouth recommendations than is a dissatisfied shopper. For many business lead-ers, this finding makes intuitive sense, but the ACSI is able to quantify the impact of a satisfied online shopper on a retailer’s overall business operations.
As shown in Fig.5, customer satisfaction leads to:
• Future purchase: Compared to shoppers who are dissatisfied with an online experience (rat-ing their experience 69 or lower), shoppers who are highly satisfied with a retail website (rating their satisfaction 80 or higher) are 65% more likely to purchase online and 44% more likely to purchase offline.
• Loyalty and market share: Highly satisfied holiday shoppers are 61% more likely to buy from that retailer the next time they buy similar merchandise (which is a good proxy for customer loy-alty), 64% more committed to the brand, and 49% more likely to return to the website than those who are dissatisfied.
• Positive impression of the retailer overall: Compared to dissatisfied shoppers, satisfied shop-pers are 67% more satisfied with the retailer overall! This information translates to a consider-able website contribution to brand affinity.
Purchase Online
Purchase Offline
Purchase Next Time
Recommend Website
Return to Website
Brand Committment
Overall Retailer Satisfaction
CustomerSatisfaction
Future Behaviors
Figure 4: Satisfaction Predicts Future Behaviors
11 • ForeSee Results Holiday E-Retail Satisfaction Index (US) 2009
www.ForeSeeResults.com
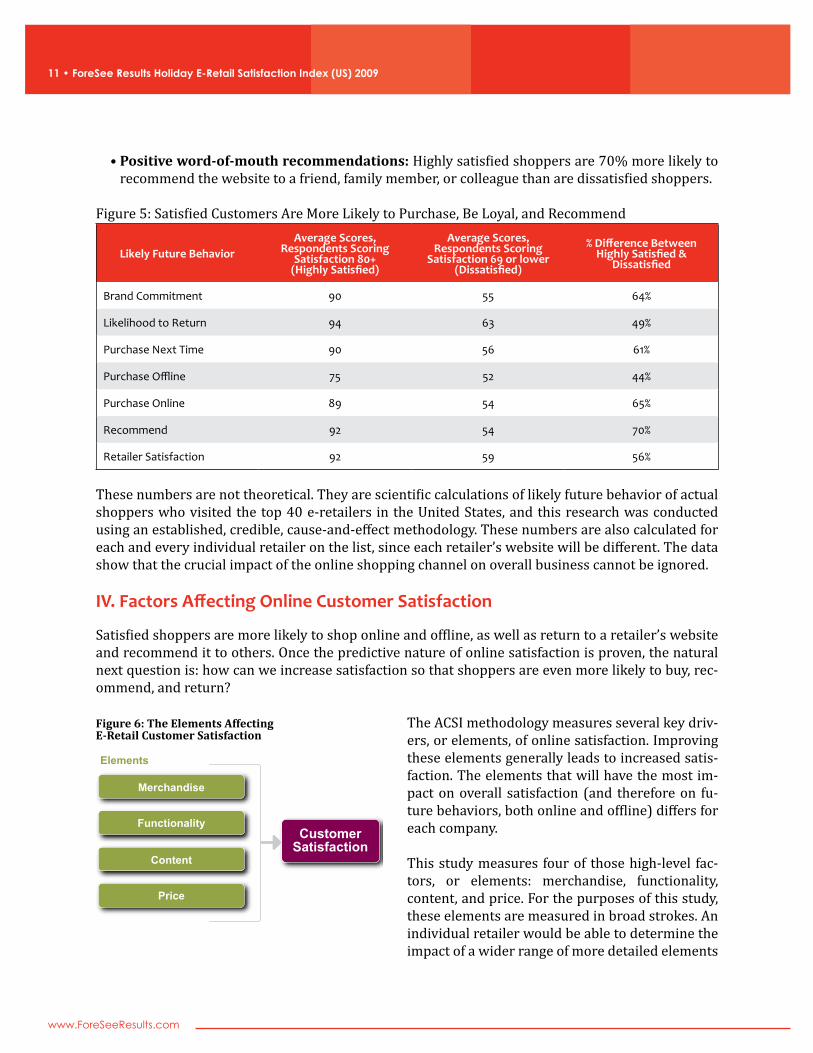
• Positive word-of-mouth recommendations: Highly satisfied shoppers are 70% more likely to recommend the website to a friend, family member, or colleague than are dissatisfied shoppers.
Figure 5: Satisfied Customers Are More Likely to Purchase, Be Loyal, and Recommend
Likely Future BehaviorAverage Scores,
Respondents Scoring Satisfaction 80+
(Highly Satisfied)
Average Scores, Respondents Scoring
Satisfaction 69 or lower (Dissatisfied)
% Difference Between Highly Satisfied &
Dissatisfied
Brand Commitment 90 55 64%
Likelihood to Return 94 63 49%
Purchase Next Time 90 56 61%
Purchase Offline 75 52 44%
Purchase Online 89 54 65%
Recommend 92 54 70%
Retailer Satisfaction 92 59 56%
These numbers are not theoretical. They are scientific calculations of likely future behavior of actual shoppers who visited the top 40 e-retailers in the United States, and this research was conducted using an established, credible, cause-and-effect methodology. These numbers are also calculated for each and every individual retailer on the list, since each retailer’s website will be different. The data show that the crucial impact of the online shopping channel on overall business cannot be ignored.
IV. Factors Affecting Online Customer Satisfaction
Satisfied shoppers are more likely to shop online and offline, as well as return to a retailer’s website and recommend it to others. Once the predictive nature of online satisfaction is proven, the natural next question is: how can we increase satisfaction so that shoppers are even more likely to buy, rec-ommend, and return?
The ACSI methodology measures several key driv-ers, or elements, of online satisfaction. Improving these elements generally leads to increased satis-faction. The elements that will have the most im-pact on overall satisfaction (and therefore on fu-ture behaviors, both online and offline) differs for each company.
This study measures four of those high-level fac-tors, or elements: merchandise, functionality, content, and price. For the purposes of this study, these elements are measured in broad strokes. An individual retailer would be able to determine the impact of a wider range of more detailed elements
Merchandise
Functionality
Content
Price
CustomerSatisfaction
Elements
Figure 6: The Elements Affecting E-Retail Customer Satisfaction
12 • ForeSee Results Holiday E-Retail Satisfaction Index (US) 2009
www.ForeSeeResults.com
for their specific websites (such as the likelihood to sign up for a newsletter or the likelihood to buy a gift card for a friend) with far more precision when doing individual satisfaction analysis.
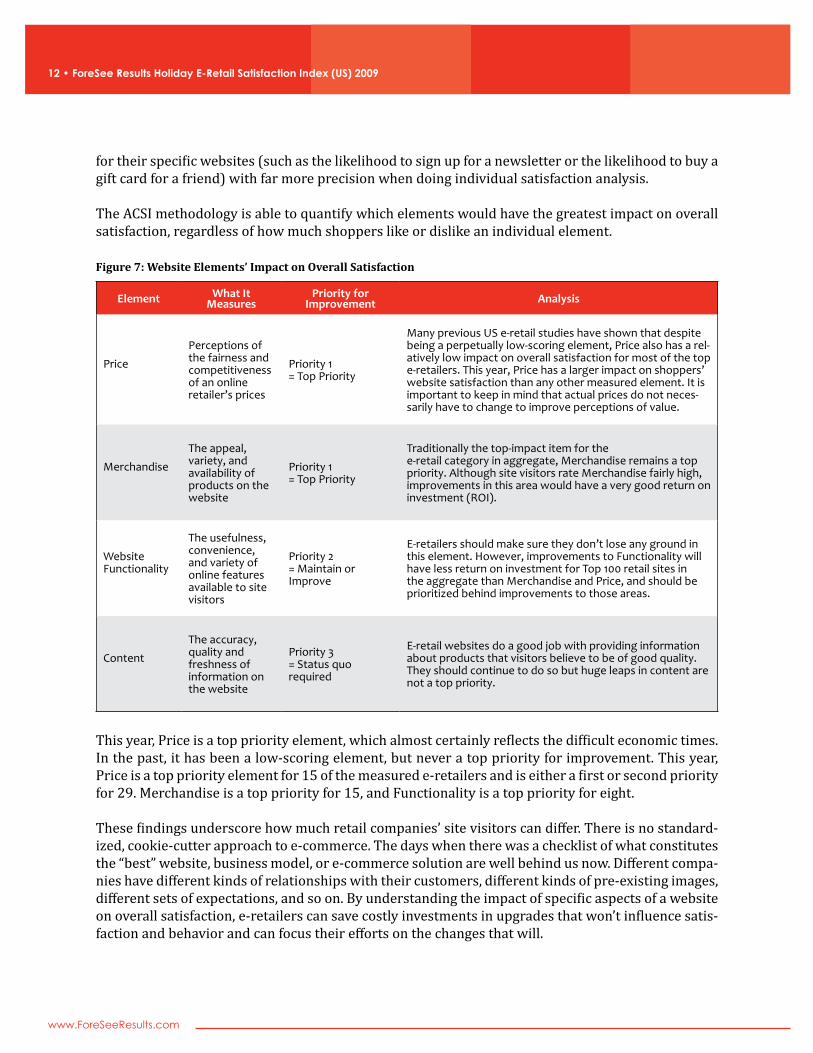
The ACSI methodology is able to quantify which elements would have the greatest impact on overall satisfaction, regardless of how much shoppers like or dislike an individual element.
Figure 7: Website Elements’ Impact on Overall Satisfaction
Element What It Measures
Priority for Improvement Analysis
Price
Perceptions of the fairness and competitiveness of an online retailer’s prices
Priority 1 = Top Priority
Many previous US e-retail studies have shown that despite being a perpetually low-scoring element, Price also has a rel-atively low impact on overall satisfaction for most of the top e-retailers. This year, Price has a larger impact on shoppers’ website satisfaction than any other measured element. It is important to keep in mind that actual prices do not neces-sarily have to change to improve perceptions of value.
Merchandise
The appeal, variety, and availability of products on the website
Priority 1 = Top Priority
Traditionally the top-impact item for the e-retail category in aggregate, Merchandise remains a top priority. Although site visitors rate Merchandise fairly high, improvements in this area would have a very good return on investment (ROI).
Website Functionality
The usefulness, convenience, and variety of online features available to site visitors
Priority 2 = Maintain or Improve
E-retailers should make sure they don’t lose any ground in this element. However, improvements to Functionality will have less return on investment for Top 100 retail sites in the aggregate than Merchandise and Price, and should be prioritized behind improvements to those areas.
Content
The accuracy, quality and freshness of information on the website
Priority 3 = Status quo required
E-retail websites do a good job with providing information about products that visitors believe to be of good quality. They should continue to do so but huge leaps in content are not a top priority.
This year, Price is a top priority element, which almost certainly reflects the difficult economic times. In the past, it has been a low-scoring element, but never a top priority for improvement. This year, Price is a top priority element for 15 of the measured e-retailers and is either a first or second priority for 29. Merchandise is a top priority for 15, and Functionality is a top priority for eight.
These findings underscore how much retail companies’ site visitors can differ. There is no standard-ized, cookie-cutter approach to e-commerce. The days when there was a checklist of what constitutes the “best” website, business model, or e-commerce solution are well behind us now. Different compa-nies have different kinds of relationships with their customers, different kinds of pre-existing images, different sets of expectations, and so on. By understanding the impact of specific aspects of a website on overall satisfaction, e-retailers can save costly investments in upgrades that won’t influence satis-faction and behavior and can focus their efforts on the changes that will.
13 • ForeSee Results Holiday E-Retail Satisfaction Index (US) 2009
www.ForeSeeResults.com
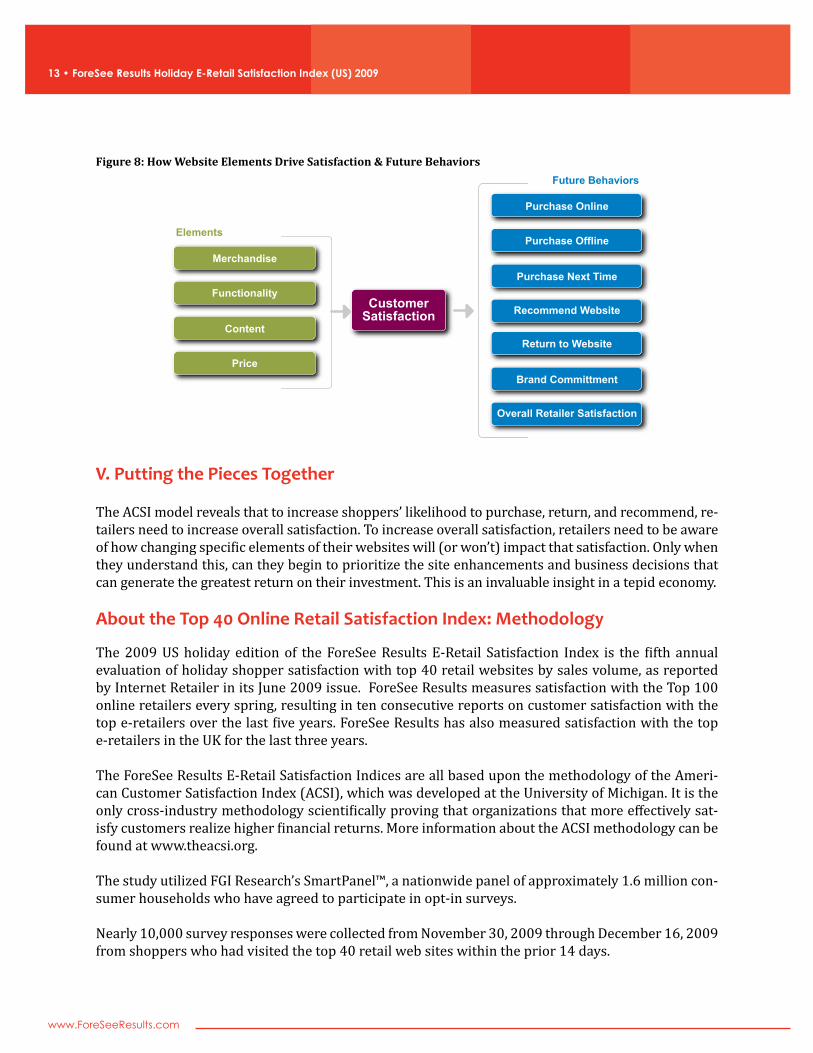
V. Putting the Pieces Together
The ACSI model reveals that to increase shoppers’ likelihood to purchase, return, and recommend, re-tailers need to increase overall satisfaction. To increase overall satisfaction, retailers need to be aware of how changing specific elements of their websites will (or won’t) impact that satisfaction. Only when they understand this, can they begin to prioritize the site enhancements and business decisions that can generate the greatest return on their investment. This is an invaluable insight in a tepid economy. About the Top 40 Online Retail Satisfaction Index: Methodology
The 2009 US holiday edition of the ForeSee Results E-Retail Satisfaction Index is the fifth annual evaluation of holiday shopper satisfaction with top 40 retail websites by sales volume, as reported by Internet Retailer in its June 2009 issue. ForeSee Results measures satisfaction with the Top 100 online retailers every spring, resulting in ten consecutive reports on customer satisfaction with the top e-retailers over the last five years. ForeSee Results has also measured satisfaction with the top e-retailers in the UK for the last three years.
The ForeSee Results E-Retail Satisfaction Indices are all based upon the methodology of the Ameri-can Customer Satisfaction Index (ACSI), which was developed at the University of Michigan. It is the only cross-industry methodology scientifically proving that organizations that more effectively sat-isfy customers realize higher financial returns. More information about the ACSI methodology can be found at www.theacsi.org.
The study utilized FGI Research’s SmartPanel™, a nationwide panel of approximately 1.6 million con-sumer households who have agreed to participate in opt-in surveys.
Nearly 10,000 survey responses were collected from November 30, 2009 through December 16, 2009 from shoppers who had visited the top 40 retail web sites within the prior 14 days.
Merchandise
Functionality
Content
Price
Purchase Online
Purchase Offline
Purchase Next Time
Recommend Website
Return to Website
Brand Committment
Overall Retailer Satisfaction
CustomerSatisfaction
Elements
Future BehaviorsFigure 8: How Website Elements Drive Satisfaction & Future Behaviors
14 • ForeSee Results Holiday E-Retail Satisfaction Index (US) 2009
www.ForeSeeResults.com
Some respondents went on to complete an online purchase, while others didn’t, so the respondent group is defined as “website browsers.” Browsers include existing customers, first-time visitors, infrequent visitors, competitors’ customers who may be cross-shopping, and others spending time researching purchases on a retail web site, perhaps with the intent to purchase through offline chan-nels. They may shop on a variety of websites and other channels before making a purchase. Knowing why a browser does or doesn’t purchase during the visit is one of the keys to understanding multi-channel impact as well as the degree to which even these top e-retailers are fulfilling their potential.
Additional Research Available
Due to the scope and breadth of the ForeSee Results E-Retail Satisfaction Index, it is impossible to re-port all of the study’s findings in a single document and within so short an analysis time. However, in the coming weeks, ForeSee Results will be publishing additional analysis on several of the following topics, which will be available by request:
• Social Networking: What sorts of online social networking sites are influencing shoppers? Which product categories benefit (or suffer) more from “new media” word of mouth?
• Acquisition Source: Which kinds of paid online marketing initiatives and traditional media spurred the best quality site traffic this holiday season?
• Free Shipping: How common has the practice of free shipping become, and how much did it matter to holiday shoppers? Did online retailers consider it a valuable investment this holiday season?
• Mobile Applications: How did shoppers used mobile devices and/or smartphones to conduct their shopping this Holiday?

15 • ForeSee Results Holiday E-Retail Satisfaction Index (US) 2009
www.ForeSeeResults.com
About the Author
Larry Freed is an expert on website effectiveness and online customer satisfaction. He is also Presi-dent and CEO of ForeSee Results, a market leader in customer satisfaction measurement, which uti-lizes the customer satisfaction methodology developed at the University of Michigan.
About ForeSee Results
As the leader in online customer satisfaction measurement, ForeSee Results captures and analyz-es online voice of customer data to help organizations increase sales, loyalty, recommendations and website value. Using the methodology of the American Customer Satisfaction Index (ACSI), ForeSee Results identifies the improvements to websites and other online initiatives with the greatest ROI. With more than 40 million survey responses collected to date and benchmarks across dozens of in-dustries, ForeSee Results offers unparalleled expertise in customer satisfaction measurement and management particularly in the retail category, with more than 110 retail measures in ForeSee Re-sults’ benchmarks.
ForeSee Results, a privately held company, is headquartered in Ann Arbor, Michigan, has offices in London and Vancouver, and can be found online at www.ForeSeeResults.com.
About FGI Research
FGI Research is a leading provider of market research and information solutions that improve the speed, accuracy and impact of business decisions. By combining proven research methods, trusted online sam-ple, and advanced analytics and communications, FGI delivers to end users and marketing research firms immediate and actionable information to decision makers throughout their respective enterpris-es. FGI offers a premier suite of online research solutions under the SmartPanel™ family of specialty and proprietary custom research panels. For additional information, visit www.fgiresearch.com.