online publication date: 19 april 2012 publisher: asian ...2(4),pp.170-181.pdf · publisher: asian...
TRANSCRIPT

Online Publication Date: 19 April 2012
Publisher: Asian Economic and Social Society
Petrophysical Characterization of Gongola Basin (Kolmani
River -1) Shaly-Sand Reservoir Using Dual Water Model
E.E.EPUH (Department of Surveying and Geoinformatics,
University of Lagos)
D. O.OLORODE (Physics Department, University of Lagos)
P.C. NWILO (Department of Surveying and Geoinformatics,
University of Lagos)
C. U EZEIGBO (Department of Surveying and Geoinformatics,
University of Lagos)
Citation: E.E.Epuh , D. O.Olorode , P.C. Nwilo , C. U Ezeigbo (2012): “Petrophysical
Characterization of Gongola Basin (Kolmani River -1) Shaly-Sand Reservoir Using Dual Water
Model ” Journal of Asian Scientific Research Vol.2, No.4, pp.170-181.

Journal of Asian Scientific Research, Vol.2, No.4, pp.170-181
170
Author (s)
E.E.Epuh Department of Surveying and Geoinformatics, University of Lagos.
E-mail: [email protected]
D. O. Olorode Physics Department, University of Lagos.
P. C. Nwilo Department of Surveying and
Geoinformatics, University of Lagos.
C. U Ezeigbo
Department of Surveying and Geoinformatics, University of Lagos.
Petrophysical Characterization of Gongola Basin (Kolmani
River -1) Shaly-Sand Reservoir Using Dual Water Model
Abstract
Qualitative and quantitative analysis were carried out in
Kolmani River -1 exploratory wells to determine the shaly-
sand reservoir petrophysical parameters such as: shale volume
effective porosity, effective water saturation, free water
resistivity and hydrocarbon saturation. The reservoir at depth
between 6720ft and 7117ft contains a non associated gas and it
occurs within the Yolde/Bima stratigraphic formations. The
presence of igneous intrusive and the pressure and temperature
observations from the well logs show that the basin has been
subjected to high geothermal effects which have destroyed a
substantial part of the hydrocarbon in place. The geothermal
effects converted the hydrocarbon to a dry gas with an estimate
of 680Mcf (six hundred and eighty thousand cubic feet)
available for production. Also, the 12% effective water
saturation shows that the well will not flow during production.
The gas volume within the Gongola basin is insignificant.
Introduction
The Gongola basin (OPL 803/806/809) was
investigated for hydrocarbon accumulation
using extensive geological and geophysical
evaluation techniques. In the application of the
geophysical techniques, gravity and seismic
reflection data were utilized. The gravity data
available was reprocessed in order to develop a
coherent map along the seismic lines. The new
map was corrected for gravity effects of tertiary
sediments and crust mantle discontinuity. First
and second degree polynomial models in one
and two variable were applied in the
determination of the optimum residual gravity
anomaly. A least squares multivariate statistical
analysis was carried out on the polynomial
models to determine the model that gives an
optimum residual gravity anomaly for basin
analysis. The second degree polynomial in two
variables gave the minimum residual and was
adopted for basin analysis. The step and two
dimensional models were adopted in the
analysis of the basin’s crustal structure and
tectonics through the determination of the fault
parameters (depth to hanging wall, depth to the
foot wall, sediment thickness and dip angles),
basement depth, geometry and density contrast
of the intrusive igneous bodies. The basement
depth was also determined using the second
vertical derivative as input anomaly profile
(Epuh et al, 2011). To enhance the
interpretation of the results of the gravity
models, downward continuation of the residual
gravity anomaly was carried out using density
log. In this, the residual anomaly was found to
be stabilized at depths between 2015 and
2170m. This region marked the upper and lower
limits of the anomalous mass horizon with a
density contrast of 0.86gcc suggesting that the
anomalous mass is hydrocarbon (Epuh, et al,
2011). In the application of the seismic
reflection data, six horizons and the top
basement obtained from the seismic sections
were mapped for structural and stratigraphic
analysis. The seismic depth conversion was
carried out using the checkshot curve and the
iterative depth algorithm (IDA) process. Table
1 shows the summary of the seismic
computations.

Petrophysical Characterization of Gongola Basin…..
171
The analysis of the gravity maps and models
showed that the basin’s structure is a reflection
of the basement architecture and is compatible
with the prevailing geological model of NE-SE
trend of graben and horst structure and the
associated block faulting in the mid-continent
basin. The characteristic high and low negative
anomalies present in the residual gravity
anomaly are due to intra-basement (intrusive)
features and the presence of metamorphic
basement. The southwest area has shallow and
unproductive basement with maximum depth of
2.0km. The favourable hydrocarbon
accumulation areas exist at the flanks of the
basin with sediment thickness of 5.0km. From
the results of the seismic time /depth structural
maps, two leads at Garin Habu (L-A) and
Kolmani River (L-B) were obtained. The
presence of a gas prospect in the Kolmani lead
was confirmed at depth between 2100m and
2700m in the Yolde/Bima stratigraphic
formations.
The integration of the residual gravity anomaly
and seismic reflection data maps showed the
matching of the two leads. Figure 1 shows the
overlay of the gravity map over the seismic
maps. The integration of the two methods
shows that the structural and stratigraphic
geometry is a combination block faulting and
up-dip stratigraphic pinch-out (Epuh et al,
2011) and the basement depth is between 5.0km
in the southeast and 7.0km in the northeast part
of the project area. Based on the structural
analysis using the time/depth structural maps,
interval and depth normalized interval
velocities; it was found that lead A is as a result
of velocity gradient (Epuh et al 2011). The
Kolmani River lead (L- B) has the trapping
potentials for hydrocarbon accumulation. This
corroborates the results obtained using gravity
models. However, the presence of igneous
intrusive shows that the basin has been
subjected to a high geothermal effect which
may have destroyed a substantial part of the
hydrocarbon in place (Bird, 2001). In the
evaluation of the Kolmani wells, the primary
targets are the sand formations of horizon H4
and H5 at depths between 2100m and 3900m
respectively. These horizons lie in the
Yolde/Bima stratigraphic formations as shown
in Figure 2 (Epuh, et al, 2011). A petrophysical
characterization of the Kolmani River reservoir
is required to determine if the producible
hydrocarbon in place is of commercial quantity.
In this research, the dual water model was
utilized in the determination of the
petrophysical characterization of the shaly-sand
reservoir because it utilizes the cation exchange
capacity (CEC) of the shale proportion. The
CEC is the measurement of positive surface
charge usually in terms of milli-ions equivalent
per 100 grams of dry clay minerals
(Schlumberger, 1989). Besides, both the dual
water model and Waxman-Smith Models
utilizes the cation exchange capacity (CEC).
However, one major problem with the
Waxman-Smith model is that it predicts that the
water sands of increasing shaliness will have
increasing effective water conductivities to the
point that shales should appear to contain quite
saline water. There is a good deal of evidence to
the contrary when it was applied to the log
observations
Geology of the Basin
The Gongola basin of the upper Benue Trough
is a North-South trending arm of the 1000km
long Benue Trough. The Benue Trough has
been described by several authors as a rift
structure whose evolution is linked to the
opening of the South Atlantic (King, 1950,
Cratchley and Jones, 1965, Wright, 1976,
Whiteman, 1982). It is a rift basin with plate
dilation leading to the opening of the Gulf of
Guinea (Benkhelil, 1989; Fairhead and Binks,
1991). Benkkhelil (1989) also suggested that
the evolution trough could also be as a result of
tension resulting in a rift or wrench related fault
basin. Mesozoic to Cenezoic magmatism has
accompanied the evolution of the tectonic rift as
it is scattered all over and throughout in the
trough (Coulon et al, 1996; Abubakar et al,
2010). A magmatic old rift was also suggested
for the Gongola basin by Shemang et al (2001)
while Abubakar et al (2010) suggested the
evolution as a combination of mantle
upwelling or rise of a mantle plume which
resulted in crustal stretching and thinning and
the emplacement of basic igneous material
within the basement and sediment which
resulted in rifting. The structural history of this
area commenced towards the beginning of the
upper cretaceous with the rifting of the upper
Benue Trough and the accumulation of

Journal of Asian Scientific Research, Vol.2, No.4, pp.170-181
172
considerable thickness of sediments. A number
of depocentres have been identified within this
NW-SE trending depression. The sub-basins in
the northern half of the trough include Bornu,
Gongola (Dukku-Bagoja, Ako), Bashar, Lau,
Damaturu, Numan etc.
The volcanic rocks are widely distributed in the
northeastern Nigeria. This area also includes the
project area. The age of the major volcanic
epoch cannot be precisely determined by
stratigraphic means. For example, minor
volcanic activity is believed to have occurred
throughout the upper cretaceous and at most
exposures, it is difficult to obtain suitable
specimen for petrographic study (Carter et al,
1963). The major epoch of volcanic activity
took place in the late Tertiary and Quaternary.
All through, there are no outcrops of volcanic
rocks in the project area. The evidences are
presented by the presence of lava interbedded in
the cretaceous sediments.
Dual Water Model Formulation
In the dual water model, the conductivity of the
non-invaded zones is expressed as
(Schlumberger, 1989; Dewan, 1995):
( ) , (1)
Where a= constant, m= cementation factor=2, and n= saturation exponent=2
m n
t wt wbt w wb w
wt
S SC C C C
a S
f é ùê ú= + -ê úë û
t w
t
C = conductivity of the non-invaded zone,C = free water conductivity
porosity, bound water saturation, total water saturation
bound water conductivity
wb wt
wb
total S S
C
f = = =
=
The effective porosity of the sand (clean
formation) phase (that is the non-clay phase) of
the formation is obtained by subtracting the
bulk volume fraction of the bound
water ( )t wbSf from the total porosity. In order
to evaluate a shaly formation using the dual
water model, four parameters were determined.
They are:
wR (Free water resistivity),
(effective porosity),ef
we S (effective water saturation)
and (average clay volume)clavV .
Methodology
Six well logs obtained from Kolmani River
were evaluated using the dual water model. The
equation and techniques with which the dual
water model petrophysical translations can be
accomplished are found in several geophysics
texts. Example: Rider (2006), Dewan (1995)
and Sclumbeger (1989). Of the six wells drilled
in the Kolmani River, only well 4 and 6 were
used for petrophysical analysis. Wells 1,2, 3
and 5 do not contain neutron and density logs.
The Interactive Petrophysics (Log Analysis
version 3.4) software was used the evaluation of
the wells.
Results and Analysis
Results
One pay zone was obtained from well 4 at
depth between 7018.75ft and 8200ft, while two
pay zones were obtained from well 6 at depth
between 6720 and 7006, and between 7073.75
and 7117.50ft respectively. The petrophysical
analysis of well 4 is shown in Figure 3 and 4
while that of well 6 is shown in Figure 5, and 6.
The statistical representation of the pay zones
are shown in Figures 7,8 and 9 respectively.
Analysis
Well 4 log Analysis
One pay zone was identified from the well log
at depth between 7018.75ft and 8200ft. Using a
mean interval thickness of 4.7, the pay
summary shows that the average clay volume
obtained is 0%, the average water saturation is
34%, the average porosity is 35%. The average
effective porosity is 32%. The gross thickness
of the pay zones is 1181.25ft. The gas volume
is obtained as 33.7BCF (Figure 5., track 7). The
statistical summary of the pay zone is shown in
Figure 7
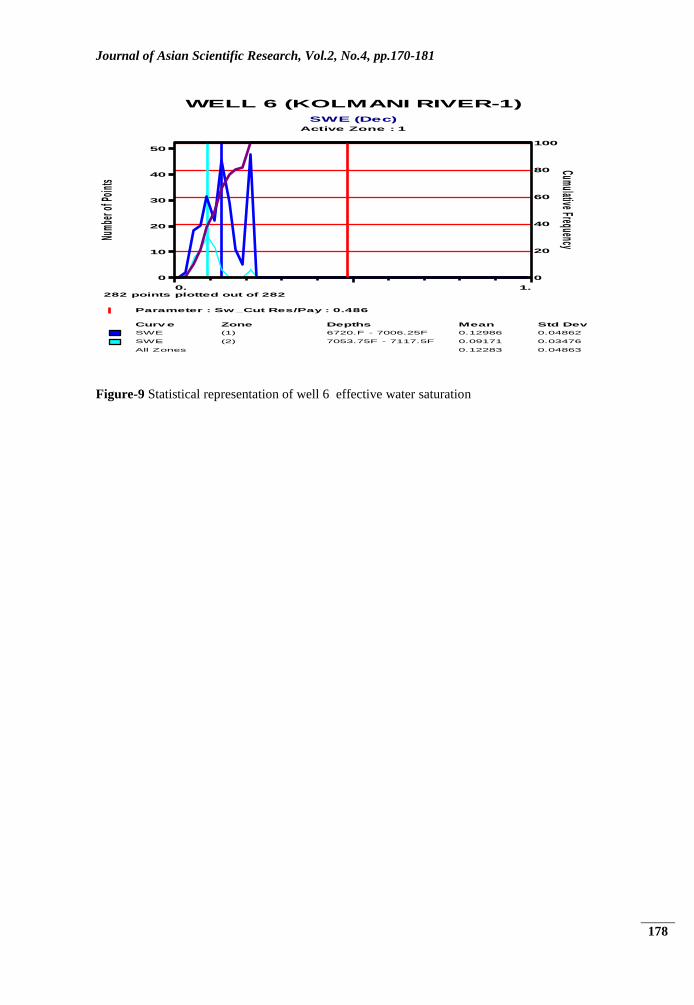
Well 6 Log Analysis
Two pay zones were identified from the well
log at depth between 6720 and 7006.25 and
between 7073.75 and 7117.50ft. Using a mean
interval thickness of 5.58, the pay summary
shows that the average clay volume obtained is
51%, the average water saturation is 49%, the
average porosity is 41% and the gas saturation

Petrophysical Characterization of Gongola Basin…..
173
is 51%. The pay summary for zone 2 shows that
the average clay volume is 38%, the average
water saturation is 36% while the average
porosity is 30%. The average effective porosity
is 22% and 31% respectively. The gross
thickness of the pay zones is 350ft. The gas
volume is 34BCF (Figure 6, track 10) with an
effective water saturation of 12% (Figure 6,
track 7). The resistivity of the clean sand (free
water resistivity ) is 0.70ohm-meter (Figure 6,
track 8). The statistical summary of the pay
zones in terms of gas and effective water
saturation are shown in Figures 8 and 9
respectively. A tabular representation of the
petrophysical analysis of the wells is shown in
Table 2.
From the above analysis of the two wells, the
following are inferred:
i. The potential reservoirs are the upper
cretaceous shallow marine sandstone
of the Yolde formation and the lower
cretaceous continental sandstone of the
Bima formation.
ii. The average amount of gas in place
from the two wells in standard cubic
feet is 34BCF and it is non-associated.
The reasonable estimate for primary
production for gas is 70% value for
volumetric fraction of hydrocarbon.
However, the 20% volumetric fraction
of 34BCF 8 3(9.63 10 )x m volume in
situ, gives a recoverable gas volume of
6.8BCF8 3(1.93 10 )x m . The gas
volume estimate is valued in billion
cubic feet (BCF). The anomalous mass
based on the volume in situ is
computed as 57.46 10 .x kg
iii. The depth of the gas accumulation is
between 2071 and 2192.9m.
iv. The well 6 water saturation in the
effective pore space is 12% for zone 1
and 9% for zone 2. Since the effective
water saturation is not tied to entrained
clay but is associated only with the
clean sand fraction, it is probable that
the zone would not produce
considerable water with any gas and
hence, the well will not flow.
v. The high geothermal gradient
associated with the intrusive igneous
and Gongola rift basin environment
was observed in the pressure and
temperature observations from the
logs. The pressure gradient stepped up
from 0.15psia per feet to 0.46psia per
feet at the depth of 7200ft; which gave
rise to a pressure value of 3312psia,
while the temperature rose from 238oF
to 255oF. At this high pressure and
temperature, the available hydrocarbon
has been converted to dry gas. A dry
gas is a natural gas that is always in the
gaseous state in the reservoir and
produces little condensable
hydrocarbon when brought to the
surface. Dry gas contains very small
portion (less than 0.1 gallon of natural
gas liquid vapours per 1,000 cubic
feet) of hydrocarbon. Based on the
6.8BCF recoverable gas volume, the
total gas volume available for
production is
680Mcf (680,000 cubic feet) or
4 31.93 10x m . The gas volume in the
Gongola basin is marginal.
vi. The basin OPL 809 gas deposit is a
low reward prospect.
Conclusion
The extensive geophysical techniques applied
in the investigation of Gongola basin have
shown that the basin contains a marginal gas
deposit. However, a geochemical analysis is
required to test the maturity of the hydrocarbon
in-situ. The state of maturity will show if the
volume will improve in the years to come.
Finally, it is observed from gravity models that
the basin is a good target for solid minerals and
ground water resources.

Journal of Asian Scientific Research, Vol.2, No.4, pp.170-181
174
8 06 - 9 7 - D- 3 7
809 -
9 7- D
- 63
8 06 - 9 7 - D- 51
8 06 - 9 7 - D- 4 9
8 06 - 9 7 - D- 4 7
8 06 - 9 7 - D- 4 5
8 06 - 9 7 - D- 4 3
8 06 - 9 7 - D- 41
8 06 - 9 7 - D- 5 8
8 06 - 9 7 - D- 6 88 06 - 9 7 - D- 6 6
8 06 - 9 7 - D- 6 0
8 06 - 9 7 - D- 5 4
8 06 - 9 7 - D- 5 0
8 06 - 9 7 - D- 4 4
8 06 - 9 7 - D- 4 0
8 06 - 9 7 - D- 3 88 06 - 9 7 - D- 3 6
8 09 - 9 7 - D- 2 68 09 - 9 7 - D- 2 28 09 - 9 7 - D- 18
G ra vity C ontour C los ure
Fa u lt Line s
Tra ns ition zone
B ound a ry
GRANITE PLUTON ZONE
BASEMENT COMPLEX ZONE
SEDIMENTARY ZONE
TRANSITION ZONE
N
R ive rs
P RO S P EC T (S EIS M IC LEAD )
S EIS M IC LIN ES
G R AVITY LIN ES
LEG EN D
LEAD L- B
DV-
0 71S
DV-
0 55S
D - 0 3 2
D - 0 4 8
DV-03 9S
D - 0 6 4
I
D -03 9N
V- 0 8 0
D - 0 9 6
V-0 2 3
V- 1 2 0
V- 1 4 6
R. G
aji
R . Ko lm
a ni
Gongo la
Riv
e r
AKKO
LG A
YO U TARE
D U KKU
KIR FI
ALKALERI
W IKKI
G AR
D IN D IM A
ALKALERI
Z ALAN G A
KO LM AN I
R IVER
P R O S PEC T
LEAD L- A
L
S
J
Q
P
ON
MW
K
V
U
XH
F
E
D
C
B
A
YAN KARI
D U G U RI
ALKALERI
LG A
D AR AZ O
LG A
G AN JU W A
LG A
D U KKU
LG A
1 0 5 5 0 0 0 m N
1 0 7 5 0 0 0 m N
1 0 5 5 0 0 0 m N
1 0 7 5 0 0 0 m N
O PL 8 0 3
O PL 8 0 6
7000
00m
E
6750
00m
E
6500
00m
E
6250
00m
E
7000
00m
E
6750
00m
E
6500
00m
E
1 1 0 0 0 0 0 m N
1 1 2 5 0 0 0 m N
1 1 5 0 0 0 0 m N
1 1 7 5 0 0 0 m N
1 2 0 0 0 0 0 m N
1 2 2 5 0 0 0 m N
1 1 0 0 0 0 0 m N
1 1 2 5 0 0 0 m N
1 1 5 0 0 0 0 m N
1 1 7 5 0 0 0 m N
1 2 0 0 0 0 0 m N
6250
00m
E
1 2 2 5 0 0 0 m N
YAN KARI N ATIO N AL PARK
O PL 8 0 9
S O RO
D U KKU
D AR AZ O
Figure-1 An Overlay of the Residual Gravity Anomaly map over the Seismic Map; showing the
lead locations(Epuh et al, 2011).
OPL 806OPL 803 OPL 809
Kerri-Kerri
Gombe
Pindiga
Yolde
Bima
Bima
Top Basement
Depth (m)
500
1500
2100
2700
3400
5200
Kolmani River Well
Gas
Water
3900
7kmGrowth Fault
Structural/Stratigraphic Geometry of Gongola Basin
Figure-2 Structural/Stratigraphic Geometry of Gongola basin (OPL 803/806/809)

Petrophysical Characterization of Gongola Basin…..
175
Figure -3 Showing Porosity, water saturation and Lithology of well 4
Figure-4 Showing effective porosity, water saturation, average clay volume and the gas volume of
well 4

Journal of Asian Scientific Research, Vol.2, No.4, pp.170-181
176
Figure-5 Showing porosity, water saturation and Lithology of well 6
Figure -6 Showing effective porosity, effective water saturation, average clay volume , free water
resistivity and the gas volume for well 6

Petrophysical Characterization of Gongola Basin…..
177
WELL 4 (KOLMANI RIVER -1)
G (mcf)
Active Zone : 1
0
20
40
60
80
100
Cumulative Frequency
0. 92449.13
0
10
Num
ber o
f Poi
nts
190 points plotted out of 190
Parameter : G_Cut Res/Pay : 0.
Curv e Zone Depths Mean Std Dev
G (1) 7018.75F - 8200.F 33663. 15580.
All Zones 33663. 15580.
Figure-7 Statistical representation of well 4 gas saturation
WELL 6 (KOLMANI RIVER-1)
G (mcf)
Active Zone : 1
0
20
40
60
80
100
Cumulative Frequency
0. 153372.9
0
10
20
30
40
50
Num
ber o
f Poi
nts
282 points plotted out of 282
Parameter : Vcl_Cut Res/Pay : 0.509
Curv e Zone Depths Mean Std Dev
G (1) 6720.F - 7006.25F 32616. 27520.
G (2) 7053.75F - 7117.5F 40570. 23940.
All Zones 34082. 27030.
Figure-8 Statistical representation of well 6 gas saturation
Journal of Asian Scientific Research, Vol.2, No.4, pp.170-181
178
WELL 6 (KOLMANI RIVER-1)
SWE (Dec)
Active Zone : 1
0
20
40
60
80
100
Cumulative Frequency
0. 1.
0
10
20
30
40
50
Numb
er o
f Poi
nts
282 points plotted out of 282
Parameter : Sw_Cut Res/Pay : 0.486
Curv e Zone Depths Mean Std Dev
SWE (1) 6720.F - 7006.25F 0.12986 0.04862
SWE (2) 7053.75F - 7117.5F 0.09171 0.03476
All Zones 0.12283 0.04863
Figure-9 Statistical representation of well 6 effective water saturation

Petrophysical Characterization of Gongola Basin…..
179
Table-1 Interval velocity, density, Reflection Coefficient, Acoustic Impedance and Lithology for lead L-B (Epuh et al, 2011)
Horizon
Depth
(m) Structural Lead
Interval Velocity x1000
(m/s)
Normalized
Interval Velocity x1000
(m/s) Density (gcc)
Reflection
Coefficient
Acoustic Impedance
X1000 Lithology
Time Depth L-A L-B L-A L-B L-A L-B L-A L-B L-A L-B L-A L-B
H1 0-500 NIL NIL 2.70 2.80 2.81 2.91 2.23 2.26 1.00 1.00 6.03 6.31 Shale Shale
H2 500-1500 NIL NIL 2.70 3.10 2.81 3.22 2.23 2.31 0.00 0.06 6.03 7.17 Shale
Shale
H3 1500-2100 NIL NIL 2.70 3.30 2.81 3.43 2.23 2.35 0.00 0.04 6.03 7.75 Shale
Shale
H4
2100-
2700
L-A/
L-B
L-A/
L-B 2.75 3.20 2.86 3.33 2.24 2.33 0.01 -0.02 6.17 7.46 Shale
Gas
sand
H5
2700-
3900
L-A/
L-B
L-A/
L-B 2.80 4.96 2.91 5.16 2.26 2.60 0.01 0.27 6.31
12.9
0 Shale
Water
Sand
H6
3900-
5200
L-A/
L-B
L-A/
L-B 4.45 5.58 4.62 5.80 2.53 2.68 0.28 0.07
11.2
7
14.9
5
Dolo-
mite
Dolo-
Mite
Base-ment 5200 NIL NIL 4.50 6.20 4.68 6.45 2.54 2.75 0.01 0.07 11.4
3 17.0
5 Dolo-mite Gneiss

Journal of Asian Scientific Research, Vol.2, No.4, pp.170-181
180
Table-2 Summary of Dual Water Model Results
Well Name Kolmani River 1
OPL 809
Fluid present Gas (non –associated)
Free water resistivity
( )wR
0.70 mW
Effective porosity ( )ef 22%
Shale volume ( )shV 51%
Total water saturation ( )wtS 49%
Effective water saturation of shaly sand ( )weS 12%
Volumetric fraction of hydrocarbon ( )hf 20%
N/G 51%
Effective water conductivity weC 1.58 mho/m
Conductivity of the hydrocarbon bearing sand tC 0.063mho/m
Hydrocarbon interval 6720-7006.25ft,
7053-7117.5ft
Reservoir thickness 350ft
G (volume in situ) 34BCF8 3(9.63 10 )x m
Anomalous Mass ( )avM Gr= 57.46 10x kg
References
Abubakar, Y. I; Umegu, M. N; Ojo, S. B.
(2010): “Evolution of Gongola Basin Upper
Benue Trough Northeastern Nigeria”. Asian
Journal of Earth Sciences. Vol.3, pp 62-72:
Benkhelil, J. (1989): “The Origin and
Evolution of the cretaceous Benue Trough
(Nigeria)”. Journal of African Earth Science. 8:
pp. 251-282.
Bird, D. E. (2001): “Shear Margins: Continent-
Ocean Transform and Fracture Zone

Petrophysical Characterization of Gongola Basin…..
181
Boundaries.” The Leading Edge. Vol 20. No.2,
pp. 150-159.
Carter, J. D, Barber, W, Tait, A. E, Jones, J.
P. (1963) : “The Geology of part of Adamawa,
Bauchi and Borno Provinces in North Eastern
Nigeria”. Pp 120-135.
Coulon, C; Vida,P; Dupoy,C; Baudin,P;
Pupof, M; Maluski, H and Hermite, D
(1996): “The Mesozoic to Early Cenezoic
Magmatism of the Benue Trough (Nigeria):
Geochemical Evidence for the Involvement of
the St. Hlena Plume”. Journal of Petroleum, 37:
pp. 1341-1358.
Cratchley, C. R and Jones, G. P (1965): “An
Interpretation of the Geology and Gravity
Anomalies of The Benue Valley Of Nigeria.”
Overseas Geological Survey, London. Journal
of Geophysics, 1: pp. 1-26.
Dewan, J. T (1995): “Essentials of Model
Open-Hole Log interpretation”. Pennwell
Publishing Company. Tulsa, Oklahoma. pp
230-260
Epuh, E. E, Nwilo, P. C, Olorode, D. O,
Ezeigbo, C. U (2011): “Basement Depth
Estimation of Gongola Basin Using Second
Vertical Derivative as input anomaly Profile”.
European Journal of Scientific Research: Vol
61, No 1, pp 172-183.
Epuh, E. E, Nwilo, P. C, Olorode, D. O,
Ezeigbo, C. U (2011): “The integration of
Gravity and Seismic Reflection Data in the
Determination of Gongola Basin Structural and
Stratigraphic Geometry for Hydrocarbon
Exploration”. European Journal of Scientific
Research: Vol. 65. No2, pp. 207-220.
Fairhead, J. D and Binks, R. M (1991):
“Differential Opening of the Central and South
Atlantic Oceans and the Opening of the West
Africa Rift System”. Tectonophysics, 187: pp
191-203.
King, L. C (1950): “Outline and Disruption of
Gondwanaland”. Geol. Mag. 87, pp 353-359.
Rider, M. H. (2006). “The Geological
Interpretation of Well Logs”. .Rider-French
Consulting Ltd, Sutherland, Scotland. pp 23-30.
“Schlumberger Log Interpretation
Principles/Applications”. (1989):
Schlumberger Educational Series. pp 10-17 .
Shemang, E. M; Ajayi, C.O; Jacoby, W. R
(2001): “A Magnetic Failed Rift Beneath the
Gongola Arm of the Upper Benue Trough,
Nigeria”. Journal of Geodynamics, 32: pp 355-
371.
Whiteman, A (1982): “Nigeria: It’s Petroleum
Geology Resources and Potential”. Graham &
Trorman, Londres, pp 305-320.
Wright, J. B (1976): “Fracture Systems in
Nigeria and Initiation of Fracture Zones in
South Atlantic. Technophysics”, 34, pp 42-47.