online publication date: 15 march 2012 publisher: asian ... 2(3),pp.336-349.pdf · 337 (imbernon,...
TRANSCRIPT

Online Publication Date: 15 March 2012
Publisher: Asian Economic and Social Society
Land Cover Dynamics (1990-2002) in Binh Thuan Province,
Southern Central Vietnam
HOUNTONDJI Yvon-Carmen (Department of Natural
Resources Management, Faculty of Agronomy, University of
Parakou, BP : 123 Parakou, Benin)
De LONGUEVILLE Florence (Department of Geography,
FUNDP-University of Namur, Rue de Bruxelles 61, 5000 Namur,
Belgium)
OZER Pierre (Department of Environmental Sciences and
Management, University of Liege Avenue de Longwy 185, B-
6700 Arlon, Belgium)
Citation: Hountondji YC, De Longueville F, Ozer P (2012): “ Land Cover Dynamics (1990-2002)
in Binh Thuan Province, Southern Central Vietnam ” International Journal of Asian Social
Science Vol.2, No.3, pp. 336-349.

International Journal of Asian Social Science, 2(3), pp.336-349
336
Author(s)
HOUNTONDJI Yvon-Carmen Department of Natural Resources
Management, Faculty of Agronomy,
University of Parakou, BP : 123 Parakou,
Benin.
E-mail: [email protected]
De LONGUEVILLE Florence Department of Geography, FUNDP-
University of Namur, Rue de Bruxelles 61, 5000 Namur, Belgium
OZER Pierre Department of Environmental Sciences and
Management, University of Liege Avenue de Longwy 185, B-6700 Arlon, Belgium
Land Cover Dynamics (1990-2002) in Binh Thuan
Province, Southern Central Vietnam
Abstract
This paper describes the use of satellite imageries and GIS data
for identifying key environmental characteristics of Binh
Thuan Province in south central Vietnam and for detecting the
major changes patterns within this region. Landsat TM (1990)
and Landsat ETM+ (2002) imageries were used to classify the
study area into seven land use and land cover (LULC) classes.
A post-classification comparison analysis was used to quantify
and illustrate the various LULC conversions that took place
over the 12-year span of time. Results showed that a steady
growth in population has caused extensive changes of land
cover throughout the area. The maps also indicate that the loss
of woody land (forest) and the extension of wetlands (irrigated
area), combined with built-up encroachment, remains one of
the most serious environmental problems facing the Binh
Thuan Province today. The post-classification change detection
analysis showed that critical habitats accounted for nearly
38.5% of the intensive study area between 1990 and 2002
while 61.5% remained stable. Results also showed over the 12-
year span, approximately 1151.2 km² (115.120 ha) forest were
converted respectively to brush, irrigated area (wetlands),
cropland and built-up. This is an overall average decrease of
9594 hectares of forested area per year. Throughout the study
area, districts most affected by forest conversion to another
land cover are: Bac Bihn (2798 ha/year), Than Linh (2717
ha/year), Ham Thuan Nam (1601 ha/year) and Ham Thuan Bac
(1524 ha/year). Based on the identified causes of these
changes, we made policy recommendations for better
management of land use and land cover.
Key words: Remote sensing, Land cover, Change detection, Binh Thuan, Vietnam
Introduction
The research on the land use/cover change
(LULC) is one of the frontiers and the hot spots
in the global change research. The urban
growths, deforestation, extension of croplands
are the main talks in the current scenario of
rapid climate changes. The land cover of a
specific area over a time period can provide us
information on how sustainable the land has
been used. While standard ground survey
methods for undertaking such measurements are
imperfect or expensive it has been demonstrated
that satellite-based and airborne remote sensing
(RS) systems offer a considerable potential.
This capacity for quantitative land-surface
monitoring over large areas makes RS well-
suited for a very wide range of disciplines,
including land-use planning and providing
spatial information needed for local or regional-
scale analyses of the relationships between
climate change, land degradation and
desertification processes (Singh, 1989).
Studying the change detection by remotely
sensed data of different dates remains a
challenge because of factors such as the
complexity of the landscape in a study area.
Change detection is the process of identifying
differences in the state of a feature or
phenomenon by observing it at different times
337
(Imbernon, 1999). This technical issue is useful
in many applications related to land use and
land cover (LULC) changes, such as shifting
cultivation and landscape changes (Serra et al.,
2008), land degradation and desertification
(Adamo and Crews-Meyer, 2006; Gao and Liu,
2010), urban sprawl (Yuan et al., 2005),
deforestation (Schulz et al., 2010; Wyman and
Stein, 2010), landscape and habitat
fragmentation and other cumulative changes
(Nagendra et al., 2006). Continual, historical,
and precise information about the LULC
changes of the Earth‟s surface is extremely
important for any kind of sustainable
development program, in which LULC serves as
one of the major input criteria. Satellite remote
sensing is the most common data source for
detection, quantification, and mapping of LULC
patterns and changes because of its repetitive
data acquisition, digital format suitable for
computer processing, and accurate
georeferencing procedures (Lu et al., 2004;
Chen et al., 2005). The successful use of
satellite remote sensing for LULC change
detection depends upon an adequate
understanding of landscape features, imaging
systems, and methodology employed in relation
to the aim of analysis (Yang and Lo, 2002;
Sivrikaya et al., 2007). Many change detection
techniques have been developed and used for
monitoring changes in LULC from remotely
sensed data, such as post-classification
comparison (PCC), image differencing,
principle components analysis, and vegetation
index differencing (Lu et al., 2004). The PCC
method, which is recognized as the most
accurate change detection technique, detects
land cover changes by comparing independently
produced classifications of images from
different dates. Using the PCC method thus
minimizes the problems associated with multi-
temporal images recorded under different
atmospheric and environmental conditions. Data
acquired from different dates are separately
classified, and hence, reflectance data from
multi-dates do not require adjustment for direct
comparability (Coppin et al., 2004; Zhou et al.,
2008). There are currently numerous satellite
programs in operation. For change detection
studies, the Landsat program is unique because
it provides an historical and continuous record
of imagery. Landsat images can be processed to
represent land cover over large areas and over
long time spans, which is unique and absolutely
indispensable for monitoring, mapping, and
management of LULC (Wulder et al., 2008).
This paper aims to investigate spatial and
temporal land cover changes in Binh Thuan
province in the southern central Vietnam and to
understand the possible causes of the changes.
To do this, we applied land classification
schemes to classify the land cover types using
Landsat data focus on six districts included in
Binh Thuan province. Based on the previously
developed methodology such as maximum-
likelihood classification and change detection
techniques, we assessed the accuracy of the land
classification techniques by comparison with
supervised classification based on numerous
ground truth data. Land cover changes between
1990 and 2002 were quantitatively presented
with the results of accuracy assessments. We
also suggested recommendations regarding
towards better management of LULC.
Data and Methods
Study area
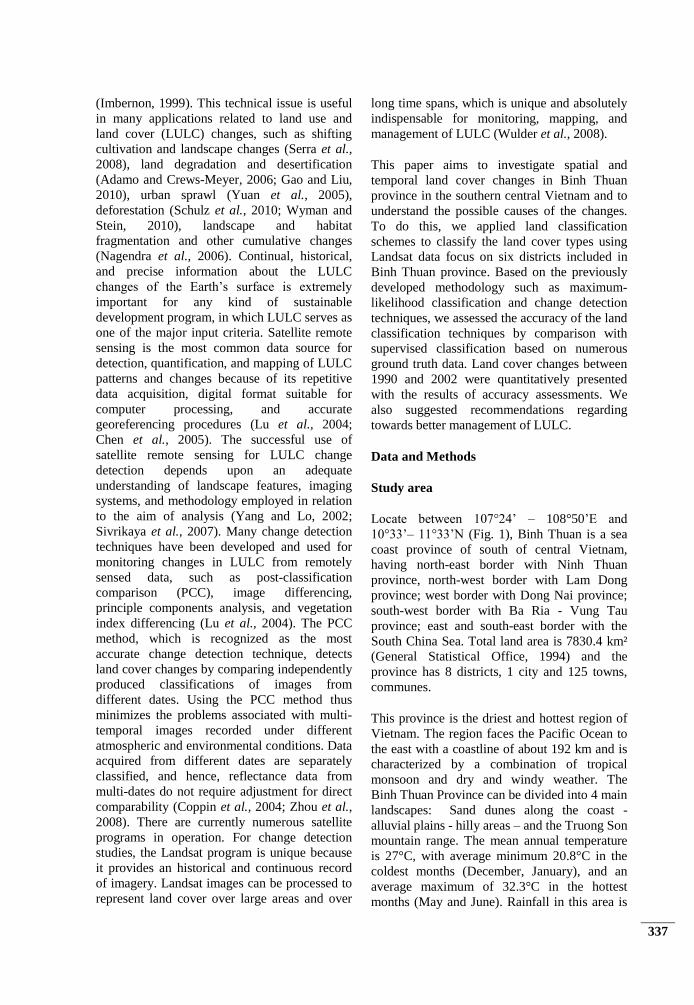
Locate between 107°24‟ – 108°50‟E and
10°33‟– 11°33‟N (Fig. 1), Binh Thuan is a sea
coast province of south of central Vietnam,
having north-east border with Ninh Thuan
province, north-west border with Lam Dong
province; west border with Dong Nai province;
south-west border with Ba Ria - Vung Tau
province; east and south-east border with the
South China Sea. Total land area is 7830.4 km²
(General Statistical Office, 1994) and the
province has 8 districts, 1 city and 125 towns,
communes.
This province is the driest and hottest region of
Vietnam. The region faces the Pacific Ocean to
the east with a coastline of about 192 km and is
characterized by a combination of tropical
monsoon and dry and windy weather. The
Binh Thuan Province can be divided into 4 main
landscapes: Sand dunes along the coast -
alluvial plains - hilly areas – and the Truong Son
mountain range. The mean annual temperature
is 27°C, with average minimum 20.8°C in the
coldest months (December, January), and an
average maximum of 32.3°C in the hottest
months (May and June). Rainfall in this area is

International Journal of Asian Social Science, 2(3), pp.336-349
338
limited and irregular. Annual average
precipitation is 1024 mm, while evaporation in
some years is equivalent to precipitation. At
some locations annual rainfall can be as low as
550 mm. The dry season is from November to
April, with 60 days of January and February
having almost no rain. The rainy season is from
May to October with heavy rains concentrated
in a short periods with up to 200 mm/day. The
total population of the province in 2004 is
around 1.140.429 so urban conditions have
improved in recent years through the extension
of water supply networks and road upgrading.
Fig-1 Location of Binh Thuan province and area covered by Landsat ETM+ image subset
(05.01.2002) False color (RGB: TM3, TM 4, TM 2)
Data acquisition and processing
A pair of cloud-free Landsat images was
selected to classify the study area: December 30,
1990 (Landsat-5 TM) and January 05, 2002
(Landsat-7 ETM+). These time series of
Landsat images are freely available from the
Landsat archive from the United States
Geological Survey (USGS). All visible and
infrared bands (except the thermal infrared
band) were included in the analysis. Only the
intersected area (province boundary and image
subset) has been taken into account for spatial
statistics. Six of the nine districts of Binh Thuan
province were contained within Landsat path
124, rows 52. All images were rectified to UTM
zone 48N, GRS 1984, using at least 35 well
distributed ground control points. The root mean

339
square errors were less than 0.25 pixel (7.125
m) for each of the two images.
We used the Environment for Visual Imaging
software: ENVI version 4.4 (ENVI, 2006)
developed by Research System Incorporated
(RSI) for digital image processing of the subsets
of the chosen Landsat images described above.
Image processing included images calibration to
reflectance, enhancement, rectification, and sub-
setting. The accuracy of the classification was
determined based upon ground truth region of
interest (ROI). Each class included a different
number of ROI‟s, depending upon the albedo
and contrast of class types. Training samples
were selected for each of the predetermined
LULC types by delimiting polygons around
representative sites. Using the pixels enclosed
by these polygons, we derived spectral
signatures for the respective land cover types
recorded by the satellite images. A spectral
signature is considered to be satisfactory when
“confusion among the land covers to be mapped
is minimal” (Gao and Liu, 2010). Once the
spectral signature was deemed satisfactory, we
entered it into the classification process. Ground
truth ROI‟s were divided into two groups. The
first group is for classification procedure and the
second group is for accuracy assessment. Two
LULC maps were produced (for 1990 and
2002). Our classification scheme, with seven
classes (Table 1), was based on the land cover
and land use classification system developed
(Bauer et al., 1996) for interpretation of remote
sensing data at various scales and resolutions.
Table-1 Land cover classification scheme
Land cover class Acronym Description
Built-up BUP Urban or rural build-up - industrial – transportation – cities
– towns -villages
Forest-Plantation FPO Natural forest - reforested land - mixed forest – orchards -
groves
Dunes and sandbank DSB Dune roving - sandbank
Crop land CLD All arable land (not limited to land under crops) – rain-fed
crop fields and bare fields
Highland and Bush HIB High lands or hills with vegetation – wild lands with spare
vegetation – unused land
Water bodies WAT Permanent open water – lakes – reservoirs – streams - bays
and estuaries
Lowland WET Irrigated cropland - paddy field - water ponds - flooded
lands.
A supervised training approach was used with
maximum likelihood classification (Bauer et
al., 1996). Since several researchs have
produce different land classes (Le et al., 2002;
Yaun et al., 1998) than those of our Landsat
classification, data from both sources were
aggregated into seven categories. Class
histograms were checked for normality and
small classes were deleted. Post-classification
refinements were applied to reduce
classification errors caused by the similarities
in spectral responses of certain classes such as
bare fields and urban and some crop fields and
wetlands. An independent sample of an
average of 40 polygons, with up to 100 pixels
for each selected polygon, was randomly
selected from each classification to assess
classification accuracies. Error matrices as
cross-tabulations of the mapped class vs. the
reference class were used to assess
classification accuracy (Foody, 2002). Overall
accuracy, user‟s and producer‟s accuracies, and
the Kappa statistic were then derived from the
error matrices. The Kappa statistic incorporates
the off diagonal elements of the error matrices
(i.e., classification errors) and represents
agreement obtained after removing the
proportion of agreement that could be expected
to occur by chance. Finally, a 3x3 majority
filter was applied to each classification to
recode isolated pixels classified differently than
the majority class of the window.

International Journal of Asian Social Science, 2(3), pp.336-349
340
Change Detection
Following the classification of imagery from
the individual years, a post-classification
comparison change detection algorithm was
used to determine changes in land cover in
1990–2002 intervals. This is the most common
approach to change detection (Jensen, 2004)
and has been successfully used to monitor land
use changes in previous studies (Coppin, et al.,
2004; Kamusoko and Aniya, 2007; Zhou et al.,
2008). Post-classification comparison (PCC)
was employed to detect the differences
between each pair of LULC maps (1990 and
2002). The PCC approach provides „„from–to‟‟
change information and the kind of landscape
transformations that have occurred can be
easily calculated and mapped. A change
detection map with 49 combinations of „„from–
to‟‟ change information was derived for each of
the two seven-class maps and then, a change
map was compiled to display the specific
nature of the changes between the classified
images.
Results
Results presented in the following sections are
restricted to the area of Binh Thuan province
for which the chosen Landsat scenes
intersected with provincial boundaries. This
overlapped area covers 6070 km ²
representing 78.9% of the total area of the
province.
Classification maps accuracies and statistics
Before using the classification results for
change detection, we assessed their validity by
testing the results against ground truth data.
Error matrices were used to assess
classification accuracy and results are
summarized for the two years in Table 2.
The overall accuracies for 1990 and 2002 were,
respectively, 98.05% and 91.41%, with Kappa
statistics of 96.61% and 87.98%. User‟s and
producer‟s accuracies of individual classes
were consistently high, ranging from 99% to
76%. FPO, WAT and HIB classes were all
characterized by the highest classification
accuracy. This is because the integration of the
results of visual interpretation and supervised
classification, which allowed us to correct the
misclassified pixels.
The data presented in Fig. 2 and Table 3
represent respectively the rate and the total area
of each LULC class for 1990 and 2002. In
1990, HIB was the largest class, representing
2407 km² of the total LULC categories
assigned, occupying 39.7% of the study area.
In 2002, this class amount had increased
significantly, resulting chiefly in the reduction
of forest and plantation class (from 30% in
1990 to 20.7% in 2002). With the exception of
the lowland class (WET: 4.9%) and the dune
roving (DSB: 2.3%) in 1990, built-up (BUP)
and free-water bodies classes (WAT)
accounted for the lowest percentages of the
total LULC categories in all studied years.
The major changes during 1990-2002 periods
were found in FPO class (natural forests
including planted forest), WET class (irrigated
land, paddy fields) and HIB class (vegetation
re-growth, shrubs, hill‟s vegetation). The areas
of water bodies and built-up (urban or rural
settlements) also increased significantly. Thus,
from 1990 to 2002, BUP, HIB, WAT and WET
area increased respectively 0.7% (44.3 km²)
Table-2 Summary of Landsat subset classification accuracies (%) for 1990 and 2002
Land cover class Acronym 1990 2002
Producer‟s User‟s Producer‟s User‟s
Built-up BUP 97.59 87.22 80.04 76.66
Forest-Plantation FPO 99.47 77.58 98.48 85.75
Dunes - sandbank DSB 98.13 99.58 88.66 99.63
Crop land CLD 94.82 98.05 95.85 94.39
Highland and Bush HIB 98.80 99.95 91.25 99.96
Water bodies WAT 99.18 99.98 99.96 98.17
Lowland WET 97.89 78.58 95.26 86.51
Overall accuracy (%) 98.05 91.41
Kappa statistic(%) 96.61 87.98

341
Fig-2 Area percentage of each land cover class resulting from the classified images (1990 and
2002)
3.8% (233.6 km²), 1.1% (67.1 km²) and 5.6%
(341.2 km²) while FPO, DSB and CLD
decreased 9.3% (562 km²), 0.5% (31.5 km²) and
1.5% (92.2 km²). Although the extent of
wetlands may change from year to year due to
varying precipitation and temperature, the
variation in wetland area is also likely due to
classification errors. However, the fluctuations
in lowlands classification errors are believed to
be related to varying sol humidity levels given
the high classification (producer‟s accuracy
about to 97.89% in 1990). The spatial
distribution of the assigned categories for each
year is shown in Fig. 3
Table-3 Area of each land cover class resulting from the classified images
Land cover class Acronym
1990 2002
Area
(km²)
Rate
(%)
Area
(km²)
Rate
(%)
Built-up BUP 60.8 1.0 105.1 1.7
Forest-Plantation FPO 1818.1 30.0 1255.4 20.7
Dunes - sandbank DSB 141.9 2.3 110.4 1.8
Crop land CLD 1332.2 21.9 1240.0 20.4
Highland and Bush HIB 2407.0 39.7 2640.6 43.5
Water bodies WAT 13.4 0.2 80.5 1.3
Lowland WET 296.6 4.9 637.8 10.5
Total (km²) 6070 100 6076 100

International Journal of Asian Social Science, 2(3), pp.336-349
342
Fig-3 Land use and land cover maps (1990 and 2002) resulting from the integration of supervised
classification and visual interpretation
Analysis of change patterns
By constructing a change detection map, the
advantages of satellite remote sensing in
spatially disaggregating the change statistics
can be more fully appreciated. Our results
revealed that over the 12-year span, 3735.5 km²
(61.5% of the studied area) were unchanged
while changes occurred elsewhere (38.5%)
(Table 4).
These unchanged areas (not shown) were
mainly composed by HIB (34%), CLD (12.7%)
FPO (11%) and WET class (2.2%). In order to
examine more specifically areas where changes
affected more than 5 km², a table showing
combinations of „„from–to‟‟ change has been
gathered (Table 5). The selected results
represented 99% of the major changes that
occurred during the study period and the spatial
distribution of the resulting conversion classes
is shown in Fig. 4. Overall, 82.8 km² of built-up
was converted from forests and agricultural
land (rainfed: CLD and irrigated: WET), while
in the same time, 39 km² of urban or rural
settlement land was converted to forest and
cropland. These changes may seem to be
classification errors, but forested areas are
among some of the most sought after areas for
developing new settlements. Streets, roads and
rural tracks were generally classified as urban,
but when urban tree canopies along the streets
grow and expand, the associated pixels may be
classified as forest. Also, the results of image
interpretation and classification together with
an access to archives on agricultural policies
indicated that an intensive development
programs have been implemented in the study

343
area during the last two decades (World Bank, 1996).
In 21.1% of the cases the change was „„Forest
(FPO) to wild-land with spare vegetation
(HIB)” and approximately 14% was “forest to
irrigated agriculture‟‟ change. Table 5 also
reveals that residential uses comprise over half
the cases that changed to urban. Relatively rare
and unlikely types of conversions, such as
agriculture to forest, and then to urban uses and
forest to agriculture, and then to urban, totaling
5%, are assumed to largely be classification
errors. The spatial interpretation of these results
indicates that urban (BUP) increases mainly
came from conversion of FPO, CLD and WET
classes (representing 80.2% of the change rate).
Table -4 Area and percentage of change in each LULC class and annual rate of change between the
different dates
LULC class
Districts included Total
change
(km²)
Rate
(1990-
2002) Bac
Binh
Duc
Linh
Ham
Thuan
Bac
Ham
Thuan
Nam
Phan
Thiet
Tanh
Linh
BUP 17.7 29.1 13.5 6.3 6.2 17.0 89.9 1.5
FPO 149.2 78.1 162.8 77.3 37.6 83.6 588.6 9.7
DSB 14.2 0.1 9.4 0.5 10.5 0.3 35.1 0.6
CLD 187.7 36.6 92.7 68.9 18.4 65.4 469.6 7.7
HIB 108.8 54.6 64.0 94.8 1.2 252.5 575.9 9.5
WAT 10.9 7.9 27.0 2.2 3.6 18.0 69.6 1.1
WET 204.2 16.2 130.3 118.5 3.4 33.1 505.7 8.3
Changed area
(km²) 692.7 222.8 499.7 368.5 80.8 469.9 2334.4 38.5
Unchanged area
(km²) 1169,0 323,3 845,2 536,1 130,9 731,0 3735,5 61,5
District area (km²) 1861.7 546.1 1344.9 904.6 211.7 1200.9
100
Fig-4 Change detection map for the studied area (spatial extends of converted classes are
highlighted).

International Journal of Asian Social Science, 2(3), pp.336-349
344
These programs included land reclamation and
the expansion of irrigated culture areas, as well
as the establishment of rural village
communities into foothills of mountains
previously considered as wild-lands or unused
lands. Further GIS analysis revealed a strong
relationship between new development and
proximity to roads. Almost half (49%) of the
Built-up development detected in our
classifications occurred within 2 km of main
roads and rural tracks, and 35% was between 2
and 4 km. Duc Linh, Tanh Linh, Bac Binh and
Ham Thuan Bac are the districts where this
urban sprawl is the most remarkable during the
studied (1990–2002). All of these (bio) physical
changes within the setting of the region‟s
ecosystems reflect the dynamics of human
impacts on the study area.
Cropland (CLD) area declined from 1332.2 km²
in 1990 to 1240 km² in 2002. This class was
mainly changed into planted vegetation (FPO),
irrigated land (WET), Brush (HIB) and Built-up
(BUP) accounting for almost 22% of the total
occurred changes. Ham Thuan Bac, Bac Binh
and Duc Linh are the districts mainly
affected by this kind of conversion.
The area of water bodies plays an important
role in development of aquaculture for the
study area. During the studied period, water
body increased by about 6.5 times of the
original area. Water occupied 13.2 km² (0.2%
of total studied area) in 1990 and finally
reached 80.5 km² (1.3%) in 2002. This was
converted mainly from natural forest,
plantations (FPO), cropland (CLD), bush
(HIB), lowland and paddy fields (WET).
The most plausible explanation of this
conversion into water bodies was mainly due to
hydroelectric dam constructions (Bac Binh,
Ham Thuan Bac Tanh Linh districts) and also
probably to expansion of small reservoirs for
irrigation.
Lowland with irrigated agriculture fields
(WET) also showed increasing trends in size
from 1990 to 2002. The area of paddy fields
was only 296 km² (4.9% of total area) in 1990,
increased to 637 km² (10.5%) in 2002. This
class extends on the foothill of the mountain
chains and chiefly into hilly valleys following
geographical orientation of the alluvial basins.
This was converted mainly from natural forests
(FPO), cropland (CLD) and HIB class
vegetation and some from water bodies and
mixed orchard.
Even though many hectares of natural forests
were converted into planted vegetation and
other agricultural land from 1990 to 2002, there
was also conversion from barren lands to
cropland and forests. This change occurred on
dune and sandbak (DSB) class where decrease
occurred from 141.9 km² to 110.4 km². These
areas are used primarily for horticultural
activity, with only very small areas of rain-fed
rice grown in low-lying areas. Another
explanation of this reverse trend is that there
was a wide application of vetiver grass
(Vetiveria zizanioides) planting that has real
impact on land stabilization / reclamation.
Although the concept of using vetiver for
various applications has only been introduced
into Vietnam in 1999 (Le Van and Truong,
2003) vetiver has become widely known
throughout the country with numerous
successful applications for natural disaster
mitigation and environmental protection.
Typical examples include road batter stability
enhancement, erosion / flood control of
embankments, dykes, riverbanks, sand dune
fixation. However, we can unfortunately notice
a persistence of sandbank and dune roving,
resulting probably of land degradation in Bac
Binh (9.7 km²), Ham Thuan Bac (8.4 km²)
districts and Phan Thiet (10.3 km²).
Discussion
Within a few years, Vietnam was not only
producing enough food for domestic
consumption but became one of the world‟s
leading rice exporters (World Bank, 1996).
Unfortunately, in some regions, farmers
profited much less from the reforms than
others. There is wide disparity in regional
development trends following land reforms
partly because the reforms were not
implemented homogeneously throughout the
country and also because of the tremendous
diversity of natural and human environments
they were applied to.

345
Table-5 Area and percentage of change in each LULC class and annual rate of change between
1990 and 2002
Change class Districts and city affected by changes Total
area
(km²)
Change rate
(%) From To Bac
Binh
Duc
Linh
Ham
Thuan
Bac
Ham
Thuan
Nam
Phan
Thiet
Tanh
Linh
FPO
HIB 91.3 46.6 40.6 76.4 0.5 237.5 492.8 21.1
49.1
WET 136.2 8.1 75.6 82.7 2.0 20.1 324.6 13.9
CLD 98.3 34.8 57.7 30.3 2.4 58.4 282.0 12.1
BUP 4.5 15.6 3.6 2.0 1.5 6.1 33.4 1.4
WAT 2.3 2.7 4.6 0.8 0.2 3.9 14.4 0.6
CLD
FPO 57.6 55.9 89.7 36.4 30.5 35.1 305.2 13.1
24.1
WET 36.3 7.5 36.1 29.7 1.3 9.6 120.5 5.2
HIB 9.7 7.1 16.1 5.0 0.6 8.3 46.8 2.0
BUP 9.2 12.6 7.2 2.6 2.7 9.4 43.7 1.9
DSB 9.7 0 8.4 0.3 10.3 0.0 28.7 1.2
WAT 2.3 3.0 3.7 0.5 1.2 6.2 17.0 0.7
HIB
FPO 70.2 11.7 55.3 27.1 2.0 44.0 210.3 9.0
14.4 WET 30.9 0.1 18.0 5.4 0 3.2 57.7 2.5
CLD 25.0 0.3 5.9 1.3 1.1 4.1 37.7 1.6
WAT 3.4 1.4 16.7 0.3 1.5 6.7 30.0 1.3
WET
CLD 30.4 0.6 19.2 33.7 0.9 1.3 86.1 3.7
7.0
FPO 8.9 2.8 8.5 10.2 0.2 2.8 33.5 1.4
HIB 6.9 0.4 6.5 13.2 0.1 6.2 33.3 1.4
BUP 2.5 0.5 0.9 1.4 0.1 0.4 5.8 0.2
WAT 1.9 0.7 1.6 0.6 0.2 0.4 5.5 0.2
DSB CLD 29.7 0.2 5.8 1.7 13.2 0.2 50.7 2.2
2.7 FPO 4.7 0.8 2.4 0.5 3.6 0.4 12.4 0.5
BUP FPO 7.8 6.4 6.7 3.2 1.2 1.1 26.4 1.1
1.7 CLD 4.2 0.7 3.5 2.0 0.8 1.3 12.5 0.5
Total (km²) 683.9 220.5 494.5 367.0 78.1 466.8 2310.9 99.0 99.0
This resulted in different ways of interpreting
local success or failure of the land policy to lift
marginal farmers out of poverty or reverse land
degradation trends (Ducourtieux and Castella,
2006).Land use in the study area has undergone
dramatic change and was impacted by human
resource development. Our findings from the
satellite-image interpretation suggest a decrease
in closed canopy forest due to conversion into
rain-fed and irrigated agricultural land. Open
canopy forest cover (including bush and
fallows) increased during the 1990s
approximately by 4%, mainly due to the natural
regeneration of mixed grassland. Followed
fields formerly used for shifting cultivation may
be largely abandoned during the last decade and
regenerated to become open canopy secondary
forest. Overall, rain-fed mixed agriculture
decreased slightly in the 1990s, as the reduction
in shifting cultivation was compensated by an
expansion of irrigate cropping area. Water
bodies also showed increasing areas from 1990
to 2002, but the overall change was not large
for these types. Increases in irrigated fields and
water bodies represent the possibility of
increasing aquaculture or increasing the
suitability of the study area for future
aquaculture. It has been demonstrated that in
terms of economic returns, aquaculture often
gives higher returns than rice culture (Salam et
al., 2003). However, the decision to convert
paddy fields to fish ponds is often related to
food security and social aspects. In order to
maintain a balance between social and
economic aspects, integrated rice-fish culture
systems should be promoted (Gregory and

International Journal of Asian Social Science, 2(3), pp.336-349
346
Guttman, 2002). Outreach and extension
services to local farmers should be enhanced,
and extension information should be produced.
Over time, agricultural production became
more locally concentrated. These changes in
land use suggested that shifting cultivation as
the traditional farming system practiced by the
population in the research area almost entirely
disappeared in its traditional form during the
last decade. On the other hand, provincial and
district authorities generally lack of manpower,
resources, capacity and experience to put into
practice consistent and participative land-use
policy. They should be allocated more
resources and more time to implement a policy
that would satisfy the different objectives
expressed at different hierarchical levels.
Experience has shown that promoting the links
between land allocation and subsequent
extension activities is indispensable for close
interaction with farmers and when directing
research to development activities that are
relevant and acceptable to local people. In a
broader context, some studies are summarizing
the general factors that promote a successful
transition towards sustainable management of
natural resources (Raquez and Lambin, 2007).
Three broad groups of factors that have been
identified: information regarding the state of the
resources and their degradation, motivations to
search for solutions, and capacity to implement
effective solutions. Environmental degradation
of places with which people maintain an
emotional connection can lead these people to
adopt a more ecological worldview and to
reassess their involvement in conservation
activities (Marshall et al., 2005; Rogan et al.,
2005). The perception of the capacity to predict
and improve the state of the environment also
mediates behavior (Ostrom, 1999).
Overall, natural forests declined in area, while
the most dramatic increase was for irrigated
fields. During the 12-years span, we can
observe a pathway of land expansion into
previously uncultivated areas. At the same time,
due to market development, agricultural
intensification is concentrated in the most
suitable regions. Large areas of land marginally
suitable for agriculture are therefore abandoned
and left to forest regeneration. In this forest
scarcity path, political and economic changes
will arise as a response to the growing scarcity
of forest products and decrease in the provision
of ecosystem services following. We think it is
possible that intensification of agriculture
combined with the (enforced) protection of
forested areas can reduce the pressure on
forested land, and slow down or even halt the
expansion of agricultural land if coupled with
the right policy instruments.
Concerning the undesirable changes in land use
and the need for more sustainable development
in the region, we propose that the government
should reconsider the policies applied to the
region of the study area, as well as the policies
of the surrounding regions that may directly or
indirectly affect the development of the study
area. For instance, the modeling power of GIS
to evaluate land suitability for development of
agricultural activities chiefly in the basins and
watershed ponds must be developed. It is
known that sustainable agricultural systems are
based on managing soils according to their
capabilities and environmental constraints.
According to this, GIS information could allow
the landholder to move from regional or district
land suitability recommendations and land
management practices to soil-specific
management, thus improving productivity,
profitability and sustainability. An economic
component should be incorporated into GIS
applications to determine economic suitability
in addition to physical suitability. This would
reduce the cost of the rehabilitation of degraded
and barren areas and, consequently, facilitate
the adoption of more ecological worldview and
less vulnerable of land conservation activities.
In addition, to lessen the degree of degradation,
the free water areas should be reduced, or at
least consolidated. This could be achieved
through the improvement of the drainage
network system in the waterlogged areas and by
preventing drainage water from overflowing
into lowlands. These actions could protect
cropland areas from soil salinization and,
consequently, increase agricultural production,
especially in order to adapt to future impacts of
climate change (Doutreloup et al., 2011).
Conclusion
The results demonstrate that Landsat image
classifications can be used to produce accurate
landscape change maps and statistics. General

347
patterns and trends of land use change in Binh
Thuan Province were evaluated by:
classifying the amount of land in six
districts area that was converted from
forest, agricultural, and wetland use to
urban use during three periods from
1990 to 2002;
comparing the results of Landsat-
derived statistics;
quantitatively assessing the accuracy
of change detection maps; and
analyzing the major land use change
patterns.
In addition to the generation of information tied
to geographic coordinates (i.e., maps), statistics
quantifying the magnitude of change, and
„„from–to‟‟ information can be readily derived
from the classifications. The results quantify
the land cover change patterns in Binh Thuan
Province and demonstrate the potential of
multitemporal Landsat data to provide an
accurate, economical means to map and analyze
changes in land cover over time that can be
used as inputs to land management and policy
decisions. While it is a site specific comparison,
it is also useful to compare the Landsat
classification estimates to another, independent
inventory such as the Natural Resources
Inventory. Perfect agreement would not be
expected due to the differences in the dates of
data collection, as well as differences in classes
between the two surveys.
Acknowledgement
The research is funded by BELSPO (Belgian
Science Policy Office) and executed in the
framework of a research project entitled
“Impact of Global Climate Change and
Desertification on the Environment and Society
in Southern Central Vietnam-Case Study in
Binh Thuan Province”.
REFERENCES
ADAMO S.B. & CREWS-MEYER K.A. (2006)
“ARIDITY AND DESERTIFICATION: EXPLORING
ENVIRONMENTAL HAZARDS IN JÁCHAL,
ARGENTINA”. APPLIED GEOGRAPHY VOL. 26,
NO.1, PP.61-85.
ANDERSON J.R., HARDY E.E., ROACH, J.T. &
WITMER, R.E. (1976) “A LAND USE AND LAND
COVER CLASSIFICATION SYSTEM FOR USE WITH
REMOTE SENSOR DATA”. U.S. GEOLOGICAL
SURVEY PROFESSIONAL PAPER, NO. 964.
USGS, WASHINGTON, D.C. 27P.
Bauer M.E, Sersland C.A., & Steinberg S.J.
(1996) “Land-cover classification of the Twin
Cities metropolitan area with Landsat TM
data”. Proceedings, Pecora 13 symposium.
August 20–22, Sioux Falls, South Dakota :
138– 145.
Chen X., Vierling L. and Deering D. (2005) “A simple and effective radiometric correction
method to improve landscape change detection
across sensors and across time”. Remote
Sensing of Environment Vol.98, No.1, pp. 63-
79.
Coppin, P., Jonckheere, I., Nackaerts, K.,
Muys, B. & Lambin, E. (2004) “Digital
change detection methods in ecosystem
monitoring: a review”. International Journal of
Remote Sensing, Vol.25, pp.1565–1596.
Doutreloup S., Erpicum M., Fettweis X., &
Ozer P. (2011) “Analysis of the past (1970-
1999) and future (2046-2065 and 2081-2100)
evolutions of precipitation and temperature, in
the Province of Binh Thuan, South East
Vietnam, based on IPCC models", paper
presented at the 1st International Conference on
Energy, Environment and Climate Changes, Ho
Chi Minh City, Vietnam, 27th and 28th August
2011.
Ducourtieux O. & Castella J.-C. (2006)
“Land reforms and impact on land use in the
uplands of Vietnam and Laos: Environmental
protection or poverty alleviation?” Colloque
international “Les frontières de la question
foncière – At the frontier of land issues”, 17-19
mai 2006, Montpellier, France. 22p.
ENVI (2006) “ENVI 4.4 Help”. ITT Industries
Inc., Boulder, CO, USA.
Foody G. M. (2002) “Status of land cover
classification accuracy assessment.” Remote
Sensing of Environment, Vol.80, No.1, pp.185-
201.

International Journal of Asian Social Science, 2(3), pp.336-349
348
Gao J. & Liu Y. (2010) “Determination of land
degradation causes in Tongyu County,
Northeast China via land cover change
detection”. International Journal of Applied
Earth Observation and Geoinformation, Vol.12,
No.1, pp.9-16.
General Statistical Office (1994) “Vietnam
Catalogue of the Administrative Divisions”,
Socialist Republic of Vietnam, Statistical
Publishing House, Hanoi.
Gregory G. & Guttman H. (2002) “Developing appropriate interventions for rice-
fish cultures”. In: P. Edwards, D.C. Little, and
H. Demaine (Editors), Rural Aquaculture.
CABI Publishing, Wallingford, United
Kingdom. pp.15–28.
Imbernon J. (1999) “Changes in agricultural
practice and landscape over a 60-year period in
North Lampung, Sumatra”. Agriculture,
Ecosystems and Environment. 76: 61-66.
Jensen J.R. (2004) “Introductory digital image
processing”, 3rd Eds. Publisher: Prentice
Hall, 544p.
Kamusoko C. & Aniya M. (2007) “Land
use/cover change and landscape fragmentation
analysis in the Bindura district, Zimbabwe”.
Land Degradation & Development Vol.18, pp.
221–223.
Marshall B.K., Picou J.S & Bevc C.A. (2005) “Ecological disaster as contextual
transformation: Environmental values in a
Renewable Resource Community”.
Environment and Behavior, Vol.37, No.5,
pp.706-728
Le K.T., Nguyen T.H., Nguyen D.D., Konda
A., Kajiwara K. & Honda Y. (2002) “Automated Classification for Vegetation of
Ninh Thuan, Binh Thuan and Lam Dong
Provinces in Vietnam by Simulated GLI Data
from Landsat TM”. Journal of the Japan
Society of Photogrammetry and Remote
Sensing, Vol.41, No.6, pp. 4-13.
Le Van D. & Truong, P. (2003). “Vetiver
System for Erosion Control on Drainage and
Irrigation Channels on Severe Acid Sulfate Soil
in Southern Vietnam”. Proceedings 3rd
International Conference on Vetiver grass
(ICV3), Quangzhou, China, Oct., 2003.
Lu D., Mausel P., Brondizio E. & Moran, E.
(2004) “Change detection techniques”.
International Journal of Remote Sensing,
Vol.25, No.12, pp.2365-2407.
Nagendra H., Pareeth S. & Ghate R.
(2006) “People within parks: forest villages and
fragmentation in the Tadoba Andhari Tiger
Reserve, India”. Appl. Geog. Vol.26, pp.96–
112.
Ostrom, E. (1999) “Self-governance and forest
resources”. CIFOR Occasional Paper No. 20.
Center for International Forestry Research,
Bogor, Indonesia.
Raquez P. & Lambin E.F. (2007)
“Conditions for a sustainable land use: case
study evidence”. Journal of Land Use Science,
Vol.1, No.2-4, pp.109–125.
Rogan R., O’Connor M. & Horwitz P. (2005) “Nowhere to hide: Awareness and perceptions
of environmental change, and their influences
on relationships with place”. Journal of
Environmental Psychology, Vol.25, pp.147-
158.
Salam M.A., Ross L.G., & Beveridge C.M.M.
(2003) “A comparison of development
opportunities for crab and shrimp aquaculture
in southern Bangladesh, using GIS modeling”.
Aquaculture Vol.220, pp.477–494.
Schulz J.J., Cayuela L., Echeverria C., Salas
J. & Rey Benayas J.M. (2010) “Monitoring
land cover change of the dryland forest
landscape of Central Chile (1975-
2008)”. Applied Geography Vol.30, No.3,
pp.436-447.
Serra P., Pons X. & Sauri D. (2008) “Land-
cover and land-use change in a Mediterranean
landscape: a spatial analysis of driving forces
integrating biophysical and human factors”.
Applied Geography, Vol.28, No.3, pp.189-209.
Singh A. (1989) “Digital change detection
techniques using remotely sensed data”.
International Journal of Remote Sensing
Vol.10, pp.989–1003.
Sivrikaya F., Cakir G., Kadiogullari A.I.,
Kele S., Baskent E.Z. & Terzioglu S. (2007) “Evaluating land use/land cover changes and
fragmentation in the Camili Forest Planning
Unit of northeastern Turkey from 1972 to
2005”. Land Degradation and Development 18:
383–396.
Wulder M.A., White J.C., Goward S.N.,
Masek J.G., Irons J.R. & Herold M. (2008) “Landsat continuity: Issues and opportunities
for land cover monitoring”. Remote Sensing of
Environment Vol.112, No.3, pp. 955-969.
Wyman M.S. & Stein T.V. (2010).
“Modeling social and land-use/land-cover

349
change data to assess drivers of smallholder
deforestation in Belize”. Applied Geography,
Vol.30, No.3, pp.329-342.
Yang X. & Lo C. (2002) “Using a time series
of satellite imagery to detect land use and land
cover changes in the Atlanta, Georgia
metropolitan area”. International Journal of
Remote Sensing Vol.23, No.9, pp.775-1798.
Yuan D., Elvidge C.D. & Lunetta, R.S.
(1998) “Survey of multispectral methods for
land cover change analysis”. In Remote
Sensing Change Detection: Environmental
Monitoring Methods and Applications, Edited
by R. S. Lunetta; C. D. Elvidge, Ed.; Ann
Arbor Press: Chelsea, MI: 22-23.
Yuan F., Sawaya K.E., Loeffelholz B. &
Bauer M.E. (2005) “Land cover classification
and change analysis of the Twin Cities
(Minnesota) metropolitan area by
multitemporal Landsat remote
sensing”. Remote Sensing of
Environment Vol.98, No.2, pp.317-328.
World Bank (1996) “Vietnam Water
Resources Sector Review”. Main Report, Water
Resources Group, Institute of Water Resources
Planning, World Bank, Washington D.C
Zhou W., Troy A. & Grove M. (2008).
“Object-based land-cover classification and
change analysis in the Baltimore metropolitan
area using multitemporal high resolution
remote sensing data”. Sensors, Vol.8, pp. 1613–
1636.