one ultra, delivering
TRANSCRIPT

ONE Ultra, delivering
2020 Preliminary Results
9 March 2021
Innovating today for a safer tomorrow

Strong growth Good strategic progress
Robust performance
Unlocking underlying strengths...
Transformation working
Exciting Potential
...delivering excellent outcomes
Key programme wins Record order book Excellent execution Delivering for all stakeholders
2
Well positioned

Good strategic progress…
3
ER-DIFAR design & manufacture contract
Ultra’s first development Sonobuoy award outside the
ERAPSCO JV. $24m award with significant production
value potential
US Navy Amphibious Tactical
Communications System
‘NIXIE’ torpedo countermeasure system
Electro-acoustic towed torpedo countermeasure system. Potential value of
$270m over 5 years
Development and production of ORION radios
for US Navy. Potential value of $145m
...key programme wins
Canadian Surface Combatant
First awards on CSC for variable depth & hull
mounted sonar awards. Potential value up to $500m

Strong growth…
4
$163m under ERAPSCO’s 5-year IDIQ
(+ an additional $80m order in March 2021)
Sonobuoy awards
MK 54 lightweight torpedo arrays
$45m award, two more option years
ORION radios
$64m of orders under US Army TRILOS IDIQ
Production contract award for NGSSR
$42m development & low-rate initial
production
...record order book
Air DefenseSystems Integrator
(ADSI)
ADSI system, license fees & support sales

Robust performance

2020 2019 Growth
Profit before tax(2) 114.5 105.3 +8.7%
Earnings per share (p) (2) 130.6 119.5 +9.3%
Cash conversion 92% 73%
ROIC(3) 20.0% 17.8%
Excellent execution
... good margin & ROIC development
£’m 2020 2019* Organic Growth(3)
Order book 1,064.2 1,005.3 +5.9%
Revenue 859.8 817.4 +5.2%
Operating profit(1) 126.1 118.7 +6.2%
Operating margin(1) 14.7% 14.5%
* Comparative period presented at constant currency translation and adjusted for disposals to reflect the comparable period of ownership. 1,2,3 see Appendix 1.
Increased investment into R&D and transformation
Travel and marketing costs lower than expected due to
Covid-19
Very good cash conversion
6

Third consecutive year of organic revenue growth
…despite Covid-19
2019 Revenue
£825.4m
(as stated)
CurrencyTranslation Maritime
+12.3%(organic)
I&C+8.6%
(organic)
CD&C-7.9%
(organic)
2019 Revenue
(for organic measure)
£817.4m
+£42.9m
+£19.0m
2020Revenue
£859.8m
-£4.1m
-£19.5m
Organic growth +5.2%
Disposals
-£3.9m
Outperforming our markets
7
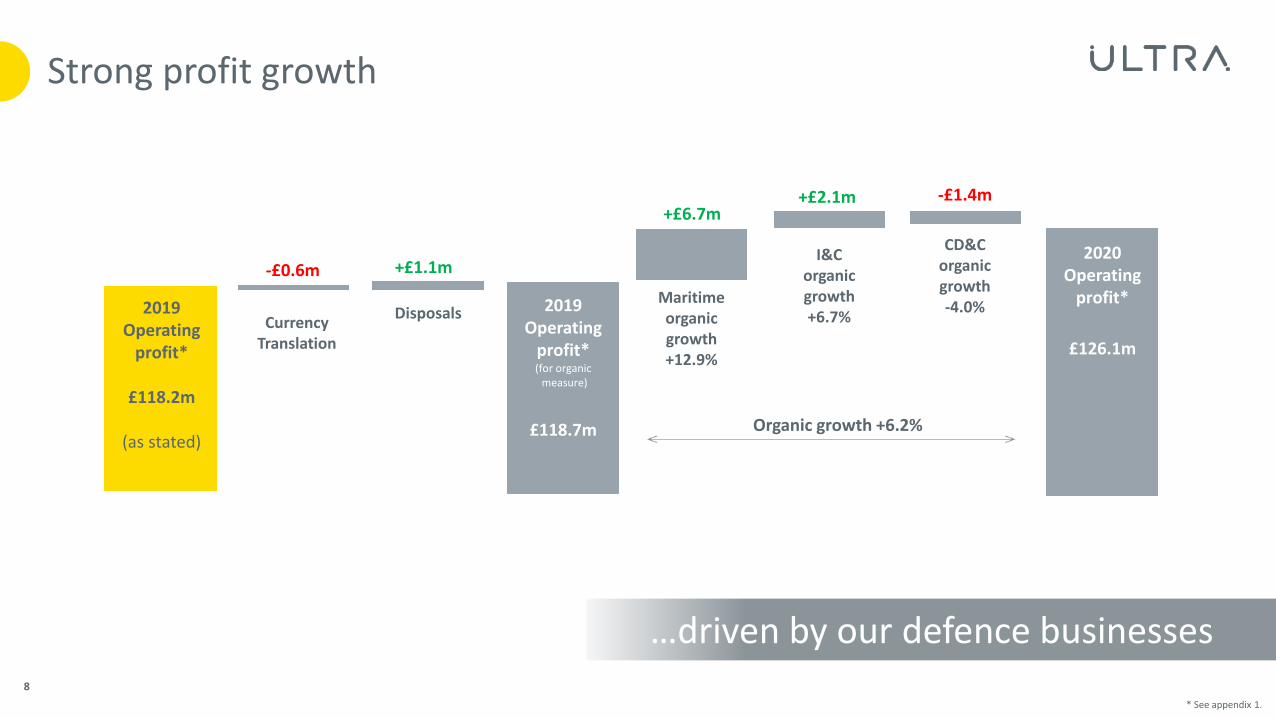
Strong profit growth
…driven by our defence businesses
+£2.1m
2019 Operating
profit*
£118.2m
(as stated)
DisposalsMaritime organic growth+12.9%
I&Corganic growth+6.7%
CD&Corganic growth-4.0%2019
Operating profit*(for organic
measure)
£118.7m
+£1.1m2020
Operating profit*
£126.1m
+£6.7m
Organic growth +6.2%
CurrencyTranslation
-£0.6m
-£1.4m
* See appendix 1.
8

Maritime
…excellent growth on existing and new platforms
£’m 2020 2019* Organic
Growth(2)
Order book 539.6 472.4 +14.2%
Revenue 391.8 348.9 +12.3%
Operating profit(1) 58.6 51.9 +12.9%
Operating margin(1) 15.0% 14.9%
Excellent order book, driven by hull mounted sonar arrays, NGSSR, torpedo
defence systems and sonobuoys
Increased investment in R&D and transformation
9 * Comparative period presented at constant currency translation and adjusted for disposals to reflect the comparable period of ownership. 1,2 see Appendix 1.

Intelligence & Communications
...well positioned in a growing market
£’m 2020 2019* Organic
Growth(2)
Order book 237.1 216.7 +9.4%
Revenue 241.0 222.0 +8.6%
Operating profit(1) 33.5 31.4 +6.7%
Operating margin(1) 13.9% 14.1%
10
Strong demand for Command, Control & Intelligence (C2I) and radio
products
Better productivity and increasing investment
* Comparative period presented at constant currency translation and adjusted for disposals to reflect the comparable period of ownership. 1,2 see Appendix 1.

Critical Detection & Control(PCS, Forensic Technology & Energy)
...responded to the pandemic with agility
£’m 2020 2019*Organic
Growth(2)
Order book 287.5 316.2 -9.1%
Revenue 227.0 246.5 -7.9%
Operating profit(1) 34.0 35.4 -4.0%
Operating margin(1) 15.0% 14.4%
11
Forensics demonstrating its growth potential
Significant impact of Covid-19
Improved operating margins
* Comparative period presented at constant currency translation and adjusted for disposals to reflect the comparable period of ownership. 1,2 see Appendix 1.

£’m 2020 2019
Underlying profit before tax(3) 114.5 105.3
Gain on derivatives mark to market 3.4 10.6
Amortisation of acquired intangibles (12.6) (21.7)
Acquisition and disposal related costs (1.1) (0.9)
Gain/(loss) on disposal 2.8 (0.9)
Significant legal charges and expenses (3.3) (1.4)
Statutory profit before tax 103.7 91.0
…helped by lower amortisation
Statutory PBT increased by 14.0%
3 see Appendix 1.
Reduction in amortisation due to historical acquired assets becoming
fully amortised
12

Operating cash flow
£’m 2020 2019
Underlying operating profit(1) 126.1 118.2
Depreciation and amortisation 24.9 26.0
EBITDA 151.0 144.2
Lease payments (IFRS 16) (9.0) (7.8)
Working capital and provisions 4.4 (16.7)
Capital expenditure* (22.1) (22.8)
Pension contributions (11.0) (10.8)
Other flows 2.8 0.7
Underlying operating cash flow(5) 116.1 86.8
Operating cash conversion(6) 92% 73%
13
... excellent cash conversion
Working capital turns increasing from 7.3x to 10.1x
1,5,6 see Appendix 1*Includes capitalised internal R&D
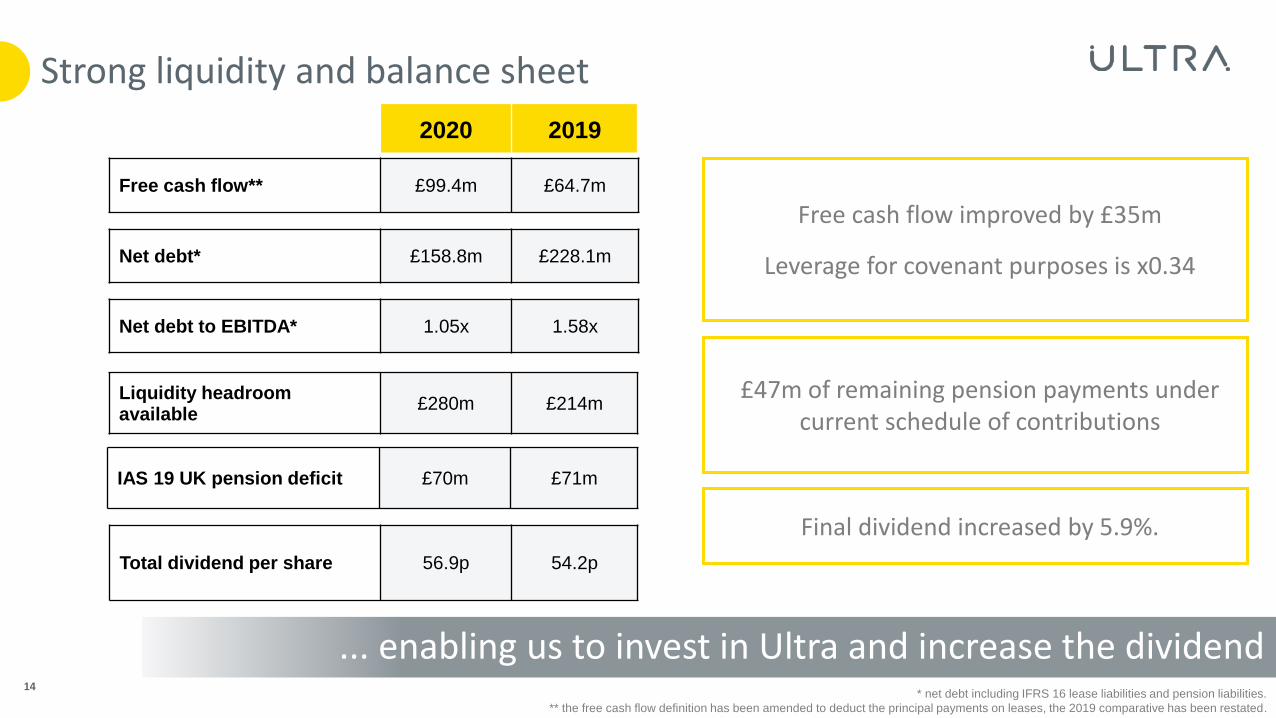
Strong liquidity and balance sheet
... enabling us to invest in Ultra and increase the dividend
Net debt to EBITDA* 1.05x 1.58x
2020 2019
* net debt including IFRS 16 lease liabilities and pension liabilities.
** the free cash flow definition has been amended to deduct the principal payments on leases, the 2019 comparative has been restated.
14
Liquidity headroom available
£280m £214m
Free cash flow** £99.4m £64.7m
Net debt* £158.8m £228.1m
Free cash flow improved by £35m
Leverage for covenant purposes is x0.34
Final dividend increased by 5.9%.
Total dividend per share 56.9p 54.2p
£47m of remaining pension payments under current schedule of contributions
IAS 19 UK pension deficit £70m £71m

2021 financial guidance2020 2021
15
... accelerating into 2021
Growth & Margins
Revenue +5.2%Operating profit +6.2%
14.7% margin
Order book supports further growth at similar levels to 2020. We are not assuming a recovery in commercial aerospace until at least 2023.
Margins around 14% due to increased R&D and transformation costs and some return of travel and marketing related costs.
Transformation investment
£8.2m Accelerating to £11 - 13m in 2021 with year on year benefits in 2022
Internal R&D 3.7% of revenue Between 3.8% to 4.0% of revenue
Returns ROIC(1) 20.0% Around 20%
Cash flow and Capital Expenditure
Strong cash conversion of 92%
Capital Expenditure of £22.1m*
Operating cash conversion of 75%-85% with capital expenditure around £35m driven by increased site investments & other transformation investment
Tax rate19% (cash tax rate: 9.6%) Less than 20% (cash tax rate less than 10%)
1 see Appendix 1.*Includes capitalised internal R&D

Technology enablement Operational & Functional Excellence
Site Excellence
ONE Ultra Culture
Operating Model
Procurement
Optimizing property portfolio with closure of one site and initiating projects on two more.
Site investments approved for two Canadian facilities
Improved working practices, shopfloor layout & communication tools
New head of group procurement & centralized function created
Progress on aggregating demand to improve supplier collaboration
Enhanced internal capacity to build PCB’s
New common vision, mission, values agreed, launched & embedded
40% of leaders new or in a new role
Leadership capability assessment & training programmes commenced
Increased employee engagement
New collaboration technologies in place
Transitioning to a global and unified IT function
New Group CTO appointed to better align R&D with customer’s future needs
Transformation working...
...driving real change
Technology Enablement
New organisational structure
Improved empowerment guidelines, operational metrics and personal & team objectives
Progress on HR, finance, IT, project management and sales processes
Piloted standardized customer engagement & feedback process
16

CustomersEmployees
75.5% engagement
Employee voluntary turnover <10%
50% critical roles filled by internal candidates
Succession plans
25% leadership role candidates diverse
Strategic markets calculated
Customer feedback mechanism in progress
On time delivery
Appointed new CTO
Leaders spent 10% time on continuous improvement/change
Delivering for all stakeholders...
…through our amazing peopleSuppliers
Reviewed partnering options
Opportunities for total cost of supply reduction identified
Supplier reduction targets set
Executing PCB consolidation
Communities
Created group CSR strategy
Set environmental impact reduction measures and targets
Set footprint reduction targets
Group wide approach to Health & Safety created
Code of Conduct launched to all employees
United Services Organization, USA
Sun Youth, Canada
Operation Flinders, Australia
Make a Wish, UK
Group wide matching scheme & Covid-19 community fund launched
17

Exciting potential

…growing segments
Well positioned…
Source: Official US contracting data,
Total DoD Investment accounts (RDT&E and procurement)
US: stable
Other five-eyes: moderate growth
Commercial aerospace: slow recovery
Other CDC markets: moderate growth
100000
150000
200000
250000
300000
2015 2016 2017 2018 2019 2020 2021 2022 2023 2024 2025
Consta
nt (r
eal) 2
021 (
$bn)
300
250
200
150
100
Maritime
5-year CAGR:
2-4%
Intelligence &
Communications
5-year CAGR:
3-5%
Critical Detection &
Control
5-year CAGR:
2-4%
NEAR-PEER, NATION-STATE
ADVERSARIES
POLTICAL INSTABILITY,
REGIME CHANGES
COUNTER TERRORISM
UNKNOWN-UNKNOWN
THREAT
Geo-political tension
Economic headwinds
COUNTERING ASYMETRIC THREATS
DOING MORE WITH LESS
ACCELERATING DETECT TO DEPLOY
MISSION ENABLING SENSING
Changing focus
19

Increasing technology investment...
…supporting segment out-performance
Next generation ASW
Adaptive cognitive networking and situational awareness
Systems to enable autonomous persistent operations
Federated multi-domain analytics
20
Countering asymmetric threats
Doing more with less
Accelerating detect to deploy
Mission enabling sensing

Technology enablement Operational & Functional Excellence
Site Excellence
ONE Ultra Culture
Operating Model
Procurement
...driving real change
Technology Enablement
21
Transformation accelerating into 2021...
...year-on-year benefits earlier than planned
Implement global HR processes, realise the improvement
Leverage global finance processes to drive performance
Embed Continuous Improvement, standardise tools
Begin realising savings from demand aggregation and supplier collaboration
Deliver benefits from new organisation
Improved customer/user engagement to accelerate growth
Organisational alignment around common objectives
Embed CI and values through performance/ talent management
Continue to attract, retain, develop key talent supporting continued growth
Focus on diversity
2021 goals set, actions to deliver, progression to 2024
UltraLabs developing growth accelerators
Improve application consolidation/standardization
Site optimisation to:
• minimise environmental footprint, improve efficiency
• support culture, talent, growth

Well positioned in growth segments
ONE Ultra delivering
Realising exciting potential...
... delivering sustainable stakeholder value22
Increased investment
Stable markets, good visibility
Transformation accelerating

Questions?

Appendices

Intelligence & Communications
(28% of Group revenue)
Delivering information advantage
to the war fighter through the intelligent
application of technology
Our areas of focus:
Command, Control & Intelligence
Tactical Communications
Advanced Cyber Security
Specialized Radio-Frequency System
Our strategic business units
Maritime
(46% of Group revenue)
A strategic partner in the maritime defence
domain, primarily across the five-eyes*
nations
Our areas of focus:
Sonobuoy Systems
Sonar Systems
Naval Systems & Sensors
Signature Management & Power
25
Critical Detection & Control
(26% of Group revenue)
Developing and delivering control systems, data
analytics and sensors to solve complex problems
for customers
Our areas of focus:
Precision Control Systems
Forensic technologies
Energy and industrial sensors and systems
*An intelligence alliance comprising Australia, Canada, New Zealand, the United Kingdom and the United States.

ONE Ultra
Change agenda Historical state Future state
A reminder of our ONE Ultra strategy
An aggregation of SME’s,with limited integration
• Confused/ no strategy
• Internally and externally difficult to work with, inwardly focused
• Tactical and short term
• Maturing technology/capability, limited/uncoordinated investment
• Inconsistent processes / poor execution /poor decision-making/weak delivery
One organisation, with a common purpose and shared values
• Focused, consistent strategy
• Aligned, collaborating, sharing for best stakeholder outcomes
• Strategic, relevant, innovative problem solvers, targeted relevant investment
• Process and improvement focussed, cost efficient
• Agile, turbo-charged, quality decision making
• Rigorous execution and delivery26
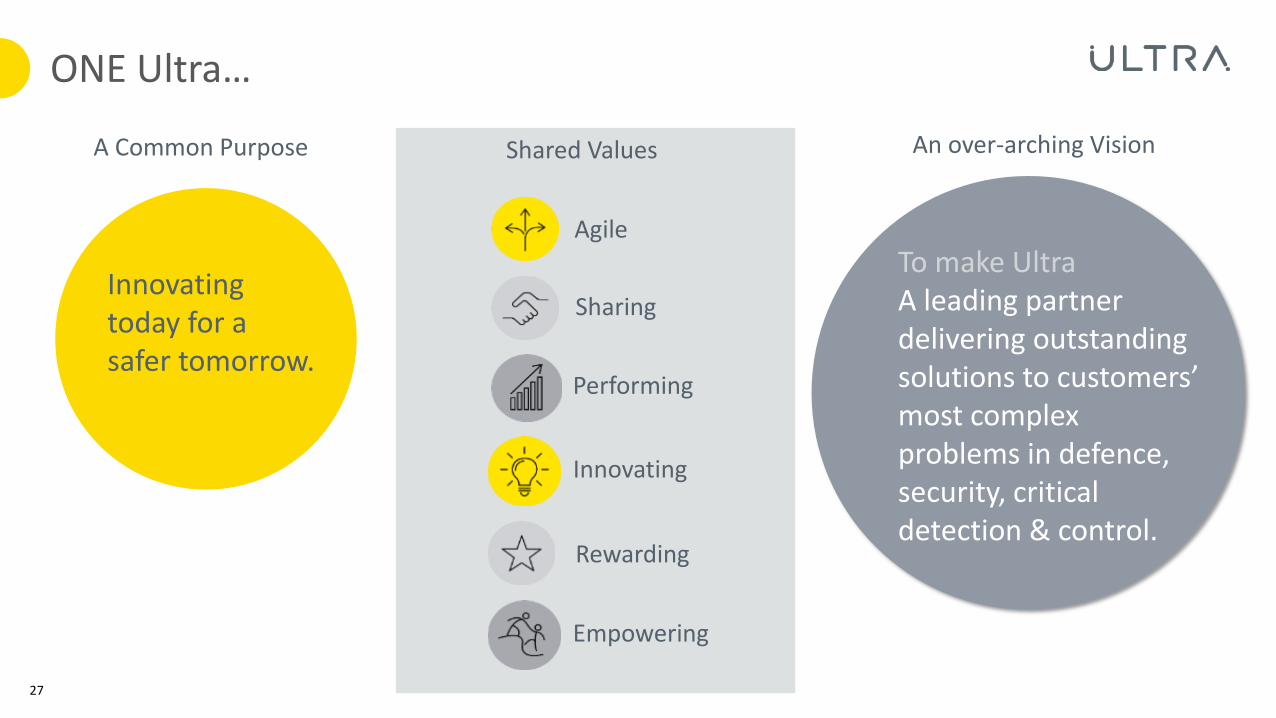
Shared Values
Agile
Sharing
Performing
Innovating
Rewarding
Empowering
ONE Ultra…
Innovatingtoday for a safer tomorrow.
A Common Purpose An over-arching Vision
To make UltraA leading partner delivering outstanding solutions to customers’ most complex problems in defence, security, critical detection & control.
27

2020 revenue breakdown
61%11%
By destination By market
UK£158.4m(2019: £171.1m; 21%)
North America£546.5m(2019: £502.5m; 61%)
Mainland Europe£65.0m(2019: £55.9m; 7%)
Rest of the World£89.9m(2019: £95.9m; 11%)
Defence (Five Eyes)£581.1m
(2019: £544.5m; 66%)
Commercial & Other£210.8m(2019: £216.1m; 26%)
14%
24%
Defence (Non-Five Eyes)£67.9m(2019: £64.8m; 8%)
28
18%
64%
8%
10%
68%
8%
24%

A more disciplined approach to capital allocation …
Asset light, high capital return model driving
strong free cash flow
Organic investment
Inorganic M&A investment
Sustainable through cycle dividend
Value disciplined portfolio
management
Excess through-cycle capitalreturn
Fix & Operational improvement,deliver growth
To accelerate strategy delivery only
if generates additional value
c.2x through cycle cash/earnings cover
Only if can’t be deployed in a value
creative way
1.5x to 2.5x net debt (incl. pension & IFRS16)
to EBITDA ratio
...supporting strategic delivery29
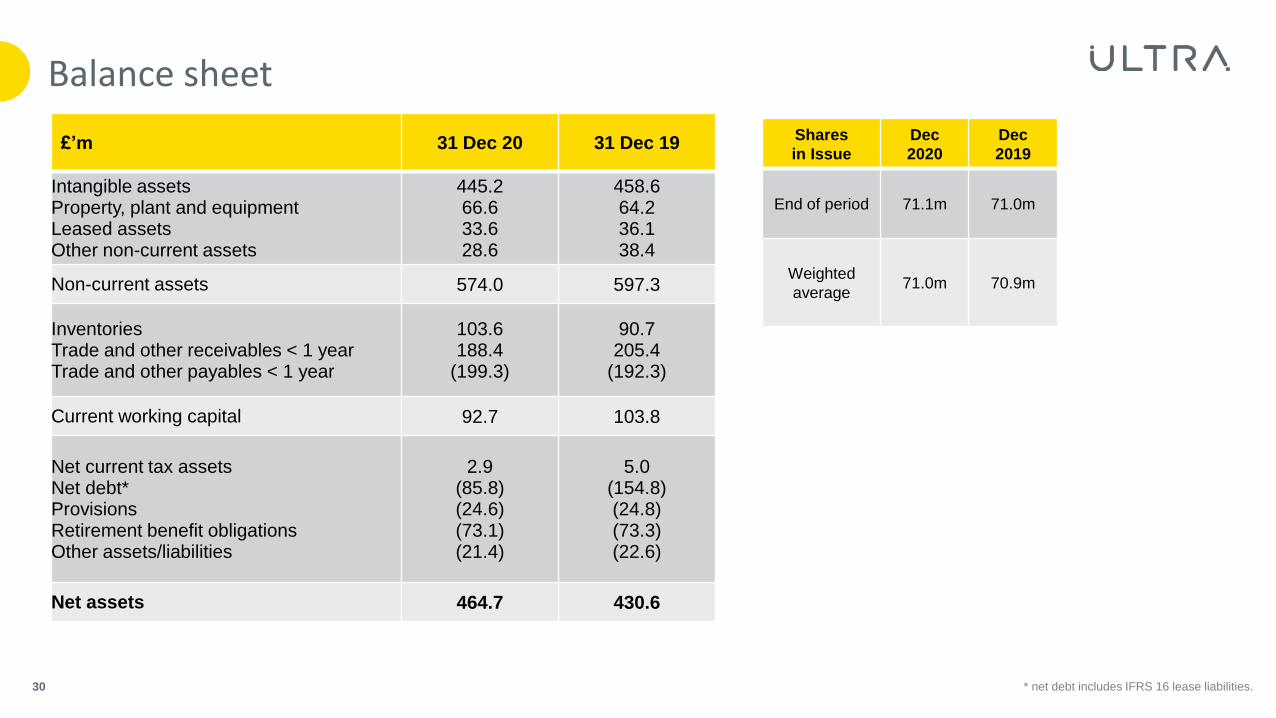
Balance sheet
30
£’m 31 Dec 20 31 Dec 19
Intangible assetsProperty, plant and equipmentLeased assetsOther non-current assets
445.266.633.628.6
458.664.236.138.4
Non-current assets 574.0 597.3
InventoriesTrade and other receivables < 1 yearTrade and other payables < 1 year
103.6188.4
(199.3)
90.7205.4
(192.3)
Current working capital 92.7 103.8
Net current tax assetsNet debt*ProvisionsRetirement benefit obligationsOther assets/liabilities
2.9(85.8)(24.6)(73.1)(21.4)
5.0(154.8)(24.8)(73.3)(22.6)
Net assets 464.7 430.6
Shares
in Issue
Dec
2020
Dec
2019
End of period 71.1m 71.0m
Weighted
average71.0m 70.9m
* net debt includes IFRS 16 lease liabilities.

Net unbilled receivables & advances back to neutral position
31
... A400M unbilled receivables being recovered largely as expected
Co
ntr
act b
ala
nce
s %
of re
ve
nu
e

Foreign exchange
• Translational FX: A 1 cent movement in the USD exchange rate is a £4.2m impact on revenue and £0.6m impact on profit.
• c. 52% (2019: 52%) of Group revenue is in US$ businesses.
• A further c. 12% (2019: 13%) of Group revenue is US$ revenue from UK businesses.
US$:£ % covered
2021 1.29 100%
2022 1.31 70%
2023 1.33 20%
Future hedge rates
32

Appendix 1 - footnotes
33
(1) Underlying operating profit and margin are before amortisation of intangibles arising on acquisition, acquisition and disposalrelated costs, and significant legal charges and expenses.
(2) Underlying profit before tax and earnings per share are before amortisation of intangibles arising on acquisition, fair valuemovements on derivatives, acquisition and disposal related costs, gain or loss on disposal, and significant legal charges andexpenses.
(3) Organic movements are the change in revenue, operating profit and order book at constant currency translation when comparedto the prior period results and adjusted for acquisitions or disposals to reflect the comparable period of ownership.
(4) ROIC is calculated as underlying operating profit for the twelve months preceding the period end expressed as a percentage ofinvested capital (average of opening and closing balance sheets). Invested capital is defined as net assets of the Group, excludingnet debt and lease liability, pension obligations, tax and derivatives.
(5) underlying operating cash flow is cash generated by operations and dividends from associates, less net capital expenditure, R&D,and excluding the cash outflows from acquisition and disposal related payments and significant legal charges and expenses.
(6) operating cash conversion is underlying operating cash flow as a percentage of underlying operating profit.
The comparative period has been presented at constant currency translation and adjusted for disposals to reflect the comparableperiod of ownership

Appendix 2 - Reconciliation from underlying operating cash flow to Free Cash Flow
£’m 2020 2019
Underlying operating cash flow 116.1 86.8
Income taxes (5.4) (9.5)
Net interest (5.2) (8.6)
Lease liability interest (1.7) (1.5)
Disposal-related restructuring costs (1.6) -
M&A costs (1.3) (0.6)
Significant legal charges & expenses (1.5) (1.9)
Free Cash Flow 99.4 64.7
34

Safe harbour statement
Ultra Electronics Holdings plc (the ‘Group’) is providing the following cautionary statement. This document contains certainstatements that are or may be forward-looking with respect to the financial condition, results or operations and business ofthe Group. These statements are sometimes, but not always, identified by the words ‘may’, ‘anticipates’, ‘believes’,‘expects’ or ‘estimates’. By their nature forward-looking statements involve risk and uncertainty because they relate toevents and depend on circumstances that will occur in the future. A number of factors exist that could cause actual resultsand developments to differ materially from those expressed or implied by such forward-looking statements. These factorsinclude, but are not limited to: (i) changes to the current outlook for the world market for defence, security, transport andenergy systems; (ii) changes in tax laws and regulations; (iii) the risks associated with the introduction of new products andservices; (iv) significant global disturbances such as terrorism or prolonged healthcare concerns; (v) the termination ordelay of key contracts; (vi) long-term fluctuations in exchange rates; (vii) regulatory and shareholder approvals; (viii)unanticipated liabilities; and (ix) actions of competitors. Subject to the Listing Rules of the UK Listing Authority, UltraElectronics Holdings plc assumes no responsibility to update any of the forward-looking statements herein.
35