one solution to the mass budget problem for planet
TRANSCRIPT

Physics & Astronomy Faculty Publications Physics and Astronomy
5-24-2019
One Solution to the Mass Budget Problem for Planet Formation: One Solution to the Mass Budget Problem for Planet Formation:
Optically Thick Disks with Dust Scattering Optically Thick Disks with Dust Scattering
Zhaohuan Zhu University of Nevada, Las Vegas, [email protected]
Shangjia Zhang University of Nevada, Las Vegas
Yan-Fei Jiang University of California, Santa Barbara
Akimasa Kataoka National Astronomical Observatory of Japan
Tilman Birnstiel Ludwig-Maximilians-Universität München
See next page for additional authors
Follow this and additional works at: https://digitalscholarship.unlv.edu/physastr_fac_articles
Part of the Astrophysics and Astronomy Commons
Repository Citation Repository Citation Zhu, Z., Zhang, S., Jiang, Y., Kataoka, A., Birnstiel, T., Dullemond, C. P., Andrews, S. M., Huang, J., Perez, L. M., Carpenter, J. M., Bai, X., Wilner, D. J., Ricci, L. (2019). One Solution to the Mass Budget Problem for Planet Formation: Optically Thick Disks with Dust Scattering. Astrophysical Journal Letters, 877(2), 1-13. American Astronomical Society. http://dx.doi.org/10.3847/2041-8213/ab1f8c
This Article is protected by copyright and/or related rights. It has been brought to you by Digital Scholarship@UNLV with permission from the rights-holder(s). You are free to use this Article in any way that is permitted by the copyright and related rights legislation that applies to your use. For other uses you need to obtain permission from the rights-holder(s) directly, unless additional rights are indicated by a Creative Commons license in the record and/or on the work itself. This Article has been accepted for inclusion in Physics & Astronomy Faculty Publications by an authorized administrator of Digital Scholarship@UNLV. For more information, please contact [email protected].

Authors Authors Zhaohuan Zhu, Shangjia Zhang, Yan-Fei Jiang, Akimasa Kataoka, Tilman Birnstiel, Cornelis P. Dullemond, Sean M. Andrews, Jane Huang, Laura M. Perez, John M. Carpenter, Xue-Ning Bai, David J. Wilner, and Luca Ricci
This article is available at Digital Scholarship@UNLV: https://digitalscholarship.unlv.edu/physastr_fac_articles/421
One Solution to the Mass Budget Problem for Planet Formation: Optically Thick Diskswith Dust Scattering
Zhaohuan Zhu1 , Shangjia Zhang1 , Yan-Fei Jiang2 , Akimasa Kataoka3 , Tilman Birnstiel4 , Cornelis P. Dullemond5 ,Sean M. Andrews6 , Jane Huang6 , Laura M. Pérez7, John M. Carpenter8 , Xue-Ning Bai9 , David J. Wilner6 , and
Luca Ricci101 Department of Physics and Astronomy, University of Nevada, Las Vegas, 4505 SouthMaryland Parkway, Las Vegas, NV 89154, USA; [email protected]
2 Kavli Institute for Theoretical Physics, University of California, Santa Barbara, CA, USA3 National Astronomical Observatory of Japan, Osawa 2-21-1, Mitaka, Tokyo 181-8588, Japan
4 University Observatory, Faculty of Physics, Ludwig-Maximilians-Universität München, Scheinerstr.1, D-81679 Munich, Germany5 Zentrum für Astronomie, Heidelberg University, Albert Ueberle Str.2, D-69120 Heidelberg, Germany
6 Harvard-Smithsonian Center for Astrophysics, 60 Garden Street, Cambridge, MA 02138, USA7 Departamento de Astronomía, Universidad de Chile, Camino El Observatorio 1515, Las Condes, Santiago, Chile
8 Joint ALMA Observatory, Avenida Alonso de Córdova 3107, Vitacura, Santiago, Chile9 Institute for Advanced Study and Tsinghua Center for Astrophysics, Tsinghua University, Beijing 100084, People’s Republic of China10 Department of Physics and Astronomy, California State University Northridge, 18111 Nordhoff Street, Northridge, CA 91130, USA
Received 2019 April 3; revised 2019 May 2; accepted 2019 May 7; published 2019 May 24
Abstract
Atacama Large Millimeter Array (ALMA) surveys have suggested that the dust in Class II disks may not beenough to explain the averaged solid mass in exoplanets, under the assumption that the mm disk continuumemission is optically thin. This optically thin assumption seems to be supported by recent Disk Substructures atHigh Angular Resolution Project (DSHARP) observations where the measured optical depths are mostly less thanone. However, we point out that dust scattering can considerably reduce the emission from an optically thickregion. If that scattering is ignored, an optically thick disk with scattering can be misidentified as an optically thindisk. Dust scattering in more inclined disks can reduce the intensity even further, making the disk look even fainter.The measured optical depth of ∼0.6 in several DSHARP disks can be naturally explained by optically thick dustwith an albedo of ∼0.9 at 1.25 mm. Using the DSHARP opacity, this albedo corresponds to a dust population withthe maximum grain size (smax) of 0.1–1 mm. For optically thick scattering disks, the measured spectral index α canbe either larger or smaller than 2 depending on whether the dust albedo increases or decreases with wavelength.We describe how this optically thick scattering scenario could explain the observed scaling between submmcontinuum sizes and luminosities, and might help ease the tension between the dust size constraints frompolarization and dust continuum measurements. We suggest that a significant amount of disk mass can be hiddenfrom ALMA observations and longer wavelength observations (e.g., Very Large Array or Square Kilometre Array)are desired to probe the dust mass in disks.
Key words: opacity – planets and satellites: formation – protoplanetary disks – radiative transfer – scattering –
submillimeter: planetary systems
1. Introduction
The properties of protoplanetary disks (e.g., mass and size)largely determine the properties of planets born in the disks.Radio observations play a fundamental role in studying thesedisks due to the presumed low dust opacity at thesewavelengths. The Atacama Large Millimeter Array (ALMA)has revolutionized protoplanetary disk studies by providing thenecessary sensitivity and spatial resolution to probe the planet-forming region at several au scales for the first time (ALMAPartnership et al. 2015; Andrews et al. 2016). Furthermore, dueto ALMA’s high sensitivity, systematic surveys for a largenumber of young stars can be carried out efficiently.
Previous submm/mm surveys (Beckwith et al. 1990;Andrews & Williams 2005; Andrews et al. 2013), togetherwith recent ALMA surveys (Ansdell et al. 2016; Cieza et al.2019), have suggested that the mass of small dust (cm, whichALMA is sensitive to) in Class II protostellar disks is quite low.The mean mass is ∼15 M♁ for Lupus (Ansdell et al. 2016),Taurus (Andrews et al. 2013), and Ophiuchus (Cieza et al.2019) young stars, under the assumption that the disks areoptically thin at the observed wavelengths. This means that
mass can barely explain the averaged mass of solids inexoplanets based on the exoplanet demographics derived byKepler (e.g., Chiang & Laughlin 2013; Dong & Zhu 2013;Najita & Kenyon 2014). This shortage of solid material in disksbecomes much more severe for lower mass stars with∼0.4Me(Pascucci et al. 2016). Lower mass stars havesignificantly less solids in disks while they are surrounded byplanets having more solids (Mulders et al. 2015). Such dustshortage leads to the speculation that dust grows efficientlywhen the system is younger than the Class II phase (Najita &Kenyon 2014). After the embedded Class 0 and Class I phase atan age of ∼105 yr (Tychoniec et al. 2018), dust may havegrown larger than cm sizes, maybe even to km-sizedplanetesimals, so that ALMA would not be sensitive to themajority of solids during the Class II phase.Another solution to this mass budget problem is that Class II
protostellar disks are optically thick at ALMA wavelengths sothat these disks can hide a large amount of dust mass. This ideais supported by the submm continuum size and luminosityrelationship (Andrews et al. 2010, 2018b; Ricci et al. 2012;Tripathi et al. 2017). But the optically thick disks generate toomuch emission, and a filling factor of 0.3 in disks is needed to
The Astrophysical Journal Letters, 877:L18 (13pp), 2019 June 1 https://doi.org/10.3847/2041-8213/ab1f8c© 2019. The American Astronomical Society. All rights reserved.
1

explain the observations. Recently, the high angular resolutionobservations from the Disk Substructures at High AngularResolution Project (DSHARP) (Andrews et al. 2018a) revealthat most of the DSHARP disks have optical depths less than 1even within the inner 20 au (Huang et al. 2018b), which seemsto support the optically thin assumption. Interestingly, themaximum optical depth in some systems, such as HD 163296(Isella et al. 2018), AS 209 (Guzmán et al. 2018), DoAr 33, andElias 24, seems to plateau around 0.6 (Figure 6 in Huang et al.2018b; Dullemond et al. 2018). To derive the optical depth,Huang et al. (2018b) fit the observed intensity (In) at eachradius r using the disk midplane temperature:
I r B T r e1 , 1rmid= -n n
t- n( ) ( ( ))( ) ( )( )
where Iν(r) is the deprojected, azimuthally averaged radialintensity profile. The midplane temperature, which is also thetemperature of mm-cm−‘ dust at the disk midplane, is estimatedbased on the passively heated, flared disk model
T rL
r8, 2mid 2
SB
1 4
*fp s
=⎛⎝⎜
⎞⎠⎟( ) ( )
where SBs is the Stefan–Boltzmann constant, L* is the stellarluminosity, and f is the flaring angle. Huang et al. (2018b)chose a conservative value of f=0.02, which is also used inDullemond et al. (2018) and Zhang et al. (2018). Figure 1suggests that, in an optically thin disk with the Rayleigh–Jeansapproximation, Tmid and τν are degenerate. If Tmid decreases bya factor of 2, τν will increase by a factor of 2. Thus, one mightargue that the real disks actually have τ 1 instead of τ∼0.6as Equation (2) may overestimate the disk midplane temper-ature by a factor of 2. However, changing Tmid by a factor of 2requires f to be changed by a factor of 16. For a full disk, sucha large flaring angle (f) change is not supported by radiativetransfer calculations (D’Alessio et al. 1998, 2001). On the otherhand, we do not have direct measurements of the disktemperature and a very low temperature is still possible if thedisk has structures that can cast shadows or the dust is highlysettled at the midplane.
In this Letter, we point out that scattering can change thedisk intensity significantly and Equation (1) needs to bemodified to account for the scattering effect. When the disk isisothermal along the vertical direction and optically thick,Equation (1) reduces to Iν=Bν. However, this is only true forsystems without scattering. When scattering is important, Iν canbe smaller than Bν (Rybicki & Lightman 1979). This emissionreduction can be understood intuitively using the mean freepath of a photon argument. Suppose that the single scatteringalbedo is s a s, , ,w s s s= +n n n n( ), where σν,s and σν,a are thescattering and absorption coefficients, respectively, for aphoton having the frequency of ν. The mean free path of aphoton is thus l a s, ,
1s s= +n n n-( ) . However, the photon needs
to be scattered (1−ων)−1 times before being absorbed. So
after the random walk for (1−ων)−1 steps, the mean free path
for the true absorption is l 1a a s,1 2
, ,1w s s= - +n n n n
- -( ) ( ) .Any photon emitted deeper than lν,a from the surface cannotescape. Thus, the total emission is σν,aBνlν,a orI B1 w~ -n n n . Basically, scattering reduces the depth wherephotons can escape. This smaller intensity makes an opticallythick disk look optically thin.
Unfortunately, this emission reduction effect due to dustscattering has largely been ignored in previous radio intensityobservations, despite that the rigorous derivation of this effectthat is presented in Appendix B of the seminal paper by Miyake& Nakagawa (1993). This omission is partly due to theassumption that scattering does not play an important role atradio wavelengths. On the other hand, recent ALMA polariza-tion measurements suggest that dust scattering is crucial forexplaining these observations (Kataoka et al. 2015). Thus, weshould also consider the effect of dust scattering on intensitymeasurements.In Section 2, we will give the analytical solution for the
isothermal disk with scattering and confirm it with numericalcalculations. After discussing some of the implications for thedisk mass, the dust size distribution, and the spectral index inSection 3, we will conclude the Letter in Section 4.
2. Methods and Results
In this section, we will summarize the analytical theory onradiative transfer with scattering (Section 2.1), and then presentnumerical confirmation by both direct calculations(Section 2.2) and Monte-Carlo radiative transfer (MCRT)calculations (Section 2.3).
2.1. Analytical Theory
Consider a flat disk region with a uniform temperature of T.The intensity emitted by this region has been calculated byMiyake & Nakagawa (1993). Here, we follow the derivationgiven by Birnstiel et al. (2018) and extend it further to veryoptically thick cases.The general radiative transfer equation is
nc
I
tI I j J
13a s s, ,
eff,
effs s s¶¶
+ = - + + +nn n n n n n n· ( ) ( )
where Iν(x, t, n) is the intensity at the position x, time t, andalong the direction of n. J I d4 1òp= Wn n
-( ) and jν/σν,a=Bν,while σν,a and σν,s
eff are the absorption and effective scatteringopacity at the frequency of ν. This equation implicitly assumesthat the scattering is isotropic. Because the scattering is notisotropic for the dust with sizes (s) 2πs?λ, we use theeffective scattering coefficient to approximate the anisotropicscattering effect with g1s s,
eff,s s= -n n n( ) where gν is the usual
forward-scattering parameter. This approximation is valid forthe optically thick disk (Ishimaru 1978) that is the focus ofthis work.Assuming that the disk surface follows the 1D plane
atmosphere geometry and has a time-independent radiationfield, the radiative transfer equation throughout the disk issimplified to
dI
dzI j J , 4a s s, ,
eff,
effm s s s= - + + +nn n n n n n( ) ( )
where μ=cos (θ) and θ is the angle between n and the verticaldirection (the z-direction). The 1D plane atmosphere geometrycan be justified considering that the radio emission comes froma thin disk midplane (Pinte et al. 2016).If we adopt d dza s, ,
efft s s= - +n n n( ) , we have
dI
dI S 5m
t= -n
nn n ( )
2
The Astrophysical Journal Letters, 877:L18 (13pp), 2019 June 1 Zhu et al.

with
S B T J1 , 6w w t= - +n n n n n n( ) ( ) ( ) ( )
where the single scattering albedo s a s,eff
, ,effw s s s= +n n n n( )
and 1 a a s, , ,effw s s s- = +n n n n( ).
With the Eddington approximation, the second moment ofthe radiative transfer equation becomes
JJ B T
1
31 . 7
2
2tw
¶¶
= - -n
n n n( )( ( )) ( )
If the temperature of the plane slab is a constant and there is noincoming radiation field at the upper and lower disk surface, thesolution of the equation can be derived using the two-streamapproximation (Miyake & Nakagawa 1993) as
J B T
e e
e1
1 1 1 1,
8
3 1 3 1
3 1
d
d
,
,
t
w w
=
´ -+
- - + - +
n n n
w t w t t
w tn n
- - - -
- -
n n n n n
n n
⎛⎝⎜⎜
⎞⎠⎟⎟
( ) ( )
( ) ( )( )
( ) ( ) ( )
( )
where τν,d and τν are the total and variable optical depth in thevertical direction.
With Jν known, we can integrate Equation (5) throughout thedisk to derive the emergent intensity (I out
n ). Based on theEddington–Barbier approximation, the solution (Birnstiel et al.2018) is
I e S1 2 3 9out d, t m= - =nt m
n n- n( ) ( ) ( )
with Sν(τν) given in Equation (6) and Jν(τν) in Equation (8). Ifτν,d<4μ/3, τν in Sν is chosen as τν,d/2.
With Iνout, we can define its deviation from the blackbody
radiation using
I
B. 10
out
c º n
n( )
As alluded to in the introduction, χ<1 can be due to eitheremission from the optically thin region or dust scattering in theoptically thick region.
If we choose 2 3 1d d, ,t mt t= +n n n( ) in Equation (9) toapproximate both the optically thick and thin cases,Equations (9) and (10) can be written out explicitly as
I
Be1
1
with 2 3 1 . 11
e e
e
d d
out
1 1 1 1
, ,
d
d
d
,
3 1 3 1 ,
3 1 ,
c
w
t mt t
º = -
´ -
= +
n
n
t m
nw w
n n n
-
+
- - + - +
n
wn tn wn tn tn
wn tn n n
- - - -
- -⎜ ⎟⎛⎝
⎞⎠
( )
( ) ( )( ) ( )
( ) ( ) ( )
( )
For the optically thin region, Equations (9) or (11) reduces toI B1 d
out,w t m -n n n n( ) . The quantity of 1 d,w t- n n( ) is
basically the disk optical depth calculated with the absorptioncoefficient or d,
abstn . Thus, when the disk is optically thin(τν,d<1), the emergent intensity reflects only the absorptionopacity.
On the other hand, when the disk is optically thick with(1−ων)τν,d?1, the emission for a disk with scattering issmaller than a disk without scattering (the blackbody radiation)
by a factor of
I
B e1
1 1. 12
out
3 1 2 3c
ww
º = -- +
n
n
n
nw m- n( )
( )( ) ·
Because 1c < if ων>0, the optically thick scattering disklooks fainter than the blackbody radiation calculated using thesame disk temperature.If we expand the exponent in Equation (12) with the Taylor
series, we can simplify the equation further to
3 2
2. 13
3
1
cm
m=
+
+w- n
( )
In the extreme case with w n 1, Equation (13) becomes1 1.15 1 1c m w w= + - ~ -n n( ) , which is similar to
the result based on the mean free path argument in theintroduction. We have verified that Equation (13) only deviatesfrom Equation (12) by less than 5% over the whole parameterspace. This enables us to solve ων analytically using χ, as
11 1
12
3. 14
2
wc c
m= - + -n
-⎛⎝⎜
⎛⎝⎜
⎞⎠⎟
⎞⎠⎟ ( )
If we just apply Equation (1) to calculating the disk opticaldepth using the emergent intensity from an optically thick disk(Equation (12)), we will derive an optical depth of
ln 1 , 15obst c= - -( ) ( )
even if the disk is very optically thick. Thus, anotherexplanation for τobs=0.6 in the DSHARP disks is that thesedisks are actually very optically thick (e.g., τ=104) but withχ=0.45 due to dust scattering (by plugging τobs=0.6 intoEquation (15)). With μ=1 or 0.5, χ=0.45 corresponds toων=0.93 or 0.89, respectively (Equation (14)), suggestingthat the dust in these disks is highly reflective.Figure 1 shows how χ changes with ω using Equation (9).
As expected, the intensity drops when the disk becomes moreoptically thin. On the other hand, even if the disk is opticallythick, stronger scattering can also lead to a smaller intensity. Inthe optically thick limit (τ=100), Equation (12) (yellowcurves) agrees with the full solution (Equation (9)) very well.For the marginally optically thick or optically thin disks (thegreen and red curves), the intensity increases when the disk is
Figure 1. Intensity reduction factor χ with respect to ων for disks with differentoptical depths using Equation (9). The solid curves are derived with μ=1(i=0°, face-on) while the dashed curves are derived with μ=0.5 (i=60°).The yellow dotted curves, which are basically on top of the black curves, arederived with the asymptotic optically thick limit (Equation (12)). Thecorresponding τobs based on Equation (15) is shown on the right axis.
3
The Astrophysical Journal Letters, 877:L18 (13pp), 2019 June 1 Zhu et al.

more inclined (dashed curves). This is simply because our lineof sight passes through more column (1/μ factor) when thedisk is inclined. On the other hand, for very optically thickdisks (τ5), the intensity decreases when the disk is moreinclined due to dust scattering. Thus, inclined optically thickdisks look even fainter than face-on disks. The change in χwith respect to the disk inclination in the optically thick limit isshown in Figure 2.
To study the effect of dust scattering, we can also comparethe intensity from disks having strong scattering with theintensity from disks having zero albedo. We thus define
I
B e116t
out
d,c =
-n
nt- n( )
( )
I
B e1. 17a
out
d,abs
c =-n
nt- n( )
( )
These comparisons assume that μ=1. Without dust scattering,we have χt=χa=1. With dust scattering, we haveχt=(1−ων) and χa=1 in the optically thin limit.Figure 3 shows how both χt and χa change with τν,d and
d,abstn if ω=0.9. When τν,d<1, χt=(1−ων) is a good
approximation. When 1d,abst >n , Equation (12) is a good
approximation. Figure 3 also shows an interesting phenom-enon: dust scattering does not always reduce intensity. When
1d,abst ~n , the disk with scattering is actually brighter than the
disk without scattering, as long as these two disks have thesame absorption optical depth. Due to this complex phenom-enon at 1d,
abst ~n , in the rest of this Letter when we call a disk“optically thin” we refer to τν,d<1, and when we call a disk“optically thick” we refer to 1d,
abst >n , unless otherwise stated.We also want to study how “wrong” the derived optical
depth can be if we use the traditional method (Equation (1)) tomeasure the optical depth of a disk with scattering. We firstcalculate the intensity emitted by the disk with the absorptionoptical depth of d,
abstn and the scattering albedo (ων) usingEquation (9). Then, we use Equation (1) to derive the observedoptical depth (τobs), assuming that we know the actual disktemperature. The relationship between the observed diskoptical depth and the true disk optical depth is shown inFigure 4 for different disk albedos. Clearly, even if ω is only
0.1, an extremely optically thick disk can be misidentified as adisk with the optical depth of order unity.
2.2. Direct Numerical Simulations
To validate the approximations used in the previous section(e.g., the Eddington, two-stream, and Eddington–Barbierapproximations), we have carried out direct radiative transfercalculations using the radiation module in Athena++ (Jianget al. 2014). It solves the radiative transfer equation explicitlyusing the short characteristics method. Here we only solve theradiative transfer equation without evolving thehydrodynamics.We set up a plane-parallel atmosphere with a density profile
of
e , 18z z H0
22min2 2r r= - - ( )( )
to represent the disk vertical density structure, where ρ0=1and H=0.05 in the code unit. The simulation domain extendsfrom the midplane at zmin=0 to zmax=0.35 with 256 uniformgrid cells. For the radiation field, the reflecting boundarycondition (which flips the z-direction of the intensity rays) hasbeen adopted at the disk midplane zmin, considering that thedisk is symmetric with respect to the midplane. The vacuumboundary condition has been adopted at zmax to simulate theoutflowing radiation field. We vary the opacity to control the
Figure 2. χ with respect to the inclination (μ=cos i for the bottom axis and ifor the top axis) for different albedos (ω). The solid curves are from theanalytical estimate in the optically thick limit (Equation (12)), while the dotsare from direct numerical simulations. The corresponding τobs is shown on theright axis.
Figure 3. χt with respect to the total optical depth of disks with differentoptical depths (left panel), and χa with respect to the absorption optical depthof these disks (right panel). The solid curves are derived from Equation (9),while the dotted curves are from the approximated solution (Equation (11)).The albedo ω is set at 0.9. The blue dots are from direct numerical simulations.
Figure 4. Observed disk optical depth with respect to the true disk absorptionoptical depth. The dotted line shows dobs ,
abst t= n .
4
The Astrophysical Journal Letters, 877:L18 (13pp), 2019 June 1 Zhu et al.

optical depth of the disk but keep ω=0.9 for all thesimulations. We solve the radiative transfer equation along40 different angles.
Figure 5 shows the density structure and the radiation fieldfrom our fiducial simulation. The rightmost panel shows theintensity in the direction that is perpendicular to the disksurface. The red curves are from disks with ω=0.9 andτν,d=40,000, while the black curves are from disks withoutscattering and τν,d=4000. Both disks have 4, 000d,
abst =n . Thedotted curves in the middle panel are calculated using theanalytical theory (Equation (8)). As clearly shown, theanalytical theory reproduces the radiation field in the simula-tion very well, and scattering decreases the mean field J at thedisk surface. The J panel also demonstrates why scattering canreduce the emergent intensity in the optically thick limit.Scattering couples the emergent intensity with J (Equations (6)and 9), which deceases at the disk surface. For the intensitycoming out of the disk at other angles and the intensity fromdisks with different optical depths, the simulation data areplotted against the analytical theory in Figures 2 and 3. It seemsthat the analytical theory can explain the simulation resultsreasonably well, although it can underpredict χ by up to 15% inthe optically thick limit. This is probably due to theapproximations used in the analytical calculations.
2.3. MCRT Calculations
Our calculations above assume that the scattering isisotropic. To test anisotropic scattering, we have carried outMCRT calculations using RADMC-3D.11 We set up the diskwith Toomre Q=1, which is the most massive disk possible.The disk temperature is prescribed as in Equation (2), usingL*=Le. The disk is locally isothermal along the z-direction ata given r. We also assume M*=Me. The disk scale height H(r)/r is calculated from H(r)/r=cs/vf where c RTs
2 m= andμ=2.35. To keep Q=1 throughout the disk, the gas surfacedensity
rr
33020 au
g cm . 19g
1.752S =
--⎜ ⎟⎛
⎝⎞⎠( ) ( )
To be in hydrostatic equilibrium, the disk has a Gaussiandensity profile along the z-direction,
r zr
H r
z
H r,
2exp
2. 20g
g2
2r
p=
S-
⎛⎝⎜
⎞⎠⎟( )
( )( ) ( )
( )
The disk is truncated at rin=3 au and rout=150 au in theradial direction. At 20 au, H(r)/r=0.047 and T=28 K. Thedust density is set to be 1/100 of the gas density and the dustscale height is one-fifth of the gas scale height. The DSHARPopacity (with water ice) is adopted, with smin=0.1 μm,smax=1 mm, and n(s)∼s−3.5. The composition and opticalconstants are the same as in Table 1 and Figure 2 of Birnstielet al. (2018), and can be obtained by dsharp_opac.12 Forfull anisotropic scattering, the Müeller matrices are calculatedusing Mie theory, specifically the Bohren–Huffman program(Bohren & Huffman 1983). For isotropic scattering calcula-tions, the opacity that is normalized to the dust density is dabsk ∣=2.1 cm2 g−1 and dscak ∣ =19.5 cm2 g−1 at 1.25 mm (soω=0.9). To compare with the rest of the Letter, where theopacity is normalized to the gas density, we can derive the gasdensity normalized opacity κabs=0.021 cm2 g−1 andκsca=0.195 cm2 g−1. Here, ρdκabs,d or 100ρdκabs are basicallyσν,a in Section 2.1. For the face-on disk, τ ∼ 7 at 20 au. Forevery disk inclination, we have run three simulations: onewithout scattering, one with isotropic scattering, and one withfull anisotropic scattering treatment. All of these threesimulations have the same absorption opacity. We have used5×108 photon packages. The resolution in the radial,poloidal, and azimuthal directions are 512, 2048, and 32 cells,respectively. The cell size in the radial direction is uniform inlogarithmic space, while the cell size in the poloidal andazimuthal directions are uniform in linear space from 0° to 50°,and from 0 to 2π, respectively. The reflecting boundarycondition is used at the disk midplane. Such high resolution inthe poloidal direction is crucial for treating the scatteringprocess properly.The results are shown in Figure 6. The top panels show the
2D intensity maps at 1.25 mm for the disks with anisotropicscattering. Intensity maps from MCRT calculations withoutscattering and with isotropic scattering are also generated. Wecut through the horizontal major axis in the images to derivethe 1D profiles, which are shown in the middle and bottompanels. The middle panels show the 1D profiles of thebrightness temperature that is converted from the measuredintensity. When the disk is face on, 0.6c ~ ; this is consistentwith our analytical estimate using ω=0.9. The bottom panelsshow the derived optical depths using Equation (1). Differentcolored curves show disks with different scattering treatments.We do not show the measured optical depth for no-scatteringcases, because when the optical depth becomes very large (e.g.,>10), Equation (1) cannot provide an accurate estimate of theoptical depth. Compared with isotropic scattering, fullanisotropic scattering treatment does not change the resultsqualitatively. Clearly, if the disks are highly optically thick buthave scattering, the measured optical depths are 1 usingEquation (1). If the scattering disk is more inclined (to the right
Figure 5. Profiles of the disk density, J, and I from our fiducial simulation. Theblack solid curves are the case with ω=0 and d,
abstn =4000, while the red solidcurves are the case with the ω=0.9 isotropic scattering and the same d,
abstn . Thedotted curves in the middle panel are J calculated from the analytical theory.
11 RADMC-3D is an open code of radiative transfer calculations. The code isavailable online: http://www.ita.uni-heidelberg.de/~dullemond/software/radmc-3d/. 12 https://github.com/birnstiel/dsharp_opac
5
The Astrophysical Journal Letters, 877:L18 (13pp), 2019 June 1 Zhu et al.
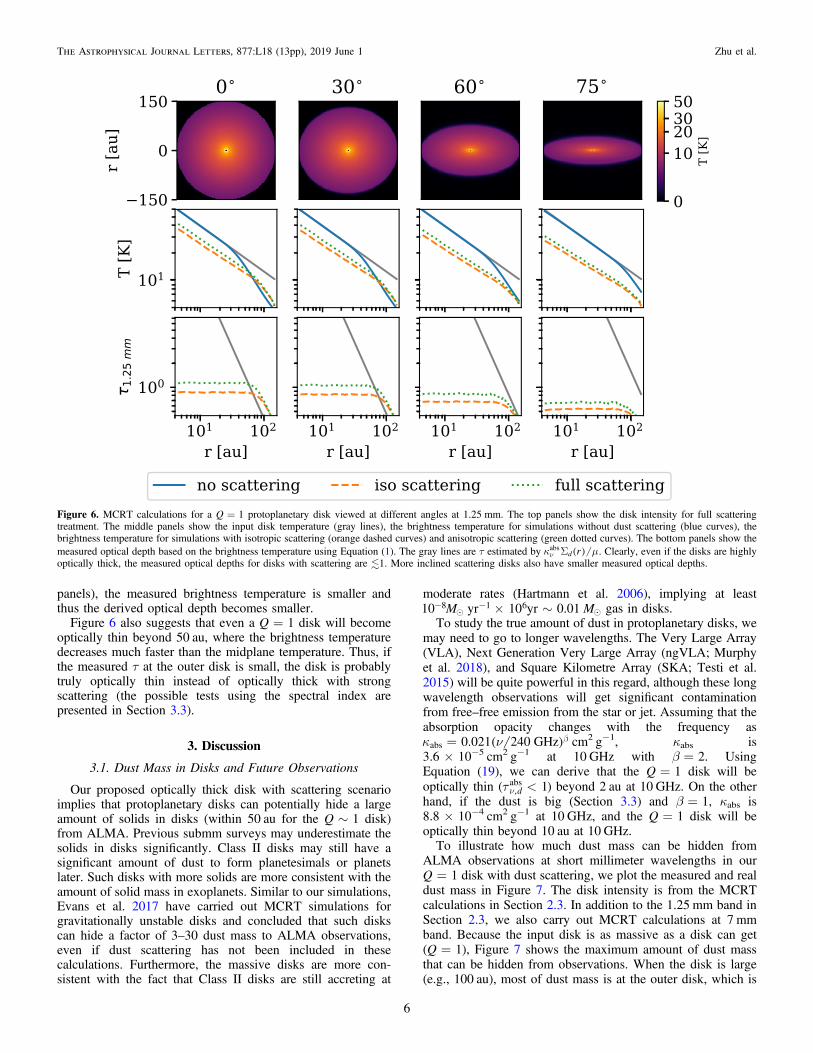
panels), the measured brightness temperature is smaller andthus the derived optical depth becomes smaller.
Figure 6 also suggests that even a Q=1 disk will becomeoptically thin beyond 50 au, where the brightness temperaturedecreases much faster than the midplane temperature. Thus, ifthe measured τ at the outer disk is small, the disk is probablytruly optically thin instead of optically thick with strongscattering (the possible tests using the spectral index arepresented in Section 3.3).
3. Discussion
3.1. Dust Mass in Disks and Future Observations
Our proposed optically thick disk with scattering scenarioimplies that protoplanetary disks can potentially hide a largeamount of solids in disks (within 50 au for the Q∼1 disk)from ALMA. Previous submm surveys may underestimate thesolids in disks significantly. Class II disks may still have asignificant amount of dust to form planetesimals or planetslater. Such disks with more solids are more consistent with theamount of solid mass in exoplanets. Similar to our simulations,Evans et al. 2017 have carried out MCRT simulations forgravitationally unstable disks and concluded that such diskscan hide a factor of 3–30 dust mass to ALMA observations,even if dust scattering has not been included in thesecalculations. Furthermore, the massive disks are more con-sistent with the fact that Class II disks are still accreting at
moderate rates (Hartmann et al. 2006), implying at leastM M10 yr 10 yr 0.018 1 6´ ~- - gas in disks.
To study the true amount of dust in protoplanetary disks, wemay need to go to longer wavelengths. The Very Large Array(VLA), Next Generation Very Large Array (ngVLA; Murphyet al. 2018), and Square Kilometre Array (SKA; Testi et al.2015) will be quite powerful in this regard, although these longwavelength observations will get significant contaminationfrom free–free emission from the star or jet. Assuming that theabsorption opacity changes with the frequency as
0.021 240 GHzabsk n= b( ) cm2 g−1, κabs is3.6×10−5 cm2 g−1 at 10 GHz with β=2. UsingEquation (19), we can derive that the Q=1 disk will beoptically thin ( 1d,
abst <n ) beyond 2 au at 10 GHz. On the otherhand, if the dust is big (Section 3.3) and β=1, κabs is8.8×10−4 cm2 g−1 at 10 GHz, and the Q=1 disk will beoptically thin beyond 10 au at 10 GHz.To illustrate how much dust mass can be hidden from
ALMA observations at short millimeter wavelengths in ourQ=1 disk with dust scattering, we plot the measured and realdust mass in Figure 7. The disk intensity is from the MCRTcalculations in Section 2.3. In addition to the 1.25 mm band inSection 2.3, we also carry out MCRT calculations at 7 mmband. Because the input disk is as massive as a disk can get(Q=1), Figure 7 shows the maximum amount of dust massthat can be hidden from observations. When the disk is large(e.g., 100 au), most of dust mass is at the outer disk, which is
Figure 6. MCRT calculations for a Q=1 protoplanetary disk viewed at different angles at 1.25 mm. The top panels show the disk intensity for full scatteringtreatment. The middle panels show the input disk temperature (gray lines), the brightness temperature for simulations without dust scattering (blue curves), thebrightness temperature for simulations with isotropic scattering (orange dashed curves) and anisotropic scattering (green dotted curves). The bottom panels show themeasured optical depth based on the brightness temperature using Equation (1). The gray lines are τ estimated by rd
absk mSn ( ) . Clearly, even if the disks are highlyoptically thick, the measured optical depths for disks with scattering are 1. More inclined scattering disks also have smaller measured optical depths.
6
The Astrophysical Journal Letters, 877:L18 (13pp), 2019 June 1 Zhu et al.
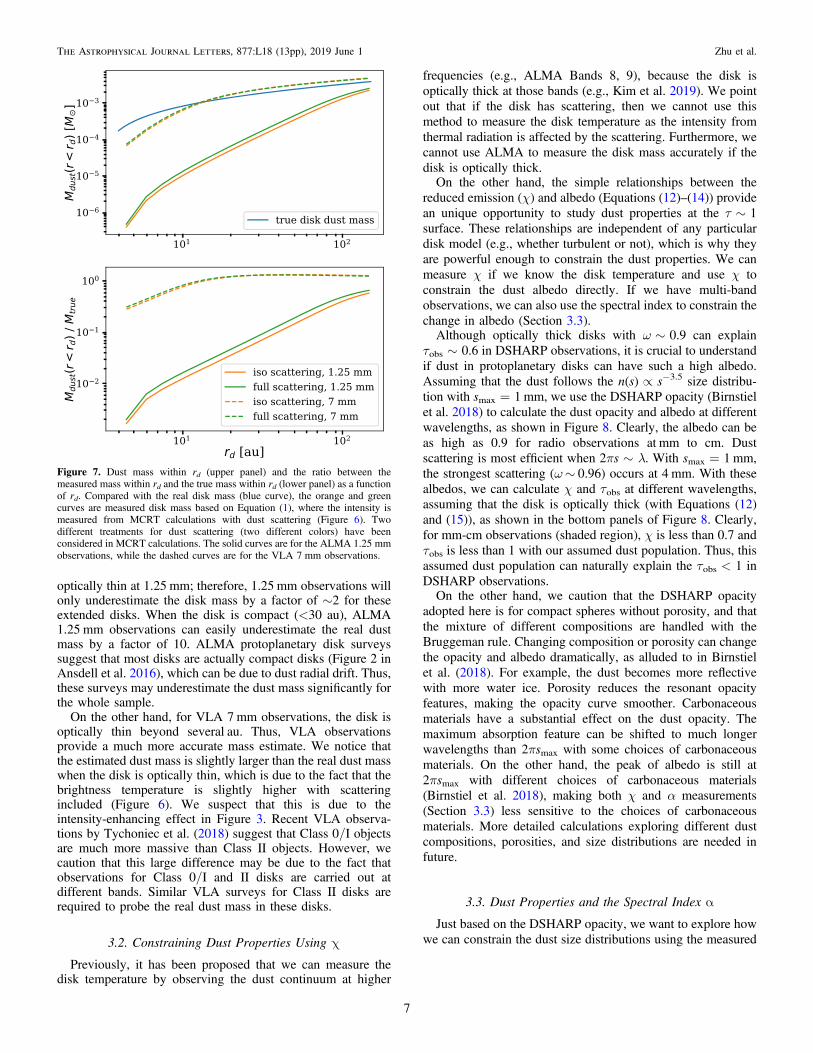
optically thin at 1.25 mm; therefore, 1.25 mm observations willonly underestimate the disk mass by a factor of ∼2 for theseextended disks. When the disk is compact (<30 au), ALMA1.25 mm observations can easily underestimate the real dustmass by a factor of 10. ALMA protoplanetary disk surveyssuggest that most disks are actually compact disks (Figure 2 inAnsdell et al. 2016), which can be due to dust radial drift. Thus,these surveys may underestimate the dust mass significantly forthe whole sample.
On the other hand, for VLA 7mm observations, the disk isoptically thin beyond several au. Thus, VLA observationsprovide a much more accurate mass estimate. We notice thatthe estimated dust mass is slightly larger than the real dust masswhen the disk is optically thin, which is due to the fact that thebrightness temperature is slightly higher with scatteringincluded (Figure 6). We suspect that this is due to theintensity-enhancing effect in Figure 3. Recent VLA observa-tions by Tychoniec et al. (2018) suggest that Class 0/I objectsare much more massive than Class II objects. However, wecaution that this large difference may be due to the fact thatobservations for Class 0/I and II disks are carried out atdifferent bands. Similar VLA surveys for Class II disks arerequired to probe the real dust mass in these disks.
3.2. Constraining Dust Properties Using χ
Previously, it has been proposed that we can measure thedisk temperature by observing the dust continuum at higher
frequencies (e.g., ALMA Bands 8, 9), because the disk isoptically thick at those bands (e.g., Kim et al. 2019). We pointout that if the disk has scattering, then we cannot use thismethod to measure the disk temperature as the intensity fromthermal radiation is affected by the scattering. Furthermore, wecannot use ALMA to measure the disk mass accurately if thedisk is optically thick.On the other hand, the simple relationships between the
reduced emission (χ) and albedo (Equations (12)–(14)) providean unique opportunity to study dust properties at the τ∼1surface. These relationships are independent of any particulardisk model (e.g., whether turbulent or not), which is why theyare powerful enough to constrain the dust properties. We canmeasure χ if we know the disk temperature and use χ toconstrain the dust albedo directly. If we have multi-bandobservations, we can also use the spectral index to constrain thechange in albedo (Section 3.3).Although optically thick disks with ω∼0.9 can explain
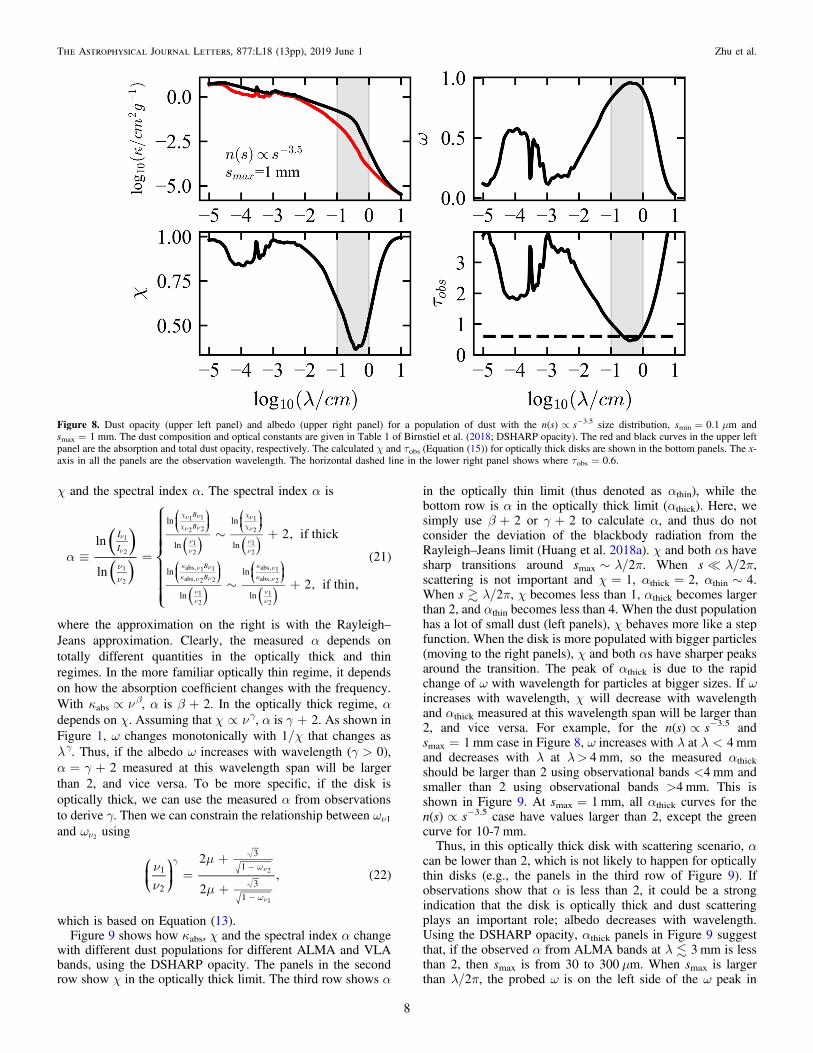
τobs∼0.6 in DSHARP observations, it is crucial to understandif dust in protoplanetary disks can have such a high albedo.Assuming that the dust follows the n(s)∝s−3.5 size distribu-tion with smax=1 mm, we use the DSHARP opacity (Birnstielet al. 2018) to calculate the dust opacity and albedo at differentwavelengths, as shown in Figure 8. Clearly, the albedo can beas high as 0.9 for radio observations at mm to cm. Dustscattering is most efficient when 2πs∼λ. With smax=1 mm,the strongest scattering (ω∼ 0.96) occurs at 4 mm. With thesealbedos, we can calculate χ and τobs at different wavelengths,assuming that the disk is optically thick (with Equations (12)and (15)), as shown in the bottom panels of Figure 8. Clearly,for mm-cm observations (shaded region), χ is less than 0.7 andτobs is less than 1 with our assumed dust population. Thus, thisassumed dust population can naturally explain the τobs<1 inDSHARP observations.On the other hand, we caution that the DSHARP opacity
adopted here is for compact spheres without porosity, and thatthe mixture of different compositions are handled with theBruggeman rule. Changing composition or porosity can changethe opacity and albedo dramatically, as alluded to in Birnstielet al. (2018). For example, the dust becomes more reflectivewith more water ice. Porosity reduces the resonant opacityfeatures, making the opacity curve smoother. Carbonaceousmaterials have a substantial effect on the dust opacity. Themaximum absorption feature can be shifted to much longerwavelengths than 2πsmax with some choices of carbonaceousmaterials. On the other hand, the peak of albedo is still at2πsmax with different choices of carbonaceous materials(Birnstiel et al. 2018), making both χ and α measurements(Section 3.3) less sensitive to the choices of carbonaceousmaterials. More detailed calculations exploring different dustcompositions, porosities, and size distributions are needed infuture.
3.3. Dust Properties and the Spectral Index α
Just based on the DSHARP opacity, we want to explore howwe can constrain the dust size distributions using the measured
Figure 7. Dust mass within rd (upper panel) and the ratio between themeasured mass within rd and the true mass within rd (lower panel) as a functionof rd. Compared with the real disk mass (blue curve), the orange and greencurves are measured disk mass based on Equation (1), where the intensity ismeasured from MCRT calculations with dust scattering (Figure 6). Twodifferent treatments for dust scattering (two different colors) have beenconsidered in MCRT calculations. The solid curves are for the ALMA 1.25 mmobservations, while the dashed curves are for the VLA 7 mm observations.
7
The Astrophysical Journal Letters, 877:L18 (13pp), 2019 June 1 Zhu et al.
χ and the spectral index α. The spectral index α is
ln
ln
2, if thick
2, if thin,
21
I
I
ln
ln
ln
ln
ln
ln
ln
ln
B
B
B
B
1
2
1
2
1 1
2 2
1
2
1
2
1
2
abs, 1 1
abs, 2 2
1
2
abs, 1
abs, 2
1
2
a º =
~ +
~ +nn
n
n
cn n
cn n
nn
cncn
nn
k n nk n n
nn
k nk n
nn
⎧
⎨⎪⎪⎪
⎩⎪⎪⎪
⎛⎝⎜
⎞⎠⎟
⎛⎝⎜
⎞⎠⎟
⎛⎝⎜
⎞⎠⎟
⎛⎝⎜
⎞⎠⎟
( )( )
( ) ( )
( ) ( )
( )
where the approximation on the right is with the Rayleigh–Jeans approximation. Clearly, the measured α depends ontotally different quantities in the optically thick and thinregimes. In the more familiar optically thin regime, it dependson how the absorption coefficient changes with the frequency.With κabs∝νβ, α is β+2. In the optically thick regime, αdepends on χ. Assuming that χ∝νγ, α is γ+2. As shown inFigure 1, ω changes monotonically with 1/χ that changes asλγ. Thus, if the albedo ω increases with wavelength (γ>0),α=γ+2 measured at this wavelength span will be largerthan 2, and vice versa. To be more specific, if the disk isoptically thick, we can use the measured α from observationsto derive γ. Then we can constrain the relationship between ων1
and 2wn using
2
2, 221
2
3
1
3
1
2
1
nn
m
m=
+
+
gw
w
-
-
n
n
⎛⎝⎜
⎞⎠⎟ ( )
which is based on Equation (13).Figure 9 shows how κabs, χ and the spectral index α change
with different dust populations for different ALMA and VLAbands, using the DSHARP opacity. The panels in the secondrow show χ in the optically thick limit. The third row shows α
in the optically thin limit (thus denoted as αthin), while thebottom row is α in the optically thick limit (αthick). Here, wesimply use β+2 or γ+2 to calculate α, and thus do notconsider the deviation of the blackbody radiation from theRayleigh–Jeans limit (Huang et al. 2018a). χ and both αs havesharp transitions around smax∼λ/2π. When s=λ/2π,scattering is not important and χ=1, αthick=2, αthin∼4.When sλ/2π, χ becomes less than 1, αthick becomes largerthan 2, and αthin becomes less than 4. When the dust populationhas a lot of small dust (left panels), χ behaves more like a stepfunction. When the disk is more populated with bigger particles(moving to the right panels), χ and both αs have sharper peaksaround the transition. The peak of αthick is due to the rapidchange of ω with wavelength for particles at bigger sizes. If ωincreases with wavelength, χ will decrease with wavelengthand αthick measured at this wavelength span will be larger than2, and vice versa. For example, for the n(s)∝s−3.5 andsmax=1 mm case in Figure 8, ω increases with λ at λ<4 mmand decreases with λ at λ> 4 mm, so the measured αthick
should be larger than 2 using observational bands <4 mm andsmaller than 2 using observational bands >4 mm. This isshown in Figure 9. At smax=1 mm, all αthick curves for then(s)∝s−3.5 case have values larger than 2, except the greencurve for 10-7 mm.Thus, in this optically thick disk with scattering scenario, α
can be lower than 2, which is not likely to happen for opticallythin disks (e.g., the panels in the third row of Figure 9). Ifobservations show that α is less than 2, it could be a strongindication that the disk is optically thick and dust scatteringplays an important role; albedo decreases with wavelength.Using the DSHARP opacity, αthick panels in Figure 9 suggestthat, if the observed α from ALMA bands at λ3 mm is lessthan 2, then smax is from 30 to 300 μm. When smax is largerthan λ/2π, the probed ω is on the left side of the ω peak in
Figure 8. Dust opacity (upper left panel) and albedo (upper right panel) for a population of dust with the n(s)∝s−3.5 size distribution, smin=0.1 μm andsmax=1 mm. The dust composition and optical constants are given in Table 1 of Birnstiel et al. (2018; DSHARP opacity). The red and black curves in the upper leftpanel are the absorption and total dust opacity, respectively. The calculated χ and τobs (Equation (15)) for optically thick disks are shown in the bottom panels. The x-axis in all the panels are the observation wavelength. The horizontal dashed line in the lower right panel shows where τobs=0.6.
8
The Astrophysical Journal Letters, 877:L18 (13pp), 2019 June 1 Zhu et al.

Figure 8 so that α becomes larger than 2. This transition isrelatively quick. After an α peak around smax∼0.5λ, αplateaus around a value slightly larger than 2.
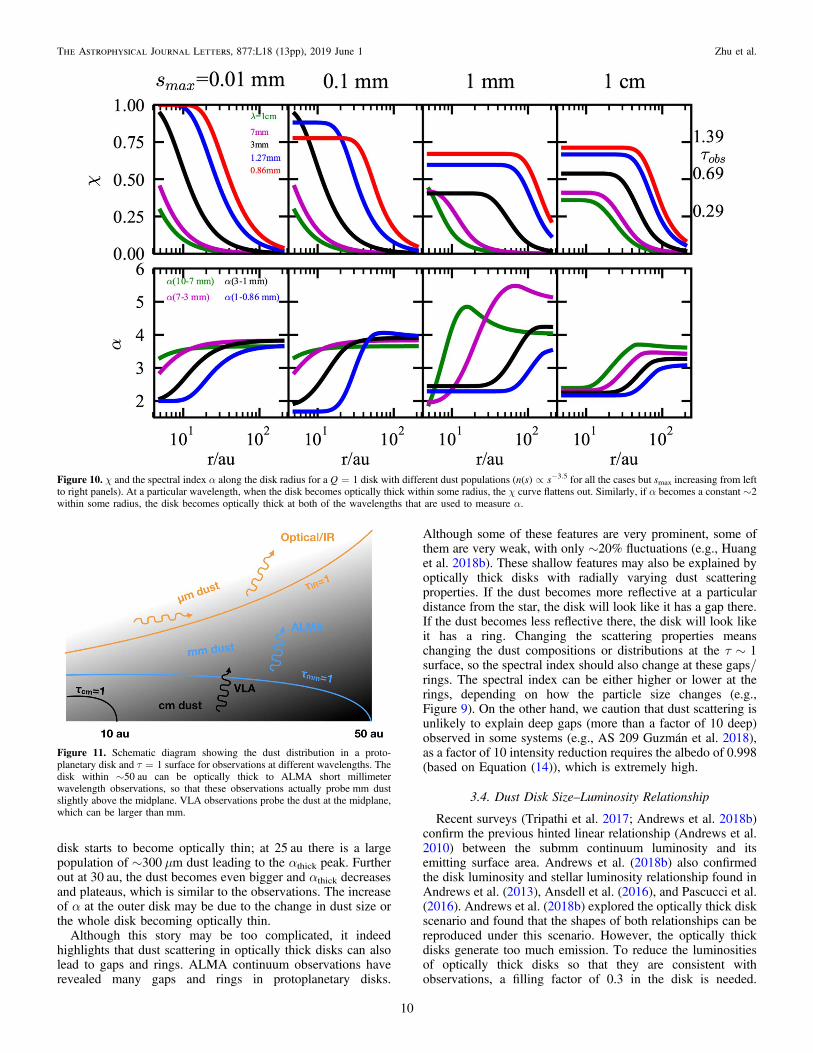
Consider a disk that is optically thick at the inner disk andoptically thin at the outer disk: the spectral index will be around2 at the inner disk and suddenly change to 3–4 when τ<1.This is simply because α in the optically thick and thin regimesis determined by different physical mechanisms. To illustratethis point, we calculate Iν/Bν and α for a Q=1 disk(Equation (19)) at both ALMA and VLA wavelength bands(Figure 10). At the inner disk where the disk is optically thick,χ and α flatten out. More disk region becomes optically thinwith observations at longer wavelengths. At VLA bands of7 mm and 1 cm, the disk is optically thin even down to 5 au aslong as smax1 mm. With smax=1 cm, which has themaximum opacity at ∼1 cm, VLA observations can still probethe disk down to 20 au before the disk becomes optically thick.HL Tau observations by Carrasco-González et al. (2016) seemto indicate that α derived from ALMA bands changes from 2 to3 relatively quickly from 40 to 60 au, which may indicate thatHL Tau is optically thick within 40 au in ALMA observations.On the other hand, α derived from 3 mm ALMA and 7 mmVLA bands is larger than 2 throughout the disk, whichindicates that the disk may be optically thin for VLAobservations. Figure 10 also suggests that we may want tomeasure the spectral index using every combination of twodifferent bands, because α can change dramatically at differentwavelengths, especially at wavelengths close to the Mieresonances of the dust opacity.
Note that each panel in Figure 10 assumes the same dust sizedistribution throughout the disk. In reality, dust size distribu-tions vary both radially and vertically. When the disk isoptically thick, the emission is determined by the τν∼1surface. Consequently, χ and α measured at the inner opticallythick disk only inform us the dust size distribution at the disksurface. The dust at the midplane could be a lot larger, whichcan only be probed by observations at longer wavelengths.When the disk is optically thin, the measured α informs us thedust size distribution at the midplane directly (see Section 3.5and Figure 11).Previous spatially resolved α measurements have shown that
α decreases toward the inner disk (Pérez et al. 2012, 2015;Carrasco-González et al. 2016; Tazzari et al. 2016). Yet α isalways larger than 2 in these observations. TW Hya has someindications that α can be smaller than 2 at inner 20 au(Tsukagoshi et al. 2016; Huang et al. 2018a). Although thisdeviation from 2 can in part be explained by the fact that theRayleigh–Jeans approximation deviates from the blackbodyradiation there (Huang et al. 2018a), we discuss the possibilitythat the disk has strong scattering and is optically thick at theinner disk. Under the optically thick scattering disk scenario,α<2 within 20 au implies that we have a large population ofdust with ∼100 μm sizes there at the τν∼1 surface (based onthe blue curves in the bottom row of Figure 9). At 25 au,observations suggest that there is an α peak reaching α=2.5,which is similar to the αthick peak in Figure 9. Thus, oneexplanation for this peak is that dust size increases with radius,or that we are probing deeper large dust layers in the disk as the
Figure 9. κabs, χ, and the spectral index α for different dust populations with different distributions (from left to right panels) and different smax (the x-axis). Thepanels in the first row show the absorption opacity, while the second row shows χ in the optically thick limit, which is directly related to albedo. The third row showsα in the optically thin limit (thus denoted as αthin), while the bottom row is α in the optically thick limit (αthick). The rightmost panels are for particles with a narrowsize bin distribution (from 0.5 to 2 s with n(s)∝s−4). In the upper two rows, κabs and χ for observations at different bands are plotted as different colors, while in thebottom two rows, α from different band combinations is plotted as different colors. The dotted lines in the bottom two rows label α=2.5 for comparison.smin=0.1μm in all these calculations (see Section 3.3 for details).
9
The Astrophysical Journal Letters, 877:L18 (13pp), 2019 June 1 Zhu et al.
disk starts to become optically thin; at 25 au there is a largepopulation of ∼300 μm dust leading to the αthick peak. Furtherout at 30 au, the dust becomes even bigger and αthick decreasesand plateaus, which is similar to the observations. The increaseof α at the outer disk may be due to the change in dust size orthe whole disk becoming optically thin.
Although this story may be too complicated, it indeedhighlights that dust scattering in optically thick disks can alsolead to gaps and rings. ALMA continuum observations haverevealed many gaps and rings in protoplanetary disks.
Although some of these features are very prominent, some ofthem are very weak, with only ∼20% fluctuations (e.g., Huanget al. 2018b). These shallow features may also be explained byoptically thick disks with radially varying dust scatteringproperties. If the dust becomes more reflective at a particulardistance from the star, the disk will look like it has a gap there.If the dust becomes less reflective there, the disk will look likeit has a ring. Changing the scattering properties meanschanging the dust compositions or distributions at the τ∼1surface, so the spectral index should also change at these gaps/rings. The spectral index can be either higher or lower at therings, depending on how the particle size changes (e.g.,Figure 9). On the other hand, we caution that dust scattering isunlikely to explain deep gaps (more than a factor of 10 deep)observed in some systems (e.g., AS 209 Guzmán et al. 2018),as a factor of 10 intensity reduction requires the albedo of 0.998(based on Equation (14)), which is extremely high.
3.4. Dust Disk Size–Luminosity Relationship
Recent surveys (Tripathi et al. 2017; Andrews et al. 2018b)confirm the previous hinted linear relationship (Andrews et al.2010) between the submm continuum luminosity and itsemitting surface area. Andrews et al. (2018b) also confirmedthe disk luminosity and stellar luminosity relationship found inAndrews et al. (2013), Ansdell et al. (2016), and Pascucci et al.(2016). Andrews et al. (2018b) explored the optically thick diskscenario and found that the shapes of both relationships can bereproduced under this scenario. However, the optically thickdisks generate too much emission. To reduce the luminositiesof optically thick disks so that they are consistent withobservations, a filling factor of 0.3 in the disk is needed.
Figure 10. χ and the spectral index α along the disk radius for a Q=1 disk with different dust populations (n(s)∝s−3.5 for all the cases but smax increasing from leftto right panels). At a particular wavelength, when the disk becomes optically thick within some radius, the χ curve flattens out. Similarly, if α becomes a constant ∼2within some radius, the disk becomes optically thick at both of the wavelengths that are used to measure α.
Figure 11. Schematic diagram showing the dust distribution in a proto-planetary disk and τ=1 surface for observations at different wavelengths. Thedisk within ∼50 au can be optically thick to ALMA short millimeterwavelength observations, so that these observations actually probe mm dustslightly above the midplane. VLA observations probe the dust at the midplane,which can be larger than mm.
10
The Astrophysical Journal Letters, 877:L18 (13pp), 2019 June 1 Zhu et al.

Tripathi et al. (2017) and Andrews et al. (2018b) suggested thatsubstructures (e.g., rings, gaps) can lead to this filling factor.Here, we suggest that, in addition to substructures, dustscattering can also decrease the luminosity for optically thickdisks. Instead of the filling factor, a high albedo at the τν∼1surface may also explain the observations.
3.5. Connections with Previous Works
Reducing blackbody intensity due to scattering is known invarious astronomical communities (e.g., electron scatteringreduces the radiation from accretion disks around compactobjects). For the protoplanetary disk study, Miyake &Nakagawa (1993) solved the radiative transfer equation foran isothermal disk (as summarized in Section 2). These resultshave been mentioned in many subsequent works (e.g.,D’Alessio et al. 2001; Birnstiel et al. 2018). Sierra et al.(2017) applied this to dusty vortices and showed that theoptically thick vortex center becomes fainter if dust scatteringis considered.
On the other hand, dust scattering is largely ignored in radioobservations because the protoplanetary disk is thought to beoptically thin so that dust scattering is not important. Recentworks by Kataoka et al. (2015) and Yang et al. (2016a) havesuggested that dust scattering may be crucial for explainingsubmm polarization measurements, although other mechanismsmay still be needed to explain the observations (Yang et al.2016b; Kataoka et al. 2017). However, there is a strong tensionbetween the dust size constrained by polarization measure-ments and submm-cm continuum spectral index measurements(Kataoka et al. 2016). Here, we suggest that such tension maybe due to the optically thin assumption in both polarization andsubmm continuum studies. If the disk is optically thick, thespectral index is normally smaller than that from an opticallythin disk. Assuming that the disk is optically thin, submmcontinuum observations can overestimate the particle sizesignificantly. In reality (the schematic diagram from Figure 11),the small α by submm observations could simply reflect thatthe disk is optically thick for these observations and dust at theτmm∼1 surface has a typical size of 0.1–1 mm with strongscattering. For longer wavelength observations by VLA (Pérezet al. 2015), the disk is likely to be optically thin beyond 10 au.The small α measured from these observations could indeedimply the presence of large particles at deeper layers (likely themidplane) in the disk where VLA is probing, which is a naturaloutcome from dust settling. Note that the absorption opacity at7 mm is 10–50 times smaller than the opacity at 1.25 mm.Thus, VLA probes a much deeper layer in the disk. MCRTcalculations for disks with such vertically varied dust sizedistribution will be presented in S. Zhang et al. (2019, inpreparation).
Another line of evidence showing that most protoplanetarydisks are optically thick at ALMA bands is that inclined disksare systematically less massive than face-on disks based on∼1 mm observations, assuming that the disks are optically thin(Figure 4 in Garufi et al. 2018). If the disks are optically thin,the measured dust mass should not depend on the diskinclination. Thus, this inclination dependence suggests that thedisks are optically thick at ALMA bands. Furthermore, withscattering included, we suggest that inclined optically thickdisks will look even fainter (Figure 2). This effect may explainthe very low temperature derived from the edge-on disk FlyingSaucer (Guilloteau et al. 2016).
Although the optically thick scattering disk scenario seemsto be promising for explaining several observations, there isevidence that the disks are not optically thick everywhere. Thefirst is that the rings beyond 40 au in the DSHARP sample canbe well fitted with Gaussian profiles along the radial direction,instead of flat-topped profiles (Dullemond et al. 2018). Becausethe distribution of dust trapped in turbulent disks with ringsshould follow a Gaussian profile, the intensity profile will havea flat top instead of a Gaussian profile if these rings areoptically thick at the ring center. The second line of evidenceagainst the optically thick rings is that CO emission comingfrom the back side of HD 163296 is dimmer at the location ofthe bright dust rings at 67 and 100 au (Isella et al. 2018). Thisdimming is due to dust extinction by the rings. Because the COemission does not disappear completely, the dust rings cannotbe optically thick. However, these two lines of evidence onlyapply to the rings at the outer disk beyond 40 au. This isactually consistent with our Figure 6, where even a Q=1 diskwill be optically thin beyond 50 au. The optically thickscattering disk scenario only applies to the inner disk within50 au. We need to carry out similar tests or use other methods(e.g., Harsono et al. 2018; Powell et al. 2017, 2019; Casassuset al. 2019) to study the optical depth and mass of the inner diskin future.One assumption in this work is that the disk is isothermal in
the vertical direction. This is not quite correct, as the dusty diskintercepts the stellar irradiation causing the temperatureinversion at the disk atmosphere (Calvet et al. 1991). On theother hand, large dust in protoplanetary disks settles to the diskmidplane (probed by radio observations), while small dust isstill suspended at the disk atmosphere (probed by near-infraredobservations). Small dust intercepts the stellar irradiation,which determines the disk temperature structure. Small dustradiates energy vertically toward the disk midplane to warm upthe large dust. Because large dust sits in the thermal bathgenerated by small dust, we expect that it should beapproximately isothermal. The MCRT simulations for suchdisk configuration will be presented in S. Zhang et al. (2019, inpreparation). Furthermore, the emission reduction argument inthe abstract and our preliminary simulations show that, if thedisk is optically thick but not isothermal, the emissionreduction still applies and is mainly determined by the dustscattering properties at τν∼1. Thus, if the disk that has largedust is optically thick but not isothermal, the emissionreduction probes the albedo of the τν∼1 surface.
4. Conclusion
ALMA protostar surveys have suggested that the dust (withsizes of cm) in Class II protostellar disks may not be enoughto explain the averaged solid mass in exoplanets, leading to thespeculation that a large fraction of dust mass has already beenconverted to planetesimals at the Class II stage. On the otherhand, the dust mass derivation from ALMA observations isbased on the assumption that protostellar disks are opticallythin at submm. This optically thin assumption seems to besupported by recent high angular resolution observations fromthe DSHARP ALMA survey where the measured opticaldepths of most DSHARP disks are less than 1.However, in this work, we point out that dust scattering is
important for the disk mass estimate, at least within the inner50 au. Using analytical theory, direct numerical simulations,and MCRT calculations, we have shown that dust scattering
11
The Astrophysical Journal Letters, 877:L18 (13pp), 2019 June 1 Zhu et al.

can reduce the emission from an optically thick region.Ignoring dust scattering can lead to an underestimate of thedisk optical depth, and an optically thick disk with dustscattering can be misidentified as an optically thin disk. Whenthe disk is more inclined, optically thick scattering makes thedisk look even fainter. When the disk is large (e.g., 100 au),most of dust mass is at the outer disk, which is optically thin at1.25 mm, so that 1.25 mm observations will only underestimatethe disk mass by a factor of ∼2 for these extended disks. Whenthe disk is compact (<30 au), ALMA 1.25 mm observationscan easily underestimate the real dust mass by a factor of 10.On the other hand, for VLA 7mm observations, the disk isoptically thin beyond several astronomical units. Therefore,VLA observations provide a much more accurate massestimate.
When the disk is optically thick, we can measure χ or τobs ifwe know the disk temperature and use them to constrain thedust albedo following the well-defined simple relationships(Equations (12)–(14)). The measured optical depth of 0.6 in theDSHARP disks can be naturally explained by optically thickdust with an albedo of ∼0.9 at 1.25 mm (Equation (14)). Usingthe DSHARP opacity, this albedo corresponds to a dustpopulation with the maximum grain size of 0.1–1 mm.
If we have multi-band observations, we can also use thespectral index α to constrain dust properties. In the opticallythick regime, the spectral index α depends on the albedo ωrather than κ, as in the optically thin regime. If ω increases withwavelength, α measured at this wavelength span will be largerthan 2, and vice versa. Using the DSHARP opacity, if theobserved α from ALMA is less than 2, the dust is smaller than∼300 μm, and vice versa. We also find that α is normallysmaller than 2.5 in the optically thick regime and larger than2.5 in the optically thin regime. Thus, we expect to see a jumpof α when the disk changes from optically thick to opticallythin along the radial direction. We discuss the possibility thatradial changes in α in TW Hya might be related to the changeof dust properties along the radial direction.
This optically thick disk scenario also provides an explana-tion for the known submm luminosity–disk size relationship,and may ease the strong tension between the dust sizeconstrained by polarization measurements and submm-cmcontinuum spectral index measurements. The small α andhigh polarization degree from submm observations could bedue to the fact that the disk is optically thick for theseobservations and dust at the τmm∼1 surface has a typical sizeof 0.1–1 mm with strong scattering. For VLA observations atlonger wavelengths, the disk is optically thin and the small αmeasured from these observations could imply the presence oflarge particles at the deeper layer or the disk midplane, which isa natural outcome of dust settling.
We suggest that dust in protoplanetary disks may be hiddenfrom ALMA observations at short millimeter wavelengths, andlonger wavelength observations (e.g., ngVLA and SKA) aredesired. Properly modeling dust continuum emission, includingdust scattering, is crucial for constraining disk structures.Optically thick disks with scattering also provide uniqueopportunities to study dust properties in protoplanetary disks.
Z.Z. thank the organizers of “Planet-Forming Disks, aworkshop to honor Antonella Natta” for organizing the greatworkshop, during which the 0.6t ~ problem was raised manytimes and the idea for this work came to mind. The Planet
Forming Disks workshop has received funding from theEuropean Union’s Horizon 2020 research and innovationprogramme under grant agreement No. 730562 [RadioNet],No. 743029 [EASY], from INAF-Arcetri and iALMA contractNo. 6041, DIGDEEP contract No. 706320. Z.Z. also thanksCarlos Carrasco-González, Anibal Sierra, Nuria Calvet, andLee Hartmann for comments on the initial draft. Z.Z.acknowledges Ian Rabago for proofreading the initial draft.Z.Z. also thanks Francois Ménard for interesting discussions onhighly inclined disks. Z.Z. acknowledges support from theNational Science Foundation under CAREER grant No. AST-1753168 and Sloan Research Fellowship. T.B. acknowledgesfunding from the European Research Council (ERC) under theEuropean Union’s Horizon 2020 research and innovationprogramme under grant agreement No.714769. C.P.D.acknowledges support by the German Science Foundation(DFG) Research Unit FOR2634, grants DU414/22-1 andDU414/23-1. S.A. and J.H. acknowledge funding supportfrom the National Aeronautics and Space Administration undergrant No.17-XRP17_2-0012 issued through the ExoplanetsResearch Program. J.H. acknowledges support from theNational Science Foundation Graduate Research Fellowshipunder grant No. DGE-1144152. L.P. acknowledges supportfrom CONICYT project Basal AFB-170002 and from FCFM/U. de Chile Fondo de Instalación Académica. Simulations arecarried out with the support from the Texas AdvancedComputing Center (TACC) at The University of Texas Austinthrough XSEDE grant TG-AST130002, and the NASA High-End Computing (HEC) Program through the NASA AdvancedSupercomputing (NAS) Division at Ames Research Center.
ORCID iDs
Zhaohuan Zhu https://orcid.org/0000-0003-3616-6822Shangjia Zhang https://orcid.org/0000-0002-8537-9114Yan-Fei Jiang https://orcid.org/0000-0002-2624-3399Akimasa Kataoka https://orcid.org/0000-0003-4562-4119Tilman Birnstiel https://orcid.org/0000-0002-1899-8783Cornelis P. Dullemond https://orcid.org/0000-0002-7078-5910Sean M. Andrews https://orcid.org/0000-0003-2253-2270Jane Huang https://orcid.org/0000-0001-6947-6072John M. Carpenter https://orcid.org/0000-0003-2251-0602Xue-Ning Bai https://orcid.org/0000-0001-6906-9549David J. Wilner https://orcid.org/0000-0003-1526-7587
References
ALMA Partnership, Brogan, C. L., Pérez, L. M., et al. 2015, ApJL, 808, L3Andrews, S. M., Huang, J., Pérez, L. M., et al. 2018a, ApJL, 869, L41Andrews, S. M., Rosenfeld, K. A., Kraus, A. L., & Wilner, D. J. 2013, ApJ,
771, 129Andrews, S. M., Terrell, M., Tripathi, A., et al. 2018b, ApJ, 865, 157Andrews, S. M., & Williams, J. P. 2005, ApJ, 631, 1134Andrews, S. M., Wilner, D. J., Hughes, A. M., Qi, C., & Dullemond, C. P.
2010, ApJ, 723, 1241Andrews, S. M., Wilner, D. J., Zhu, Z., et al. 2016, ApJL, 820, L40Ansdell, M., Williams, J. P., van der Marel, N., et al. 2016, ApJ, 828, 46Beckwith, S. V. W., Sargent, A. I., Chini, R. S., & Guesten, R. 1990, AJ,
99, 924Birnstiel, T., Dullemond, C. P., Zhu, Z., et al. 2018, ApJL, 869, L45Bohren, C. F., & Huffman, D. R. 1983, Absorption and Scattering of Light by
Small Particles (New York: Wiley)Calvet, N., Patino, A., Magris, G. C., & D’Alessio, P. 1991, ApJ, 380, 617Carrasco-González, C., Henning, T., Chandler, C. J., et al. 2016, ApJL,
821, L16Casassus, S., Pérez, S., Osses, A., & Marino, S. 2019, MNRAS, 486, L58
12
The Astrophysical Journal Letters, 877:L18 (13pp), 2019 June 1 Zhu et al.

Chiang, E., & Laughlin, G. 2013, MNRAS, 431, 3444Cieza, L. A., Ruíz-Rodríguez, D., Hales, A., et al. 2019, MNRAS, 482, 698D’Alessio, P., Calvet, N., & Hartmann, L. 2001, ApJ, 553, 321D’Alessio, P., Canto, J., Calvet, N., & Lizano, S. 1998, ApJ, 500, 411Dong, S., & Zhu, Z. 2013, ApJ, 778, 53Dullemond, C. P., Birnstiel, T., Huang, J., et al. 2018, ApJL, 869, L46Evans, M. G., Ilee, J. D., Hartquist, T. W., et al. 2017, MNRAS, 470, 1828Garufi, A., Benisty, M., Pinilla, P., et al. 2018, A&A, 620, A94Guilloteau, S., Piétu, V., Chapillon, E., et al. 2016, A&A, 586, L1Guzmán, V. V., Huang, J., Andrews, S. M., et al. 2018, ApJL, 869, L48Harsono, D., Bjerkeli, P., van der Wiel, M. H. D., et al. 2018, NatAs, 2, 646Hartmann, L., D’Alessio, P., Calvet, N., & Muzerolle, J. 2006, ApJ, 648, 484Huang, J., Andrews, S. M., Cleeves, L. I., et al. 2018a, ApJ, 852, 122Huang, J., Andrews, S. M., Dullemond, C. P., et al. 2018b, ApJL, 869, L42Isella, A., Huang, J., Andrews, S. M., et al. 2018, ApJL, 869, L49Ishimaru, A. 1978, Wave propagation and scattering in random media. Volume
1—Single scattering and transport theory (New York: Academic Press)Jiang, Y.-F., Stone, J. M., & Davis, S. W. 2014, ApJS, 213, 7Kataoka, A., Muto, T., Momose, M., et al. 2015, ApJ, 809, 78Kataoka, A., Muto, T., Momose, M., Tsukagoshi, T., & Dullemond, C. P.
2016, ApJ, 820, 54Kataoka, A., Tsukagoshi, T., Pohl, A., et al. 2017, ApJL, 844, L5Kim, S., Nomura, H., Tsukagoshi, T., Kawabe, R., & Muto, T. 2019, ApJ,
872, 179Miyake, K., & Nakagawa, Y. 1993, Icar, 106, 20
Mulders, G. D., Pascucci, I., & Apai, D. 2015, ApJ, 814, 130Murphy, E. J., Bolatto, A., Chatterjee, S., et al. 2018, in ASP Conf. Ser. 517,
Science with a Next Generation Very Large Array, ed. E. Murphy (SanFrancisco, CA: ASP), 3
Najita, J. R., & Kenyon, S. J. 2014, MNRAS, 445, 3315Pascucci, I., Testi, L., Herczeg, G. J., et al. 2016, ApJ, 831, 125Pérez, L. M., Carpenter, J. M., Chandler, C. J., et al. 2012, ApJL, 760, L17Pérez, L. M., Chandler, C. J., Isella, A., et al. 2015, ApJ, 813, 41Pinte, C., Dent, W. R. F., Ménard, F., et al. 2016, ApJ, 816, 25Powell, D., Murray-Clay, R, Pérez, L. M., et al. 2019, ApJ, submitted
(arXiv:1905.03252)Powell, D., Murray-Clay, R., & Schlichting, H. E. 2017, ApJ, 840, 93Ricci, L., Trotta, F., Testi, L., et al. 2012, A&A, 540, A6Rybicki, G. B., & Lightman, A. P. 1979, Radiative Processes in Astrophysics
(New York: Wiley-Interscience)Sierra, A., Lizano, S., & Barge, P. 2017, ApJ, 850, 115Tazzari, M., Testi, L., Ercolano, B., et al. 2016, A&A, 588, A53Testi, L., Perez, L., Jimenez-Serra, I., et al. 2015, in Advancing Astrophysics
with the Square Kilometre Array (AASKA14) (Trieste: POS), 117Tychoniec, Ł., Tobin, J. J., Karska, A., et al. 2018, ApJS, 238, 19Tripathi, A., Andrews, S. M., Birnstiel, T., & Wilner, D. J. 2017, ApJ, 845, 44Tsukagoshi, T., Nomura, H., Muto, T., et al. 2016, ApJL, 829, L35Yang, H., Li, Z.-Y., Looney, L., & Stephens, I. 2016a, MNRAS, 456, 2794Yang, H., Li, Z.-Y., Looney, L. W., et al. 2016b, MNRAS, 460, 4109Zhang, S., Zhu, Z., Huang, J., et al. 2018, ApJL, 869, L47
13
The Astrophysical Journal Letters, 877:L18 (13pp), 2019 June 1 Zhu et al.