one hundred years of poverty and policy - sticerd
TRANSCRIPT
One hundred years ofpoverty and policy

This publication can be provided in alternative
formats, such as large print, Braille, audiotape and
on disk. Please contact: Communications
Department, Joseph Rowntree Foundation, The
Homestead, 40 Water End, York YO30 6WP. Tel:
01904 615905. Email: [email protected]

One hundred years ofpoverty and policy
Howard Glennerster, John Hills, David Piachaud and Jo Webb

The Joseph Rowntree Foundation has supported this project as part of itsprogramme of research and innovative development projects, which it hopes willbe of value to policy makers, practitioners and service users. The facts presentedand views expressed in this report are, however, those of the authors and notnecessarily those of the Foundation.
Joseph Rowntree FoundationThe Homestead40 Water EndYork YO30 6WPWebsite: www.jrf.org.uk
© Howard Glennerster, John Hills, David Piachaud and Jo Webb 2004
First published 2004 by the Joseph Rowntree Foundation
All rights reserved. Reproduction of this report by photocopying or electronicmeans for non-commercial purposes is permitted. Otherwise, no part of this reportmay be reproduced, adapted, stored in a retrieval system or transmitted by anymeans, electronic, mechanical, photocopying, or otherwise without the priorwritten permission of the Joseph Rowntree Foundation.
ISBN 1 85935 221 9 (paperback)1 85935 222 7 (pdf: available at www.jrf.org.uk)
A CIP catalogue record for this report is available from the British Library.
Designed by Adkins Design (www.adkinsdesign.co.uk)Printed by Fretwells
Further copies of this report, or any other JRF publication, can be obtained eitherfrom the JRF website (www.jrf.org.uk/bookshop/) or from our distributor, YorkPublishing Services, 64 Hallfield Road, York YO31 7ZQ (Tel: 01904 430033).
Photo credits: Pages 16, 17, 30, 66, 72: Mary Evans Picture Library; 20: Museum of London; 45: Joseph Rowntree Foundation; 70: National Archives; 75, 76, 78, 80: Corbis/Hulton-Deutsch Collection; 86: popperfoto.com; 92: Owen Franken/Corbis; 96: Sean Aidan, Eye Ubiquitous/Corbis; 98: Keith Saunders/ArenaPAL.
Cover: Joseph Rowntree Foundation (top), Alamy Images (bottom)

5
ContentsList of figures and tables 6
The Seebohm Rowntree Studentship Fund 8
1 Introduction 9
Part I: Poverty over the last century 132 The context for Rowntree’s contribution 15
Howard Glennerster
3 Changes in poverty 29David Piachaud and Jo Webb
4 Why has poverty changed? 48David Piachaud and Jo Webb
Part II: A century of policy responses 615 Poverty policy from 1900 to the 1970s 63
Howard Glennerster
6 The last quarter century: From New Right to New Labour 92John Hills
Part III: Looking forward 1337 Policy challenges and dilemmas for the next 20 years 135
John Hills
Part IV: Conclusions 1618 Poverty and progress for the next generation? 163
Notes 171
References 177
6
Figures1 Poverty lines for a couple and three children aged
3, 6 and 8, at 2000 prices, 1899–1950 362 Benefit levels and half mean income for a couple and
three children aged 3, 6 and 8, at 2000 prices, 1948–2000 38
3 Poverty lines after housing costs, as a percentage of national personal disposable income per capita, 1899–2000 40
4 Poverty rates for the early studies, based on the same poverty line in terms of personal disposableincome per capita as York 1899 44
5 Proportion of the population below 50 per cent meanincome, 1961–99 46
6 Proportion of children living in households with incomes below 50 per cent of mean income, before housing costs, 1961–99 46
7 Poverty and income level by age group 528 Public spending on education, health, and social
security, 1921–2001 1009 Social spending in the UK, 1978/79 to 2002/03 10210 Social security benefits, 1948/49 to 2003/04 10411 Benefits levels in real and relative terms, 1971-2002 10812 Net incomes under 1997/98 and 2003/04 tax and benefit
systems, 2003/04 prices 11513 Effective marginal tax rates under 1997/98 and 2003/04
tax and benefit systems 11714 State support: single person retiring in 1978, 1998
and 2038 12015 Real income growth by quintile group 12216 Population with below half average income, 1961–2001 124
Figures and tables

Figures and tables
7
17 Distributional impact of changes in tax and benefit system, 1997 to 2004/05 (projected) 126
18 Child poverty in the European Union, 1997 and 2001 13719 Change in numbers in poverty between 1998 and
2001 measured against constant real and relative income lines 138
20 Lone parenthood and employment in the late 1990s/early 2000s 140
21 Social assistance entitlements as a proportion of equivalised median income: Sweden and Britain 1995, and Germany 1994 142
22 International trends in wage differentials 14323 Four forms of intervention 166
Tables1 Poverty lines as a proportion of consumers’
expenditure per capita 392 Causes of poverty, 1899 and 2001/02 493 Poverty gaps as a percentage of the poverty line 504 Age distribution of population, York 535 Economic activity and occupations, York, 1901
and 2001 556 Distribution of expenditure 567 Access to consumer durables, bottom income
quintile group, 2001/02 588 The growth of social insurance 799 Increases in Child Benefit, Income Support and net
income after housing costs, April 1991 to April 2003 11110 Trends in poverty against relative and absolute
income thresholds 12511 International comparison of relative poverty rates,
2000 or late 1990s 13612 Perceptions of trends in poverty in Britain over
past ten years, 1986–2000 147 13 Attitudes towards redistribution and welfare
benefits, 1987–2002 148

8
The Seebohm RowntreeStudentship FundSincere thanks go to the Seebohm Rowntree Studentship Fundfor substantial support for the production of this publication.Seebohm Rowntree set aside funds in 1943 to ‘help personswho are studying or engaged in research into the causes ofpoverty and how these can be removed’, and 60 years later thischarity transferred its remaining assets to the Joseph RowntreeFoundation specifically to support this publication.
The Foundation, and the authors of this volume, pay tributeto the pathbreaking work of Seebohm Rowntree in his study ofpoverty throughout the first half of the twentieth century. Theyalso place on record their appreciation, to Philip Rowntree,Seebohm Rowntree’s son, to Gordon Thorpe, Secretary to theSeebohm Rowntree Studentship Fund for over 40 years, toAndrew Rowntree, Seebohm’s grandson, and to Frank Field MP,for their stewardship of this fund.
We are delighted that the name of Seebohm Rowntree canbe associated with the publication of this book during thecentenary year of his father’s creation of what is today theJoseph Rowntree Foundation.
Joseph Rowntree Charitable TrustThe Joseph Rowntree Foundation and the authors of thisvolume would like to express their thanks to the JosephRowntree Charitable Trust for permission to reproduce materialfrom the works of B.S. Rowntree.
9
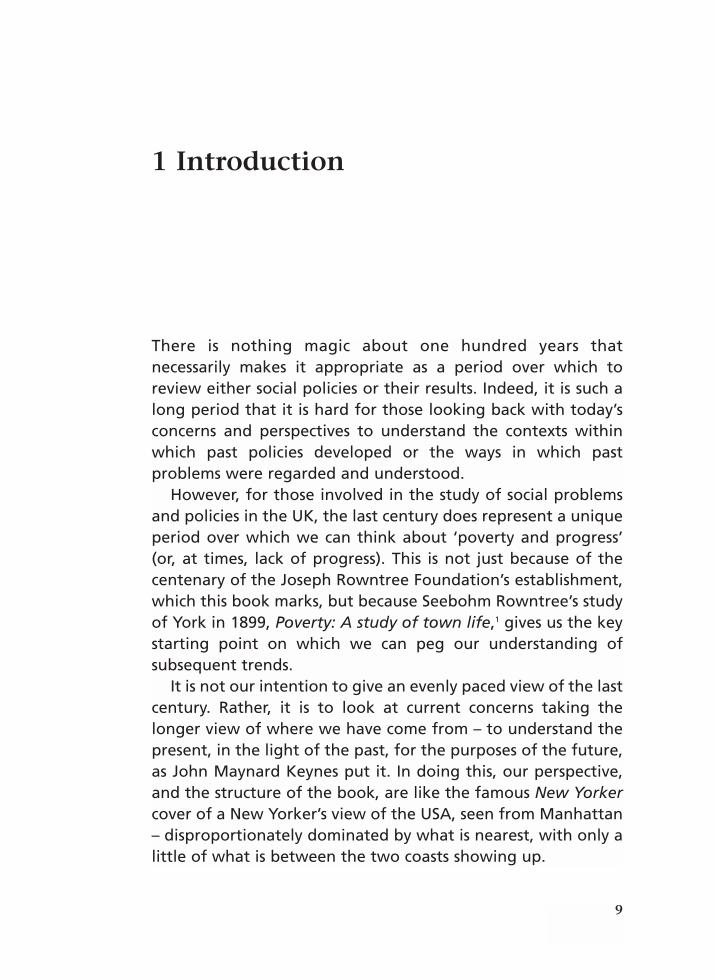
There is nothing magic about one hundred years thatnecessarily makes it appropriate as a period over which toreview either social policies or their results. Indeed, it is such along period that it is hard for those looking back with today’sconcerns and perspectives to understand the contexts withinwhich past policies developed or the ways in which pastproblems were regarded and understood.
However, for those involved in the study of social problemsand policies in the UK, the last century does represent a uniqueperiod over which we can think about ‘poverty and progress’(or, at times, lack of progress). This is not just because of thecentenary of the Joseph Rowntree Foundation’s establishment,which this book marks, but because Seebohm Rowntree’s studyof York in 1899, Poverty: A study of town life,1 gives us the keystarting point on which we can peg our understanding ofsubsequent trends.
It is not our intention to give an evenly paced view of the lastcentury. Rather, it is to look at current concerns taking thelonger view of where we have come from – to understand thepresent, in the light of the past, for the purposes of the future,as John Maynard Keynes put it. In doing this, our perspective,and the structure of the book, are like the famous New Yorkercover of a New Yorker’s view of the USA, seen from Manhattan– disproportionately dominated by what is nearest, with only alittle of what is between the two coasts showing up.
1 Introduction

One hundred years of poverty and policy
10
The whole idea of what poverty is and how to measure it haschanged a great deal in the past century, although many of thebasic issues remain remarkably familiar. We have not attemptedto trace this debate in detail, not least because it has been doneby others, notably Ruth Lister (2004) in her recent book.However, social scientists’ work in measuring andconceptualising poverty has had an impact on policy, and wediscuss this at various stages in our account.
In chapter 2, Howard Glennerster sets out the context withinwhich Rowntree carried out his study with the earlierdevelopment of empirical investigation by Charles Booth andothers, and discusses some of Rowntree’s lasting insights.
In chapter 3, David Piachaud and Jo Webb use the evidencefrom Rowntree’s 1899 study of York to try to understand howwhat we mean by ‘poverty’ has changed over the last century.What does Rowntree’s poverty line mean in today’s terms? Howdo the causes of poverty a century ago compare with its causestoday, and what are the key social and economic changes thathave led to such differences? In chapter 4 they use evidence notjust from Rowntree’s three studies of York in 1899, 1936 and1950, but from a series of other studies both before and afterthe Second World War, to examine the way in which what wasseen as an appropriate ‘poverty line’ changed over thetwentieth century, and what this tells us about the changingextent of poverty over the period.2
The second part of the book traces the evolution of policytowards poverty over the century. In chapter 5, HowardGlennerster starts by describing the roots of policy in the poorlaw tradition, and developments following Rowntree’s andBooth’s studies. He takes the story from the reforms of LloydGeorge, through the post-war reforms associated with (but notalways following from) the 1942 Beveridge Report, and theoptimism generated by Rowntree’s final study to the‘rediscovery of poverty’ in the 1960s, and what some havedescribed as the ‘end of consensus’ in the 1970s.
In chapter 6, John Hills looks at much more recent
Introduction
11
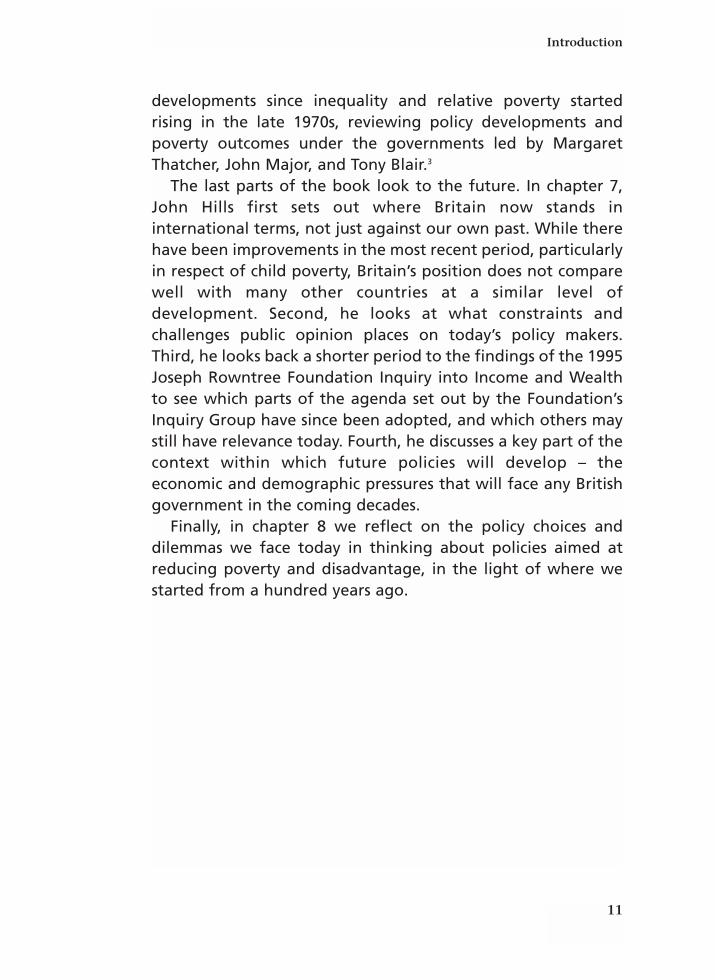
developments since inequality and relative poverty startedrising in the late 1970s, reviewing policy developments andpoverty outcomes under the governments led by MargaretThatcher, John Major, and Tony Blair.3
The last parts of the book look to the future. In chapter 7,John Hills first sets out where Britain now stands ininternational terms, not just against our own past. While therehave been improvements in the most recent period, particularlyin respect of child poverty, Britain’s position does not comparewell with many other countries at a similar level ofdevelopment. Second, he looks at what constraints andchallenges public opinion places on today’s policy makers.Third, he looks back a shorter period to the findings of the 1995Joseph Rowntree Foundation Inquiry into Income and Wealthto see which parts of the agenda set out by the Foundation’sInquiry Group have since been adopted, and which others maystill have relevance today. Fourth, he discusses a key part of thecontext within which future policies will develop – theeconomic and demographic pressures that will face any Britishgovernment in the coming decades.
Finally, in chapter 8 we reflect on the policy choices anddilemmas we face today in thinking about policies aimed atreducing poverty and disadvantage, in the light of where westarted from a hundred years ago.


Part IPoverty over the last century


15
As two American economists have recently shown, the verydifferent approaches societies have taken to fighting povertylie deep in institutional history, rather than in currenteconomics (Alesina and Glaeser, 2004). This is well illustrated inBritain’s distinctive history. The moral and political dilemmasposed by the poor had troubled politicians, socialcommentators and theologians from the Middle Ages andindeed before. The coming of modern ‘political economy’ anddemography at the end of the eighteenth century, mostnotably in the writings of Adam Smith and Thomas Malthus,added a tougher and more ruthless logic to the debate. Povertyand starvation might be necessary for population control; ‘thescantiness of subsistence can set limits to the furthermultiplication of the human species,’ as Adam Smith put it(1776, p.182).
The need to contain poor relief1 and how it should be donewas a recurrent theme of public debate through the nineteenthcentury (see chapter 5). By the century’s end, however, it wasbecoming clear to many that the existing order was not able tocope with the demands placed on it by the new internationalindustrial economy in which the United Kingdom played acentral part. Many argued that there was a hard core of povertythat was self imposed through wilful indolence and drink.Neither Charles Booth nor Seebohm Rowntree disagreed. Butthere was also an appreciation that there were growing
2 The context for Rowntree’scontributionHoward Glennerster

One hundred years of poverty and policy
16
numbers of people whose poverty could not be blamed onindividual failings. The prolonged ‘unemployment’ of the 1880s– a new term at that time (Harris, 1972) – or the Lancashirecotton famine, could not be blamed on a few feckless men andwomen. Fecklessness hardly went in cycles. The Poor Law wasbecoming a mainline provider of care to the growingpopulation of elderly women, and of financial support towidows (though eligibility varied widely) and to the sick. It wasalso a major provider of education and care for poor children.
The Poor Law is at the present time only to a small extentconcerned with the man who is able-bodied. The varioussections of the non-able-bodied – the children, the sick,the mentally defective, and the aged and infirm – make uptoday nine-tenths of the persons relieved by theDestitution Authorities. (Minority Report of the Royal Commission on the PoorLaws and the Relief of Distress, 1905–9, p. 1)
Homeless people congregating under a bridge in London, 1870, from the bookLondon, a Pilgrimage by Gustav Doré. People both pitied and feared the poor in themid nineteenth century.

17
Appreciating that the old institutions were simply not designedto cope with the new situation took a long time. It was a viewvigorously opposed by those in the Local Government Boardand the philanthropic Charity Organisation Society whoseremedy was to tighten up the way the Poor Law wasadministered. In 1869 the Poor Law guardians were urged toreturn to the principles of 1834 and relieve ‘able-bodiedpaupers’ only in the workhouse. But the condition of the poor,notably in London, was increasingly becoming both a moralquestion and a fearful one. The violent demonstrations of themid 1880s created a fertile ground for descriptions andexplanations of what was happening. Poverty in London hadbeen the subject of careful descriptive writing by HenryMayhew (1861–2) and by others. But it was a powerfulpamphlet published by the Congregational Union, The bitter
‘The crippled street bird-seller’, an engraving fromHenry Mayhew’s influential work London labourand the London poor (1861–2). Mayhew’s workwas one of several bringing the poor to theattention of nineteenth century political thinking.
The context for Rowntree’s contribution

One hundred years of poverty and policy
18
cry of outcast London: An inquiry into the condition of theabject poor (1883), which sparked widespread attention in themiddle class magazines of the time. The working poor werebeginning to have their say in an organised way through tradeunions. It is at this time that a new social science of povertymeasurement begins to play a decisive part in shaping people’sunderstanding and ultimately policy.
Lifting the curtain: The contribution of nineteenth century social scienceThe Bitter cry was an emotional pen portrait. Was it right? Orwas it an overblown and unhelpful description that would leadsober reformers in the wrong direction? That is what CharlesBooth initially thought.
East London lay hidden behind a curtain on which werepainted terrible pictures: starving children, sufferingwomen, overworked men; monsters and demons ofinhumanity; giants of disease and despair. Did these picturestruly represent what lay behind, or did they bear to thefacts a relation similar to that which the pictures outside abooth at some country fair bear to the performance orshow within? This curtain we have tried to lift. (Booth, quoted in Abbott, 1917)
His painstaking house by house survey in East London was firstreported to meetings of the Royal Statistical Society. It wasextended to most of inner London. The accounts of theeconomic life of each area, the temporary nature of muchemployment and the low wages even regular employmentcould generate presented a convincing and much publicisedpicture. It was not just an attempt to measure the numericalextent of poverty but a mapping of the gradations of humaninequality. It was grounded in the local economy of small areasof London. The notion of an inner core of poverty andmovements in and out of such areas, which urban sociologists

19
came to refine, are first charted here (Booth, 1888, 1891,1892–7).
Charles Booth’s line of povertyBooth’s most lasting contribution was the means he adopted toprovide a definitive answer to the question: were these merelyexaggerated journalistic accounts of poverty and distress orwere they grounded in solid evidence? In that sense he can beseen as the father of modern poverty study. Booth himself wasvery sceptical of the claims being made. He changed his mind.The evidence amassed by his investigators convinced him, andhis audience at the Royal Statistical Society was not surprised. The survey method he used was by no means modern. He reliedon information supplied by and judgements made by localinvestigators such as the School Board visitors in East London.They went to every family with children of school age. It wasassumed that the other half of the working class populationwas in a similar state. Other volunteers supplemented the work,especially outside the East End. These were not questionnairesfilled in or responded to by heads of household. But hisassistants were asked to grade their households into what wereessentially social groups.
He was not very forthcoming about how he reached the ‘lineof poverty’ used by his investigators.
”By the word poor I mean to describe those who have afairly regular though bare income, such as 18s to 21s perweek for a moderate family, and by ‘very poor’ those whofall below this standard, whether from chronic irregularityof work, sickness, or a large number of young children.” (Booth’s account of his methods given at a meeting of theRoyal Statistical Society, May 1887, Journal of the RoyalStatistical Society, June 1887; Simey and Simey, 1960, p. 184)
Where on earth did this income level come from? It was muchhigher than the rates of outdoor relief that the Select
The context for Rowntree’s contribution
One hundred years of poverty and policy
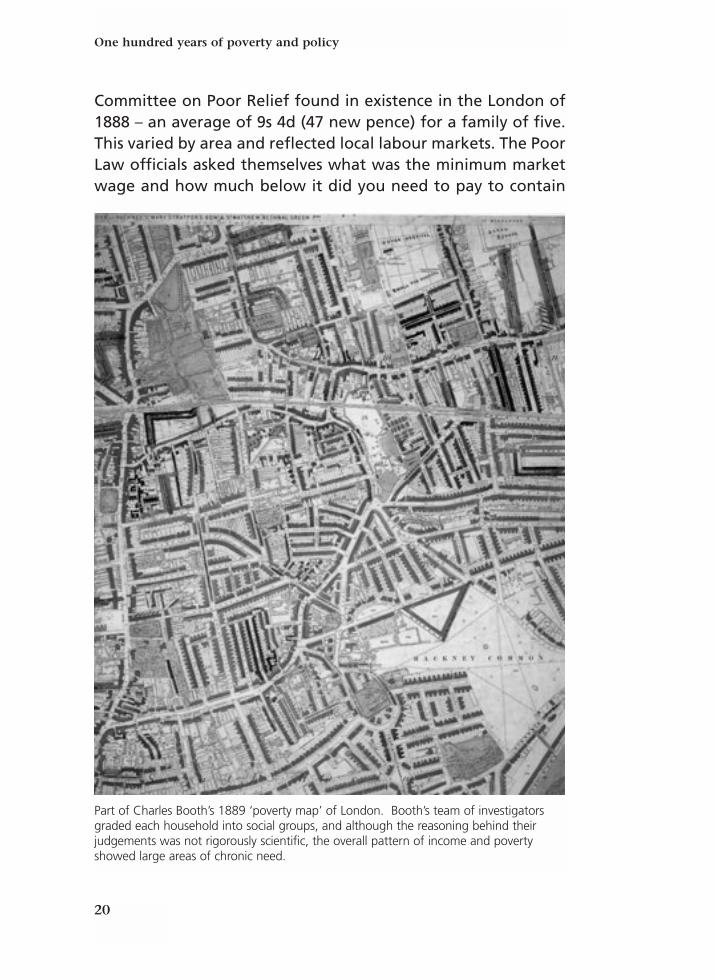
20
Committee on Poor Relief found in existence in the London of1888 – an average of 9s 4d (47 new pence) for a family of five.This varied by area and reflected local labour markets. The PoorLaw officials asked themselves what was the minimum marketwage and how much below it did you need to pay to contain
Part of Charles Booth’s 1889 ‘poverty map’ of London. Booth’s team of investigatorsgraded each household into social groups, and although the reasoning behind theirjudgements was not rigorously scientific, the overall pattern of income and povertyshowed large areas of chronic need.
21
the number of paupers? – a test of destitution. What Booth didwas to set a rough income level that reflected a judgementabout its social acceptability. This was a decisive contribution.
But whose judgement? Recent research suggests it was morefirmly grounded than many critics have implied (Gillie, 1996).The source may well have been the fee remission scales used bythe London School Board in Tower Hamlets at the time Boothwas studying the area. Under the 1870 Education Act it waspossible for local boards to make attendance at schoolcompulsory. They were also required to charge fees. That poseddifficulties. How far was it reasonable to reduce poor families’incomes? Was there a floor below which it would beirresponsible to do so? Boards in different cities reached theirown conclusions about fee remission and kept their yardstickssecret. So did the Tower Hamlets divisional office. But officershad precise guidance about the income at which a prima faciecase could be made that it would be socially unacceptable andprejudicial to a child to reduce the family income below thatpoint. Guidance took into account the size of the family andthe level of rent paid. It had all the characteristics of modernincome support minima and the result was a net income verynear to the one Booth chose. He would not have been able tocite this as his source as the Education Board insisted such ascale be kept secret. If this intriguing possibility is correct, thefirst statistical/social judgement on income adequacy used byBooth may well have been based on a real life judgement bythese school board members. But it was not one that could bedebated or challenged. This was Seebohm Rowntree’s criticalcontribution.
Rowntree’s poverty lineSeebohm’s father, Joseph Rowntree, had studied socialquestions, including ‘Pauperism’, before Seebohm was born.Seebohm was powerfully affected by a visit to the poorest partsof Newcastle. He discovered Booth’s work and wondered if hisfindings would hold outside London. ‘Why not investigate
The context for Rowntree’s contribution

One hundred years of poverty and policy
22
York?’ (Briggs, 1961, p. 17). The methods he used were, at onelevel, similar to Booth’s. House to house visits produced sheetsof notes about the accommodation, the numbers in the familyand their working occupations and personal remarks about thestandard of life, cleanliness and respectability of theinhabitants. The household’s broad band of income was mostlyestimated from knowledge of the worker’s job and the wagespaid for that job obtained from the employer. Sometimes theinvestigator had to rely on the families’ own informationchecked with other observations or a second visit. In additionthe investigator was asked to judge from observation,questioning neighbours or members of the family whether, intheir view, the family was living in ‘obvious want and squalor’.It was this personal judgemental approach that led to the oftenquoted conclusion that 28 per cent of the total population ofYork were living in such a state. That compared with the 31 percent Booth had judged to be in poverty in London. Boothagreed that Rowntree’s figures were comparable to his own(Rowntree, 1901; 2001, p. 300).
Whether they really were is a moot point. Helen Bosanquet,of the Charity Organisation Society and member of the RoyalCommission on the Poor Laws, questioned why Rowntree’ssurvey of a relatively prosperous market town like York shouldproduce the same result as Booth in the depressed East End ofLondon (Bosanquet, 1903; for an account of contemporarycritics see Bowpitt, 2000).
What was new, and was to have a long term impact onpoverty measurement, was his attempt to measure the causesof poverty. Rowntree distinguished those whose income was solow that even if they followed complete sobriety and totalpurchasing efficiency they would not be able to live at a levelof ‘physical efficiency’.
His attempts here have often been misunderstood. He knewthat any figure was likely to be attacked, as it was to be by theCharity Organisation Society and others. So he sought a harder,he hoped unchallengeable, measure. The adviser he turned to

23
was an American who was working for the US Department ofAgriculture, Professor W. O. Atwater, whose specialist area washuman nutrition and energy, backed up by two nutritionistsfrom Scotland. How much food of what kind did a workingman need to function as an effective worker? That dependedon the type of work he was doing, Atwater argued, and heproduced a range of minimum diets from that needed byworkers who used little physical exercise, through moderate toactive muscular work. The moderate standard was chosen.
Then Rowntree switched to actual food budgets. Here hetook the rations set out by the Local Government Boardrecommended for those in workhouses, and the cheapest oneat that. They seemed to produce a diet consistent with thenutritional level proposed by Atwater for men. The rations forwomen and children could be roughly adopted and turned intoa household budget by using prices available to the workingclass in York and checked against actual working class diets inYork and those of American workers. He concluded that ‘thelabouring classes on whom the bulk of the muscular work falls,are seriously underfed’ (1901, p. 259).
What Rowntree was doing was essentially to throw down thegauntlet and challenge his critics: ‘Are you seriously suggestingthat you can expect families to live on less than this?’ It was thisharsher, apparently more ‘scientific’, measure he called ‘primarypoverty’.
The difference between the judgemental levels of ‘squalidliving’ and his primary poverty level formed the controversialgap he called ‘secondary poverty’. These were ‘families whosetotal earnings would be sufficient for the maintenance ofmerely physical efficiency were it not that some portion of it isabsorbed by other expenditure, either useful or wasteful’(1901, p. 115; emphasis in the original). Only 10 per cent of theYork population were living in primary poverty, or 15 per centof the wage earning class.
The physical efficiency claim that underpinned the primarypoverty idea had an immediate appeal because of the growing
The context for Rowntree’s contribution

One hundred years of poverty and policy
24
Box 1 The life cycle of poverty
Rowntree described a life cycle of poverty as follows:
The life of a labourer is marked by five alternatingperiods of want and comparative plenty. During earlychildhood, unless his father is a skilled worker, heprobably will be in poverty; this will last until he, orsome of his brothers or sisters, begin to earn money andthus augment their father’s wage sufficiently to raisethe family above the poverty line. Then follows theperiod during which he is earning money and livingunder his parent’s roof; for some portion of this periodhe will be earning more money than is required forlodging, food, and clothes. This is his chance to savemoney. If he has saved enough to pay for furnishing acottage, this period of comparative prosperity maycontinue after marriage until he has two or threechildren, when poverty will again overtake him. Thisperiod of poverty will last perhaps for ten years, i.e.until the first child is fourteen years old and begins toearn wages; but if there are more than three children itmay last longer. While the children are earning, andbefore they leave home to marry, the man enjoysanother period of prosperity – possibly, however, only tosink back again into poverty when his children havemarried and left him, and he himself is too old to work,for his income has never permitted his saving enoughfor him and his wife to live upon for more than a veryshort time.
A labourer is thus in poverty, and thereforeunderfed – (a) In childhood – when his constitution is being built
up.(b) In early middle life – when he should be in his prime.(c) In old age.

25
debate in the late 1890s about ‘national efficiency’. Those onsuch wages could not be fully productive workers was theimplication. Veit-Wilson (1986) argues that it is the visible lifestyle of want and squalor that was really at the centre ofRowntree’s moral concern. No one could really be expected tolive on his primary poverty income in real social life. Socialpressures, to drink in the local pub, to buy presents for thechildren, to be a normal social being especially in adversity,required a higher budget. This was the burden of Townsend’slater critique (1954, 1962, 1979).
That may be so, but what gave Rowntree his supposedauthority was the emphasis he placed on diet and householdbudgets, which take up much of the book and its appendices. Itwas this idea that appealed to later investigators, as Veit-Wilson (1994) points out, and they made studies of otherEnglish cities, to be discussed in the next chapter.
Rowntree himself developed a more generous measure in his‘human needs of labour’ study (1918), as we shall see. And bythe time of his second survey of York in 1936 (Rowntree, 1941),Rowntree had abandoned the idea of secondary poverty:
In this survey I have made no attempt to measure the
The context for Rowntree’s contribution
(Box 1 continued)Rowntree’s picture of poverty over the life cycle
Source: Rowntree (1901), p.137.
Age 0 5 10 15 20 25 30 35 40 45 50 55 60 65 70
“Primary” poverty line
MarriesChildren begin
to earn{ { {Children marry& leave home
{Labourerpast work

One hundred years of poverty and policy
26
amount of ‘secondary’ poverty by direct observation, partlybecause the methods of doing this adopted in 1899 appearto me now as being too rough to give reliable results, andalso because even had I done so the results would not haverendered possible a comparison with 1899 for ideas of whatconstitutes ‘obvious want and squalor’ have changedprofoundly since then ... the only figures that are absolutelycomparable are those for primary poverty. (1941, p. 461)
Whatever Rowntree’s original intentions then, the idea ofpoverty measures based on diet and physical efficiency hadtaken on a life of its own.
A crucial insight: The life cycle of povertyWhat was equally important for future poverty study wasRowntree’s attempt to unravel the causes of poverty. Hedemonstrated that the rewards the labour market generated innormal times were ill adapted to meet the basic needs of familylife for many of the working population, notably duringchildrearing and widowhood, sickness and old age. Observingfrom his returns the circumstances of families in poverty heformulated his life cycle of poverty theory, going on toelaborate it later in the The human needs of labour (Rowntree,1918) (see box 1, pages 24–25).
Wages, he argued, derived from the interaction of supplyand demand for particular skills. There was no reason why theyshould take account of the fluctuating income needs of familiesover their life cycle especially the coming of children or thevarying size of family. The significant activity of friendlysocieties, Rowntree noted, helped to explain the low level ofprimary poverty experienced from sickness and old age. Theeconomy was prospering at the top of the economic cycle. Thelevel of wages relative to the needs of a family with severalchildren was simply too low to meet the most basic nutritionalneeds of many families.

27
Women’s contributionThe attention Booth and Rowntree’s work has attracted hastended to obscure important research done at the time bywomen’s groups, such as the Fabian Women’s Group and otherswho were involved in the Suffragette Movement. Much of theirwork was qualitative and it explored the meaning andexperience of poverty for individual family members andnotably women. It was influential because it gave an accessibleparallel account to that of Rowntree. It provided accounts ofthe way in which women struggled to cope on below povertywages. It also raised issues about the distribution of incomewithin families that feminists were to rediscover in the 1980s.
An example was Mrs Pember Reeves’ (1914) Fabianpamphlet, Family Life on a Pound a Week. It set out to answerthe question ‘How does a Lambeth working man’s wife withfour children manage on a pound a week?’ The answer differednot least because the dietary (and other!) demands of menvaried and what was left determined what was available forthe children’s and the wife’s needs. This was the era of the malebreadwinner family but many women were also single and hadfamily responsibilities of various kinds – more, these studiesfound, than Rowntree had claimed. It was an era of significantwidowhood. Poverty has not become feminised – it always was(Lewis and Piachaud, 1992).
In short, new social science evidence was posing an alternative tothe traditional view of poverty that it was the result of personalfailing and could be countered only by personal change whichrequired the absence of easy state poor relief. Explanations weare familiar with today – unemployment generated by economiccycles, the changing needs of families over their life cycle and therigidity of wages compared to changing family needs over a lifetime – were already formulated. So, too, were the distinctiveneeds of the sick, the old and those with long term disabilitieswho could not be blamed for their situation. Social scientists andactuarial statisticians were coming to see that individuals and
The context for Rowntree’s contribution

One hundred years of poverty and policy
28
families faced a range of economy-wide risks that it was verydifficult for them to insure against privately or collectively inwork-based or local self help societies. Some kinds ofemployment or even location made the risks of ill health difficultto insure against in small local or occupation-basedorganisations. One way to see the history of the next half centuryis the dawning realisation that there were fundamental marketand self help failures that required some kind of state action tocorrect the causes of poverty. Incomes were too low and insecurefor many to save enough for their own retirement. Those mostprone to ill health were least likely to be able to sustain sick clubsor private insurance without support. The ‘risk pool’ had to bewidened if families’ risks of poverty were to be minimised(Johnson, 1996). Economy-wide solutions had to be found forunemployment. Moreover, the scale and depth of each of thesegroups’ risks were to change through the coming century.Increasingly the politics of the twentieth century would becomeconcerned with the question – who should pay the costs ofsharing such risks (Baldwin, 1990)? Should it be the wholecommunity, the rich or only the working class? We trace threadsof that story in part 2.
In the following chapters, however, we look at how SeebohmRowntree’s legacy of local poverty studies was continued up tothe Second World War and how the scale of poverty ondifferent measures changed over the century. We use theanalysis of the causes of poverty pioneered by SeebohmRowntree to examine how far those causes changed.

29
Rowntree’s 1899 study provides a baseline for considering howpoverty has changed over the twentieth century. This chapterreviews the main studies of poverty published in the twentiethcentury and compares Rowntree’s first study based on his surveyof York in 1899 with evidence about poverty in Britain at thestart of the twenty-first century. In the next section thesestudies are described and then the chapter examines how thepoverty lines or standards used in these studies compare andhow the extent of poverty has changed. In the next chapter thechanging causes of poverty are analysed. Examining changes inpoverty is purely descriptive and historical unless it illuminatesunderstanding of why changes occurred: some the main socialand economic changes that occurred over the century areconsidered and their impact on poverty is discussed.
Poverty studiesSeebohm Rowntree’s Poverty: A study of town life was based onYork, the home of Rowntree and his family’s chocolate factory.He wrote that ‘My object in undertaking the investigation . . .was, if possible, to throw some light upon the conditions whichgovern the life of the wage-earning classes in provincial towns,and especially upon the problem of poverty’ (1901, p. vii).Rowntree is best remembered for developing and formalisingthe concept of the poverty line, collecting details about theincome of each household, rather than just making rough
3 Changes in poverty David Piachaud and Jo Webb

One hundred years of poverty and policy
30
guesses, making a distinction between what he called ‘primary’and ‘secondary’ poverty, and the concept of poverty over thelife cycle, as discussed in chapter 2.
Subsequently other investigators followed in Rowntree’sfootsteps. In 1903 a survey which seems largely to have beenforgotten was carried out by Mann (1905). It is interesting sinceit looked at a rural area, a village in Bedfordshire, whereasalmost all the other early surveys looked at towns.
The next landmark in poverty studies was provided byBowley and Burnett-Hurst (1915, 1920), published under thetitle Livelihood and poverty. The study covered five towns(Reading, Northampton, Warrington, Stanley and Bolton) andwas carried out between 1912 and 1914. They followedRowntree’s broad approach but Bowley, a trained statistician atthe London School of Economics, pioneered the use of randomsampling, with far-reaching consequences. Abrams observedthat surveys ‘were no longer dependent on the munificence ofmillionaire philanthropists and upon the years of toil ofwealthy amateurs’ (1951, p. 44). A follow-up to Livelihood and
A dole queue in 1911. As political concern about poverty increased, social securitywas gradually extended, but was still often subject to stringent means tests.

31
poverty carried out by Bowley and Hogg in 1923–4, publishedunder the title Has poverty diminished? (1925), dealt with asubject of great contemporary interest, the difference betweenthe prewar and the post-war world.
The biggest survey in the interwar period was the NewSurvey of London Life and Labour directed by Hubert Llewellyn-Smith (1930–5), which specifically aimed to provide acomparison with Booth’s earlier study.
There was a flurry of surveys in the 1930s, including surveysof Sheffield (Owen, 1933), Merseyside (Jones, 1934),Southampton (Ford, 1934), Plymouth (Taylor, 1938), and asurvey of Bristol (Tout, 1938), which was technically interestingas probably the first in Britain to use the Hollerith punch-cardmachine (Wardley and Woollard, 1994).
Rowntree’s second survey of York, published as Poverty andprogress (1941), was particularly interesting since it showedhow much social conditions had changed between 1899 and1936. Rowntree measured poverty according to severaldifferent standards, the original 1899 level and a rather moregenerous line based on his study of the Human needs of labour(1937) – so this study looked forward as well as back. His thirdsurvey in 1950, much smaller and less rigorous than his earlierstudies, found that poverty had been virtually abolished largelyas a result of the welfare state, an apparent achievement of theBeveridge reforms which was widely reported. This was the lastof the old style local poverty surveys.
The introduction of the official Family Expenditure Survey(FES) was a watershed for poverty research. This was carried outon a one-off basis in 1953/54 and then on a continuous basisfrom 1957 onwards. Its primary purpose is to collectinformation about expenditure patterns which is used toconstruct the Retail Price Index, but it also collectedinformation about household incomes. Initially this informationwas fairly crude, but the questions became more detailed overtime. FES data could therefore be used to look at poverty at anational level. The first to recognise and seize this opportunity
Changes in poverty

One hundred years of poverty and policy
32
were a group of academics based at the London School ofEconomics. In the early 1960s Peter Townsend (1962) andDorothy Wedderburn (1962) presented some preliminary resultsfrom an analysis of the FES for the years 1953/54 and 1960. Thefinal results were published with much publicity, and the linkedestablishment of the Child Poverty Action Group, in December1965 in a pamphlet by Abel-Smith and Townsend, called Thepoor and the poorest.
Many further analyses were conducted in the same mouldusing the FES in the 1960s and 1970s, including those byAtkinson (1969), Fiegehen, Lansley and Smith (1977) andBeckerman and Clark (1982).
Official statistics on low incomes became a regular series withthe publication of the Low Income Families estimates between1972 and 1985 (DHSS, 1988). These were based on the FES andthe format of the analyses was very similar to those producedby Abel-Smith and Townsend, although the word ‘poverty’ wasnot mentioned.
The current official statistics on low incomes can be found inthe annual Households Below Average Income (HBAI) report,which began to be published in 1988 and replaced the officialLow Income Families series. Originally this used the FES but it isnow based on the larger, tailor-made Family Resources Surveycarried out on behalf of the Department for Work andPensions. As its name suggests, HBAI provides details aboutvarious aspects of the lower half of the income distribution, butmany commentators have chosen 50 per cent of mean incomeor 60 per cent of median income, as a convenient poverty line.In 1999 this appeared to receive official endorsement in theform of a set of poverty indicators published by thegovernment (DSS, 1999) and was used in the Public ServiceAgreement target for cutting child poverty by one quarter by2004/05. The latest target in the Child poverty review (HMTreasury, 2004) is to halve child poverty defined as below 60 percent of median income level (before housing costs) by 2010/11relative to the 1998/99 level.

33
Poverty linesThere are many differences in the poverty studies mentionedhere: in who carried out and financed the surveys, thepopulation covered, sampling and survey size, sources ofinformation and their quality, response rates, andrepresentativeness.1 Most fundamental in describing poverty iswhat is meant by ‘poverty’ – what line or standard was used.The starting point is Rowntree.
Rowntree drew up his ‘primary’ poverty line, as described inchapter 2, based in part on science and in part on observation.The scientific input was from American nutritionists whoseresearch (however unethical in retrospect, being based oninvoluntary convict subjects) indicated requirements for ‘themaintenance of merely physical efficiency’. To this was addedthe cost of clothing, light and fuel.
On rents, Rowntree wrote:
In estimating the necessary minimum expenditure for rent,I should have preferred to take some reliable standard ofaccommodation required to maintain families of differentsizes in health, and then to take as the minimumexpenditure the average cost in York of suchaccommodation. This course would, however, have assumedthat every family could obtain the needful minimumaccommodation, which is far from being the case.
In view, therefore, of the difficulty of forming anestimate as above, the actual sums paid for rent have beentaken as the necessary minimum rent expenditure.Extravagance in this item is very improbable, rent beingthe first thing in which a poor family will try to economise. (1901, p. 106, emphasis in original)
This issue is still with us – exemplified by the continuingstruggles of the government to reform Housing Benefit. Mostsubsequent studies of poverty have either included actual rentsin setting the poverty line or, with the same effect, studied
Changes in poverty

One hundred years of poverty and policy
34
incomes after housing costs. For comparability, the same will bedone here.
The table below shows the minimum necessary expendituresper week in 1899.2
Food Sundries Total
Each adult 3s 2s 6d 5s 6d
Each child 2s 3d 7d 2s 10d
The diet this allowed was bleak indeed. It is set out in box 2.
Box 2 Rowntree’s 1899 diet
For a man Rowntree’s 1899 diet comprised the following (thedays from Wednesday to Saturday were no different):
Breakfast Dinner Supper
Sunday Bread, 8 oz Boiled bacon, 3 oz Bread, 8 oz
Margarine, 1/2 oz Pease pudding, 12 oz Margarine, 1/2oz
Tea, 1 pt Cocoa, 1 pt
Monday Bread, 8 oz Potatoes with milk, 24 oz Bread, 8 oz
Porridge, 11/2 pts Bread, 2 oz Vegetable
Cheese, 2 oz broth, 1 pt
Cheese, 2 oz
Tuesday Porridge, 11/2 pts Vegetable broth, 1 pt Bread, 4 oz
Skim milk, 1 pt Bread, 4 oz Porridge,11/2 pts
Cheese, 2 oz
Dumpling, 8 oz

35
The cost of some components of the diet then and now are alsoshown in the box. Costing the weekly diet for a man and forchildren aged 3–8 at today’s prices gives totals of £10.70 and£5.60 per week respectively. The cost of the diet made up overhalf of the total poverty line for adults and four-fifths of thetotal for children.
Comparisons between the poverty lines used in other studiesare fraught with difficulty, due to differences in their structuresand lack of suitable price indices and measures of livingstandards. The poverty lines used in the early studies are asconsistently as possible compared in figure 1; this relates to athree-child family and is adjusted to the price levels of 2000. Itis clear that most of the early surveys used similar poverty lines
(Box 2 continued)
The table below compares the prices of food items in 1899 and2004, expressed in current prices converted to (new) pence perpound (2004 prices are April 2004 Waitrose prices, London).
1899 2004 Increase
Flour 0.48 15 31x
Oatmeal 0.83 34 41x
Cheese 2.71 212 78x
Sugar 0.73 31 42x
Potatoes 0.21 18 86x
Margarine 3.33 47 14x
Butter 5.0 141 28x
Biscuits 1.67 44 27x
Bacon 5.0 135 27x
Tea 7.08 307 43x
Coffee 5.0 899 180x
Treacle 0.73 79 108x
Onions 0.21 25 119x
Currants 1.46 97 67x
Milk (per pint) 0.63 30 48x
Changes in poverty

One hundred years of poverty and policy
36
Figu
re 1
: Po
vert
y lin
es f
or
a co
up
le a
nd
th
ree
child
ren
ag
ed 3
, 6 a
nd
8, a
t 20
00 p
rice
s, 1
899–
1950
Sou
rce:
Web
b (
2002
), c
har
t 5.
6.
Rowntree,
1899
prim
ary
100 90 80 70 60 50 40 30 20 10 0
Income per week (£)
53.1
0 Man
n, 190
3Fiv
e Towns,
1913 Fiv
e Towns,
1924
New Su
rvey
of L
ondon, 193
0
Surv
ey o
f Mer
seys
ide,
1930
South
ampto
n, 193
1 Shef
field
, 193
2 Plym
outh, 1
933
Rowntree,
1936
hum
an n
eeds
Rowntree,
1936
prim
ary
Natio
nal Assi
stance
, July
1948 Rowntre
e, 19
50
Bristo
l, 193
7
47.7
946
.72
47.9
652
.14
46.9
345
.01
46.2
949
.33
71.7
7
50.8
7
59.5
562
.86
91.0
6

37
in real terms and in structure. By the 1930s these lines were verylow in comparison with general living standards. The mainexception was Rowntree, who in his second and third studieswas much more generous than the rest.
In the second half of the century, benefit levels did notchange their structure much until very recently, with higherallowances for children, especially younger ones. Means testedsocial assistance benefits increased roughly in line with averageincomes until the early 1980s, and have risen sporadically sincethen, as shown in figure 2.
Overall, the derivation of poverty lines and the fine details oftheir construction, such as the varying treatment of men,women, pensioners, children and people of working age, havechanged over time, but the measures produced have beensurprisingly stable when viewed in relation to living standards.In the first half of the century, poverty lines for a single manwere 30–35 per cent of weekly personal disposable income percapita, while in the second half they were around 40 per cent,as shown in figure 3 (page 40). For a three-child family therewas much more variation from about 80 to 140 percent of percapita income.
We can compare Rowntree’s 1899 primary poverty level withthe equivalised 60 per cent of median income standard nowused by the government. The overall poverty levels have beenexpressed as proportions of consumers’ expenditure per capita,as shown in table 1. It can be seen that for all types ofhousehold the poverty line has not only increased with risingprosperity but has risen somewhat relative to averageexpenditure levels. (It may be noted that the poverty line for2001/02 is considerably higher than Income Support levels,which are roughly similar proportions of average consumptionper head as were Rowntree’s primary poverty levels.)
At the end of the twentieth century, poverty lines were farhigher in absolute (real) terms than ever before, but in relativeterms they had changed rather little. All the evidence suggeststhat over a long period of time, the public has regarded the
Changes in poverty

One hundred years of poverty and policy
38
Figu
re 2
: Ben
efit
leve
ls a
nd
hal
f m
ean
inco
me
for
a co
up
le a
nd
th
ree
child
ren
ag
ed 3
, 6 a
nd
8, a
t 20
00 p
rice
s, 1
948–
2000
Sou
rce:
Web
b (
2002
), c
har
t 5.
9.
250
200
150
100 50 0
Income per week (£)
62.8
6
1948
1955
1960
1965
1970
1975
1979
1985
1990
1995
2000
73.1
6
85.1
2
106.
9411
0.77
118.
7312
1.60
155.
09
131.
65
141.
29
211.
88
146.
08
220.
51
176.
11
243.
21
Soci
al a
ssis
tan
ce le
vel
Hal
f m
ean
inco
me
afte
r h
ou
sin
g c
ost
s

39
poverty line as a relative concept, i.e. bearing some relation togeneral living standards although not necessarily rising quite asfast as they do. Although social policy textbooks often talkabout ‘absolute’ versus ‘relative’ definitions of poverty, and theperson usually cited as an exponent of the former view isRowntree, this is a gross misrepresentation of his work. Budgetstandards became stuck in a rut in the 1930s becauseresearchers were concentrating on making comparisons, eitherwith different places or different times, not because they wereseen as currently valid. Surveys of public opinion indicate thatover time, people’s views of necessities and the income requiredto afford them do rise upwards as average incomes grow.3 AsDonnison said in 1982:
Supplementary benefit today is worth about twice as muchas national assistance was as recently as 1948. So why worryabout the poor? Poverty means exclusion from the livingstandards, the life styles and the fellowship of one’s fellowcitizens. That exclusion is not experienced merely as afrustrating failure to keep up with the Joneses. The assistantsecretary in charge of the campaign against fraud whobelieved that everyone could manage perfectly well with anincome equivalent to the national assistance rates of hisboyhood on which his own parents lived had forgotten thatthey had an open fire and probably a cooking range which
Changes in poverty
Table 1: Poverty lines as a proportion of consumers’ expenditure percapita (%)
Single Couple, Couple, Couple, Couple, Singleperson no one child two three person,
children (8–10) children children one child
1899 36 60 78 97 114 552001/02 42 76 93 111 128 59
Source: Piachaud (1988) for Rowntree’s 1899 ‘primary poverty’ line;authors’ calculations for 2001/02.

One hundred years of poverty and policy
40
Figu
re 3
: Po
vert
y lin
es a
fter
ho
usi
ng
co
sts,
as
a p
erce
nta
ge
of
nat
ion
al p
erso
nal
dis
po
sab
le in
com
e p
er c
apit
a, 1
899–
2000
Sou
rce:
Web
b (
2002
), c
har
t 5.
12.
160
140
120
100 80 60 40 20 0
Sin
gle
man
Co
up
le w
ith
ch
ildre
n a
ged
3, 6
an
d 8
Rowntree,
1899 M
ann, 1
903
Five T
owns, 19
13Fiv
e Towns,
1924
New Su
rvey
of L
ondon, 193
0
Surv
ey o
f Mer
seys
ide,
1930
South
ampto
n, 193
1Sh
effie
ld, 1
932
Plym
outh, 1
933
Rowntree,
1936
hum
an n
eeds
Rowntree,
1936
prim
ary
Natio
nal Assi
stance
, 194
8Rowntre
e, 19
50
Bristo
l, 193
7
Supplem
enta
ry B
enef
it, 19
79
Half av
erag
e inco
me,
1979
Inco
me S
upport, 20
00
Half av
erag
e inco
me,
1999
/00

41
could burn all kinds of fuel. They were not compelled to livein a flat with one of the more expensive forms of centralheating. They could probably grow vegetables in the backgarden, and walk to the shops every day – little shops whichwould give you credit if you were short of cash. They had noneed of a refrigerator for storing their food. They couldhang out the washing in the yard and had no need oflaunderettes or washing machines. Since no-one hadtelevision sets their children would not have felt at a loss inthe playground and the classroom for lack of what has nowbecome most people’s main window on the world – almostthe only window for those who cannot afford to goanywhere. (1982, p. 226)
Contemporary examples are the reduction in public telephonebooths due to the prevalence of mobile phones, and the muchwider range of information and services available to those withinternet access.
The current poverty line based on a proportion of averageincome is convenient to apply – particularly when makinginternational comparisons – and easy to understand, but itsapparent simplicity disguises a host of technical definitions andimplicit assumptions. It is possible to imagine a very rich societywhere nobody lacked what people in any other society wouldsee as necessities and yet some people still had incomes belowhalf average.
The modern approach to defining needs that is closest toRowntree’s method is the Budget Standard approach,expounded most notably by Jonathan Bradshaw (1993). Thisapproach was for a long time associated with discreditednotions of ‘absolute’ poverty. But there is nothing intrinsicallyabsolute or fixed about it, although it is rather laborious toupdate. It has the great advantage that it is explicit, and thereis no reason why the ‘necessities’ included should not changeover time.4
Changes in poverty

One hundred years of poverty and policy
42
Budget standards incorporating public opinion could be usedto supplement the 60 per cent of median income measure tocounteract the criticism that it is arbitrary and abstract. Suchstandards have been constructed recently for several familytypes, giving a detailed picture of what different householdsneed to achieve a particular standard of living in the UK at aspecific point in time. Far from Rowntree’s diet of cocoa, peasepudding and boiled bacon, they take into account itemsnecessary for modern families, including childcare costs, whichmade a big difference to the picture. These budgets have beenconstructed after wide consultation with relevant groups, notjust by ‘experts’.
It is striking that at the end of the twentieth century, budgetstandards and 60 per cent of median income were producingquite similar results despite being constructed in completelydifferent ways. The two approaches complement each otherwell. One strategy would be that from time to time, budgetstandards could be compared with average income todetermine what proportion of average income should be usedas the poverty line – a proportion that might gradually changeas time went on. The HBAI report could also discuss how thepoverty line translates in terms of living standards – a way ofputting flesh on the bones of the statistical calculations to makethem more meaningful.
A problem which has been exacerbated in recent years is thedivergence between the poverty measure in common use andthe social security system. Some discrepancies may be justified:for example, the benefit system uses the ‘inner family’ unit asthe benefit unit, whereas the HBAI series is based onhouseholds. For the purposes of poverty measurement it isprobably fair to assume that most individuals in a householdshare resources with each other, while for the benefit system tomake this assumption would be politically unacceptable. Butthere is little rationale for other inconsistencies: 60 per cent ofmedian income is now considerably higher than benefit levelfor most family types; clearly there is a serious gap between

43
what society and the government regard as an appropriatepoverty line and the standard of living it is prepared to grant inpractice to people receiving benefits.
The changing extent of povertyRowntree’s study was confined to York. As Rowntree himselfput it: ‘One naturally asks on reading these figures [on povertyin York] how far they represent the proportion of poverty inother towns’ (1901, p. 298). He described York as ‘this typicalprovincial town’ (p. 304) and before undertaking his study hesatisfied himself ‘that the conditions of life obtaining in mynative city of York were not exceptional, and that they mightbe taken as representative of the condition existing in many, ifnot most, of our provincial towns’. Comparing his results withBooth’s earlier study of London, Rowntree wrote: ‘Theproportion of the population living in poverty in York may beregarded as practically the same as in London’ (p. 299).
Jonathan Bradshaw in his preface to the centennial editionof Rowntree’s study wrote:
We concluded that Rowntree’s claim that conditions of lifein York were not exceptional and were fairlyrepresentative is remarkably true of the city a century later(with reservations on ethnic mix). In terms of the keydeterminants of living standards, including rates of pay,levels of unemployment, proportion of the populationwho are sick or disabled, lone-parent families, retirementpensioners or people who are in receipt of income-relatedbenefits, York is extraordinarily close to the nationalaverage. (Rowntree, 2000, pp. lxv–lxvi)
Thus it seems justifiable to treat Rowntree’s study as broadlyrepresentative of Britain and to compare poverty in York in1899 with that in Britain at the end of the century – besideswhich, we have no choice.
Changes in poverty

One hundred years of poverty and policy
44
Figu
re 4
: Po
vert
y ra
tes
for
the
earl
y st
ud
ies,
bas
ed o
n t
he
sam
e p
ove
rty
line
in t
erm
s o
f p
erso
nal
dis
po
sab
le in
com
ep
er c
apit
a as
Yo
rk 1
899
Sou
rce:
Web
b (
2002
), c
har
t 6.
7. N
ote
th
at R
ow
ntr
ee’s
189
9 st
ud
y d
id n
ot
dis
tin
gu
ish
po
vert
y ra
tes
by
ho
use
ho
ld t
ype.
Th
e ra
tes
sho
wn
are
th
ose
fo
r th
e w
ho
le p
op
ula
tio
n.
45 40 35 30 25 20 15 10 5 0 York
, 189
9Rea
ding, 1
912
Northam
pton, 1
913
War
ringto
n, 191
3 Stan
ley, 1
913 Bolto
n, 191
4 Stan
ley, 1
923
Northam
pton, 1
924
War
ringto
n, 192
4Rea
ding, 1
924 Bolto
n, 192
4
Mer
seys
ide,
1930
South
ampto
n, 193
1
London, 1
930
Shef
field
, 193
1Ply
mouth
, 193
3
York
1936
, Hum
an N
eeds l
ine
York
1936
, prim
ary p
overty
Sin
gle
man
Co
up
le a
nd
3 c
hild
ren
Percentage in poverty
Bristo
l, 193
7

45
Rowntree found that 9.9 per cent of York’s population werebelow his primary poverty line, or living in ‘primary poverty’. Inaddition nearly twice this proportion – 17.9 per cent – wereliving above the poverty line but in ‘obvious want and squalor’,which is Rowntree’s ‘secondary poverty’. Together this made atotal of 27.8 per cent living in poverty.
The extent of poverty found in subsequent studies up to1937 is shown in figure 4, but with results adjusted to use thesame relative standard as the ‘primary poverty’ line inRowntree’s 1899 study. The broad picture is one of some declinecomparing the 1920s with the years before the First World War,and higher rates of poverty in the early 1930s than in the 1920s.
Poverty in 1950 was underestimated by Rowntree, and itincreased during the 1950s, as Abel-Smith and Townsendshowed. Even then, it was at very low levels by modernstandards, affecting less than 4 per cent of the population if thestandard benefit level was used as the poverty line. Abel-Smithand Townsend’s ‘rediscovery’ of poverty was in part due to the
Changes in poverty
Slums in York, a ‘typical provincial town’, circa 1900. Seebohm Rowntree’s influentialwork, Poverty: A study of town life (1901), measured, among other things, the cost of‘mere physical subsistence’. He produced measures of numbers in primary poverty(below this level) and in secondary poverty (above this level but living in ‘squalor’),attempting to take a more scientific approach to the study of poverty.

One hundred years of poverty and policy
46
Figure 5: Proportion of the population below 50 per cent mean income,1961–99
Source: Webb (2002), chart 7.5.
30
25
20
15
10
5
0
1961
1963
1965
1967
1971
1973
1975
1977
1979
1981
1983
1987
1989
1985
1991
1993
1995
1997
Before housing costs
After housing costs
Perc
enta
ge
1999
1969
Figure 6: Proportion of children living in households with incomes below50 per cent of mean income, before housing costs, 1961–99
Source: Webb (2002), chart 8.19.
35
30
25
20
15
10
5
0
Children
Population average
Perc
enta
ge
1961
1963
1965
1967
1971
1973
1975
1977
1979
1981
1983
1987
1989
1985
1991
1993
1995
1997
1999
1969

47
use of a higher poverty line, 140 per cent of the basic ‘scalerates’ of benefit (on the basis that this allowed for other ‘extras’people on National Assistance could get on top of scale rates),which produced a poverty rate of 14.2 per cent.
The 1960s and 1970s were a period of relative stability, withpoverty still in single figures on the standard benefit levelmeasure, and only around 10 per cent on a half mean incomemeasure. The extent of post-war poverty over the period forwhich continuous data are available is shown in figure 5. Thegreat change came in the 1980s, when it doubled to roughly 20per cent, and stayed there until the end of the century. Theperiod since the late 1970s is considered in more detail inchapter 6.
Among children, the extent of poverty, as measured by theirfamily income level, was close to the average of all ages untilthe 1980s. Since then child poverty has become markedly moresevere, as shown in figure 6.
In 2001/02, over one person in five (22 per cent) was livingbelow the poverty line of 60 per cent of median income level(after housing costs). No attempt had been made sinceRowntree’s first study to measure secondary poverty sincedoing so involved a highly subjective judgement on the part ofthe researcher. This in part reflected the quest for objectivity inpoverty research but also the primacy given in twentiethcentury social science to the quantitative over the qualitative.
Having considered the poverty lines used and the overall extentof poverty in twentieth century Britain, it is to the changingpattern and causes of poverty that the next chapter turns.
Changes in poverty

48
Causes of povertyRowntree distinguished six causes of poverty and divided thosein primary poverty according to these causes. The division isshown in table 2. Over half the poor were in regular work butat low wages.
To examine how far Rowntree’s ‘causes’ continue to explainpoverty, data from the Family Resources Survey for 2001/021
have been reanalysed using as far as possible the samecategories as Rowntree.2 The results in table 2 show importantchanges.
The biggest group in poverty remains households withsomeone in work, but these account for only one third of thosenow in poverty. Largeness of families (five or more children) hasgreatly declined in significance from 22 to 2 per cent. Illness orold age of the chief wage earner has grown in importance butwidowhood is less significant. Unemployment is now moreimportant than a century ago in explaining poverty. There isnow a large group whose poverty is not explained by any ofRowntree’s causes; these include lone parent families, studentsand others.
Counting how many fall below a poverty line gives ameasure of poverty but it does nothing to indicate the severityof poverty; in a head count those a few pence below thepoverty line count equally with those far below the level. Toindicate severity it is possible to derive ‘poverty gaps’ whichmeasure the deficit below the poverty line. Rowntree
4 Why has poverty changed? David Piachaud and Jo Webb

Why has poverty changed?
49
calculated these for each of his main categories of the poor. Asfar as possible this has been reproduced for 2001/02. The resultsare shown in table 3. In both years, the group falling farthestbelow the poverty level was those in unemployed households,still with an income less than half of the current poverty line.The relative severity of poverty in households with one or morein regular work was greater in 2001/02 than 1899. For widowsnot only the incidence but also the severity of poverty haddiminished.
Taking the century as a whole, some conclusions can bedrawn about the composition of the poor and the causes ofpoverty. Although surveys used different methods and povertylines, at any given time there was general agreement about theleading cause. The earliest studies found that poverty wasmainly due to the combination of low wages and large families,and child poverty rates were very high. In the 1920s and 1930s,unemployment became a huge problem, and the unemployedhad a high risk of falling into poverty, despite unemployment
Table 2: Causes of poverty, 1899 and 2001/02
Make-up of poor (%) Proportionpoor (%)
1899 2001/02 2001/02(primary (below 60%poverty) of median)
Death of chief wage earner 15.6 5.8 23.7Illness or old age of chief wage earner 5.1 25.7 30.1Chief wage earner out of work/
unemployed 2.3 8.6 73.0Largeness of family 22.2 2.1 65.0Irregularity of work 2.8 } 31.0 } 11.1In regular work but at low wage 52.0Other – 26.8 52.5All causes 100.0 100.0 22.0
Source: Rowntree (1901), p.120; authors’ calculations using FamilyResources Survey, 2001/02, see notes 1 and 2 to this chapter.

One hundred years of poverty and policy
50
insurance and assistance. After the war, family allowanceseased the problem of low wages, and unemployment was verylow. The largest group in poverty in the 1950s and 1960s werethe elderly, many of whom did not claim the NationalAssistance to which they were entitled. When poverty was‘rediscovered’ in the 1960s, public attention was drawn to theplight of children in poverty. Pensioners were still more likelythan children to be poor, but the picture varies according towhich ‘equivalence scales’ we use to compare the incomes ofdifferent kinds of family.
Pensioner poverty declined in the 1970s, due to increases inthe retirement pension. But in the 1980s, many groups wereaffected by the great rise in poverty. Unemployment and loneparenthood soared, and the risk of poverty was very high forboth of these groups. Today unemployment is lower but thereare many households with no adult in work, and child povertyhas become a major problem. There is now no single clear causeof poverty but there is general concern about incentives towork, with the introduction of measures to ‘make work pay’and greater financial support for children (see chapter 6).
Is there still a life cycle of poverty?Rowntree’s life cycle of poverty, one of his key concepts whichhad an enduring impact on social security policy in the
Table 3: Poverty gaps as a percentage of the poverty line
1899 2001/02
Death of chief wage earner } 36.925.2
Illness or old age of chief wage earner 26.6Chief wage earner out of work/unemployed 83.6 51.6Largeness of family 10.0 19.0Irregularity of work 31.1 } 41.1In regular work but at low wages 24.8
Source: Rowntree (1901), p.120; authors’ calculations using FamilyResources Survey, 2001/02, see notes 1 and 2 to this chapter.

Why has poverty changed?
51
twentieth century, was discussed in chapter 2. Here we attemptto examine how it changed over the century. He illustrated thelife cycle with the diagram shown in box 1 in chapter 2. It isunclear how Rowntree constructed his diagram. It appears toincorporate some adjustment for changing family size (orequivalisation) over the life cycle since the poverty line isconstant across the age range. Since Rowntree was at that stagenot conversant or confident with sampling methods, it seemsunlikely that he was familiar with more sophisticated andrecent statistical procedures. It seems likely that he drew hisdiagram without specific data, impressionistically by hand, toillustrate the life cycle he had observed and discussed. Sinceneither the data nor the researchers are any longer available,we shall never know.
For comparison, the modern extent of a life cycle of povertyhas been explored, based an actual data, with results shown infigure 7. There is still, despite extensive lifetime redistributionof income through the social security and tax systems, asignificant variation of average income levels over the life cycle.As can be seen, the extent of poverty is highest among childrenand older people. This pattern is not very different from whatRowntree found although there is not now the fall in incomelevel and rise in poverty associated with the period of havingmany dependent children when aged between 25 and 45.
A further difference between lifetime experiences of povertyis that between men and women. In 1899 women made upabout 60 per cent of all poor adults. In 2001/02 women madeup 54 per cent of those aged 16 and over who were poor. Thuswomen were and are more likely to be poor. However, asstressed in Chapter 2 and considered by Lewis and Piachaud(1992), it is misleading to refer to a ‘feminisation’ of poverty inBritain – poverty has for a long time been feminised.
Social and economic changesIn this section some of the most significant and striking changesover the century are considered. It is not possible to assess the

One hundred years of poverty and policy
52
Figu
re 7
: Po
vert
y an
d in
com
e le
vel b
y ag
e g
rou
p
Sou
rce:
Bas
ed o
n F
amily
Res
ou
rces
Su
rvey
, 200
0/01
.
450
400
350
300
250
200
150
100 50 0
Equivalised income after housing costs (£/week)
Inco
me
afte
r h
ou
sin
g c
ost
s (l
eft-
han
d s
cale
)
Per
cen
t p
oo
r (r
igh
t-h
and
sca
le)
35 30 25 20 15 10 5 0
05
1015
2025
3035
4045
5055
6065
7075
80
Ag
e g
rou
p
Per cent poor after housing costs

Why has poverty changed?
53
impact of each of these changes on poverty but they doindicate how some things have changed a lot, and some notvery much.
PopulationYork’s total population increased over the century – as didBritain’s – but, owing to boundary changes, it is hard to be surehow much. What is more relevant is the changing age structure.This is shown in table 4.
What is apparent is the extent of the ‘ageing’ of thepopulation. In 1901 nearly one-third (31.4 per cent) was agedunder 15 compared to one-sixth (16.5 per cent) in 2001; thoseaged 60 or over tripled from 7.2 per cent in 1901 to 21.9 percent in 2001. There has been a dramatic fall in infant and childmortality, and those reaching middle age live longer.
The proportions of the population who were unmarried (40per cent), married (52 per cent) and widowed (8 per cent) werelittle different across the century but each category had changed.
Table 4: Age distribution of population, York
Age 1901 2001(%) (%)
Under 5 11.2 5.25–9 10.1 5.410–14 10.1 5.915–17 6.0 3.418–24 14.7 11.025–44 28.8 28.745–59 11.9 18.660–74 5.9 13.775–84 1.1 6.185+ 0.2 2.1All ages 100.0 100.0
Note: 1901 data are for York County Borough, 2001 data for York UrbanAuthority.Source: Census 1901, p. 191; Census 2001, table KS02.

One hundred years of poverty and policy
54
In 2001 one-fifth of the currently unmarried were divorced, oneseventh of those married had been remarried, and 4 per cent ofthose who were still legally married were separated.3
A third, clear change in population was that in 1901 0.9 percent of York’s population was born outside the British Isles; in2001 this had increased to 4.7 per cent.4
Economic activity, occupations and earningsThe extent of economic activity and the principal occupationsof all adults (up to age 75 in 2001) are shown in table 5.
Among adult men there has been a striking fall in economicactivity: only 1 in 14 was not engaged in an occupation in 1901compared with 1 in 3 in 2001. Among women the opposite hasoccurred, with a rise from 31 per cent to 56 per cent inoccupations. There was a greater difference betweenunmarried women and women who were married or widowedin 1901; 61 per cent of the former were in employmentcompared to 10 per cent of the latter. In 2001 this differencewas much smaller, with over 70 per cent of married womenwith dependent children being economically active. Thecombination of the decline in employment among olderworkers, due to the growth in both early retirement andnumbers on disability benefits, and the rise in femaleemployment have had major consequences for the distributionof incomes.
While economic activity changed greatly, the pattern ofearnings was much more stable. The share of employmentincome in gross domestic product remained remarkablyconstant – between 70 and 80 per cent – through the twentiethcentury. The dispersion of earnings changed very little in thefirst 70 years of the century (Thatcher, 1968); it fell during the1970s and then increased from 1980 until the end of thecentury (Atkinson, 2000).

Why has poverty changed?
55
Pattern of expenditureThe distribution of expenditure in 1899 was most fully analysedby Rowntree only for those on the lowest earnings; the resultsare compared with results for a similar proportion ofhouseholds in 2001/02 in table 6.
By far the most striking change is that in food expenditure. In1899 poorer households spent over half their income on food:after rent, fuel and lighting, they had less than one quarter tospend on other things. By contrast in 2001/02 nearly half wasspent on other things and food represented only one sixth oftotal expenditure. Only 12 per cent was spent on non-basic otherthings in 1899 whereas this had grown to 40 per cent in 2001/02.
HousingHousing circumstances have changed drastically. First, there hasbeen a change in tenure. Rowntree described the working classpopulation of York in 1899 as tenants – without exception they
Table 5: Economic activity and occupations, York, 1901 and 2001
Males Females
1901 2001 1901 200114+ 16–74 14+ 16–74
Percentages engaged in occupations 92.6 66.9 31.4 56.2
Distribution of occupations (% of all active)
Manufacturing 7.9 18.9 n.s. 6.4Transport and communication 17.8 9.4 n.s. 4.1Motor trade – 14.8 – 19.0Construction 14.3 11.3 n.s. 1.8Food, lodging and domestic services 12.1 5.0 55.0 8.6Social services n.s. 10.6 n.s. 32.6Other (incl. n.s.) 55.8 38.9 45.0 33.9
Note: n.s. is not specified.Source: Census 1901, table 35A; Census 2001, table KS11b and c.

One hundred years of poverty and policy
56
rented their accommodation. Others in the ‘servant-keepingclass’ owned their own homes but he assumed that this did nothappen among the working class. In 2001 in York the tenuregroups were:
Owned outright 32.1%Owned with mortgage 40.3%Rented from local authority 10.5%Rented from housing association 4.6%Rented from private landlord 8.7%Other 3.8%
Renting is now confined to one quarter of households andmany of the poor in 2001 are owner-occupiers.
A second major change has been in the quality of housing. In1899 Rowntree found that over 20 per cent of houses in Yorkhad to share a closet with another house, some sharing withfive or more other houses. These were not water closets but
Table 6: Distribution of expenditure (%)
Distribution of 1899 Class I 1 2001/02 Bottom expenditure quintile group2
Food 51 17Rent 18 283
Fuel and lighting 9 6Clothing 6 6Insurance and sick cover 4 3Other 12 40Total 100 100
Notes:1 Weekly earnings under 26 shillings. These constitute about 20% of allhouseholds.2 Average of lowest and second decile groups.3 See section on housing.Source: Rowntree (1901), p. 244; Family Spending 2001/02, Office forNational Statistics, 2003.

Why has poverty changed?
57
mostly midden privies, essentially holes in the ground. Not allhouses had their own water supply, with 15 per cent sharing awater tap.
Third, the density of living has been greatly reduced. It is notthat houses are much larger: in 1899 there were about 5 roomsper household, compared to 5.3 in 2001 (although rooms maybe larger and what is counted as a room has changed slightly,making precise comparison impossible). But the number in eachhousehold has fallen markedly from a mean of 4 in 1899 to 2.4in 2001. Whereas in 1899 nearly all households had more thanone member and most had dependent children, in 2001 nearlya third of households had only one member, of which half werepensioners, and only one fifth had dependent children.
Rents in 1899 amounted to 18 per cent of total expenditureof the poorest fifth, as shown in table 6. Even in Rowntree’shighest income group rents were 13 per cent of totalexpenditure. The rent figure for 2001/02 in table 6 is based ongross rent: taking into account housing benefit, rebates andallowances, net rent for the lowest quintile amounted to only 6per cent of expenditure.
Thus for poorer tenants the net cost of housing is now amuch lower burden than in Rowntree’s day, but rent levels varywidely. Similarly, among owner-occupiers the cost of mortgageinterest is highly variable. In sum, while the quality of housinghas improved enormously, the variation in its cost has greatlyincreased.
Consumer durablesAlongside the extension of owner-occupation, the acquisitionof consumer durables has increased the capital ownership ofvirtually all households. In analysing consumer durables nocomparison is possible with 1899 since Rowntree did notanalyse their ownership – in most cases for the very goodreason that the products had yet to be invented. In 2001 theproportions of households in Britain with different consumerdurables were as shown in table 7.
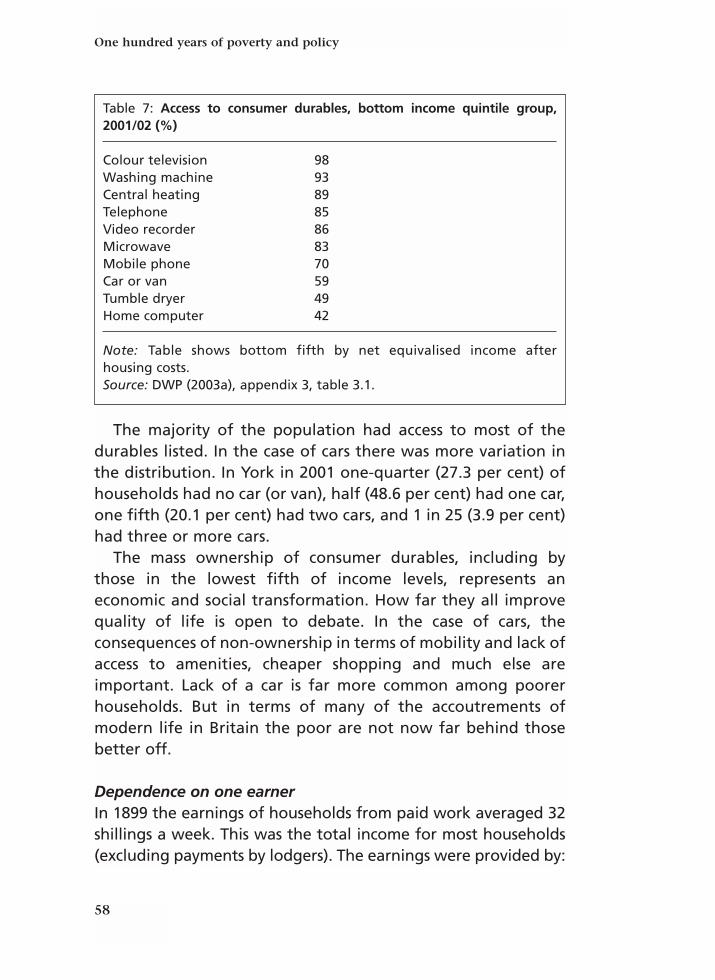
One hundred years of poverty and policy
58
The majority of the population had access to most of thedurables listed. In the case of cars there was more variation inthe distribution. In York in 2001 one-quarter (27.3 per cent) ofhouseholds had no car (or van), half (48.6 per cent) had one car,one fifth (20.1 per cent) had two cars, and 1 in 25 (3.9 per cent)had three or more cars.
The mass ownership of consumer durables, including bythose in the lowest fifth of income levels, represents aneconomic and social transformation. How far they all improvequality of life is open to debate. In the case of cars, theconsequences of non-ownership in terms of mobility and lack ofaccess to amenities, cheaper shopping and much else areimportant. Lack of a car is far more common among poorerhouseholds. But in terms of many of the accoutrements ofmodern life in Britain the poor are not now far behind thosebetter off.
Dependence on one earnerIn 1899 the earnings of households from paid work averaged 32shillings a week. This was the total income for most households(excluding payments by lodgers). The earnings were provided by:
Table 7: Access to consumer durables, bottom income quintile group,2001/02 (%)
Colour television 98Washing machine 93Central heating 89Telephone 85Video recorder 86Microwave 83Mobile phone 70Car or van 59Tumble dryer 49Home computer 42
Note: Table shows bottom fifth by net equivalised income after housing costs. Source: DWP (2003a), appendix 3, table 3.1.
Why has poverty changed?
59
Head of household (almost all male) 82%Male supplementary earners 13%Female supplementary earners 5%
Thus over four-fifths of household incomes came from oneearner – literally the breadwinner.
In 2001 the numbers of economically active persons inhouseholds were as follows:5
0 32%1 28%2 31%3 7%4+ 2%
Far more households have two or more earners than in 1899but in addition far more have no earner at all. The widening ofthe distribution of economic activity is the greatest singlechange that has increased income inequality.
Poor relief, social security and redistributionAt the start of 1901 the York Poor Law Union provided at publicexpense for 492 people in York Workhouse and for 1,049through ‘outdoor relief’ – payments to people living in theirown homes. ‘Outdoor relief’ provided for 1.4 per cent of thepopulation at a cost of £5,950 (Rowntree, 1901, pp. 365–76);thus, outdoor relief amounted to at most 0.4 per cent ofincome from earnings in York.6
In 2001/02 in Britain, one tenth of households received overhalf their income from income related benefits.7 While IncomeSupport amounted to 1.4 per cent of gross incomes, a morerelevant figure however is total state spending on all cashbenefits, which amounted to 12.7 per cent of gross income.8
The role of the state in providing incomes and relievingpoverty has changed beyond any possible imagining ofSeebohm Rowntree.

One hundred years of poverty and policy
60
Despite the tiny levels, by modern standards, of expenditureon poor relief, some of the concerns then are all too familiarnow. In the final paragraph of his study, Rowntree wrote:
There is no doubt a considerable amount of abuse inconnection with the giving of out-relief – personsreceiving it who are not really destitute, or who haverelations who could and should maintain them, whilstothers receive it only to spend it upon drink. Not a fewsuch cases have come under the notice of the writerduring the course of the present investigation. This doesnot, however, necessarily, nor in fact does it at all, reflectupon the honesty or ability of the relieving officers. Butthe number of these is inadequate, there being only twofor the whole city. The abuse points, however, to thenecessity of appointing a Superintendent RelievingOfficer, for it must be borne in mind that ill-administeredoutdoor relief not only entails financial waste, but has aserious demoralizing effect upon the community.
The next chapter turns to the solutions, albeit partial, that weredeveloped over the last century, both in attempting to reducepoverty, and to cope with such concerns.

Part IIA century of policy responses


63
Twentieth century Britain inherited a unique poor lawtradition, much derided and much misunderstood. Reformers inthe first half of the century tried to transform that poor lawtradition into a social insurance based model. With theBeveridge Report of 1942 and the legislative changes of the1940s, they seemed to have succeeded. Yet that was not to be.The comprehensive post-war social insurance schemes nevereliminated poverty or major dependence on the old publicassistance tradition. At the end of the century a new modernversion of targeted aid to the poor emerged, includingsupplementing the wages of the working poor.
As Jose Harris has put it:
From the 1900s onwards . . . the poor law system in Britainwas continually supplemented, and appeared eventuallyto be ousted, by a series of alternative income-supportpolicies based largely on social insurance; the climax of thisprocess with the formal ‘abolition of the poor laws’ in1948 was felt by many to be a defining moment in Britain’spost-war history. Yet from the early 1960s, welfarestructures covertly bequeathed from the poor laws beganto re-emerge in British social policy as the majorinstrument of publicly-funded income support; at the endof the century Britain once again had the most profoundlypoor-type welfare system of any country in Europe. What
5 Poverty policy from 1900 to the1970sHoward Glennerster

One hundred years of poverty and policy
64
accounts for the strange survival of this supposedly much-hated institution?’ (2002, p. 410)
In order to try to answer that question we need to reflectbriefly on the significance of that poor law tradition in Britain.
The roots of poverty relief: A distinct traditionThe First Tudor poor laws date from 1495 when the dilemmasposed by the poor were a topic of moral and political debateacross Europe (Innes, 1998, 1999; Michielse, 1990; Slack, 1988,1990). What balance should be struck between private charityand public concern for good order?
Prior to that time the predominant view was that the poorwere a proper charitable concern of the faithful. Monasteries,almshouses, guilds, donations to the poor of the parish wereprivate activities. The state confined itself to punishingvagabonds.
Rising concern for and fear of the poor and the need to thinkrationally about some organised responses to poverty wereargued by Erasmus and Juan Luis Vives (1492–1540) andpioneered in both Catholic and Protestant European cities fromYpres, Strasbourg and Geneva to Lyon and Tudor London.
In contrast to the previous system of Christian charity andthe medieval view of poverty, the main characteristics ofthe new approach to poor relief can be summarised asfollows: the social salvation of the recipients rather thanthe spiritual salvation of the donors took precedence;secular rather than church authorities became the centralagents of poor relief; the maze of independentinstitutions was replaced by a central institution, the‘common chest’; begging was prohibited, no longer anaccepted practice of the paupers Christi; and the centralconcern was no longer benevolence but the subjection of

65
the poor to a systematic and disciplinarian program ofeducation and improvement. (Michielse, 1990, pp. 2–3)
In fact, the tension between deeply held Christian humanistideals and a realist appreciation that charity could go too far,creating a pauper population, has been recurrent in debatesabout poverty policy right up to the present.
If these innovations and ideas were European-wide, Englandcame up with an unusual solution. A national framework ofduties was placed on parishes in their treatment of the poor in1597 and 1601, though with considerable local discretion aboutthe means employed. Such an approach was not so differentfrom some other countries but the general power to levy a taxto meet the expenses of poor relief was. The fact that thistaxing power was almost universally adopted by local parishesmeant England was following a distinctive route. It was muchcriticised as taking away the personal responsibility to give andleading to the excessive relief of the poor. It was wrong, criticsargued, because it embodied a ‘right to relief’ (Innes, 2002).
Poor relief took less than 1 per cent of the GDP in 1696 androse to 2 per cent by 1800. The numbers covered probably rosefrom about 3.5 per cent of the population in 1700 to 8 per centby mid century and 14 per cent by 1800 (Slack, 1990). It was theconsequent cost and the very existence of a national legislativeframework that attracted the attention of leading socialscientists of the day – not just Adam Smith and Malthus but awhole range of serious commentators, political economists andstatisticians (Blaug, 1963; Dunkley, 1982; Horne, 1986; Innes,1999). The concern was not just with the misguided actions of afew local burghers, as critics saw it. It was a national issue.Westminster chose to address the early nineteenth centurycritics by tightening the rules of access in the famous 1834reforms, but not by revoking the ultimate right to relief assome had urged. It was outdoor relief, cash given outside thedemeaning and rigorous workhouse that was frowned upon.
Poverty policy from 1900 to the 1970s

One hundred years of poverty and policy
66
The 1834 Act took poor relief out of the hands of amateurs,creating a body of professional staff who served the newamalgamated parish ‘unions’. It set out a national test of need,requiring relief for the able-bodied only in the workhouse,setting out regulations for the conduct of those institutions.The level of relief was also set. It should be lower than thestandard of life that could be gained from the lowest wage themarket would offer outside. This principle of ‘less eligibility’was not new, but it was given its classic articulation. It would bewrong too to give the impression that these principles wereuniversally implemented. Local traditions, ideologies of reliefalmost, the revenue available from the local rate and localeconomic circumstances differed widely. The Webbs made thispoint but there now is a vast modern literature on local poorlaw diversity (see Webb and Webb, 1929; Kidd, 1999; King,2000, for summaries).
The significance of national legislation and nationalguidelines should not be underplayed, however. After a strongupward trend in poor relief spending that had reached £7million in 1830, slightly down on 1820, it fell to £4.6 million by1840 despite a growing population, and the scale of relief in
The ‘Poor Law divorce’, 1846. When people entered the workhouse, married coupleswere forced to live and work separately.

67
relation to size of the population went on falling until the latepart of the century. Moreover, in its concern to contain the scaleof relief, central government created the most centralisednational pattern of poverty relief anywhere in Europe. Apowerful group of poor law inspectors began to shape localadministration and did so through to the 1930s. This involved ‘adegree of centralised bureaucratic control largely unknown inthe poor law systems of mainland Europe’ (Harris, 2002, p. 420).There was still much local variation and variation in treatmentby types of client – a hierarchy of ‘deservingness’. But it was anincreasingly centrally regulated safety net that became, bystages, a nationally administered and calculated safety net by1948. This was again a step ahead of European countries andNorth America. It was to have important implications for theeventual fate of the social insurance model in the twentiethcentury.
Those writing accounts of the history of social policy asrecently as the 1970s (Fraser, 1973) could present the story asone of gradual ‘progress’ – the Poor Law in all its evil formsgave way, in gradual stages, to a growing range of socialinsurance schemes that secured households against the maincauses of poverty. All this was underpinned by a comprehensivesafety net that caught the few who fell through. This insurancesystem had its faults but they were being systematically putright. The state had learned how to prevent long termunemployment. That was the story in outline. Yet, as the quotefrom Professor Harris with which we began shows, this is not astoryline modern social historians can adopt. Yet, at least until1948, it seemed a plausible account.
Escaping the Poor Law? 1900–48The Royal Commission on the Poor Laws which sat in the earlypart of the last century reflected, in its famous majority andminority reports (1909), the clash of ideas about the causes ofpoverty we discussed in our opening section – a clash that wasembodied in the formidable personalities of two women
Poverty policy from 1900 to the 1970s
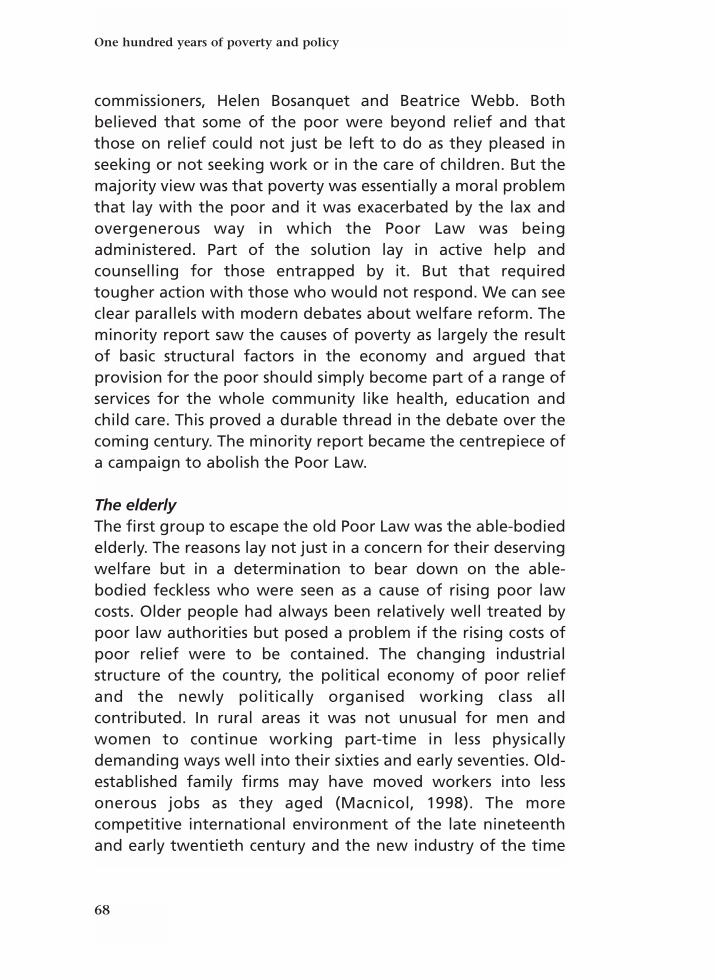
One hundred years of poverty and policy
68
commissioners, Helen Bosanquet and Beatrice Webb. Bothbelieved that some of the poor were beyond relief and thatthose on relief could not just be left to do as they pleased inseeking or not seeking work or in the care of children. But themajority view was that poverty was essentially a moral problemthat lay with the poor and it was exacerbated by the lax andovergenerous way in which the Poor Law was beingadministered. Part of the solution lay in active help andcounselling for those entrapped by it. But that requiredtougher action with those who would not respond. We can seeclear parallels with modern debates about welfare reform. Theminority report saw the causes of poverty as largely the resultof basic structural factors in the economy and argued thatprovision for the poor should simply become part of a range ofservices for the whole community like health, education andchild care. This proved a durable thread in the debate over thecoming century. The minority report became the centrepiece ofa campaign to abolish the Poor Law.
The elderlyThe first group to escape the old Poor Law was the able-bodiedelderly. The reasons lay not just in a concern for their deservingwelfare but in a determination to bear down on the able-bodied feckless who were seen as a cause of rising poor lawcosts. Older people had always been relatively well treated bypoor law authorities but posed a problem if the rising costs ofpoor relief were to be contained. The changing industrialstructure of the country, the political economy of poor reliefand the newly politically organised working class allcontributed. In rural areas it was not unusual for men andwomen to continue working part-time in less physicallydemanding ways well into their sixties and early seventies. Old-established family firms may have moved workers into lessonerous jobs as they aged (Macnicol, 1998). The morecompetitive international environment of the late nineteenthand early twentieth century and the new industry of the time
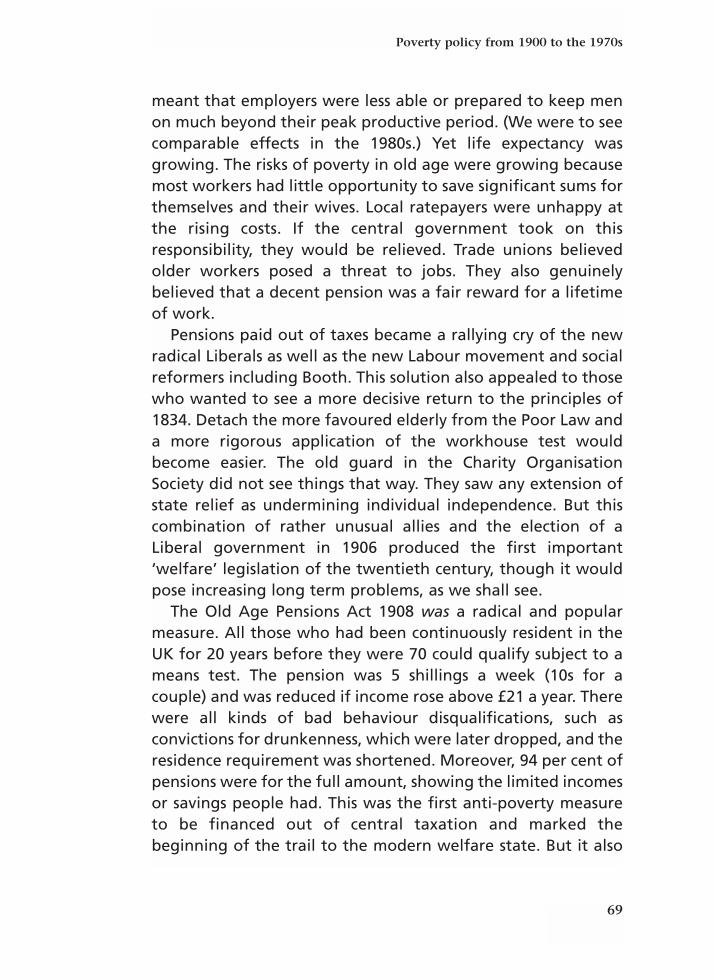
69
meant that employers were less able or prepared to keep menon much beyond their peak productive period. (We were to seecomparable effects in the 1980s.) Yet life expectancy wasgrowing. The risks of poverty in old age were growing becausemost workers had little opportunity to save significant sums forthemselves and their wives. Local ratepayers were unhappy atthe rising costs. If the central government took on thisresponsibility, they would be relieved. Trade unions believedolder workers posed a threat to jobs. They also genuinelybelieved that a decent pension was a fair reward for a lifetimeof work.
Pensions paid out of taxes became a rallying cry of the newradical Liberals as well as the new Labour movement and socialreformers including Booth. This solution also appealed to thosewho wanted to see a more decisive return to the principles of1834. Detach the more favoured elderly from the Poor Law anda more rigorous application of the workhouse test wouldbecome easier. The old guard in the Charity OrganisationSociety did not see things that way. They saw any extension ofstate relief as undermining individual independence. But thiscombination of rather unusual allies and the election of aLiberal government in 1906 produced the first important‘welfare’ legislation of the twentieth century, though it wouldpose increasing long term problems, as we shall see.
The Old Age Pensions Act 1908 was a radical and popularmeasure. All those who had been continuously resident in theUK for 20 years before they were 70 could qualify subject to ameans test. The pension was 5 shillings a week (10s for acouple) and was reduced if income rose above £21 a year. Therewere all kinds of bad behaviour disqualifications, such asconvictions for drunkenness, which were later dropped, and theresidence requirement was shortened. Moreover, 94 per cent ofpensions were for the full amount, showing the limited incomesor savings people had. This was the first anti-poverty measureto be financed out of central taxation and marked thebeginning of the trail to the modern welfare state. But it also
Poverty policy from 1900 to the 1970s

One hundred years of poverty and policy
70
A 1908 cartoon from Punch magazine showing Lloyd George as a highwayman,collecting funds for the new old age pensions.

Poverty policy from 1900 to the 1970s
71
posed dilemmas that are still with us. The pension was meanstested. It was a boon to those who had never had the chance tosave. But what would it do to the saving habits of those in thenext generation? Those who had saved, or been members of afriendly society or other scheme, lost any benefit as their statepension was docked pound for pound. Pressure grew to removethe means test or raise the income limit for the pension, lowerthe age at which it could be drawn and make it more generous,especially as the pension lost value with the inflation of the waryears. The Treasury began to worry that it had let loose a tigerthat would eat up its revenue.
One way out was favoured by many Liberals, the Treasuryitself and the ‘new’ Conservatives led by Chamberlain. Thestrategy was to adopt the route taken for the sick andunemployed in 1911 – ‘National Insurance’. Calls on theExchequer would be limited by making the worker and hisemployer responsible for the cost of pensions in the long term.Pressure for higher pensions would be tempered by theknowledge that this would result in higher contributions fromexisting workers. The costs would not be passed on to the well-off income tax payer. On the other hand, rights to benefitwould be earned by virtue of the contribution record, not ameans test, which would have advantages for the elderlyperson. More than one committee began work on the issue andthe failure of the minority Labour government of 1924 to comeup with any alternative left the new Conservative governmentwith the opportunity to take the decisive step towards a socialinsurance model – the 1925 Widows’, Orphans’ and Old AgeContributions Act.
A pension would be paid at 65 to all those who had beencontributing to the National Insurance schemes for sickness andunemployment and to wives and widows of contributors. Theold age pension scheme for those aged 70 would remain butwould no longer be means tested. In 1940 the old age pensionwas paid from the age of 60 for women who were insured intheir own right or where the husband had reached 65. The 1908

One hundred years of poverty and policy
72
scheme had been good for women. Right to benefit was basedon age and residence. Married women received the same sumas the husband. Under the new scheme women becamecovered dependent on the husband’s work record.
None of these measures removed all old people from povertyand the Poor Law, however. Many women who were single orwho had been deserted, divorced or separated were on poorrelief, as were those of both sexes who were not covered by afull contribution record or whose rents brought them belowthe means test level.
Only about 10 per cent of pensioners claimed publicassistance. But in 1940, yielding to growing pressure forincreased pensions across the board, the Treasury responded bysuggesting a much cheaper solution – an increase in thesupplement the poorest pensioners could receive on publicassistance. This was adopted in that year. Old age and widow
Old age pensioners marched from St Paul’s to the House of Commons in November1938 to demand an increase in pensions from 10 shillings to £1 a week.

Poverty policy from 1900 to the 1970s
73
pensioners could receive support from the national agency setup to provide assistance to the unemployed several yearsearlier, renamed the Assistance Board. The Treasury wasconvinced that few would be eligible. In fact 1.25 millionapplied in the first two months. Freed from the stigmaassociated with the local public assistance committees, more oldpeople were prepared to apply. This and the earlier creation ofthe Unemployment Assistance Board, as well as the latercreation of the National Assistance Board, were decisive moves.Faced with mounting all party pressure to raise pensions for all,the Treasury was able to persuade the government, as it was topersuade succeeding ones, that a much cheaper and moreeffective strategy lay in relieving the plight of the poorest alonethrough a national agency applying a national test of need. Itwas to emerge as the winning strategy of the latter half of thetwentieth century.
WidowsWidows were the next most blameless group. They could least ofall be blamed for their poverty. Male age-related mortality rateswere a third higher than female rates at the turn of the century(Kiernan, Land and Lewis, 1998). Widows’ causes had beensuccessfully championed in the United States at the end of thenineteenth century in a political climate very hostile to federalgovernment action. In a situation where most women weredependent on a man’s wage and premature male death wascommon, widowhood was a major risk and one that commandedpublic sympathy. Widows’ pensions were introduced for thewives of insured workers in the 1925 Act but the test ofrespectability remained. ‘Evidence of a new relationshipundermined a widow’s claim to support because it was assumedthe man involved would support her’ (Brooks, 1986).
SicknessLegitimate absence from work for short term ill health wasagain a deserving cause. It was something better off workers

One hundred years of poverty and policy
74
had clubbed together to support. Simple statistics suggestedlarger groups would be less vulnerable, hence the growth ofsome large national friendly societies. The fact that workerswere paying for each others’ sickness absence meant there wasa strong incentive to police false claims or overlong absence. Itwas this feature that Lloyd George thought would help preventabuse of any national scheme. Moreover, politically the friendlysocieties were both powerful and useful. They had the spreadof administrative capacity and were organised to do the job ofgiving out cash benefits to the sick and paying for treatment bythe general practitioner. They would need to be incorporatedin the administration of any national scheme. So, too, wouldthe profit-making industrial insurance companies that providedinsurance to cover the costs of burial on a large scale to theworking class and who promised to make things difficult if theywere left out.
This set a pattern for later social legislation. State provisionwas built around and accommodated existing non-governmental provision, though in the process it often stifledor restricted it. In many ways the rather complex administrationof a state benefit through very varied not-for-profit and profit-making organisations worked remarkably well (Whiteside,1983). It was, however, seen as deeply unfair by those who werenot in employment or insured occupations, and who wereexcluded. Small societies and those whose members weresickest could not provide the range of benefits others could.The rising level of unemployment put pressure on the financesof the schemes and was to lead to many losing their rights untilthe unemployed gained rights to medical benefit. Whitesideconcludes: ‘In short and simple terms [in a work based insurancescheme] the best lives, and the highest wage earners, win thebest treatment; the system penalises those not in the labourmarket and those dependent on them including theunemployed’ (1983, p. 191).

Poverty policy from 1900 to the 1970s
75
The unemployedIn good times at the turn of the century Rowntree had notfound unemployment to be a major reason for poverty in York.In the 1920s and especially the 1930s it was to become themajor scourge. The major industries that had been the mainexporters in the nineteenth century struggled after the FirstWorld War and through the 1920s. They were then hit by theworld economic crisis after 1929. This reached into manypeople’s lives and affected those who had never had toundergo the experience of poverty or the indignity of relyingon the local public assistance committee.
But this experience was not uniform. New industries weregrowing in the south. Prices fell, new mass produced consumergoods began to appear and those in work, especially in thesenew industries, did reasonably well. Most people were betteroff in 1939 than they had been a decade earlier.
‘Unemployment’ rates in 1932 varied for the differentregions of the country between 36 per cent in Wales and 13 percent in London and the South East. By the mid 1930s the
Homeless men at a soup kitchen in 1924. Lack of employment was an increasingcause of poverty during the 1920s and 1930s.

One hundred years of poverty and policy
76
disparity was even more striking, with unemployment rates insome towns in the depressed areas revealing tragic stories ofthe decay and impoverishment of whole communities; placessuch as Brynmawr, Dowlais, Jarrow, Gateshead, Greenock andMotherwell had almost three-quarters of the insuredpopulation out of work in 1934, while other parts of thecountry were experiencing almost boom conditions (Stevensonand Cook, 1979, p. 5). Special areas received rather late andinadequate assistance, but this was the beginning of what wetoday would call area based policy.
Economic theory was turned upside down. Unemploymentwas clearly not temporary or self correcting. Government cameto see it had a responsibility to affect the total level of demand.The Budget of 1942 was the first to recognise this responsibility.
The scale of unemployment shook the localised system ofpublic assistance to the core and transformed it. The means test
The Jarrow Crusade, 1936. Marching 300 miles from Jarrow in the north-east toLondon, the marchers wanted to highlight the poverty and mass unemployment theyand their families were facing.

Poverty policy from 1900 to the 1970s
77
and the local administration of poor relief became the focus ofbitter working class protest. Local areas could not support theburden out of local taxes. In 1931 the Treasury had to takeresponsibility for those who were unemployed long term andwho had lost their insurance rights. A national UnemploymentAssistance Board took over responsibility for this group in 1935and administered the first nationally funded safety net for theunemployed, not as a way of being more generous or equitablebut to contain spending. The administration of welfare becamethe object of huge organised protests that did succeed inreversing benefit cuts. The logic of national responsibilityinherent in the Tudor poor law had finally come home to roost.
Family and child povertyThe central feature of Rowntree’s original diagnosis, theparticular needs of families with children, had not beenaddressed despite the analytical and advocacy work ofRathbone (1917, 1924), many in the suffragette movement andthe conversion of key reformers like Beveridge to familyallowances and Rowntree’s minimum wage proposal. The issuehad been addressed in France and the reasons are interesting.The British trade unions saw children as a useful bargainingchip in arguing for a living family wage. French employers sawthe advantages of denying that lever. If employers collectivelyredistributed the rewards of labour to reflect the number ofchildren in the family, pressure to raise the total wage bill mightbe mitigated. The pro-family attitude of the Catholic Churchand the pro-natalist stance of government were conducive tothis strategy succeeding.
In 1932, the state extended these benefits by requiring allemployers in industry to affiliate to one of the private,business-controlled funds (caisses de compensation) thathad been set up to equalise the costs of such benefitsacross firms in particular sectors or regions. Familyallowances were extended to agricultural workers and

One hundred years of poverty and policy
78
small farmers in the years immediately before the SecondWorld War. (Pedersen, 1993, p. 17)
France thus made far more extensive and explicit provision fordependent children in the interwar period than did Britain. Yetit did not do so in the way Eleanor Rathbone would havehoped.
Children drinking milk at school in 1938. Local authorities wereempowered to provide free milk from 1921; in 1946 the School MilkAct ordered that all pupils under 18 should rececive one-third of a pintof milk per day.

Poverty policy from 1900 to the 1970s
79
If we can characterise British social policy as thearticulation of a male breadwinner logic of welfare,French policies come to rest on a very different logic,which I will term ‘parental’ . . . Put simply, while male-breadwinner policies compensate men for dependentwomen and children during legitimate interruptions ofearnings, states with parental policies compensate adultsfor dependent children irrespective of earnings or need. (Pedersen, 1993, pp. 17–18)
The Beveridge Report and the end of poverty?So as the Second World War approached the gradual evolutionof a social insurance state was well underway (see table 8).
It was this complex system of multiple and partial socialinsurance schemes that Beveridge was appointed to sort out.But Beveridge interpreted his brief in a much more ambitiousway (Harris, 1997). He saw his role as setting out a programmeof reform – ‘a social plan’ – that would, once and for all, abolishpoverty. In those heady post-war days many thought this hadbeen, or would shortly be, accomplished.
Beveridge convinced himself, reading Rowntree’s new studyof poverty in York (1941), that a reform of the insuranceschemes we have described and their extension to the wholepopulation would be enough to abolish ‘want’ so long as they
Table 8: The growth of social insurance (numbers insured in 000s)
Unemployment Health Old age, widows, orphans
1914 2,500 13,689 –1921 11,081 15,165 –1926 11,774 16,375 17,0891931 12,500 17,353 18,513 1936 14,580 18,081 19,651 1938 15,395 19,706 20,678
Source: Beveridge (1942), p. 213.
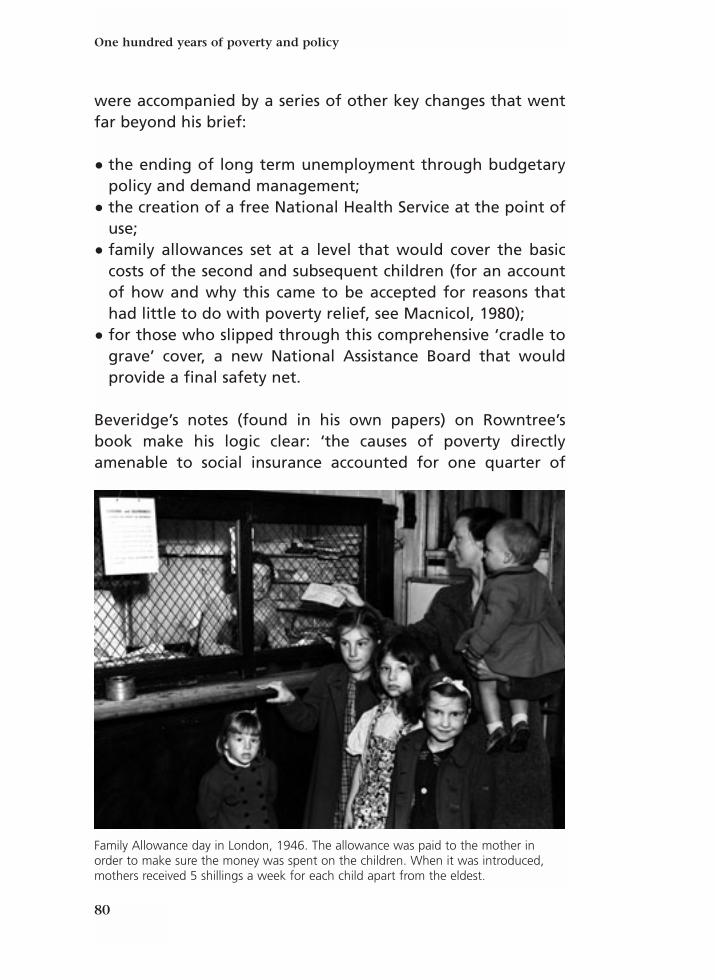
One hundred years of poverty and policy
80
were accompanied by a series of other key changes that wentfar beyond his brief:
• the ending of long term unemployment through budgetarypolicy and demand management;
• the creation of a free National Health Service at the point ofuse;
• family allowances set at a level that would cover the basiccosts of the second and subsequent children (for an accountof how and why this came to be accepted for reasons thathad little to do with poverty relief, see Macnicol, 1980);
• for those who slipped through this comprehensive ‘cradle tograve’ cover, a new National Assistance Board that wouldprovide a final safety net.
Beveridge’s notes (found in his own papers) on Rowntree’sbook make his logic clear: ‘the causes of poverty directlyamenable to social insurance accounted for one quarter of
Family Allowance day in London, 1946. The allowance was paid to the mother inorder to make sure the money was spent on the children. When it was introduced,mothers received 5 shillings a week for each child apart from the eldest.
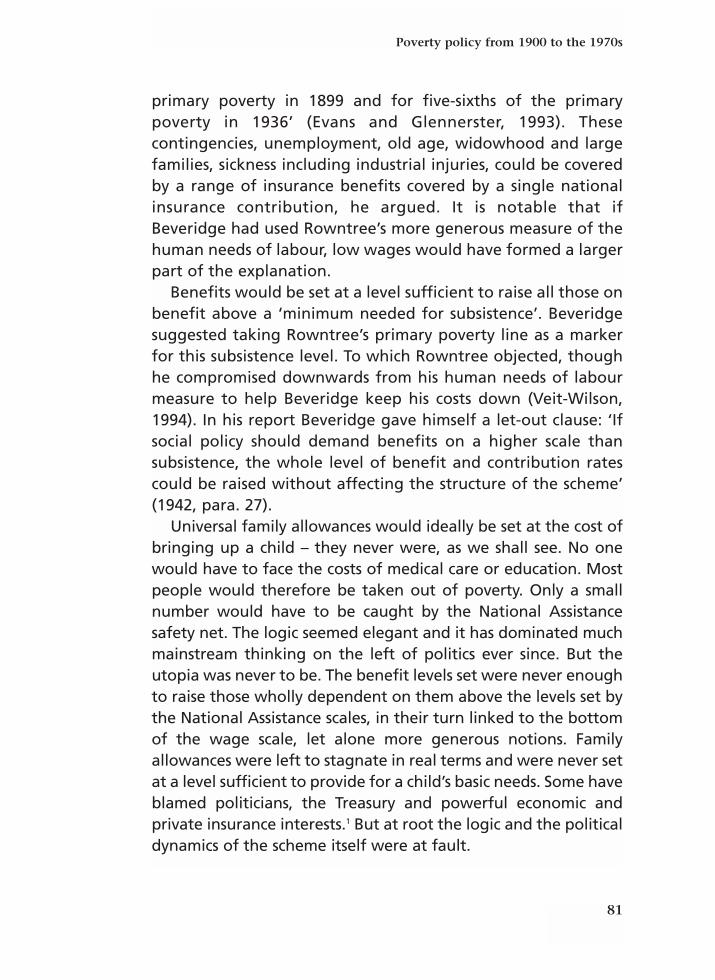
Poverty policy from 1900 to the 1970s
81
primary poverty in 1899 and for five-sixths of the primarypoverty in 1936’ (Evans and Glennerster, 1993). Thesecontingencies, unemployment, old age, widowhood and largefamilies, sickness including industrial injuries, could be coveredby a range of insurance benefits covered by a single nationalinsurance contribution, he argued. It is notable that ifBeveridge had used Rowntree’s more generous measure of thehuman needs of labour, low wages would have formed a largerpart of the explanation.
Benefits would be set at a level sufficient to raise all those onbenefit above a ‘minimum needed for subsistence’. Beveridgesuggested taking Rowntree’s primary poverty line as a markerfor this subsistence level. To which Rowntree objected, thoughhe compromised downwards from his human needs of labourmeasure to help Beveridge keep his costs down (Veit-Wilson,1994). In his report Beveridge gave himself a let-out clause: ‘Ifsocial policy should demand benefits on a higher scale thansubsistence, the whole level of benefit and contribution ratescould be raised without affecting the structure of the scheme’(1942, para. 27).
Universal family allowances would ideally be set at the cost ofbringing up a child – they never were, as we shall see. No onewould have to face the costs of medical care or education. Mostpeople would therefore be taken out of poverty. Only a smallnumber would have to be caught by the National Assistancesafety net. The logic seemed elegant and it has dominated muchmainstream thinking on the left of politics ever since. But theutopia was never to be. The benefit levels set were never enoughto raise those wholly dependent on them above the levels set bythe National Assistance scales, in their turn linked to the bottomof the wage scale, let alone more generous notions. Familyallowances were left to stagnate in real terms and were never setat a level sufficient to provide for a child’s basic needs. Some haveblamed politicians, the Treasury and powerful economic andprivate insurance interests.1 But at root the logic and the politicaldynamics of the scheme itself were at fault.

One hundred years of poverty and policy
82
For 30 or more years after the national insurance scheme wasfounded in its modern post-Beveridge form Labourgovernments sought to remedy some of its defects whileConservative governments resisted, never having accepted thecost consequences its full logic demanded. Nor, it has to be said,did Labour governments, in practice.
From Beveridge to the 1970sFundamental flaws in the Beveridge modelSome of the flaws were evident at the time. The cost of whatBeveridge wanted to do was simply not acceptable to theTreasury then or subsequently. In trying to squeeze the packageinto an acceptable cash constraint the integrity of the packagefell apart. A few examples illustrate this:
• The assumption was that setting universal flat rate insurancebenefits at Rowntree’s primary poverty level would lift allthose on such benefits out of poverty. This ignored the widediversity of rent levels faced by people in different parts ofthe country, as Rowntree and others pointed out (Glennersterand Evans, 1994). Excluding rent from his calculation meantthat most poor people would still be subject to a means testby the National Assistance Board to meet their rent. HousingBenefit now covers the rental housing costs of the poor but itdoes so at the cost of including a wide range of households ina means tested poverty trap. Sixty years on we have notsolved the problem that defeated Beveridge.
• If the model were to work, it had to work for pensioners andit did not (Macnicol, 1998). Giving a universal flat rate pensionmeant spending most money on the non-poor and limited thegenerosity possible given the budgetary limits the Treasurywas setting. If the funds were not to come from taxation (asBeveridge agreed they should not in the long run), the fundshad to come from a flat rate insurance contribution. Thiswould bear heavily on the poor. Beveridge stuck to the notionof a flat rate contribution established at the beginning of the

Poverty policy from 1900 to the 1970s
83
century as a way of restricting the scope of the potential cost.The Treasury was determined the scheme should not be aburden on the general taxpayer. The trade unions argued thatthe costs on the low paid should not be excessive. What gavewas the benefit level. Though the pension proposed byBeveridge was raised by the 1945 Labour government, theessential problem was never solved by it or by successivegovernments. The attempt to introduce benefits related toprevious wages came too late. The political dynamics set up bythe initial low rates of pension proved irreversible (see below).
• The scheme confined married women to the status ofdependents. Single women would be treated as contributorslike men. Marriage was an insurance contract, Beveridgeargued. A woman’s needs were met by her husband. Theyshould be treated as a unit and she would be insured, aswould her children, as dependents of her husband. Rights tobenefit relied on the husband’s work. Women’s incentives towork, especially for low pay, were small. Since Beveridge wasso concerned with raising the birth rate this was a virtue forhim, but it was to lay up serious problems for the future.
• The disabled who were not disabled at work or by war werenot included in his scheme of things.
Now some of these flaws were capable of remedies. The basisof the contributions and benefits could become income related,as was to be the case in other European countries and America.Women could be treated as insured in their own right. Specialtax based schemes for the disabled could be introduced. Benefitlevels could be made more generous. All these were to becomethe stuff of successive attempts to reform the nationalinsurance system from 1958 to 1975. In the end they too failed.
Dynamic flawsThe political dynamics set up by the Beveridge plan were toprove disastrous to any coherent poverty programme in thenext decades.

One hundred years of poverty and policy
84
• State benefit levels were constrained by what the poorestcould contribute – deliberately so, many would argue. It wasone of the attractions of the flat rate model to the Treasury.This meant that skilled workers, let alone the middle class,never saw the state pension scheme as sufficiently generousto rely on in old age. They negotiated their own occupationalpension alternatives. This created a powerful set of intereststhat opposed going down the road of a generous wage-related alternative. When the Labour Party began to discuss awage related alternative, moving to a copy of the US, Swedishand German models, in the 1950s, the trade unions weresome of the strongest opponents. Private pension companieshad a powerful voice and no state scheme could beintroduced which threatened them. The basic Beveridgepension scheme became less important to the median voterand to the poor. When Mrs Thatcher’s government broke thelink between benefit rates and average earnings in the 1980s(see chapter 6) it did so largely with political impunity.
• When the post-war pension scheme was re-examined in the1950s, and on subsequent occasions, the killer question was:why should we spend a lot of money raising the basic pensionor other benefits for most people when the poorest arealready catered for by the National Assistance scheme? TheWilson government of 1964 did significantly raise the level ofthe basic pension and other basic benefits. But it came underpolitical pressure to raise the level of National Assistance too.Otherwise the poorest, and especially poor elderly people,would not gain. So a very expensive policy ‘floated off’ veryfew people from means tests.
• The 1974 Labour government again raised the basic pension,this time by 30 per cent in money terms and 12 per cent in realterms. It also brought in the State Earnings Related PensionScheme. This was the last attempt to make the universalNational Insurance model work. But it came too late. MrsThatcher came to power and both reduced the generosity ofthe scheme and encouraged many not to join it, with

Poverty policy from 1900 to the 1970s
85
significant tax relief for joining private pension schemesinstead. There was no large body of middle class pensionerswho saw it as in their interests to defend the state scheme, asthere has been in the US.
Poverty disappears and reappearsIt took time for the weaknesses of the post-war settlement tosink in. Compared to the 1930s, the 1940s were indeed animprovement. Rowntree’s third study of York (Rowntree andLavers, 1951) made the case. It was based on a sample survey.Rowntree had at last convinced himself that this was alegitimate method! It was brief. The baseline was again aprimary poverty line. The diets of 1936 had been slightlymodified and some changes had been made in the estimates ofa family’s need for clothing, fuel, light and sundries. In 1936,17.7 per cent of the total population had been below thepoverty line. In 1950 the figure was only 1.6 per cent. Old agewas the main contributory factor at 68 per cent of the total,and the sick made up 21 per cent. Rowntree and Lavers claimedthat without the welfare measures including food subsidiesintroduced after the Second World War, poverty would havebeen much higher than it actually was – 25 per cent!
Poverty disappeared from the political radar in the 1950suntil the end of the decade, when work on poverty among theelderly resurfaced (Cole and Utting, 1962). Later work onRowntree’s last results threw some doubt on them. Abel-Smithand Townsend (1965) used the national sample provided by theFamily Expenditure Survey and updated Rowntree’s povertyline in line with prices as a check on their own findings for1953/54 (see below). They found 5.4 per cent of households inpoverty. When Atkinson and colleagues (1981) reanalysedRowntree’s data using the then National Assistance Board scalesas the poverty line they found that 14.4 per cent of workingclass households would have been judged poor.
More recently Hatton and Bailey (2000) have reanalysed thesame material to test Rowntree and Lavers’ claim that poverty
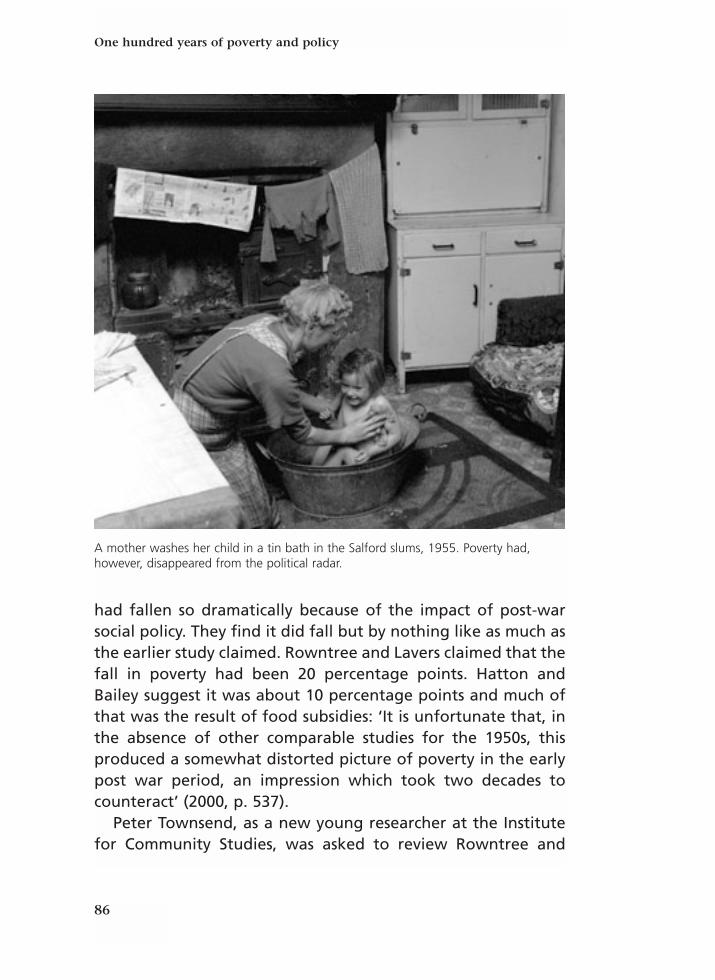
One hundred years of poverty and policy
86
had fallen so dramatically because of the impact of post-warsocial policy. They find it did fall but by nothing like as much asthe earlier study claimed. Rowntree and Lavers claimed that thefall in poverty had been 20 percentage points. Hatton andBailey suggest it was about 10 percentage points and much ofthat was the result of food subsidies: ‘It is unfortunate that, inthe absence of other comparable studies for the 1950s, thisproduced a somewhat distorted picture of poverty in the earlypost war period, an impression which took two decades tocounteract’ (2000, p. 537).
Peter Townsend, as a new young researcher at the Institutefor Community Studies, was asked to review Rowntree and
A mother washes her child in a tin bath in the Salford slums, 1955. Poverty had,however, disappeared from the political radar.

Poverty policy from 1900 to the 1970s
87
Lavers and was not convinced. It led him to a lifetime of workthat has changed the way we think about poverty in mostdeveloped economies, with the exception of the United States(Glennerster, 2002).
His central point was that we cannot determine a level ofadequacy simply by virtue of some expert calculation of dietaryor health needs. Social custom requires that we share cups oftea with neighbours or buy presents for our children atChristmas, even have the occasional pint. It is certainly true thatRowntree recognised this in 1901, as Veit-Wilson (1986) has soforcefully argued. But, as we have shown, the primary povertynotion took on its own life and even Rowntree had in practiceabandoned the secondary measure by the time Townsend waswriting. To be income poor, in Townsend’s terms, was to beexcluded, by virtue of one’s income, from the normal activitiesof social life. Townsend thought that it should be possible toconstruct a list of activities which were the ones that peopleshould be able to undertake if they were not to suffer what wemight today call social exclusion (Townsend, 1979). This led toconsiderable controversy about those activities and whetherthere was any clear point at which not to be observed doingthem could be linked to a poverty line (Piachaud, 1981; Desaiand Shah, 1988).
In the interim, however, Townsend and Brian Abel-Smith, hiscolleague at the London School of Economics, took a pragmaticapproach to measurement. Each year Parliament itself made ajudgement about what was a minimum acceptable level ofincome in the UK when it set the National Assistance rates. Whynot take that National Assistance rate, plus rent which theBoard usually paid, plus some more to cover the extras manypeople gained as additions to the basic rate, and use that as anindication of ‘low levels of living’? To take the crude basic ratewould have ignored the fact that some income was‘disregarded’ by the Board – small earnings, disability pensions,war savings and the like. Various percentages above the baserate were chosen but the favoured one was 40 per cent above.

One hundred years of poverty and policy
88
They made it clear that this was only a crude first step and thatbetter ways of measuring relative poverty were needed (Abel-Smith and Townsend, 1965, pp. 62–3).
Using an official sample survey of the incomes of families(designed to be used to construct the Retail Price Index), theywere able to estimate how many people were living below thispoverty line (Abel-Smith and Townsend, 1965). In 1960 theyfound it was nearly 18 per cent of all households (14 per cent ofpeople). The comparable figure in 1953/54 had been 10 percent of households and 7.8 per cent of persons. Numbers ofelderly poor had grown but, as the authors put it, ‘Possibly themost novel finding is the extent of poverty among children. . . .This fact has not been given due emphasis in the policies ofpolitical parties’ (1965, p. 65).
There was controversy about the report and criticismparticularly of the comparisons with 1953/54. NationalAssistance rates had risen in real terms since 1953, critics said, soof course the numbers of poor had risen. Relative standards ofliving had risen and, just as with Rowntree, the official povertyline had risen to take that into account, as the authors hadargued in the report itself (1965, pp. 16–20).
To meet these criticisms later official measures were to useincome relative to a national mean or median income – 40 percent, 50 per cent of the mean income or more recently 60 percent of the median.
These technical arguments aside, the wider public, assistedby the work of the Child Poverty Action Group (CPAG),absorbed and accepted the basic argument. The result was toput poverty back on the political map. Social science had ‘liftedthe curtain’ once again so that the comfortable majority had toconfront the reality of life at the bottom.
Child poverty became a political issue again. Familyallowances had been held constant in cash terms since the early1950s. They were gradually wasting away in real terms andrelative to earnings. They were increased in 1968 as a result ofthe political pressure CPAG was able to exert across the political

Poverty policy from 1900 to the 1970s
89
spectrum. The standard rate taxpayer had the extra cash fullytaxed away. The Conservative government that followedintroduced the Family Income Support (FIS) scheme as one of itsfirst measures in 1970 – the alternative the Treasury hadfavoured all along. It was a separate tax-funded benefit thatlow income families had to apply to get through local socialsecurity offices. Many did not – initially about 30 per cent -though take-up gradually rose to over 80 per cent in the 1980s.Numbers on the benefit, and its successor, the Family Credit,rose from about 100,000 in 1973 to over half a million by themid 1990s, mostly because family poverty grew.
The Labour government that followed kept FIS butintroduced an extended version of the old Family Allowancecalled Child Benefit, which we still have. It was both moregenerous and went to the first child as well. It was paid for inlarge part by removing the tax advantages previously derivedby taxpaying families and especially those paying tax at highlevels from child tax allowances.
The same government tried to remedy the deficiencies of theflat rate state pension by introducing a wage related scheme ontop, the State Earnings Related Pension Scheme (SERPS). Thishas since, indeed, topped up the pensions of many pensionersto raise them above the poverty line. But those in occupationalschemes were always able to opt out. It never had time tobecome embedded in the political landscape and attract thepowerful support enjoyed by the American, Swedish or Germanpension arrangements.
The other significant development of the 1970s was therecognition of the particular needs of those with disabilitiesand resulted from well organised groups and well articulatedneeds. Beveridge had largely ignored them except for thosedisabled at work or fighting in a war. The AttendanceAllowance was introduced in 1972. A Mobility Allowance forthose who found difficulty in getting about and who neededmore costly forms of transport, an Invalid Care Allowance forthose looking after those needing special attention, and other
One hundred years of poverty and policy
90
non-contributory benefits were introduced in 1976. They tooksome account of the extra costs disability caused. A given levelof income might be above the poverty line for a fully mobileperson but not for someone who needed more income to beequivalently mobile. This was an extension of the meaning andconcept of poverty, as well as being important to thosereceiving the benefits. Numbers receiving AttendanceAllowance rose from 145,000 to over 900,000 between 1973and 1991. Numbers on Invalidity Benefit and SevereDisablement Allowance rose from 104,000 to 326,000 between1973 and 1994. Numbers receiving Mobility Allowance rosefrom 62,000 in 1977 to nearly 700,000 in 1991 (Evans, 1998).
Women’s poverty rediscoveredAnother important feature of social science research begun inthe 1970s and 1980s was the re-emergence of a feministperspective on poverty. Poverty had its most profound impact onwomen and yet this was not seen or appreciated – ‘InvisibleWomen, Invisible Poverty’ as Jane Millar and CarolineGlendinning (1987) put it. Some of the insights were not new, aswe saw earlier, but they were deepened and extended. Newwork was done on the distribution of income within the familyand the importance of getting income to the mother (Pahl1989). That was, in the end, to bear some fruit in the changesthat were made to the tax credit schemes in the New Labourperiod. The work on the financial and other needs of carerswhich began in this period was mostly done by women (Parker,1985; Glendinning, 1992). So, too, was the thorough and non-judgemental work on the change in families and singleparenthood (Kiernan, Land and Lewis, 1998). Policy makers nolonger have the excuse that these poverty situations are hidden.
Gathering cloudsThe anti-poverty measures up to the mid 1970s do thereforehave some kind of logical sequence. The needs of new povertygroups came to be articulated and pressed home. The scale and

Poverty policy from 1900 to the 1970s
91
breadth of the safety net was gradually widened, even if itsgenerosity was not. Social insurance remained the preferredsocial policy method for poverty avoidance, even if individualsin the top income groups had come increasingly to rely onoccupation based forms of insurance against old age and shortterm sickness. It was the late 1970s and 1980s that brought thesignificant change both in the scale of the poverty problem andin the nature of the social policy response (Glennerster, 2000;Lowe, 1999).

92
It is tempting to try to divide periods of social policy and theevolution of their outcomes by neat political divisions – theelection of the Conservative government of Margaret Thatcherin 1979, or of the ‘New Labour’ government of Tony Blair in1997 being two of the most obvious discontinuities. However,events and policies do not necessarily change with such abruptboundaries.
6 The last quarter centuryFrom New Right to New LabourJohn Hills
When the Thatcher Government came to power in 1979, income inequality andpoverty were near to an all-time low. Two major policy directions of the newgovernment were to restrain and reduce public spending – of which social securitywas a major part – and improve incentives to work.

93
For instance, one of the defining features of the Thatchergovernment was its aim of reducing public spending, particularlythat on the ‘welfare state’. But the post-war growth of socialspending as a share of national income ended not in 1979, but in1976, after the Labour cabinet minister Tony Crosland hadannounced that ‘the party is over’ and after the visit of theInternational Monetary Fund. And public spending restraintcontinued after May 1997, with New Labour fulfilling its electionpledge to stick to Conservative spending plans for two years. By1999/00, overall public spending (Total Managed Expenditure)had fallen to 37.4 per cent of GDP, fully two percentage points ofnational income below the lowest level achieved under theConservatives (in 1988/89), and four points below the minimumunder the Heath government of the early 1970s.
Similarly, perhaps the most important change in policytowards social security and poverty introduced by the Thatchergovernment was its decision in 1981 to adjust (‘uprate’) thevalue of social security benefits each year only in line with priceinflation. For some key benefits, such as the basic stateretirement pension, this broke with the previous policy ofadjusting values in line with earnings growth. This makes iteasier for the public finances to cope with benefit spending (astax revenues tend to rise at least in line with incomes) butleaves those dependent on benefits further and further behindgeneral living standards, and deeper in poverty (if a relativepoverty line is used, as discussed in chapter 3 above). But NewLabour has not reversed this decision as a default for mostbenefits. Instead, since 1999 it has been making selectiveincreases in some benefits but not others, and devotingresources to reforms such as the new ‘tax credits’. Many peoplehave done better than they would have done under a policy ofreturning to earnings indexation without reform, but othershave not and continue to live on incomes that are falling inrelative terms.
In terms of outcomes, we have already seen in chapter 3(figures 5 and 6) that relative poverty for the population as a
The last quarter century

One hundred years of poverty and policy
94
whole reached a low point in the late 1970s. So did measures ofthe inequality of the income distribution. But depending on theexact measure chosen, the low point can be seen to be any ofthe years 1977, 1978 or 1979. The turning point in what somehad come to see as Britain’s steady progress towards becominga more equal society did not necessarily coincide with thechange of government, even if some of the Conservativegovernment’s policies would greatly accelerate that change.
This chapter therefore tries to take an overview of the last 25years, looking across some of the themes which have beendiscussed in earlier chapters: overall policy towards poverty;public spending; the structure of social security; families andchildren; unemployment and incentives; and old age. It thenlooks at the outcomes of these policies and of other pressureson poverty rates.
Policy towards povertyPoverty, inequality, and policies to reduce them, were not highon the Thatcher government’s agenda. The Royal Commissionon the Distribution of Income and Wealth established byLabour was wound up. The government tried hard (ifunsuccessfully) to bury the report commissioned by Labourfrom Sir Douglas Black’s committee on health inequalities andtheir links to poverty when it appeared in 1980. Aninterdepartmental Group on Poverty Study was tellinglyrenamed as the working group on Work Incentives and IncomeCompression (of which the author became a member), and itspriorities for policy reform changed accordingly. Famously, in1989 the then Social Security Secretary, John Moore, announced‘the end of the line for poverty’, arguing that it was ‘false anddangerous’ to talk as if large parts of the British populationwere in dire need on the basis of poverty lines that rose withnational prosperity (Timmins, 1995, pp. 450–1).
In one sense, the change in political priorities isunderstandable. Income inequality and poverty (whethermeasured in relative or absolute terms) were near to their all-

95
time lows in 1979. Equally, economic growth and growth ofaverage living standards had also been at post-war lows sincethe oil shocks of the early 1970s. The diagnosis of the incominggovernment was that the two were connected – via thedisincentive effects of overgenerous social security benefits onthe one hand, and by the effects on economic and productivitygrowth of an overlarge public sector on the other. Its policieswere therefore aimed at restraining and reducing publicspending – of which social security was a major part – and atchanging the system to improve incentives to work. Ifchallenged on the impact of such policies on the poor, theresponse echoed that of the parallel Reagan administration inthe US in the 1980s – that the benefits of faster growth in livingstandards for those with high incomes allowed by lower taxeswould ‘trickle down’ to those at the bottom.
There was little evidence of this happening in the 1980s.Instead, poverty and the response to it became dominated byfour upward pressures. First, Britain went into deep economicrecession in the early 1980s, followed by a brief boom in thesecond half of the decade, and then a renewed leap inunemployment at its end. Much of the subsequent evolution ofsocial security can be seen as a response to this and its impacton public spending. Second, at the same time as the rise inunemployment and economic inactivity, the position ofunskilled workers was weakening more generally in the labourmarket – the real value of the level of wages below which thebottom tenth of male earners fell was no higher in the early1990s than it had been in the mid 1970s (Barclay, 1995, fig. 6).Third, society was changing. While 12 per cent of children wereliving in lone parent families in 1979, 20 per cent of childrenwere by 1997. Such families were much more likely to bewithout an income from work and in poverty than others, andthe ‘breadwinner’ based social insurance system bequeathed byBeveridge did little to help. Fourth, the country was ageing andthe number of pensioners growing. While this was not in itselfat such a dramatic rate, the cost of state pensions was set to
The last quarter century

One hundred years of poverty and policy
96
grow rapidly as Barbara Castle’s State Earnings Related PensionScheme matured. Under its rules, full rights could accrue in 20years, so someone with average earnings retiring in 1998 couldreceive an extra earnings-related pension from the state almostequalling in value what the basic pension had been in 1978.Although the rules were made less generous (for those retiringlater) in 1988, proposals to abolish SERPS outright wererejected, and its cost grew.
All this left a contradiction in policy which has yet to beresolved. Attempting to restrain public spending growth in theface of such pressures, while avoiding outright cuts in benefitsfor the poorest, pushed governments particularly in the 1980stowards more reliance on the social safety net of what wasSupplementary Benefit (and became Income Support) and onother forms of means testing. But this reliance increases thenumber of people affected by the disincentive effects ofwithdrawal of means tested benefit, contradicting the otheroverarching aim of policy of improving incentives.
Under John Major’s government of the 1990s, policy became
Minimum wage protesters in Brighton in 1995. Wages for the lowest paid were no higherin real terms in the early 1990s than they had been in the early 1970s.
97
less harsh. The regressive Poll Tax, used to finance localgovernment through a flat rate charge on all adults, wasabolished and replaced with the property related Council Tax.Crucially for the poorest, the right to an income related rebateof up to 100 per cent of the new tax’s value was restored,whereas in theory everyone had been liable to pay at least 20per cent of the Poll Tax, no matter how low their income. Whentax rises came after the 1992 election, they bore more heavilyon those with higher incomes. For a period in the mid 1990s,while average living standards rose only slowly, relative povertyfell slightly, and the growth in overall inequality halted.
Labour’s election campaign in 1997 said and promised littleabout poverty. The manifesto contained just two references topoverty, one in the context of tax and benefit reform to reducewelfare dependency, and the other about helping people intojobs. It did promise to tackle educational disadvantage, tointroduce a minimum wage, and to reduce long termunemployment, particularly among young people. One of thefive ‘early pledges’ around which Labour built its campaign wasto cut youth unemployment, using resources from a ‘windfalltax’ on the privatised utilities.
In office the first move was indeed the introduction of the‘New Deal’ programmes designed to get people off benefitsand into work. Shortly after the election the governmentannounced a new Social Exclusion Unit , reporting directly tothe Prime Minister, and focusing on problems of compoundeddisadvantage, particularly those that cut across Whitehalldepartments. At one point, Tony Blair described the unit as ‘thedefining difference’ between New Labour and theConservatives. However, in the autumn of 1997, New Labourfound itself embroiled in a row around the abolition of specialadditional benefits for lone parents. This had been built intothe Conservative spending plans to which Labour hadcommitted itself, and the government pushed it throughdespite significant opposition from its own Members ofParliament. By the time of the March 1998 Budget it became
The last quarter century

One hundred years of poverty and policy
98
clear that benefits and new tax credits were to be improved forall low income families in a way that meant few lone parentswould actually lose out (indeed, they have been the largestgainers from New Labour’s reforms). But by then many people’sviews of New Labour’s priorities had been set and they wouldbe slow to change.
In terms of policy presentation, the decisive moment came inMarch 1999, when Tony Blair used a lecture in memory ofWilliam Beveridge to announce: ‘Our historic aim will be forours to be the first generation to end child poverty. It is a 20-year mission, but I believe it can be done’ (Blair, 1999). This wasfollowed up by a specific target to cut child poverty in relativeterms (against a benchmark of 60 per cent of current medianincome) by a quarter between 1998/99 and 2004/05. In 2004
In his Beveridge Lecture in 1999 Tony Blair pledged to eradicate child poverty within a generation.

99
that target was further extended to achieve a cut of a half by2010/11, with the 20-year target now defined as being‘amongst the best in Europe’ in terms of relative poverty – stillvery ambitious given Britain’s starting point as the worst inEurope in the mid 1990s, with rates three to four times those insome Scandinavian countries.
In September 1999 the government also published its firstannual report of progress on poverty and social exclusion,Opportunity for All. This outlined what the government saw asthe key features driving poverty and exclusion: lack ofopportunities to work or acquire education and skills;childhood deprivation; disrupted families; barriers to olderpeople living active, fulfilling and healthy lives; inequalities inhealth; poor housing; poor neighbourhoods; fear of crime; anddiscrimination (DSS, 1999, p. 2).
Policy has followed along most of those dimensions, some ofwhich are discussed in more detail below.1 Promoting work and‘making work pay’ has been prominent, involving not just theNew Deals and the macroeconomic policies aimed to promoteeconomic stability, but also the introduction of Britain’s firstNational Minimum Wage, and the transformation of socialsecurity benefits into more generous tax credits. But at the sametime, and in contrast to policies in the US, allowances for thechildren of those who are out of work have also been increasedwell above inflation. After dropping to a low point in 1999,public spending on education is rising, with particular emphasison poorly performing schools. Policy towards pensioners hasbeen selective, focused on increasing the value of the meanstested minimum (now known as the ‘guarantee credit’ of thePension Credit). The universal basic pension has remained linkedto prices in most years, although all pensioners have benefitedfrom various other measures, such as an annual ‘winter fuelallowance’. At the 2002 Labour Party Conference Gordon Brownpledged that ‘Our aim is to end pensioner poverty in ourcountry’, although unlike the child poverty commitment there isno timescale or specific benchmark for this.
The last quarter century

One hundred years of poverty and policy
100
Figu
re 8
: Pu
blic
sp
end
ing
on
ed
uca
tio
n, h
ealt
h, a
nd
so
cial
sec
uri
ty, 1
921–
2001
Sou
rce:
Hill
s (2
004a
), F
ig. 6
.2.
25 20 15 10 5 0
% of GDP
1921
1926
1931
1936
1941
1946
1951
1956
1961
1966
1971
1976
1981
1986
1991
1996
2001
Year
Soci
al s
ecu
rity
Hea
lth
Edu
cati
on
Figu
res
are
for
finan
cial
yea
rs (a
part
fro
m e
duca
tion
to 1
946
and
heal
th t
o 19
36).
101
An accumulation of evidence had shown the ways in whichthe country had become more polarised between differentkinds of area, not just as the old industrial regions declined, butalso within towns and cities across the country (Hills, 1995). Thebiggest part of the Social Exclusion Unit’s work led to theestablishment of a National Strategy for NeighbourhoodRenewal and to New Labour’s most ambitious target, that‘within 10–20 years, no one should be seriously disadvantagedby where they live’. A set of ‘floor targets’ has been set forachievement in employment, education, crime, health andhousing in the most disadvantaged areas. Some of the relatedpolicies have been for ‘mainstream services’, such as health,education and policing, but others have been targeted onparticular areas, such as the New Deal for Communities,neighbourhood wardens, the Sure Start early yearsprogrammes, and Excellence in Cities for education.2
Unlike the US in the early 1960s, there has been nodeclaration of ‘War on Poverty’, and nor is there anyoverarching target to reduce poverty overall, as there is inIreland. But none the less, by the start of the twenty-firstcentury there was a commitment to tackle poverty anddisadvantage that had not been seen since the 1960s, if not the1940s, and a raft of specific policy initiatives aimed at particularaspects of the problem. The issue for the future is whether thescope of these is enough, and what could be done to fill thegaps in them (see chapter 7).
Public spendingAlthough governments can affect income distribution andpoverty in other ways, the largest effects come from thecombination of public spending and the taxes that pay for it.This is not just a matter of spending on social security benefits,but also that on other elements of what is sometimes called the‘social wage’ – health care, education, housing, and personalsocial services (Sefton, 2002).
As figure 8 shows, the total of the three largest elements of
The last quarter century

One hundred years of poverty and policy
102
Figu
re 9
: So
cial
sp
end
ing
in t
he
UK
, 197
8/79
to
200
2/03
Sou
rce:
Hill
s (2
004a
), F
ig. 6
.3. F
igu
res
are
for
fin
anci
al y
ears
.
30 25 20 15 10 5 0
% of GDP
1978
1980
1982
1984
1986
1988
1990
1992
1994
1996
1998
2000
2002
Year
Pers
on
al s
oci
al s
ervi
ces
Ho
usi
ng
Soci
al s
ecu
rity
Hea
lth
Edu
cati
on
103
social spending, health, education and social security, hadreached 10 per cent of national income in the 1930s. Its mainperiod of growth came in the 30 years after the end of theSecond World War, taking the total to 20 per cent of nationalincome by 1976/77.
Since then social spending more widely defined hasfluctuated around a quarter of national income – indeed,equalling this in both 1979/80, the Thatcher government’s firstyear in office, and in 2002/03, New Labour’s sixth year (figure 9).A large part of the variation in the last quarter century hasrelated to the state of the economy, with social securityspending rising in the recessions of the early 1980s and early1990s, and falling again in the subsequent recoveries. Morerecently, policy changes have had a clearer effect – the post-1997 election austerity leading to the low point of socialspending in 1999/00, and subsequent policies that haveincreased spending, notably taking the total of health andeducation spending to their highest share of GDP ever by theend of the period shown. In contrast, housing spending hasbecome a much smaller share of the total over the 25 years, andsocial security (even including the new tax credits) is a smallershare of GDP than ten years ago.
The comparatively static total results from the collision oftwo opposing forces: the desire to reduce public spending toallow lower taxes, particularly in the 1980s; and the upwardpressures on pensions, social services and health care from anageing population, on social security from higher levels ofmarket inequality, and on almost all of these items fromgrowing affluence. As we get richer, many of the items socialspending covers – notably health care and education – are onesto which we want to devote an increasing proportion ofincome. As we discuss in the next chapter, these pressures areunlikely to get any easier. Over much of the last 25 years,policies ‘put the lid’ on social spending, but did so at a cost ofgrowing means testing, falling relative incomes for the poorest,and tight constriction of public services in relation to public
The last quarter century

One hundred years of poverty and policy
104
Figu
re 1
0: S
oci
al s
ecu
rity
ben
efit
s, 1
948/
49 t
o 2
003/
04, U
K
Sou
rce:
Dep
artm
ent
for
Wo
rk a
nd
Pen
sio
ns,
Ben
efit
Exp
end
itu
re T
able
s, w
ww
.dw
p.g
ov.
uk/
asd
/asd
4/ex
pen
dit
ure
.asp
.
14 12 10 8 6 4 2 0
% of GDP
4853
5863
6873
7893
9803
Year
8388
Tax
cred
its
Mea
ns
test
ed
No
n-c
on
trib
uto
ry
War
pen
sio
ns
Oth
er c
on
trib
uto
ry b
enef
its
Co
ntr
ibu
tory
pen
sio
ns
105
demands for them. More recently some growth in socialspending has been accommodated without a large increase intaxes as a share of GDP through squeezing down other parts ofpublic spending (notably defence and debt interest). However,the room to do this is narrowing, leaving policy makers withsome increasingly uncomfortable choices (Hills, 2004a, ch. 11).
The structure of social securityAs the previous chapter described, the reforms of the Attleegovernment in the 1940s, following the Beveridge Report,attempted to make the National Insurance system the majorpart of social security, with minimal reliance on means testedbenefits. As discussed, this did not happen, partly because newrisks emerged which were not covered well by the‘breadwinner’ based Beveridge model (Baldwin andFalkingham, 1994), but also because contributory socialinsurance benefits were never set at a high enough level to getrecipients clear of the acceptable minimum, particularly afterallowing for housing costs. None the less, led by spending onthe basic pension, contributory benefits did dominate the socialsecurity budget for more than 30 years, representing three-quarters of all benefits in 1973/74, and reaching a peak of 6.5per cent of national income ten years later (figure 10).
But for 30 years now, despite the introduction of thecontribution based State Earnings Related Pension Scheme in1978, the role of insurance benefits within the system has beenin retreat. The large increases in social security spending in theearly 1980s and early 1990s took the form of means testedbenefits. At the same time, the role of non-means tested, butalso non-contributory, benefits (such as Child Benefit or somedisability benefits) has also increased. Two pressures have rolledback the role of National Insurance. First, under Conservativegovernments in the early 1970s and the 1980s, the emphasiswas on trying to ‘target’ a constrained budget most efficiently,with means testing seen as the way to do this. As far as pensionsare concerned, this process has continued since 1997.
The last quarter century

One hundred years of poverty and policy
106
Conditions for receiving insurance benefits were alsotightened, and their generosity reduced, particularly with theremoval of earnings related additions to unemployment andsickness benefits in the 1980s.
At other times, however, it has been the restrictive nature ofcontribution conditions – particularly for those with a limitedwork record – that has led governments with more inclusiveaims to increase the emphasis on non-contributory benefits.Together, these pressures from both left and right have led tothe steady decline of the contributory system. The roots of thiswere discussed in chapter 5: an important factor was that,unlike many other European countries, the UK had acomprehensive – and fairly effective – means tested minimumto fall back on as social insurance came under pressure. The verystrength of the safety net made the rundown of socialinsurance possible both politically and administratively in a waythat it would not have been elsewhere.
More recently, since 1998 some of what were social securitybenefits – the old Family Credit (originally Family IncomeSupplement) and Income Support allowances for children –have been transformed into ‘tax credits’. The distributionaleffects of this are discussed below, but one aim of the exercisehas been to destigmatise payments, making them part of thetax machinery and associating them with the government’s‘making work pay’ rhetoric. Whether this has improved take-up– a besetting problem with means tested benefits – is stillunclear, but it has certainly allowed extra resources to go in thisdirection (some of them outside what would otherwise havebeen called ‘public spending’) in way that might otherwise havebeen politically more difficult.
The other crucial change of the last quarter century has beenthe change in the values of benefits, both relative to eachother, and relative to other incomes. Different parts of thebenefit system have been treated in different ways. Figure 11shows what has happened since 1971 to the values of fourexample benefits: the single basic state retirement pension;

107
Income Support (or its equivalent) for single pensioners;unemployment benefit (now Jobseeker’s Allowance or JSA) forsingle people; and Income Support for single people aged 25 to60. The first panel shows their values in real terms, the secondone values relative to average adult earnings.3 The basicpension increased significantly in real terms between 1971 and1983, after which the early 1980s policy decision of theThatcher government to link most benefit levels to prices ratherthan to earnings or other incomes took effect, and its real valuestayed much the same until the end of the 1990s. In somerecent years its real value has increased under New Labourfollowing a commitment to a minimum cash increase each year(reacting to the political furore when low inflation led to a cashincrease of only 75p per week one year). The basic policyremains one of protecting only its real value, however. As aresult, the second panel shows that its relative value fell from26 per cent of average earnings in 1983 to 18 per cent by 1990,and 16 per cent by 2002. By contrast, the real value of IncomeSupport for pensioners has increased steadily since 1976,including through the 1980s, but with particularly largeincreases since 1998. As a result, the value of the means testedminimum for a single pensioner was almost as great in relationto average earnings in 2002 as it had been in 1971.
The decline in the relative value of unemployment benefitsince its link with the pension was broken in 1973 has beeneven greater, particularly since the early 1980s, falling from 21per cent of average earnings in 1979 to 12 per cent by 2002. Inthis case the values of non-means tested and means testedbenefits had converged by the end of the period. As the figureshows, social security benefits for working age people withoutchildren have continued to fall in relative value since 1997.
Families and childrenOne of the main social security reforms of the late 1970s hadbeen the amalgamation of the old family allowances withincome tax child allowances. The former, also stemming from
The last quarter century

One hundred years of poverty and policy
108
Figu
re 1
1: B
enef
its
leve
ls in
rea
l an
d r
elat
ive
term
s, 1
971–
2002
, UK
(a)
Rea
l val
ues
(A
pri
l 200
2 p
rice
s)
100 80 60 40 20 0
£ per week
7173
7577
79Ye
ar81
8385
8789
9193
9597
9901
Bas
ic p
ensi
on
(si
ng
le)
IS (
sin
gle
pen
sio
ner
)
UB
/JSA
(si
ng
le)
IS (
sin
gle
)

109
The last quarter century
(b)
Rel
ativ
e to
ave
rag
e ea
rnin
gs
30 25 20 15 10 5 0
%
7173
7577
79Ye
ar81
8385
8789
9193
9597
9901
Sou
rce:
DW
P (2
003b
), t
able
5.1
1.
Gra
ph
(a)
sh
ow
s th
e ca
sh v
alu
e o
f th
e b
enef
it in
th
e m
on
th u
pra
ted
, ad
just
ed b
y av
erag
e va
lue
of
pri
ce in
dex
bet
wee
n u
pra
tin
gs;
gra
ph
(b
) sh
ow
s ca
sh v
alu
e in
mo
nth
up
rate
d, a
dju
sted
by
aver
age
earn
ing
s in
dex
at
Ap
ril t
hat
yea
r.
Bas
ic p
ensi
on
(si
ng
le)
IS (
sin
gle
pen
sio
ner
)
UB
/JSA
(si
ng
le)
IS (
sin
gle
)
One hundred years of poverty and policy
110
the 1940s, had not been paid for the first child. The latter haddelivered nothing to non-taxpayers, the poorest, and most tothose paying the highest rates of income tax. By contrast, thenew Child Benefit was paid equally in respect of all children.This has great advantages in achieving almost complete take-up, and in avoiding the disincentives associated with meanstested alternatives. Its proponents – notably the Child PovertyAction Group under its then director, Frank Field – had pointedin the 1970s to its universal nature as a source of politicalstrength: the ‘sharp elbows of the middle classes’ would resistattempts to cut it back, and so protect poor families at the sametime. This very feature, however, made Child Benefit the focusof attention when the government was trying to cut backpublic spending in the 1980s – why should scarce publicresources go to the middle classes, even, as was often pointedout, to the Duchess of Westminster, wife of the richest man inthe country?
The end result of such pressure was a three year period whenthe cash value of Child Benefit was frozen in the late 1980s,while under the ‘Fowler reforms’ of 1988 the means testedbenefit for families with children and low earnings wasrenamed Family Credit and made more generous. The ‘sharpelbows’ had their effect under the Major government, however,and Child Benefit was unfrozen and increased for the first child.
An innovation of the early 1990s was the introduction of theChild Support Agency from 1993 in response to the growingnumbers of lone parents, high poverty levels among loneparent families, and the extent to which such families werereliant on social security benefits, particularly Income Support.The aim of the CSA is to try to improve the very low levels ofmaintenance paid by ‘absent parents’ (usually fathers) to‘parents with care’ (usually mothers). In trying to do this it facesdifficulties both in assessing how much absent parents (oftenpart of a new family with children) can afford to pay, and inenforcing payment. The second difficulty is compounded whenthe parent with care is receiving Income Support and little or no

111
benefit from child support payments ends up with them,resulting instead in a saving to government in the IncomeSupport which has to be paid.
It is in the tax and benefit treatment of families withchildren that New Labour has made its largest changes, as thefigures for the values of benefits and tax credits in table 9show. Child Benefit paid for the first child had increased by 14per cent in real terms between 1991 and 1997, but IncomeSupport levels for families had changed little in real terms. Norhad there been much rise in the real incomes (after housing
The last quarter century
Table 9: Increases in Child Benefit, Income Support and net income afterhousing costs, April 1991 to April 2003 (£ per week, April 2003 prices)
April April April Change Change 1991 1997 2003 1991– 1997–
1997 (%) 2003 (%)
Child Benefit (first child) 11.23 12.81 16.05 14.1 25.3Child Benefit (subsequent
children) 9.87 10.43 10.75 5.7 3.1
Income Support (lone parent, 1 child under 11) 87.70 91.18 108.90 4.0 19.4
Income Support (couple, 1 child under 11) 112.03 116.87 140.00 4.3 19.8
Income Support (couple, 2 children under 11) 129.93 135.71 178.50 4.4 31.5
Net income after housing costsCouple, 2 children, on
average earnings 297.18 311.73 352.00 4.9 12.9Lone parent, 1 child, on
average earnings 217.64 229.33 266.22 5.4 16.1
Couple, 2 children, on half average earnings 165.13 177.61 239.90 7.6 35.1
Lone parent, 1 child, on half average earnings 146.01 156.95 193.55 7.5 23.3
Source: Stewart (2005a), based on DWP (2004).
One hundred years of poverty and policy
112
costs) of families with children on average or below averageearnings, allowing for the tax system and benefits they couldhave received. Over the following six years, the picture wasvery different. Child Benefit for the first child increased by aquarter in real terms,4 and Income Support for families withyoung children rose by at least a fifth (more for largerfamilies). The real value of the child element for a child agedunder 11 (£27.75 per week) of the new Child Tax Credit whenit was introduced in April 2003 was twice as high as itsequivalent under the old Family Credit system had been in1997 (Hills, 2004a, table 9.1). As a result of this and other taxand tax credit changes, a couple with two children and wagesof half average earnings were a third better off in real termsin 2003 than they had been in 1997.
This has been a major commitment by the government.Between 1997/98 and 2002/03, spending on child-contingentbenefits rose from 1.38 to 2.04 per cent of GDP. Spending onearly years policies and child care grew from 0.21 to 0.33 percent of GDP (Stewart, 2005a, table 7.9). Even before thereforms associated with Child Tax Credit in April 2003, theadditional commitment to cash and services for childrenrepresented 0.8 per cent of GDP. By 2004, the additionalspending had reached 1 per cent of national income.
The unemployed and incentives to workAlthough benefits for those classed as unemployed make uponly a very small part of the social security budget (5 per centin 2001/02), their structure and the disincentives they maycreate have continued to be a major focus of attention in thelast quarter century. This is not least because they are generallybelieved to be such a large part of the budget: 44 per cent ofrespondents to the 2001 British Social Attitudes survey thoughtthat they were the largest item in social security spending, anda further 27 per cent thought them the next largest part(Taylor-Gooby and Hastie, 2002). Large proportions of thepopulation believe that the benefits make unemployed people

113
less likely to look for work and that the system is widely abusedthrough fraud (Hills, 2004a, figs 6.11 and 6.13).
This was certainly the belief of the Thatcher governmentwhen it came into power, leading it to set in place a series ofmeasures that reduced benefit entitlements, particularly tonational insurance based Unemployment Benefit (now knownas insurance based Jobseeker’s Allowance). The aim was toreduce ‘replacement rates’, the ratio between incomes out ofwork and those in work. As well as adjusting the values ofbenefits in line only with prices each year (with the effects onvalues relative to earnings shown in figure 11 above), additionsrelated to previous earnings were abolished, conditions relatedto previous contributions made tighter, and the lengths ofentitlement to non-means tested benefits were cut. In all,Atkinson and Micklewright (1989) recorded 38 changes to thesystem of benefits for the unemployed in the 1980s, nearly allof them reducing entitlements.
Despite this, the numbers unemployed remained high. Oneeffect of the changes was to increase the numbers receivingmeans tested Income Support. At the same time, tacitencouragement was given by the government for people to berecorded as out of work due to invalidity (now ‘incapacity’)rather than to be looking for work. As old heavy industries were‘shaken out’, the number of people – particularly older men –who were of working age but economically inactive grewrapidly, particularly in the old industrial parts of the country.Economic inactivity for working age men grew from 12 per centin the late 1980s to 15 per cent by 1997, and continued to growslowly, reaching 16 per cent by 2003 (McKnight, 2005, fig. 2.3).
Over time, however, the emphasis on ‘active labour marketmeasures’ – assistance and encouragement with job search andtraining – rather than on reducing incomes out of workgradually increased. This eventually led to the introduction ofJobseeker’s Allowance in 1996. Entitlement to non-meanstested benefit was again cut, this time to six months, but theemphasis on support for job-search and training was increased.
The last quarter century

One hundred years of poverty and policy
114
In many ways, New Labour’s ‘New Deal’ programmes can beseen as a continuation of the direction already taken by theMajor government’s JSA reforms – but with considerably moreresources put into positive supports, particularly for the youngunemployed.
Evaluations of most of these active labour market – or‘welfare to work’ – programmes consistently show positive butsmall effects (McKnight, 2005). For instance, a recent evaluationof New Labour’s flagship New Deal for Young People suggeststhat it has been a success, and represents good value for money– but that there are only 17,000 extra young people in work asa result of it than there would otherwise have been (VanReenan, 2004). Such effects are useful, and almost certainlycrucial in winning public backing for overall support forunemployed people, but by themselves hardly transform thepicture.
At the same time, the incentive effects of all of these reformshave been ambiguous. In the Conservative period, incomes forthose out of work were reduced by comparison with incomes inwork. However, the effects of this were sometimes blunted –both by the increasing incidence of low pay and by factors suchas Housing Benefit. As housing subsidies were reduced, andrents rose, the availability of benefit covering 100 per cent ofrent for those with the lowest incomes became a larger part ofthe equation. Faced with rapidly rising costs of Housing Benefit,but still trying to preserve the integrity of the nationalminimum, assistance for those just above the minimum was cutback. The ‘tapers’ in both Housing Benefit and Council TaxBenefit became steeper, leaving little gain from extra earningsfor those affected by them.
This contributed to further deepening the ‘poverty trap’, thephenomenon first identified in the 1960s that the combinationof taxes on additional income and withdrawal of means testedbenefits could mean that poor families would need very largeincreases in gross earnings for there to be any noticeable effecton raising their net income. Figure 12 shows the end result of

115
the Conservative reforms, giving the position in 1997/98(adjusted to 2003/04 prices) of a one earner couple with twochildren, who were also tenants. As can be seen, over aconsiderable range of gross income, net income would hardlyhave risen at all even if earnings rose substantially. With grossearnings of £75 per week, their net income would have been£227. With gross earnings of £275, net income would only haverisen to £248: a £200 increase in earnings would have left themonly £21 better off (before allowing for any resultant increasedcosts of working such as transport or child care). As a result,even with earnings of £275 per week, the difference betweennet income in work and that out of work (on Income Supportof £211 at 2003/04 prices, including help with housing costs)remained small.
New Labour’s reforms, culminating in the introduction of theChild Tax Credit and Working Tax Credit in April 2003, havechanged the position in three ways. First, incomes out of work
The last quarter century
Figure 12 Net incomes under 1997/98 and 2003/04 tax and benefitsystems, 2003/04 prices
400
300
200
100
0
Inco
me
per
wee
k (£
)
100Gross earnings (£/week)
Source: Hills (2004a), Fig. 7.8 (single earner couple with two children, allowing for Housing Benefit andCouncil Tax Benefit).
200 300 400 500
2003–04
IS 03–04
1997–98
IS 97–98

One hundred years of poverty and policy
116
and on Income Support have been increased. At the very lowestlevels of earnings, the gain from working remains low. Butfigure 12 shows that for those with somewhat higher earningsthe system has been made much more generous – there is botha larger gain from earning more, and for earnings above about£250 per week there is a much larger margin over income outof work. However, the third effect is that the way in whichhigher earnings lead to reduced tax credits now extends over amuch wider income range – in this case up to earnings of £420per week. The poverty trap has been made shallower but wider.
Figure 13 shows this effect in another way. In this case itshows the ‘effective marginal tax rates’ facing the families infigure 12 in the 1997/98 and 2003/04 systems: what percentageof any increase in gross income would be lost through incometax, National Insurance contributions, benefit and tax creditwithdrawal. In the 1997/98 system, rates were near to 100 percent right up to earnings of £275 per week. In the 2003/04system, this range is much shorter, ending at £200 per week. Butthe cost of this is that the family faces a 70 per cent effectivemarginal tax rate over a much wider range.5
The Treasury calculates that under the 1997/98 system740,000 working families faced effective marginal tax ratesabove 70 per cent, and that only 270,000 do so in the 2004/05system (HM Treasury, 2003b, table 4.2). However, 1.8 millionnow face rates ‘above 60 per cent’ (mostly actually facing 70 percent exactly), compared with only 760,000 before. Acutedisincentives affecting a smaller number have been replacedwith less acute ones facing many more. So far the evidence isthat on balance the reforms – despite their greater generosityto families who have children and who are out of work or onlow wages – have had a net positive effect on labour supply(Brewer et al., 2003). A problem facing future policy is,however, that any extension of generosity of the tax creditsystem to help further reduce poverty also means extending theproblem to higher income ranges (or increasing tax creditwithdrawal rates, so deepening the poverty trap again). The

117
effect can be compounded by other means tests – for instancewithin student support or Education Maintenance Allowancesfor young people staying on in education after 16.
PensionsThe main changes to pensions policy in the last 25 years havealready been touched on above. Perhaps strangely, the overalleffect has been that policy has gone full circle. In a veryconvoluted way, current plans for future pensions are designedto return state support for pensioners to something not sodistant from Beveridge’s model of equal support for all (Hills,2004b).
The first reform was set in motion in the 1970s – BarbaraCastle’s State Earnings Related Pension Scheme (SERPS) startedin 1978. The principle of this was that as well as entitlement to
The last quarter century
Figure 13: Effective marginal tax rates under 1997/98 and 2003/04tax and benefit systems
100
75
50
25
0
Effe
ctiv
e m
arg
inal
tax
rat
e (%
)
100
Gross earnings (£/week)
Note: In the 1997/98 system, the effect of Family Credit withdrawal could be delayed up tosix months; in the 2003/04 system, the effect of tax credit withdrawal could be delayed untilthe next tax year (for increases in annual income above original assessment of up to £2500).
200 300 400 500
2003/041997/98
Source: Hills (2004a), Fig. 10.7.

One hundred years of poverty and policy
118
the flat rate basic state pension (worth nearly a quarter ofaverage earnings in 1978), people would also build up rightswhich related to the earnings on which they paid NationalInsurance contributions – worth a quarter of their own averagelifetime earnings (in excess of each year’s lower limit). Thiswould get those with reasonable earnings well clear of thepoverty line in retirement, even if they were not members of aprivate pension scheme.
However, the incoming Conservative government was notprepared to accept the additional cost of state pensions as ashare of GDP that this would imply if the relative value of thebasic pension was also to be maintained. In effect, the decisionto cut the link between the value of the basic pension andearnings growth (with the effects shown in figure 11) createdthe fiscal headroom to pay for the growing costs of SERPS overthe 1980s and 1990s. Instead of Barbara Castle’s vision of thenew system leading to gains for all pensioners, the end resulthas been lower pensions for those with low lifetime earnings,and higher ones for those who were better off at work.
For the future, the Fowler reforms of 1988 cut back the rateat which SERPS rights would accrue, and policy continuedthrough the 1990s and past 1997 on the assumption that thevalue of the basic pension would continue to fall in relativeterms – until it eventually became ‘nugatory’, in MichaelPortillo’s famous description of it in 1993.
New Labour has not reversed this, but instead has changedthe system in three ways designed to redress the regressiveimpact of the policy changes of the previous 20 years:
• First, it has increased the value of the means tested minimumsignificantly, as figure 11 shows, renaming it first as theMinimum Income Guarantee, and then as the guaranteecredit of the Pension Credit. The assumption of current policyis that the value of this will continue to rise with earningsgrowth (while the basic pension remains price linked).
• Second, from October 2003 it extended means tested support

119
through the Pension Credit to pensioners with small incomesthat put them just above the means tested minimum. As withthe reforms for working families illustrated above, the effectof this is to reduce the sharpest part of means testing, but toextend a milder form of it over a wider range of income. Ifindexation continues as in recent years, the scope of PensionCredit will steadily widen. Some estimates suggest that over60 per cent of pensioners would eventually be affected byPension Credit withdrawal.
• Third, it has changed the rules of SERPS – renaming it as theState Second Pension (S2P) – to increase its value for lowearners. This will over time make its value considerably lessearnings related and more flat rate than SERPS.
These reforms interact in a complicated way, and one that willchange over time. Figure 14 gives one impact of the long runeffect if current indexation rules continue. This shows statesupport on retirement in 1978, 1998 and projected for 2038, fora simple case of a single person whose earnings had(unrealistically) equalled the same proportion of the nationalaverage through his or her working life.6
• The solid line shows the position for someone retiring back in1978, before SERPS was introduced. Both the basic pensionand the minimum income guaranteed by what was thenSupplementary Benefit were around 25 per cent of averageearnings, so state support was virtually flat rate.
• The lighter dashed line shows the position for those retiringin 1998, when earnings related rights through SERPS were attheir highest, but both Income Support and the basic statepension had fallen in relation to average earnings. Statesupport had fallen for low earners, but had risen for higherearners.7
• The heavier dashed line shows a projection of state support in2038 if current indexation policies continue. The minimumlevel of state support would, as now, be higher than in 1998
The last quarter century
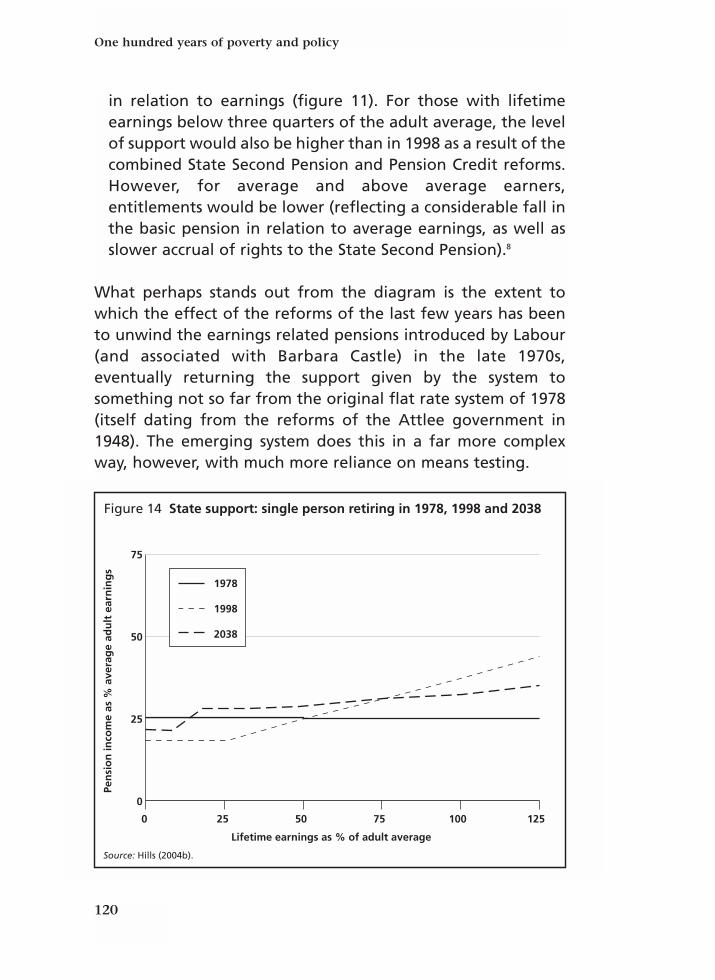
One hundred years of poverty and policy
120
in relation to earnings (figure 11). For those with lifetimeearnings below three quarters of the adult average, the levelof support would also be higher than in 1998 as a result of thecombined State Second Pension and Pension Credit reforms.However, for average and above average earners,entitlements would be lower (reflecting a considerable fall inthe basic pension in relation to average earnings, as well asslower accrual of rights to the State Second Pension).8
What perhaps stands out from the diagram is the extent towhich the effect of the reforms of the last few years has beento unwind the earnings related pensions introduced by Labour(and associated with Barbara Castle) in the late 1970s,eventually returning the support given by the system tosomething not so far from the original flat rate system of 1978(itself dating from the reforms of the Attlee government in1948). The emerging system does this in a far more complexway, however, with much more reliance on means testing.
Figure 14 State support: single person retiring in 1978, 1998 and 2038
75
50
25
0
Pen
sio
n in
com
e as
% a
vera
ge
adu
lt e
arn
ing
s
0
Lifetime earnings as % of adult average
25 50 75 125
Source: Hills (2004b).
100
1978
1998
2038

121
OutcomesThe combination of the impact of these social policy changesand the macroeconomic story of the last quarter century has ledto contrasting fortunes for different parts of the incomedistribution and kinds of family. Figure 15, based on analysis bythe Institute for Fiscal Studies, contrasts what has happened tothe annual growth rates of net incomes (adjusted for familysize) of those in successive fifths of the income distributionunder the last three prime ministers (up to 2002/03 for TonyBlair).
While Mrs Thatcher was Prime Minister, incomes at the topgrew rapidly. Lower down the distribution they grew much lessfast, and at the bottom by very little. Average living standardsgrew, but income inequality widened rapidly, and the poor fellbehind. During the Major years, the growth in inequality waspartly reversed, but there was only slow growth in livingstandards for any of the groups. After 1997, all income groupsenjoyed quite rapid growth in living standards. This has onlymeant a slow decline in relative poverty, but it did involve muchfaster growth in living standards for the poor than either of theearlier periods, and so resulted in rapid falls in absolute poverty.For many concerned with disadvantage, the latest period isclearly preferable to the other two, even though it has notresulted in a fall in inequality between the incomes of the topand the bottom. Indeed, inequality between the very top andthe very bottom was still greater in 2002/03 than it had been in1996/97. It was, however, falling if measured between thosenear the top and those near the bottom (Sefton andSutherland, 2005).
Figure 16 gives a more detailed view of the changes inrelative poverty over the last 40 years that we previouslyshowed in figure 5, showing the composition of the populationwith incomes below half the contemporary average. Keyfeatures include:
• Overall relative poverty, which had been about 10 per cent of
The last quarter century

One hundred years of poverty and policy
122
Figure 15: Real income growth by quintile group (% per year)(a) Thatcher: 1979 to 1990
4
3
2
1
0
% p
er y
ear
PoorestIncome quintile group
2 3 4 Richest
4
3
2
1
0
% p
er y
ear
PoorestIncome quintile group
2 3 4 Richest
4
3
2
1
0
% p
er y
ear
PoorestIncome quintile group
2 3 4 Richest
(b) Major: 1990 to 1996/97
(c) Blair: 1996/97 to 2002/03
Note: The figures for each quintile group correspond to their mid points (i.e. the 10th, 30th, 50th,70th and 90th percentiles of the income distribution). Incomes are before housing costs.
Source: Brewer et al. (2004), Fig. 2.3.

123
the population in the 1960s, dipped to a low point of 6 percent in 1977, but then grew very rapidly through the 1980s topeak at 21 per cent in the early 1990s. After a dip and thenrise back in the mid 1990s it has fallen slowly since 1996/97. Itis still three times its level of the mid 1970s.
• Pensioners made up a much greater proportion of the poorpopulation in the 1960s than they do now. None the less,poor pensioners now represent as great a proportion of thewhole population – nearly 5 per cent – as they did then.
• Families with children have become a much greater part ofthe poor population, not just lone parents and their children,but also two parent families. Most recently, their povertyrates have been falling.
• By contrast, there has been no recent fall in poverty rates forworking age single people and couples without children.
Table 10 illustrates this last point in a little more detail forthe period since 1979, in this case using poverty lines based onthe current official measure of 60 per cent of median income. Itshows poverty rates both in relative terms in the upper paneland against a fixed real line in the lower panel. For the 1996/97to 2002/03 period, it shows how the slight fall in poverty ratesfor people of working age has resulted from a fall in povertyfor those with children – falling child poverty has to involvefalling parent poverty – but a rise in poverty for working ageadults without children. While some of this group havebenefited from New Labour’s welfare-to-work programmes andthe buoyant economy, others still dependent on benefits havehad living standards which have fallen in relative terms.
The lower panel of the table gives a measure, however, ofjust how hard it is to achieve reductions against the movingtarget of a relative poverty standard when overall livingstandards are rising as fast as those shown in figure 15. Instead,it shows poverty rates against a fixed real standard – of thekind, for instance, used to measure official poverty rates in theUS. Fewer people were poor in 1996/97 against this fixed line
The last quarter century

One hundred years of poverty and policy
124
Fig
ure
16:
Po
pu
lati
on
wit
h b
elo
w h
alf
aver
age
inco
me,
196
1–20
01 (
bef
ore
ho
usi
ng
co
sts)
25 20 15 10 5 0
% of total population
1961
1971
1981
1991
2001
Year
Sin
gle
Sin
gle
wit
h c
hild
ren
Co
up
les
no
ch
ildre
n
Co
up
les
wit
h c
hild
ren
Sin
gle
pen
sio
ner
s
Pen
sio
ner
co
up
les
Sou
rce:
Hill
s (2
004a
), f
ig. 3
.1, d
eriv
ed f
rom
Go
od
man
an
d W
ebb
(19
94)
and
DW
P (2
004)
.
No
te: G
B f
igu
res
sin
ce 1
994/
95; U
K f
igu
res
earl
ier.
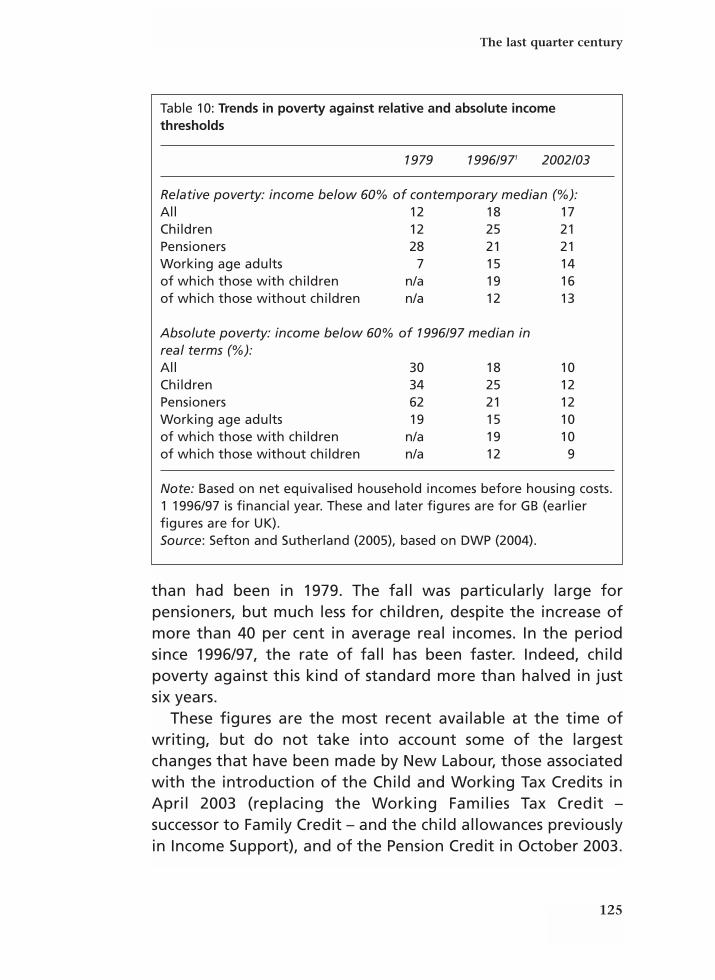
125
than had been in 1979. The fall was particularly large forpensioners, but much less for children, despite the increase ofmore than 40 per cent in average real incomes. In the periodsince 1996/97, the rate of fall has been faster. Indeed, childpoverty against this kind of standard more than halved in justsix years.
These figures are the most recent available at the time ofwriting, but do not take into account some of the largestchanges that have been made by New Labour, those associatedwith the introduction of the Child and Working Tax Credits inApril 2003 (replacing the Working Families Tax Credit –successor to Family Credit – and the child allowances previouslyin Income Support), and of the Pension Credit in October 2003.
The last quarter century
Table 10: Trends in poverty against relative and absolute incomethresholds
1979 1996/971 2002/03
Relative poverty: income below 60% of contemporary median (%):All 12 18 17Children 12 25 21Pensioners 28 21 21Working age adults 7 15 14of which those with children n/a 19 16of which those without children n/a 12 13
Absolute poverty: income below 60% of 1996/97 median in real terms (%):All 30 18 10Children 34 25 12Pensioners 62 21 12Working age adults 19 15 10of which those with children n/a 19 10of which those without children n/a 12 9
Note: Based on net equivalised household incomes before housing costs.1 1996/97 is financial year. These and later figures are for GB (earlierfigures are for UK).Source: Sefton and Sutherland (2005), based on DWP (2004).
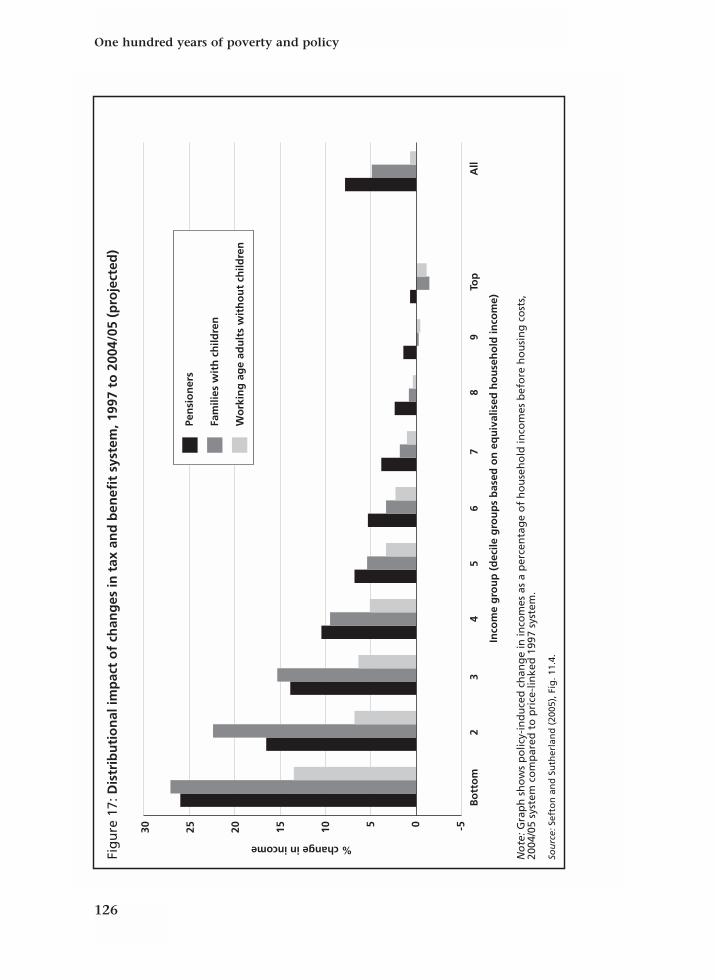
One hundred years of poverty and policy
126
Fig
ure
17:
Dis
trib
uti
on
al im
pac
t o
f ch
ang
es in
tax
an
d b
enef
it s
yste
m, 1
997
to 2
004/
05 (
pro
ject
ed)
30 25 20 15 10 5 0 -5
% change in income
Bo
tto
m2
34
5
Inco
me
gro
up
(d
ecile
gro
up
s b
ased
on
eq
uiv
alis
ed h
ou
seh
old
inco
me)
No
te: G
rap
h s
ho
ws
po
licy-
ind
uce
d c
han
ge
in in
com
es a
s a
per
cen
tag
e o
f h
ou
seh
old
inco
mes
bef
ore
ho
usi
ng
co
sts,
2004
/05
syst
em c
om
par
ed t
o p
rice
-lin
ked
199
7 sy
stem
.
Sou
rce:
Sef
ton
an
d S
uth
erla
nd
(20
05),
Fig
. 11.
4.
67
89
Top
All
Pen
sio
ner
s
Fam
ilies
wit
h c
hild
ren
Wo
rkin
g a
ge
adu
lts
wit
ho
ut
child
ren

127
Modelling work suggests that these changes will add to theredistributive effects of the reforms. Figure 17 shows the resultsof one such exercise. It shows the effect on the incomes ofsuccessive tenths of the income distribution if one compares theactual 2004/05 tax and benefit system with the system thatwould have been in place if the 1997 system had been retained,simply uprated for price inflation.
Two things are clear from this. First, the reforms overall havebeen progressive, with the largest proportionate gains for thelower income groups. Second, it is pensioners and families withchildren that have been the largest gainers – gains equivalentto a quarter or more of income for those in the poorest tenth.On average, there has been little effect on people of workingage without children, although even here there have beengains for some with low incomes (reflecting some reforms suchas the National Minimum Wage and changes to NationalInsurance contributions as well as the Working Tax Credit,which now goes to some without children). Using thismodelling, Sefton and Sutherland (2005, table 11.5) projectthat, other things being equal, the poverty rates shown in table10 would fall further by 2004/05 to 15 per cent for children, 19per cent for pensioners (each from 21 per cent in 2002/03), butwould remain at 13 per cent for working age people withoutchildren. This would mean that the government would hit (onthis basis, measuring incomes before deducting housing costs)its target for cutting child poverty by a quarter.
There is one caveat to this way of measuring the impact ofpolicy on poverty. This is that the base used in figure 17 is thatof the 1997 system adjusted only for price inflation. It could beargued that this gives an unduly positive impression of theimpact of New Labour’s policies at the bottom. After all, thecomparison being made is with a world where (price linked)benefit rates would be falling behind other living standards,and so relative poverty rates would be rising. At the same time,tax revenues would be rising faster than national income, as‘fiscal drag’ pulled more people into the tax net and into higher
The last quarter century
One hundred years of poverty and policy
128
tax rates. This would not be a ‘steady state’ – the public financeswould be continually improving while the poor were leftbehind.
As an alternative, the actual system can be compared withwhat it would have looked like if the 1997 tax and benefitsystem had been adjusted by earnings growth – in other wordsone where an ‘Old Labour’ policy of uprating benefits in linewith earnings had been followed, but without any reform. Ifthis is done, similar modelling suggests that the actual 2004/05system produces almost identical average household incomes toan earnings adjusted 1997 system (Hills, 2004a, fig. 9.5). Overall,New Labour’s reforms have been fiscally neutral compared withthe hypothetical ‘Old Labour’ alternative. However, the bottomfive-tenths of the income distribution as a whole are better offwith New Labour’s reforms than they would have been underearnings indexation, while the top four-tenths are worse off.On this kind of comparison, New Labour’s reforms actuallycome out as more clearly redistributive from those with highincomes to those with low incomes (especially to families withchildren).
The contribution of social science to the recent debateDuring the 1980s and indeed right up to 1997, the discussion of‘poverty’ passed out of official currency. This was despite – oreven because of – the way in which government policies werecompounding the growth of inequality. But at the same timepoverty re-emerged as a focus for social research in a way it hadnot done since the nineteenth century and the 1960s. Strikingly,an important facilitator was television.
London Weekend Television commissioned the pollingorganisation MORI to conduct a survey as background to aseries of four programmes on ‘Breadline Britain’. Two of theprogramme’s writers, Joanna Mack and Stewart Lansley,discussed the survey with social policy academics – Vic George,Peter Townsend, David Piachaud, Richard Berthoud and PeterTaylor-Gooby, a roll call of the leading poverty analysts of the

129
day. They came up not just with a new survey, but a newconceptual approach to the whole problem. As we discussed inchapter 5, Townsend (1979) had argued that poverty wassocially constructed and depended on individuals’ capacity tobe included in the mainstream of society. The question was,how to decide which activities and items were necessary forsuch inclusion? What income was needed for participation?Townsend’s view (1979, ch. 6) was that he could construct sucha line statistically from consumption patterns. Others disagreed,arguing that, in the end, poverty was a subjective socialmeasure of what people thought was a minimum below whichpeople should not live. The way to find that out was to ask thepopulation, not just rely on experts. The approach of Mack andLansley (1985) was to ask a sample of the whole populationwhat items they thought were necessities, and then usemajority views of this to define which items people should notgo without. They could then identify who was poor as lackingsuch necessities because they could not afford them. Thisapproach has since been repeated in other studies, includingthe 1999 Poverty and Social Exclusion Survey of Britain (Gordonet al., 2000).
This approach owed much to the work of Amartya Sen(1983), an economist whose work included the study of faminesand who had debated the concept of poverty with Townsend inthe 1960s. There is, Sen argued, an ‘absolutist core’ to poverty.Starvation and death are not relative concepts, and in thedeveloping world they are the key to poverty. Yet his workprovided a framework that took the debate beyond just‘absolute’ versus ‘relative’ concepts of need. Adam Smith hadframed poverty in terms of being able to ‘appear in publicwithout shame’. Sen’s ‘capabilities’ framework developed theway in which such benchmarks for participation depended onthe society and time within which people lived. This has had amajor influence on the notions of poverty employed by theUnited Nations Development Programme in its annual reportsand on the UN Copenhagen Agreement in 1995. This
The last quarter century

One hundred years of poverty and policy
130
committed signatories to eradicating poverty through nationalactions and international cooperation. It distinguished‘absolute’ and ‘overall’ poverty and led to attempts to givethese terms distinct meanings (Gordon et al., 2000; Gordon andTownsend, 2000).
Within the UK, evidence accumulated through the 1980s ofthe extent to which there had been a dramatic shift in incomedistribution, not least from official statistics such as the newHouseholds Below Average Income analysis. In 1992 the JosephRowntree Foundation commissioned a programme to researchthis and bring all the evidence together, and also an InquiryGroup chaired by one of its trustees, Sir Peter Barclay, toconsider the implications of the findings (Barclay, 1995; Hills,1995). When the Inquiry Group’s report was published in 1995,its findings and concerns resonated widely; indeed publicconcerns about the gap between rich and poor reached a peakthat year. As in Charles Booth’s and Seebohm Rowntree’s time,hard empirical evidence made such concerns more difficult toignore.
SummaryThe last quarter century has seen large swings in policy towardspoverty. The priority of fighting poverty was greatly reduced inthe 1980s, and reforms were made to social security, taxationand public spending that were intended to improve incentivesand economic growth. As unemployment grew and societychanged, many more people found themselves depending onsocial security benefits that were falling behind average livingstandards. As a result of both factors, poverty grew. Howeversocial spending remained much the same share of nationalincome, and the growth of means testing had negative effectson incentives, both despite the intentions of the reforms. Since1997, New Labour has followed a mixture of policies, withreducing child and pensioner poverty of increasing importance.Its macroeconomic success in maintaining steady growth andfalling unemployment has helped, but it has had to grapple

131
with much the same underlying pressures and dilemmas –specifically how to make progress against poverty when thereare escalating demands on social spending for other purposes,and when political pressure to keep down tax rates remains astight as ever. It is to such pressures that we turn in the nextchapter, and then in the final chapter to ways in which thisconflict might work out over the next 20 years.
The last quarter century


Part IIILooking forward


135
Where are we now? The UK in international perspectiveOne of the factors which has helped push poverty, particularlychild poverty, up the policy agenda in recent years has been thebody of evidence on Britain’s comparatively dismal record bycomparison with other countries.1 Table 11 gives the position in15 comparable countries (members of the European Union or ofthe ‘G7’ major industrialised countries) in 2000 or the nearestavailable year, based on Luxembourg Income Study analysis ofnational data sources on a comparable basis. It shows povertyrates based on a line of 60 per cent of each country’s ownmedian income, together with a measure of severe poverty(numbers below a line of 40 per cent of median income in eachcountry).
Overall, only the US and Ireland had worse relative povertyrates, only the US had a worse child poverty rate, and onlyIreland a worse poverty rate for its elderly population. In fourcountries, the child poverty rate was less than half that in theUK, and in two the poverty rate for the elderly was less than halfthat here. Against the severe threshold of 40 per cent of medianincome, the UK was not so far above the average, but its levelwas still the fourth worst shown. By contrast, in one of theearliest uses of this data source, Mitchell (1991) found that in thelate 1970s and early 1980s, the UK had the lowest poverty rateagainst a severe poverty line out of the 10 countries examined.
7 Policy challenges and dilemmasfor the next 20 years John Hills

One hundred years of poverty and policy
136
From some perspectives a poor performance in relativepoverty rates might be seen as less serious if a country’s incomewas so high that the absolute standard of living of its poorpopulation was still high by comparison with living standardselsewhere. However, analysis by UNICEF (2000) of the positionin the mid 1990s suggests that even on this kind of comparisonthe UK was doing badly in terms of child poverty. It calculatedchild poverty rates against a fixed international standard, basedon the US poverty line (converted at purchasing power parities).This showed the UK to have a child poverty rate of 29 per centagainst this standard, better only than that in Italy and Spainwithin the EU, and twice the rate in the US.2
There are now indications that the UK’s internationalposition is improving. Figure 18, for instance, shows that in theindicators published by the European Commission, the UK
Table 11: International comparison of relative poverty rates, 2000 orlate 1990s (% of population)
Below 60% of Below 40% population median of median
All Children Elderly
United States (2000) 23.8 30.2 33.3 10.8Ireland (1996) 21.8 23.6 41.5 4.0United Kingdom (1999) 21.3 27.0 34.9 5.7Italy (2000) 19.9 26.5 22.2 7.3Canada (1998) 19.7 23.8 21.5 7.6Denmark (1997) 17.1 14.5 30.5 5.7Belgium (1997) 14.4 13.7 22.7 3.3Austria (1997) 14.2 17.3 22.7 3.3France (1994) 14.1 14.3 18.5 3.4Germany (2000) 13.1 11.2 21.2 4.9Netherlands (1999) 12.7 14.8 12.8 4.6Luxembourg (2000) 12.5 18.3 10.5 1.4Finland (2000) 12.4 8.0 24.8 2.1Norway (2000) 12.3 7.5 28.9 2.9Sweden (2000) 12.3 9.2 21.2 3.8
Source: Hills (2004a), table 3.6 (based on Luxembourg Income Study).

137
moved from having the worst relative child poverty rate in theEU in the year up to 1997, to fifth worst in the year up to 2001.The rate in the UK fell, while it rose in most other EU countries.None the less, there was still a long way to go for the UK to fallto the EU average, let alone to reach the government’s targetof being ‘among the best in Europe’ by 2020.
The same data source suggests little change in the rate ofadult poverty in the UK over that period, but a deterioration infive of the other EU members (Stewart, 2005b, fig. 14.2). Withinthis, there was a very slight fall in poverty among the retiredpopulation in the UK, but this contrasted with increases in eightother member states.
Figure 18: Child poverty in the European Union, 1997 and 2001
30
25
20
15
10
5
0
%
Denm
ark
Note: Poverty line is 60% of equivalised household median income.
Source: Stewart (2005b), fig. 14.1, based on European Community Household Panel.
Finla
nd
Swed
en
Nether
lands
Belgiu
m
Austria
Germ
any
Fran
ce
Luxe
mbourg
Greec
eIta
ly
Irela
nd
Portu
gal
Spai
n UKEU
15
1997
2001
Policy challenges and dilemmas for the next 20 years

One hundred years of poverty and policy
138
The picture of recent improvements in the UK, particularlyagainst absolute standards, is confirmed by figure 19. Thisshows the reduction in the proportion of the populationcounted as poor between 1998 and 2001 within each EUmember state, using both relative and absolute standards.Against a relative standard, the UK’s performance was the bestin Europe, and against an absolute standard it was one of thefour recording the largest falls.
Ireland’s position is notable here: its combination of rapidgrowth in average living standards combined with a smaller butstill significant increase in real incomes for the poorest meantthat it had both the fastest growth in relative poverty, and
Figure 19: Change in numbers in poverty between 1998 and 2001measured against constant real and relative income lines
3
2
1
0
-1
-2
-3
-4
-5
-6
-7
% p
oin
t ch
ang
e
Denm
ark
Source: Stewart (2005b), fig. 14.4.
Finla
nd
Swed
en
Nether
lands
Belgiu
m
Austria
Germ
any
Fran
ce
Luxe
mbourg
Greec
eIta
ly
Irela
nd
Portu
gal
Spai
nUKEU
15
Relative income line
Constant real income line

139
fastest fall against an absolute standard. This illustrates theimportance of looking at movements in both relative andabsolute incomes in trying to understand the position of thepoor. Under the ‘tiered’ approach the British government isnow taking to tracking what is happening to child poverty, itwill be seen to be falling unambiguously only when bothmeasures, and a third including indicators of materialdeprivation, are all falling (HM Treasury, 2004, p. 17).
The UK’s poor record on poverty in international terms canbe traced back to a number of factors, each of which gives aclue to policies that might help reduce it. First, the UK has ahigh proportion of households without income from work.While its recorded unemployment rate is now one of the lowestin the EU, it still has one of the largest proportions of workingage adults in jobless households overall, a manifestation of thegrowth of economic inactivity discussed in chapter 6 (Hills,2004a, table 3.7). Its rate of 10.9 per cent of those aged 18–59living in jobless households in 2003 was exceeded only inBelgium. This is a particularly important driver of child poverty– in the mid 1990s a fifth of all children in the UK were inworkless households, double the OCED average and the highestof 18 countries surveyed by Gregg and Wadsworth (2001). By2003, the rate had fallen a little, but was still the highest in theEU (Hills, 2004a, table 3.7). As figure 20 shows, this is partlydriven by the combination of a high rate of lone parenthood –only New Zealand and the US exceed the UK’s 22 per cent rate –and the low proportion of lone parents who are employed. Thislatter factor has been changing recently, with a 10 percentagepoint increase in the employment rate of lone mothers from 44per cent in 1996 to 54 per cent in 2002 (HM Treasury, 2003a,chart 4.4). Whether the current government’s target of a 70 percent employment rate for lone mothers by 2010 can be reachedis an open question but, as the figure shows, many othercountries do achieve something close to this or higher.
A second factor is the low level of social security benefits forthose out of work in the UK in relation to poverty standards, in
Policy challenges and dilemmas for the next 20 years

One hundred years of poverty and policy
140
Fig
ure
20:
Lo
ne
par
enth
oo
d a
nd
em
plo
ymen
t in
th
e la
te 1
990s
/ear
ly 2
000s
100 90 80 70 60 50 40 30 20 10 0
% lone parents employed
Japan
99
No
te: Y
ears
ref
er t
o d
ata
on
em
plo
ymen
t; y
ears
fo
r lo
ne
par
ent
shar
e m
ay d
iffe
r sl
igh
tly.
Sou
rce:
Ste
war
t (2
005b
), f
ig. 1
4.8,
bas
ed o
n B
rad
shaw
an
d F
inch
(20
02).
Finlan
d 98
Nether
lands 9
7
Canad
a 96
Luxe
mbourg
00
Spain
91
Fran
ce 01
Austria
99
Portu
gal 96
Belgiu
m 97
Swed
en 98
Norway
99
Italy
98
Irelan
d 99
Greec
e 96
Australi
a 00 Ger
man
y 00 Den
mar
k 00
UK 01
New Ze
aland 01
US 00
35 28 21 14 7 0
lone parents as % families
Lon
e p
aren
ts (
% a
ll fa
mili
es w
ith
ch
ildre
n)
(rig
ht-
han
d s
cale
)
% lo
ne
par
ents
em
plo
yed
(le
ft-h
and
sca
le)

141
European terms at least. Figure 21, based on work by Behrendt(2002), shows social assistance entitlements in relation tomedian incomes and hence relative poverty lines in the mid1990s in Sweden, Britain and Germany for six different familytypes. In the Swedish case, social assistance rates are above thepoverty line for all six cases, and in the German case in three ofthem, but in the UK all of them fell short (although a pensionercouple came close to it). Since then, UK social assistance (IncomeSupport) rates have fallen further behind median incomes formost of these cases, although they have improved recently forfamilies with children and pensioners. For a lone parent withtwo children, Income Support rates exceeded 60 per cent ofmedian income by 2004/05 (Stewart, 2005b, fig. 14.12). But forworking age adults without children, Income Support rates arewell below the effective poverty line. As a result, the UK hasone of the highest poverty rates for the unemployed in the EU– just under half in 2001 on the basis used by the EU,3 comparedto under 40 per cent in the EU as a whole.
But the UK also has a relatively high rate of poverty amongthose with income from work – 28 per cent of working singleparents and 19 per cent of single earner couples in 2001,compared with EU averages of 22 and 20 per cent respectively(Stewart, 2005b, fig. 14.9). In the case of lone parents, thisreflects the gender gap in pay generally, but also high rates ofpart-time working and the particularly low rates of pay forwomen working part-time in the UK (Harkness and Waldfogel,2003).
But the UK’s problem of low pay is wider than this. As figure22 shows, the UK had one of the largest increases in wageinequality between 1980 and 2000 of the ten countries shown– only New Zealand and the US had a larger increase, and threeof the ten had a decline. This divergence in experiencessuggests that we cannot look solely for global explanations forthe increase in the incidence of low pay in the UK. It is true thatunskilled workers in many industrialised countries have beenhit by ‘skill biased technological change’, and this has driven
Policy challenges and dilemmas for the next 20 years

One hundred years of poverty and policy
142
Fig
ure
21:
So
cial
ass
ista
nce
en
titl
emen
ts a
s a
pro
po
rtio
n o
f eq
uiv
alis
ed m
edia
n in
com
e: S
wed
en a
nd
Bri
tain
199
5, a
nd
Ger
man
y 19
94
90 80 70 60 50 40 30 20 10 0
% of median income
No
te: I
nco
mes
are
aft
er h
ou
sin
g c
ost
s
Sou
rce:
Ste
war
t (2
005b
), F
ig. 1
4.11
, bas
ed o
n B
ehre
nd
t (2
002)
.
Bri
tain
60%
med
ian
Swed
enG
erm
any
Sin
gle
(35
)
Co
up
le (
68)
Co
up
le (
35)
1 ch
ild (
1)
Co
up
le (
35)
2 ch
ildre
n (
7 an
d 1
4)
Sin
gle
par
ent
(35)
1 c
hild
(7)
Sin
gle
par
ent
(35)
2 c
hild
ren
(1,
7)

143
both unemployment and relative wages (Hills, 2004a, ch. 4). Butthe UK has been hit worse than most. First, institutionalrestraints on low pay weakened in the 1980s – both throughthe decline of trade unions and the abolition of limited wageprotection through the wages councils. Second, Britain had arelatively large number of unqualified workers to start with,and therefore a larger proportion of the population waspotentially affected by both technological change anddevelopments in world trade. The UK’s unequal earningsdistribution is related to its unequal distribution of skills.4 These
Figure 22: International trends in wage differentials: ratios betweenearnings cut-offs for top and bottom 10 per cent in each country
Sweden (80/98)
Finland (80/99)
Netherlands (80/99)
Japan (80/99)
Germany (84/98)
France (80/98)
Australia (80/00)
UK (80/00)
New Zealand (84/97)
USA (80/00)
Note: Figures are for men and women.
Source: Hills (2004a), Fig. 4.6, based on OECD labour market statistics database.
1980 (or early 1980s) 2000 (or late 1990s)
0 21 3 4 5Ration between cut-offs for top and bottom ten per cent
Policy challenges and dilemmas for the next 20 years
One hundred years of poverty and policy
144
factors may interact – in countries where labour marketinstitutions have resisted growing wage dispersion, as incontinental Europe, this may have encouraged investment intechnologies that have increased the productivity of less skilledworkers, and hence slowed the extent to which technologicalchange has been skill biased by comparison with, say, the US(Acemoglu, 2003).
More recently, two factors have changed in the otherdirection. The National Minimum Wage, introduced in 1999,may not have affected a large proportion of workers so far, butit has put a floor to further drift downwards right at thebottom. At the same time, New Labour’s tax credit reformsdescribed in the previous chapter have increased net incomesfor those in low paid work, particularly, but not only, those withchildren. By 2001 the UK had one of the most generous ‘childbenefit packages’ in the world for low paid workers, if we lookacross support through the tax and benefit system and helpwith housing costs for families with children, compared withthose without children (Stewart, 2005b, table 14.2, based onanalysis in Bradshaw and Finch, 2002). This is a considerableimprovement on earlier international comparisons in the 1980sand 1990s (although the means tested nature of the UK systemmeans that it is around the international average in terms ofsupport for families with children and on average earnings).
Finally, one feature of poverty in the UK – and in the US –that stands out from recent international comparisons is thatwhen it occurs, poverty is more likely to be persistent here thanin some other comparable countries. For instance, an OECDcomparison of poverty durations in the early 1990s suggestedthat for those who were affected by poverty in a six yearperiod, the average duration was 2.4 years or less in theNetherlands, Sweden, Germany and Canada, but 3.0 years ormore in the UK and US (Oxley, Dang and Antolín, 1999).Accelerating the rate at which those who fall into poverty canescape it would have a major effect on the proportion of theUK population who are poor at any one time.

145
What do we want? Public attitudes, poverty and policyIn considering how policy towards poverty might develop, acrucial factor is what the public as a whole thinks – eitherbecause policy makers will have to operate within theconstraints of those attitudes, or because attitudes might haveto change before policy can follow. Here responses to the long-running British Social Attitudes (BSA) survey have given veryenlightening information, now stretching over 20 years.5
First, the survey has consistently shown unhappiness with theextent of income inequality in Britain. For instance, in 2002, 82per cent of respondents to the survey said they thought that‘the gap between those with high incomes and those with lowincomes is too large’, with only 13 per cent thinking it is ‘aboutright’, and very few that it is too small. The proportion agreeingis higher now than it was 20 years ago, when income inequalityitself was less, but even in 1983 more than 70 per cent agreed(Hills, 2004a, fig. 2.11). Furthermore, this inequality is not seenas functional: in 1999, 54 per cent of respondents rejected theidea that ‘large differences in income are necessary for Britain’sprosperity’, with only 17 per cent agreeing (Jowell et al., 2000,p. 324).
Second, the survey produces support for the idea that peoplesee ‘poverty’ as being at least in some way related tocontemporary living standards. When offered three definitionsof poverty, around 60 per cent of the population say thatsomeone would be in poverty if they had ‘enough to eat andlive, but not enough to buy other things they needed’ (Hills,2004a, table 3.8). This is clearly more than a bare subsistencelevel, but how much more – and how what constitutes ‘poverty’changes over time – will depend on what people class as‘needs’. Here the results of the 1999 Poverty and SocialExclusion Survey of Britain (PSE survey) indicate that as generalprosperity grows, so does the range of goods and activities thatpeople see as necessities. The PSE survey asked, as did theearlier ‘Breadline Britain’ surveys in 1983 and 1990, whetherpeople thought that particular activities or possessions were
Policy challenges and dilemmas for the next 20 years
One hundred years of poverty and policy
146
‘necessary, which all adults should be able to afford and whichthey should not have to go without’. For instance, in 1983 only43 per cent thought that a telephone was a necessity; by 199972 per cent thought it was (Gordon et al., 2000, table 12).Similarly, in the 1983 and 1990 surveys, fewer than 40 per centthought that the ability to ‘have friends and family round for ameal, snack or drink’ was a necessity; by 1999 65 per centthought that it was.
Further evidence that people see poverty in largely relativeterms can be seen in table 12. When asked what they thoughthad happened to poverty over the previous ten years, half ofrespondents in 1986 and 1989 said it had been increasing – twothirds in 1994 – and just under a third that it was steady – aquarter in 1994. Few thought it had been decreasing. By 2000,roughly equal numbers thought poverty had been steady overthe 1990s as thought it had increased. Looking back at table 10and figure 16 in the last chapter, these perceptions areconsistent with the trends shown in poverty against a relativeline. They are not consistent with people taking an absoluteview – if they had, they would have reported poverty asdecreasing in the ten-year periods up to 1994 and particularlyup to 2000.
As to the level of the poverty line, the BSA survey regularlyasks respondents whether people receiving particular benefitsor with certain incomes have enough to live on. Two features ofthe results are notable. First, when asked about peoplereceiving benefits while unemployed, respondents are morelikely to say they have enough to live on than when they aretold the actual weekly income the benefits give (although inboth cases a majority say the people would not have enough tolive on). Second, the results suggest that when asked about theincomes equating to the 60 per cent of median income line,about half of respondents say this is enough to live on, abouthalf that it is not (Hills, 2004a, table 3.13). Below these levels,large proportions say that income is not enough to live on. Inother words, the closest we have to an ‘official’ poverty line

147
appears roughly in line with the views of the medianrespondent.6
Agreement that poverty exists and has been increasing doesnot necessarily mean that people think government should dosomething about it. However, in 2000 only 23 per cent blamed‘laziness or lack of willpower’ for people’s own poverty. Themajority blamed factors outside individual control – bad luck(15 per cent); ‘an inevitable part of modern life’ (34 per cent);and ‘injustice in our society’ (21 per cent) (Hills, 2004a, table3.14). It is true that the proportion blaming individual factors ishigher than in earlier years (19 per cent in 1986 and 1994, and15 per cent in 1994), and the proportion doing so is the highestin the European Union apart from Portugal (Gallie and Paugam,2002). However, most people in the UK clearly see poverty asthe result of factors outside individual control.7 Furthermore,only 28 per cent respondents to the BSA in 1994 agreed that,‘British governments nowadays can do very little to reducepoverty’; 70 per cent thought they could do ‘quite a bit’. Sincethe 1980s, a majority has agreed – 58 per cent in 2000 – that ‘itis the responsibility of government to reduce the difference inincome between people with high incomes and people withlow incomes’. In 1998, just over half (53 per cent) said that‘government should increase taxes on the better-off to spendmore on the poor’, with only a sixth preferring an alternativestatement that ‘the better-off pay too much tax already’ (Hillsand Lelkes, 1999).
Table 12: Perceptions of trends in poverty in Britain over past ten years,1986–2000, GB (%)
1986 1989 1994 2000
Increasing 51 50 68 37Staying at same level 30 31 24 38Decreasing 15 16 6 20Base 1548 1516 1167 3426
Source: Hills (2004a), table 3.11, based on British Social Attitudes survey.
Policy challenges and dilemmas for the next 20 years
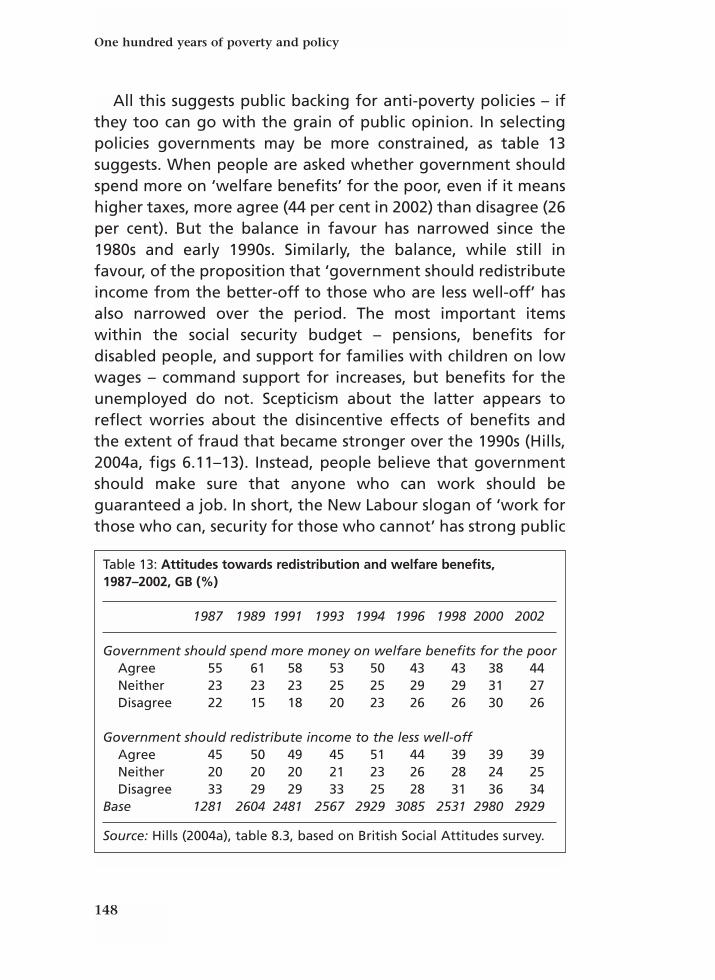
One hundred years of poverty and policy
148
All this suggests public backing for anti-poverty policies – ifthey too can go with the grain of public opinion. In selectingpolicies governments may be more constrained, as table 13suggests. When people are asked whether government shouldspend more on ‘welfare benefits’ for the poor, even if it meanshigher taxes, more agree (44 per cent in 2002) than disagree (26per cent). But the balance in favour has narrowed since the1980s and early 1990s. Similarly, the balance, while still infavour, of the proposition that ‘government should redistributeincome from the better-off to those who are less well-off’ hasalso narrowed over the period. The most important itemswithin the social security budget – pensions, benefits fordisabled people, and support for families with children on lowwages – command support for increases, but benefits for theunemployed do not. Scepticism about the latter appears toreflect worries about the disincentive effects of benefits andthe extent of fraud that became stronger over the 1990s (Hills,2004a, figs 6.11–13). Instead, people believe that governmentshould make sure that anyone who can work should beguaranteed a job. In short, the New Labour slogan of ‘work forthose who can, security for those who cannot’ has strong public
Table 13: Attitudes towards redistribution and welfare benefits,1987–2002, GB (%)
1987 1989 1991 1993 1994 1996 1998 2000 2002
Government should spend more money on welfare benefits for the poorAgree 55 61 58 53 50 43 43 38 44Neither 23 23 23 25 25 29 29 31 27Disagree 22 15 18 20 23 26 26 30 26
Government should redistribute income to the less well-offAgree 45 50 49 45 51 44 39 39 39Neither 20 20 20 21 23 26 28 24 25Disagree 33 29 29 33 25 28 31 36 34
Base 1281 2604 2481 2567 2929 3085 2531 2980 2929
Source: Hills (2004a), table 8.3, based on British Social Attitudes survey.

149
resonance. Whether what is being done to deliver it is enough,and whether views would be different if there was widerknowledge of just how low some benefit levels are, aredifferent questions.
The unfinished agenda? The JRF Income and WealthInquiry ten years onIn February 1995 the Joseph Rowntree Foundation’s Incomeand Wealth Inquiry Group, chaired by Sir Peter Barclay,published its report. The group, with a broadly basedmembership, had been convened by the Foundation asevidence accumulated on the extent to which incomeinequality and relative poverty had grown since the late 1970s.8
It reviewed evidence, both from official sources and from aresearch programme specially commissioned by theFoundation. Most of the statistical evidence available thencovered the period up to between 1991 and 1993.
The group concluded that ‘Policy-makers should beconcerned with the way in which the living standards of asubstantial minority of the population have lagged behindsince the late 1970s. Not only is this a problem for those directlyaffected, it also damages the social fabric and so affects us all’(Barclay, 1995, p. 8). Given that conclusion, the group produceda wide-ranging series of recommendations, headline versions ofwhich are listed in box 3. As well as this list of specific measures,the Inquiry Group argued that ‘It is hard to overstate theimportance of raising education and training standards inBritain . . . Nor is it a matter of choosing where to redirectexisting resources at the expense of currently favoured sectors;greater investment is required at virtually every level’ (Barclay,1995, p. 10). Tony Blair’s three priorities of ‘education,education, and education’ before the 1997 election sounded asimilar note (although the new investment did not come untilafter 1999).
Policy challenges and dilemmas for the next 20 years

One hundred years of poverty and policy
150
Box 3 Recommendations of the 1995 JRF Income and WealthInquiry Group
Recommendation Outcome
Labour market
1 Direct provision of No.employment opportunities.
2 Greatly increased childcare Yes – but more emphasis provision. on subsidies than provision.
3 More flexibility in working Can now request.time.
4 Strengthened legislation Yes (e.g. Disability against discrimination, Discrimination Act).including disabled people.
5 Subsidies to take on long In New Deal.term unemployed.
6 Minimum wage and/or Both.more in-work benefits.
7 Review of social security No.for part-timers and self employed.
Social security – out of work
8 Benefits should rise by more Generally inflation only,than inflation. unless have children.
9 More Social Fund grants, Increases in funds for some not loans. forms of grant.

151
Recommendation Outcome
10 If on benefit:
(a) Relaxed rules on No major change.education;
(b) More work training with Training options under allowances; New Deals.
(c) No ‘long term’ In New Deal.unemployment without work offer;
(d) Training guarantee; In New Deal.
(e) Wider entitlement for No.16–17 year olds;
(f) Easier to do voluntary Partly.work.
11 Think again about 6 month No.limit on non-means tested Jobseeker’s Allowance.
12 Disregard of maintenance New Income Support in Income Support. recipients have £10 of
maintenance receiptsdisregarded, andmaintenance is disregardedfor tax credits.
Between benefits and work
13 Speed up calculation and New structure of Child Tax payment of in-work Credit means payment benefits. continues on move into
low-paid work, but initialproblems with tax creditadministration. Somebenefit ‘run-ons’ extended.
Policy challenges and dilemmas for the next 20 years

One hundred years of poverty and policy
152
Recommendation Outcome
14 Easier reactivation of Yes.Income Support claims.
15 More publicity for ‘trial Yes.periods’ in work.
16 Fixed allowance for long Principle of fund available term benefit recipients for both benefits and other trying to get back to work. costs of getting to work is
part of Employment Zones.
17 Lump sum payment on Yes – £100 Job Grant (and return to work. complex system of back-to-
work bonus for those withearnings while on benefit).
18 Higher earnings disregard No.in Income Support, with possibility to accumulate over 6 weeks.
19 Disregard of childcare and Childcare tax credit now work expenses. helps with childcare costs
in work.
20 Restore free school meals No.to those on Family Credit.
21 Reduced benefit Reduced for Child Tax withdrawal rates in Family Credit and Working Tax Credit and Housing Benefit. Credit, but not for Housing
Benefit (although reducedfor those ‘floated off’Housing Benefit).

153
Recommendation Outcome
Pensions
22 Need for political consensus. No.
23 ‘Clear encouragement’ for Incentive for additional all income groups to accumulation increased for accumulate private pension some as a result of Pension rights. Credit, but reduced for
others.
24 Avoid extension of means No – means testing testing. widened.
25 Floor to retirement incomes Yes – on means tested rising faster than price basis, if Guarantee Credit indexation. claimed.
Taxation
26 Reduced share of tax on Yes – if tax credits included.low incomes.
27 Restructuring of National Yes.Insurance contributions for low paid.
28 Review of taxation of ‘Gift Aid’ easier.charities and greater incentives to donate.
Housing
29 Social rent levels should Depends on comparator.be moderated.
30 (a) Avoid concentrated ‘Choice-based lettings’ inallocations; some areas.
(b) New developments – In part.tenure mix.
Policy challenges and dilemmas for the next 20 years

One hundred years of poverty and policy
154
Recommendation Outcome
Marginalised areas
31 Need for strategy to Yes – National revitalise marginalised Strategy for areas. Neighbourhood Renewal.
32 Specific items:
(a) Involvement of business Represented on Local leaders; Strategic Partnerships, but
without a major role.(b) Training link with Some examples.
employers;(c) Local managers with Within some initiatives, not
decentralised budgets others.and resident involvement;
(d) Long-term support Not many examples.workers;
(e) Resident training; Yes – ‘capacity building’ programmes.
(f) Radical improvement in Improvement in primary local schools; schools; less evidence in
secondary schools.(g) Positive role for young Some examples, such as
people; ‘Young Movers’.(h) Improved transport; Very variable.(i) Economic regeneration Limited.
for certain regions beyond estate initiatives.

155
Alongside the list in the box is a short note of what hashappened to related policy since then. This gives a convenientchecklist against which to compare recent policy developmentssummarised in the previous chapter. An immediate observationis that there is a substantial overlap between the InquiryGroup’s recommendations and policy as it has developed since1997. Roughly half of the 46 recommendations itemised in thebox have been adopted largely as suggested, and only 8 haveclearly not been followed. In some respects policy has gonefurther than the Inquiry Group argued for – notably perhapsthe child poverty commitments and structure of the new taxcredits, the labour market measures associated with the NewDeal, and some aspects of the National Strategy forNeighbourhood Renewal. The differences also highlight somekey features of New Labour policy:
• Policy as it has developed has more emphasis on meanstesting than implied by the Inquiry Group, particularly forpensioners, but also for the unemployed.
• While low income pensioners and those with children havebenefited from above inflation increases in benefits (and taxcredits), working age people without children have not.
• While the New Deals have gone further in many ways thanthe Inquiry Group programme, there has not been much byway of ‘direct provision of employment opportunities’, andthe benefit treatment of those remaining unemployed hasgenerally remained tougher than several of the Group’srecommendations suggested.
• Policy has covered a wider range of issues than touched on bythe Inquiry Group, for instance, in some of the groups ofvulnerable young people focused on by the Social ExclusionUnit and related policy change, the emphasis now beinggiven to early years policy, and the attention – if limitedspecific action9 – devoted to health inequalities.
Policy challenges and dilemmas for the next 20 years

One hundred years of poverty and policy
156
A striking feature of New Labour has been the lack of emphasison inequality overall – between top and bottom – as a focus ofpolicy since 1997, as opposed to the strong focus on inequalitybetween the bottom and the middle. What is also clear is thatdespite the many areas in which there have been policyinitiatives, there are still gaps. The discussion above highlightsthe position of working age adults without children who aredependent on benefits. Other groups have also had their rightsreduced by other aspects of government policy – most notablyasylum seekers (Burchardt, 2005): the commitment to ‘inclusion’has, literally, had borders.
Constraints and pressures on future policyPublic opinion is not the only constraint on policy makers.Looking ahead, there is little sign that life will become easierfor those trying to reconcile public demands for a more equalsociety, public services that meet the demands of an ageing andmore affluent society, and political constraints on resourcesavailable through taxation.10
The most obvious pressure comes from an ageing society. It isnot inherent in increased life expectancy that social spendingshould increase as a share of income. After all, one couldimagine a world in which the ages at which all events relatedto economic activity and social needs grew in proportion – agesof entering education, leaving education and entering thelabour force, retirement, onset of greater medical and careneeds, and eventual mortality. The overall balance betweensocial spending and national income could stay the samewithout strain – but with periods at work and periods receivingtransfers in cash and kind lengthened in proportion. But asthings have developed and seem likely to develop, this does notappear to be happening:
• There is no sign of delay in entering education, quite thereverse, but ages to which people remain in education arerising.

157
• Retirement ages have begun to creep back up in the last tenyears, but had previously fallen rather than risen as lifeexpectancies increased. Expectations for the future are stilldominated by the idea of retirement at a particular age – say,65 – rather than one which relates to growing lifeexpectancies.
• Britain’s population structure has not been in a steady state.Fertility rates have been in decline long term. This has beenmasked by the ‘baby boom’ generation, born after theSecond World War, but when this generation reaches 65, theratio between those aged over 65 and those of working agewill rise sharply.
• We simply do not know how health and long term care needswill develop as the population ages. An optimistic view wouldbe that needs would be delayed until people were older – thiswould actually put off needs for social spending, and help thepublic finances. Alternatively, such needs could remain thesame for people of any given age, and so pressures on socialspending would increase fast as a greater proportion of thepopulation exceeded any given age.
At the same time, the presumption that we will continue tobecome a more affluent society does not necessarily helpthings. If we could keep the salaries of doctors, teachers, nursesand road-menders fixed indefinitely in real terms, the cost ofproviding public services might fall in relation to nationalincome. However, the evidence is that if public sector pay lagsbehind other incomes, there is eventually a period of catch-upto cope with the problems of quality, retention, recruitmentand low morale. Equally, if productivity in providing servicesgrew fast enough, the share of GDP required could fall. Theproblem is not necessarily that productivity does not improve –but rather that public expectations for service quality, based onexperience elsewhere in the economy, rise just as fast. Evenworse, the very services where public provision is important –health care and education – are ones to which people appear to
Policy challenges and dilemmas for the next 20 years

One hundred years of poverty and policy
158
want to devote an increasing proportion of their resources asthey become better off. As a result, quite apart from any factorsassociated with ageing or tackling disadvantage, one mightexpect the demands for social spending to rise as a share ofnational income over time. There certainly seems little reasonto assume that they will fall as a result of economic growth.
Similarly, if we saw poverty in absolute terms, tackling itwould become easier as real incomes grew. Funding socialsecurity benefits merely with a stable real value while incomes(and taxes) are growing reduces the pressure on public financesquite considerably, as we know from the last 20 years. However,the evidence reviewed above suggests that views of povertyand inclusion actually relate to contemporary living standards.The real cost of relieving poverty in these terms rises as incomesrise – unless other factors move rapidly in the right direction,and incomes from other sources fill the gap.
To give an idea of the magnitude of these pressures, we cancalculate what would happen to social spending if we carriedon in future spending the same amount on each person of agiven age as we do now in relation to average incomes,allowing for current official projections of the future agestructure of the population. Looking just at health, educationand social security, this would imply spending rising from 21.8per cent of GDP in 2001 to 26.3 per cent of GDP in 2051 (Hills,2004a, table 10.2). For some this will be seen as clearly feasible– it is an increase of less than 0.4 per cent per year, and much ofthe increase in health spending is already built into governmentplans, for instance. For others, if translated into today’s money,it would mean extra spending – and taxes – eventually of anamount equivalent to £50 billion per year, a politically veryalarming figure if it was needed all at once. There are reasonswhy fiscal life might be easier – the projected increase in lifeexpectancy might turn out to be mostly of ‘healthy’ life, forinstance, and both retirement ages and the age of onset ofhealth care needs could both rise. But there are probably morefactors that would make things harder – the calculation does

159
not allow for making progress in reducing poverty, or for risinglong term care needs. The latter could be substantial.11
One of the things we do not know is whether the otherfactors referred to above will ‘move in the right direction’, thatis in ways that reduce the market inequalities that the socialsecurity and tax credit systems end up compensating for.Economic growth in the last 20 years in the UK and US has beenassociated with widening market inequalities. However, this hasnot been the case in other countries, and in previous eras thepresumption was that income inequality would reduce aseconomies developed. It would be optimistic to assume that thetrends of the last few years will suddenly reverse. On the otherhand, these trends are not inevitable, and policies towards thelabour market, minimum wages, skills, education,discrimination, childhood poverty, disadvantaged areas andinvestment may all make a difference to people’s ability toderive incomes from the market.
Some of the pressures on the public finances can be kept incheck while making progress on poverty if there is morereliance on ‘targeting’ services and benefits on the poorest.Indeed, this has been an important part of the story of the lastseven years. But there are limits to how far this can be pushed.On the one hand, figure 13 has already shown the wide incomerange across which the quite high effective marginal tax ratesassociated with the new tax credits now stretch. On top ofthese come other income tested transfers from the state –Education Maintenance Allowances for families with 16–17year olds; student finance support worth at least £3,000 a yearfor students from families with low or moderate incomes bycomparison with those with higher incomes; or repayment ofstudent loans at a rate of 9 per cent of earnings above athreshold. Some families will face more than one of these atonce. Adding to them through further income testing meanseither deepening or widening what was once the ‘poverty trap’but which now affects those with incomes nearer to theaverage.
Policy challenges and dilemmas for the next 20 years

One hundred years of poverty and policy
160
There is also a political problem: if the government is raisingtaxes to improve public services, but all of the proceeds areconcentrated on the poorest, many voters will see little returnfor their money. Of course, ensuring that the poorest gaindisproportionately is the aim of a poverty reduction strategy.But a policy of ‘progressive universalism’ as New Labour hastagged it (and has delivered in the case of support for children),means that spending has to increase even faster than under apolicy where general needs are kept up with, but nothing extrais done for the poor.
All of this leaves policy makers with some acute dilemmas:there is public backing for a continuing assault on poverty, butboth the instruments and resources available to mount it looklikely to be even more tightly constrained in the next few years.In the final chapter we discuss alternative ways in which thesepressures may play out.

Part IVConclusions


163
More complex and difficultWhen Seebohm Rowntree was writing a century ago he couldtalk about poverty as it affected a relatively homogeneousworking class population in the town, York, that he studied.What drove poverty could be narrowed down to a fairly narrowset of factors, several of them related to variations in needs andearnings capacity over the life cycle – large families, loss ofearnings due to sickness and old age without any other incomesource.
Sixty years ago, Beveridge could take results from Rowntree’s1899 and 1936 surveys to suggest that poverty could be tackledwithout much by way of redistribution between social classesthrough the combination of a social insurance system coveringold age and risks of unemployment and sickness, together witha system of family allowances and a National Health Service.Problems related to the life cycle and to risks to which mostwere exposed could be dealt with through life cycleredistribution and insurance. Even then, Beveridge was skatingover the problems of low pay and of what could really beachieved without progressive ways of raising money andredistribution between classes.
Today both the drivers of poverty and the policies that mightbe marshalled to tackle it are more diverse, and the politics ofdoing so correspondingly more complicated. Widerconceptualisations of disadvantage increase the dimensions
8 Poverty and progress for the nextgeneration?

One hundred years of poverty and policy
164
across which failure to achieve inclusion is seen as a problem.Problems have changed their shape as well – in 1899 children inlarge families represented a major cost in money and cause ofpoverty; now families are smaller but children also represent atime cost that leads to earnings forgone for some parents butalso pressured lives for others.
But we have done betterSo one conclusion from this review of the last century is thatsome of the issues have become more complex. A second is thatincreasing affluence by itself does not solve the problems ornecessarily make it easier for policy makers to do so. A third is,however, that there have been periods when we have donemuch better than recently. The post-war welfare state and fullemployment may not have led to quite the abolition of povertysuggested by Rowntree’s flawed analysis of his third survey ofYork in 1950, but they certainly led to major progress bycomparison with the first half of the twentieth century. Therecords of the Labour governments of the 1960s and 1970swere criticised at the time for slow progress in reducing povertyand inequality, but some aspects of their records look enviabletoday.1
A common factor in the periods of progress – and in theareas where undoubted progress has been made since the mid1990s – is that policies have simultaneously tackled the ‘causesof social ills’ and worked to address their ill effects. Where it hasbeen assumed that poverty can be tackled through just one ofthese, or that they are alternatives, we have been much lesssuccessful. Hoping that economic growth will trickle down tothe poor or that welfare-to-work programmes by themselveswill solve working age poverty without any change in theincomes of those remaining out of work have not worked. Butnor have strategies relying only on the redistribution of incometo ameliorate the impact of market income inequalities thatreflect much deeper differences in economic opportunity. Thisis not just because the underlying problems are left untouched,

165
but also because political support for such a strategy is muchharder to marshal.
The dynamics of anti-poverty policyRowntree’s insights in identifying the relationship between therisk of poverty and the life cycle can be seen as an early exampleof social science concern with the dynamics of poverty. Recentanalysis of this kind helps suggest fruitful areas for policy,whether it is addressing intergenerational links betweenchildhood circumstances and later disadvantage, or the factorsassociated with short term movements in and out of poverty.This kind of approach also suggests that we should not beseeing ‘passive’ and ‘active’ social policies as alternatives.Rather we should be thinking about whether we have policiesthat tackle all four of the quadrants shown in figure 23, whichdivides policies according to whether they are concerned withaffecting the risk of something happening or affecting itsimpact when it does, and whether they are concerned withadverse or positive events. This suggests that policies can haveone or more of the following impacts:
• Prevention of an event or reduction of the risk of entering anundesirable state – for instance, training to improve jobretention, or adaptations at work or in working patterns sothat people can continue working after the onset of animpairment or a change in demands on them for caring.
• Promotion of exit or escape – for instance, ‘welfare to work’policies to help people move out of unemployment oreconomic inactivity.
• Protection from the impact of an event, for instance payingbenefits to those who become unemployed.
• Propulsion away from adverse circumstances by reinforcingthe benefits of exit – for instance, the effects of the in-workbenefits on the incomes of those leaving unemployment, orpost-employment support to ensure that the next careermove is upwards.
Poverty and progress for the next generation?

One hundred years of poverty and policy
166
Importantly, policies can have more than one of these impactsat the same time. For instance, paying benefits and tax creditsto low income families with children may be ‘protective’ todaybut may also have long run ‘preventive’ effects if children areno longer growing up in poverty.
Gaps and challengesFrom this point of view one of the great strengths of policytowards poverty and social exclusion since 1997 has been that ithas been multifaceted, and the most promising parts of it – forinstance those concerned with childhood disadvantage – haveindeed begun to address all four of these impacts ofintervention at once. Given the multiplicity of drivers ofpoverty, it makes sense to address it with multiple policies. It ishard to see anything in the current policy mix of which we needless if we are to make real progress (Hills and Stewart, 2005).But there are gaps and challenges still to address, some ofwhich we have touched on in earlier chapters:
• Continuing high levels of economic inactivity and numbers ofworking age households that are jobless. The initial impact ofthe ‘New Deals’ appears to have slowed (McKnight, 2005).
• Benefit incomes of those without children who are out ofwork. The group in poverty that are deepest in poverty – havethe largest ‘poverty gap’ – are single adults without children,2
unsurprising given the level of their benefits in relation to thepoverty line shown in figure 21. Income Support for a single
Figure 23: Four forms of intervention
Focus ofintervention
Entry to adverse state
Exit from adverse state
Prevention
Promotion
Protection
Propulsion
Risk of event Effects of event
Intervention to change

167
adult is now lower than the support given for a family’s firstchild – and the gap will widen since the former is price linked,but the latter earnings linked.
• The very low wages of many women working part-time.• Achievement levels in secondary schools in poor areas.• Particularly high rates of poverty among particular groups –
for instance, those from certain ethnic minorities, anddisabled people – reflecting a mixture of problemsencompassing both discrimination and levels of skills andqualifications.
• Pensioners who fail to take up the income that should beguaranteed by the ‘guarantee credit’ in Pension Credit,particularly older women.
An optimistic viewLooking ahead it is possible to take optimistic or pessimisticviews of how policy towards poverty will develop over the next20 years. On an optimistic view, policies will begin to establisha virtuous circle, as measures aimed at tackling the causes ofpoverty start to change underlying inequalities, reducing thenumbers dependent on state assistance, and so freeing upresources to allow more generous treatment of those whoremain so and the extension of policies to cover current gaps.Thus if policies succeeded in raising the skills of disadvantagedyoung people and in reducing the economic disconnection ofthe most disadvantaged areas, incomes from work of theotherwise poor would rise, and the costs of social securitybenefits and tax credits for them would fall. This could liberateresources3 to improve the value of benefits to those receivingthem, also reinforcing the political will to do so, backed by thepublic desire for governments to reduce poverty discussed inchapter 7. While the demographic pressures on social spendingwill be upwards, reductions in economic inactivity, increases inthe average age of retirement,4 and ‘healthy ageing’ wouldmake them easier to cope with. This could make possible amore general strategy of ‘progressive universalism’ under
Poverty and progress for the next generation?
One hundred years of poverty and policy
168
which social provision improves for all, but most for the poor,making gradually rising taxation acceptable – all taxpayerswould be getting something for their money, while seeingpoverty falling.
A pessimistic viewOn a bleaker, pessimistic view, any success in tacklingunderlying inequalities would come too slowly to countercontinuing polarisation of economic opportunities. Thosewithout access to capital, home ownership and good educationfor their children would fall further behind – widening wealthinequalities would continue to reinforce intergenerationallinks, for instance as those with most wealth purchase housesnear good schools. Even if policy succeeded in raising the skillsof some young people, the lowest wages would still be set byan increasingly cut-throat global market. While the rising costof policies to ameliorate the effects of growing marketinequality on relative incomes (such as the new tax credits)would be visible, progress in reducing poverty would be slow ornon-existent, and political support for pushing such strategiesfurther would be weakened. Rapid increases in age relateddemands on social spending could mean that taxes would haveto rise, but without taxpayers seeing what they were gettingfor their money, squeezing the political headroom for moreresources to tackle poverty, and pushing governments furtherback into means tested programmes with incomplete take-up,disincentive effects and weak political support. Reinforcing thelatter, if the poor are seen as ‘other’ it is easy to stir upprejudice, as we saw in Britain in the nineteenth century, and ashas been suggested as a reason for differences in attitudes topoverty policy in the US and Europe.5
Rowntree’s own conclusionThere is no easy way of saying which of these scenarios is themore likely. But we are more likely to establish a virtuous circleif the need for progress on reducing poverty has a high public

169
and political profile. Charles Booth and Seebohm Rowntreeshowed that sound evidence was one answer to prejudiceabout the poor. ‘Lifting the curtain’ and shining an honest lighton reality in the poorest parts of our society is a contributionsocial scientists can continue to make.
Britain was the first country to develop poverty measures,and the science has a distinguished and influential history inthis country. The early poverty researchers were businessmenwho were concerned enough about social problems to devotetheir spare time to investigating them. Their successors havebeen academic sociologists, statisticians, economists and civilservants, all attempting to produce rigorous research into thisthorny and complex problem. Good policy making requiressolid facts to go on, but definitions of poverty are invariablysubjective and can alter our impressions of the magnitude orsource of the problem. Different methods lead to differentresults, but a general picture of the historical trends and currentsituation emerges. It is pessimistic in that Britain had very highpoverty rates for the last 15 years of the twentieth century andstill has higher poverty rates than most other Europeancountries. It is almost inevitable that parts of society becomedisaffected as a result. But it is optimistic in that poverty wasmuch reduced by the Beveridge reforms, full employment andby the sharing of national prosperity with those living onbenefits in the 1960s and 1970s. Recent reforms and the declinein unemployment have also led to a reduction in poverty,particularly in child poverty. This all suggests that, if thepolitical will is there, there is no reason why policies cannot beas effective today in further reducing poverty as they were inthe past. Rowntree’s own conclusion from a century agoremains apposite:
That in this land of abounding wealth, during a time ofperhaps unexampled prosperity, probably more than onefourth of the population are living in poverty, is a factwhich may well cause great searchings of heart. There is
Poverty and progress for the next generation?

One hundred years of poverty and policy
170
surely need for a greater concentration of thought by thenation upon the wellbeing of its own people, for nocivilization can be sound or stable which has at its base thismass of stunted human life. The suffering may be all butvoiceless, and we may long remain ignorant of its extentand severity, but when once we realize it we see that socialquestions of profound importance await solution. (1901, p. 304)

171
1 Introduction1 Available in a centennial edition published in 2000.
2 This chapter draws extensively on Jo Webb’s ‘Always with us?The evolution of poverty in Britain, 1886–2002’ (2002).
3 The discussion of the period since 1997 draws heavily on abook written alongside this one, A more equal society? NewLabour, poverty, inequality and exclusion, edited by JohnHills and Kitty Stewart (2005). More detail on some of thetrends and issues discussed here can also be found inInequality and the state by John Hills (2004a). Research forthese books was financially supported by the JosephRowntree Foundation, and by the Economic and SocialResearch Council through its general support for the Centrefor Analysis of Social Exclusion (CASE) at the London Schoolof Economics. The authors are very grateful to our funders,to colleagues within CASE for their support and assistance,particularly to Lucinda Himeur in preparing the typescript,and to Fran Bennett and Anne Power for their advice onrecent changes in the social security system and in housingpolicy. The views expressed, and any errors and omissions, arethose of the authors alone.
Notes

One hundred years of poverty and policy
172
2 The context for Rowntree’s contribution1 Assistance to the poor from local parishes under the Poor
Law.
3 Changes in poverty1 These are analysed in Webb (2002).
2 For the benefit of younger readers, 12 pence (d) made oneshilling (s) and 20 shillings made one pound (£).
3 Hills (2001), p. 4 (see also chapter 7 below); Kilpatrick (1973);Hagenaars and Van Praag (1985).
4 Townsend’s alternative deprivation indicators approach hasmany similarities to the budget standard method butconstructs the poverty line in a less transparent manner.
4 Why has poverty changed?1 Family Resources Survey data are Crown Copyright. For their
use acknowledgement is made to the Department of SocialSecurity, the Department for Work and Pensions, the Officefor National Statistics and the UK Data Archive.
2 Households were assigned to the first of the followingcategories that they corresponded to: (1) widows; (2) headabove pension age or permanently sick or disabled; (3) headunemployed; (4) four or more children; (5) in paid work; (6)all others. Categories are close, but not exactly the same, forthe two years.
3 1901 Census, table 28; 2001 Census, table KS04; the base forboth years is all aged 16 and over.
4 1901 Census, table 36; 2001 Census, table KS04.
5 Family Spending 2001/02, Office for National Statistics, 2003.
6 Since earnings of the servant-keeping class are not recorded,a low estimate of their earnings has been used to determinethis figure; if a higher estimate were made this would reducethe figure.

173
7 Family Resources Survey, 2001/02.
8 Lakin (2003).
5 Poverty policy from 1900 to the 1970s1 See a collection of retrospective views in Hills, Ditch and
Glennerster (1994).
6 The last quarter century1 See Hills and Stewart (2005) for a comprehensive discussion
of policy since 1997 and its results.
2 For an assessment of the impact of these policies, see Luptonand Power (2005).
3 Note that the indices for prices and earnings used by DWP inthese two series are applied at different points within theyear, so the two diagrams show slightly different patternsover time.
4 Partly financed by the final abolition of the Married Couple’sAllowance within income tax.
5 However, those whose incomes increase by only a relativelysmall amount (£2,500 in 2003/04) do not in fact have their taxcredits cut back for the tax year when the increase occurs, so,for a time, effective marginal tax rates are lower than the 70per cent figure. Equally, under the 1997/98 system, FamilyCredit was only adjusted every six months, so for someincome ranges the impact of changing incomes was alsodelayed.
6 For details of how the systems result in these outcomes, seeHills (2004b).
7 In fact, many higher earners would have ‘contracted out’ ofSERPS and would receive part of the amount shown throughtheir occupational pension scheme in return for having paid
Notes

One hundred years of poverty and policy
174
reduced National Insurance contributions while they wereworking.
8 Again, many ‘contracted out’ higher earners would actuallyreceive less than this from the state, but would have had theoffsetting advantage of lower National Insurancecontributions when at work.
7 Policy challenges and dilemmas for the next 20 years1 This section draws heavily on research by Kitty Stewart
(2005b).
2 Given the rapid reduction in child poverty in the UK againstthis kind of standard since 1996/97 (see the lower part oftable 10), this position may well now have improved,particularly by comparison with the US.
3 Stewart (2005b, fig. 14.13), using incomes before housingcosts and the OECD equivalence scale. As we saw in table 2above, after housing costs and using the McClementsequivalence scale, 73 per cent of households with a chiefwage earner out of work were counted as poor in Britain in2001/02.
4 See Darton, Hirsch and Strelitz (2003), fig. 30.
5 See, for instance, Park et al. (2003) for results from the 2002survey, including a description of the survey and how it iscarried out in its appendices. For more detailed discussion ofsome of the results discussed in this section, see Hills (2001,2004a).
6 It is also true that when respondents were asked in 2001what proportion of children were poor, the median responsewas 25 per cent, also roughly in line with the official figuresfor child poverty against the 60 per cent of median incomeline (Taylor-Gooby and Hastie, 2002, appendix figure).However, responses to other questions of this kind, such asthe proportion of social security going to unemployedpeople, were a long way from the mark, so some mighttemper the weight put on this finding.

175
7 By contrast, in the US, when people were asked to choosebetween two reasons for people living in need, 61 per centblamed laziness or lack of willpower rather than societytreating them unfairly (Hills, 2004a, p. 69, based on WorldValues Survey results).
8 John Hills acted as Secretary to the Inquiry Group.
9 See Sassi (2005) for a discussion.
10See Hills (2004a), ch. 10, for a more detailed discussion, andthe first report of the Pensions Commission, chaired by AdairTurner, published in October 2004, for a discussion of futureprospects for pensions.
11Wittenberg et al. (2004) show that there is a very large‘funnel of doubt’ about future long term care costs, but theupside risk is considerable. On one scenario, if age-specificneeds did not decline as life expectancy lengthens and carestandards improve moderately, then with currentdemographic projections, total public and private long termcare costs could rise from 1.4 per cent of GDP now to 3.4 percent in 2051, with the state component rising from 0.9 to 2.3per cent of GDP. If free personal care was extended fromScotland across the UK, in this scenario, the public costswould be another 0.75 per cent of GDP higher.
8 Poverty and progress for the next generation?1 Hills and Stewart (2005), table 15.1.
2 Darton, Hirsch and Strelitz (2003), fig. 7.
3 Darton, Hirsch and Strelitz calculate that eradication ofpoverty within 20 years would require incomes of thepoorest fifth to grow annually by 7 per cent per year, whileother incomes grew by 2.5 per cent (2003, p. 15). Theysuggest that the aggregate ‘poverty gap’ to be closed isequivalent to about a fortieth of national income, or abouta twentieth of expected gains from growth over the period.If this was achieved simply through income transfers, the
Notes

One hundred years of poverty and policy
176
gross cost would be higher, of course, as it is hard to imaginesuccessful policies that would affect only the poorest.
4 See the first report of the Pensions Commission, published inOctober 2004, for a discussion of the trade-offs betweenfuture pensioner living standards, retirement ages and levelsof public and private pension contributions.
5 Alesina and Glaeser (2004) suggest that in the US racial andethnic prejudices have been manipulated to supportjudgemental views about the poor. In Europe such viewshave been less judgemental, but the authors warn that therapidly changing ethnic and social mix may change this infuture.

177
Abbott, E. (1917) ‘Charles Booth, 1840–1916’, Journal ofPolitical Economy, 25(2): 195–203.
Abel-Smith, B. and Townsend, P. (1965) The poor and thepoorest, Occasional Papers in Social Administration 17,London: Bell.
Abrams, M. (1951) Social surveys and social action, London:Heinemann.
Acemoglu, D. (2003), ‘Cross-country inequality trends’,Economic Journal, 113(48): F21–49.
Alesina, A. and Glaeser, E. L. (2004) Fighting poverty in the USand Europe: A world of difference, Oxford: Oxford UniversityPress.
Atkinson, A. B. (1969) Poverty in Britain and the reform of socialsecurity, Cambridge: Cambridge University Press.
Atkinson, A. B. (2000) ‘Distribution of income and wealth’, in A.H. Halsey and J. Webb (eds), Twentieth-century British socialtrends, Basingstoke: Macmillan.
Atkinson, A. B. and Micklewright, J. (1989) ‘Turning the screw:Benefits for the unemployed 1979–1988’, in A. Dilnot and I.Walker (eds), The economics of social security, Oxford:Oxford University Press.
Atkinson, A. B., Corlyon, J., Maynard, A. K., Sutherland, H. andTrinder, C. G. (1981) ‘Poverty in York: A reanalysis ofRowntree’s 1950 survey’, Bulletin of Economic Research, 33:59–71.
References

One hundred years of poverty and policy
178
Baldwin, P. (1990) The politics of social solidarity: Class bases ofthe European welfare state, Cambridge: CambridgeUniversity Press.
Baldwin, S. and Falkingham, J. (1994) Social security and socialchange: New challenges to the Beveridge model, HemelHempstead: Harvester Wheatsheaf.
Barclay, P. (chair) (1995) Inquiry into income and wealth, vol. 1:Report of the inquiry group, York: Joseph RowntreeFoundation.
Beckerman, W. and Clark, S. (1982) Poverty and social security inBritain since 1961, Oxford: Oxford University Press.
Behrendt, C. (2002) At the margins of the welfare state: Socialassistance and the alleviation of poverty in Germany, Swedenand the United Kingdom, Aldershot: Ashgate.
Beveridge, W. (1942) Social Insurance and Allied Services, Cmd6404, London: HMSO.
Blair, T. (1999) ‘Beveridge revisited: A welfare state for the 21stcentury’, in R. Walker (ed.), Ending child poverty: Popularwelfare for the 21st century, Bristol: Policy Press.
Blaug, M. (1963) ‘The myth of the old Poor Law and the makingof the new’, Journal of Economic History, 23: 151–84.
Booth, C. (1888) ‘Condition and occupations of the people ofEast London and Hackney, 1887’, Journal of the RoyalStatistical Society, 51(2): 276–339.
Booth, C. (1891) ‘Enumeration and classification of paupers,and state pensions for the aged’, Journal of the RoyalStatistical Society, 54(4): 600–43.
Booth, C. (1892–7) Labour and life of the people in London,London: Macmillan.
Bosanquet, H. (1903) ‘The “poverty line”’, Charity OrganisationReview, 8(78): 321–5.
Bowley, A. L. and Burnett-Hurst, A. R. (1915) Livelihood andpoverty : A study in the economic conditions of working-classhouseholds in Northampton, Warrington, Stanley andReading, London: Bell and Sons.

179
Bowley, A. L. and Burnett-Hurst, A. R. (1920) Economicconditions of working-class households in Bolton, 1914: Asupplementary chapter to ‘Livelihood and poverty’, London:Bell and Sons.
Bowley, A. L. and Hogg, M. H. (1925) Has poverty diminished? Asequel to ‘Livelihood and poverty’, London: King.
Bowpitt, G. (2000) ‘Poverty and its early critics: The search for avalue-free definition of the problem’, in J. Bradshaw and R.Sainsbury (eds), Getting the measure of poverty: The earlylegacy of Seebohm Rowntree, Aldershot: Ashgate.
Bradshaw, J. (1993) Budget Standards for the United Kingdom,Aldershot: Avebury.
Bradshaw, J. and Finch, N. (2002) A comparison of child benefitpackages in 22 countries, DWP Research Report 174, Leeds:Corporate Document Services.
Brewer, M., Duncan, A., Shephard, A. and Suárez, M. J. (2003)Did Working Families’ Tax Credit work? Analysing the impactof in-work support on labour supply and programmeparticipation, London: Inland Revenue and Institute for FiscalStudies.
Brewer, M., Goodman, A., Myck, M., Shaw, J. and Shephard, A.(2004) Poverty and inequality in Britain: 2004, Commentary96, London: Institute for Fiscal Studies.
Briggs, A. (1961) Social thought and social action: A study of thework of Seebohm Rowntree, 1871–1954, London: Longmans.
Brooks, B. (1986) ‘Women and reproduction 1860–1919’, in J.Lewis (ed.), Labour and love: Women’s experience of homeand family 1950–1940, Oxford: Blackwell.
Burchardt, T. (2005) ‘Selective inclusion: Asylum seekers andother marginalised groups’, in Hills and Stewart (2005).
Cole, D. and Utting, J. (1962) The economic circumstances of oldpeople, Occasional Paper in Social Administration 4, London:Bell.
Congregational Union (1883) The bitter cry of outcast London:An inquiry into the condition of the abject poor, London:Congregational Union.
References

One hundred years of poverty and policy
180
Darton, D., Hirsch, D. and Strelitz, J. (2003) Tacklingdisadvantage: A 20-year enterprise, York: Joseph RowntreeFoundation.
Desai, M. and Shah, A. (1988) ‘An econometric approach to themeasurement of poverty’, Oxford Economic Papers, 40(3):505–22.
DHSS (Department of Health and Social Security) (1988) Lowincome families – 1985, London: Government StatisticalService.
Donnison, D. (1982) The politics of poverty, Oxford: MartinRobertson.
DSS (Department of Social Security) (1999) Opportunity for all:Tackling poverty and social exclusion, London: DSS.
Dunkley, P. (1982) The crisis of the old poor law in England1700–1834: An interpretive essay, New York: Garland.
DWP (Department for Work and Pensions) (2003a) Householdsbelow average income 1994/95–2001/02, Leeds: CorporateDocument Services.
DWP (Department for Work and Pensions) (2003b) Abstract ofstatistics for benefits, contributions and indices of prices andearnings, 2002 edn, London: DWP.
DWP (Department for Work and Pensions) (2004) Householdsbelow average income 1994/95–2002/03, Leeds: CorporateDocument Services.
Evans, M. (1998) ‘Social security: Dismantling the pyramids?’, inH. Glennerster and J. Hills (eds), The state of welfare: Theeconomics of social spending, Oxford: Oxford UniversityPress.
Evans, M. and Glennerster, H. (1993) ‘Squaring the circle: Theinconsistencies and constraints of Beveridge’s plan’, WelfareState Programme Discussion Paper 86, London: LondonSchool of Economics.
Fiegehen, G. C., Lansley, P. S. and Smith, A. D. (1977) Poverty andProgress in Britain, 1953–73, Cambridge: CambridgeUniversity Press.

181
Ford, P. (1934) Work and wealth in a modern port: A socialsurvey of Southampton, London: Allen and Unwin.
Fraser, D. (1973) The evolution of the welfare state, London:Macmillan.
Gallie, D. and Paugam, S. (2002) Social precarity and socialintegration, Brussels: European Commission (Employmentand Social Affairs).
Gillie, A. (1996) ‘The origin of the poverty line’, EconomicHistory Review, 49(4): 715–30.
Glendinning, C. (1992) The costs of informal care: Lookinginside the household, London: SPRU/HMSO.
Glennerster, H. (2000) British social policy since 1945, Oxford:Blackwell.
Glennerster, H. (2002) ‘United States poverty studies andpoverty measurement: The past twenty-five years’, SocialService Review (Mar.): 83–107.
Glennerster, H. and Evans, M. (1994) ‘Beveridge and hisassumptive worlds: The incompatibilities of a flawed design’,in Hills, Ditch and Glennerster (1994).
Goodman, A. and Webb, S. (1994) For richer, for poorer: Thechanging distribution of income in the United Kingdom,1961–1991, London: Institute for Fiscal Studies.
Gordon, D. and Townsend, P. (eds) (2000) Breadline Europe: Themeasurement of poverty, Bristol: Policy Press.
Gordon, D., Adelman, L., Ashworth, K., Bradshaw, J., Levitas, R.,Middleton, S., Pantazis, C., Patsios, D., Payne, S., Townsend, P.and Williams, J. (2000) Poverty and social exclusion in Britain,York: Joseph Rowntree Foundation.
Gregg, P. and Wadsworth, J. (2001) ‘Everything you everwanted to ask about measuring worklessness andpolarization at the household level but were afraid to ask’,Oxford Bulletin of Economics and Statistics, 63 (special issue):777–806.
Hagenaars, A. J. M. and Van Praag, B. M. S. (1985) ‘A synthesisof poverty line definitions’, Review of Income and Wealth,31(2): 139–54.
References

One hundred years of poverty and policy
182
Harkness, S. and Waldfogel, J. (2003) ‘The family gap in pay:Evidence from seven industrialized countries’, Research inLabor Economics, 22: 369–414.
Harris, J. (1972) Unemployment and politics: A study of Englishsocial policy 1886–1914, Oxford: Oxford University Press.
Harris, J. (1997) William Beveridge: A biography (1977), 2ndedn, Oxford: Oxford University Press.
Harris, J. (2002) ‘From poor law to welfare state? A Europeanperspective’, in D. Winch and P. K. O’Brien (eds), The politicaleconomy of British historical experience 1688–1914, Oxford:Oxford University Press.
Hatton, T. J. and Bailey, R. E. (2000) ‘Seebohm Rowntree and thepost-war poverty puzzle’, Economic History Review, 53(3):517–43.
Hills, J. (1995) Income and wealth, vol. 2: A survey of theevidence, York: Joseph Rowntree Foundation.
Hills, J. (2001) ‘Poverty and social security: What rights? Whoseresponsibilities?’, in A. Park, J. Curtice, K. Thomson, L. Jarvisand C. Bromley (eds), British social attitudes: The 18th report,London: Sage.
Hills, J. (2004a) Inequality and the state, Oxford: OxfordUniversity Press.
Hills, J. (2004b) ‘Inclusion or insurance? National Insurance andthe future of the contributory principle’, Journal of SocialPolicy, 33: 347–72.
Hills, J. and Lelkes, O. (1999) ‘Social security, selectiveuniversalism, and patchwork redistribution’, in R. Jowell, J.Curtice, A. Park, and K. Thomson (eds), British socialattitudes: The 16th report, Aldershot: Ashgate.
Hills, J. and Stewart, K. (eds) (2005), A more equal society? NewLabour, poverty, inequality and exclusion, Bristol: Policy Press.
Hills, J., Ditch, J. and Glennerster H. (eds) (1994) Beveridge andsocial security: An international retrospective, Oxford:Oxford University Press.
HM Treasury (2003a) Budget 2003: Building a Britain ofeconomic strength and social justice, HC500, London: TSO.

183
HM Treasury (2003b) Pre-Budget report: The strength to takethe long-term decisions for Britain, Cm.6042, London: TSO.
HM Treasury (2004) Child poverty review, London: HM Treasury.Horne, T. (1986) Property rights and poverty: Political argument
in Britain 1605–1834, Exeter: Exeter University Press.Innes, J. (1998) ‘State, church and voluntarism in European
welfare, 1690–1850’, in H. Cunningham and J. Innes (eds),Charity, philanthropy and reform, Basingstoke: Macmillan.
Innes, J. (1999) ‘The state and the poor: Eighteenth-centuryEnglish poor relief in European context’, in J. Brewer and E.Hellmuth (eds), Rethinking Leviathan: The eighteenth-century state in Britain and Germany, Oxford: OxfordUniversity Press.
Innes, J. (2002) ‘The distinctiveness of the English poor laws,1750–1850’, in D. Winch and P. K. O’Brien (eds), The politicaleconomy of British historical experience 1688–1914, Oxford:Oxford University Press.
Johnson, P. (1996) ‘Risk, redistribution and social welfare inBritain from the Poor Law to Beveridge’, in M. Daunton (ed.),Charity, self interest and welfare in the English past, London:Routledge.
Jones, D. C. (1934) Social survey of Merseyside, Liverpool:University Press of Liverpool.
Jowell, R., Curtice, J., Park, A., Thomson, K., Jarvis, L., Bromley,C. and Stratford, N. (eds) (2000) British social attitudes: The17th report, London: Sage.
Kidd, A. (1999) State, Society and the Poor in Nineteenth-Century England, Basingstoke: Macmillan.
Kiernan, K., Land, H. and Lewis, J. (1998) Lone motherhood intwentieth century Britain, Oxford: Oxford University Press.
Kilpatrick, R. W. (1973) ‘The income elasticity of the povertyline’, Review of Economics and Statistics, 55(3): 327–32.
King, S. (2000) Poverty and welfare in England, 1700–1850,Manchester: Manchester University Press.
References

One hundred years of poverty and policy
184
Lakin, C. (2003) ‘The effects of taxes and benefits on householdincome, 2001/02002’, Economic Trends (May): 1–47 (webversion).
Lewis. J. and Piachaud, D. (1992) ‘Women and poverty in thetwentieth century’, in C. Glendinning and J. Millar (eds),Women and poverty in Britain, Brighton: Wheatsheaf.
Lister, R. (2004) Poverty, Cambridge: Polity Press.Llewellyn-Smith, H. (1930–5) New survey of London life and
labour, London: King.Lowe, R. (1999) The welfare state in Britain since 1945,
Basingstoke: Macmillan.Lupton, R. and Power, A. (2005) ‘Disadvantaged by where you
live? New Labour and neighbourhood renewal’, in Hills andStewart (2005).
Mack, J. and Lansley, S. (1985) Poor Britain, London: GeorgeAllen and Unwin.
Macnicol, J. (1980) The movement for family allowances1918–45, London: Heinemann.
Macnicol, J. (1998) The politics of retirement in Britain1878–1948, Cambridge: Cambridge University Press.
Mann, H. H. (1905) ‘Life in an agricultural village in England’,Sociological Papers, pp. 163–93.
Mayhew, H. (1861–2) London labour and the London poor, 4vols, London.
McKnight, A. (2005) ‘Employment: Tackling poverty through“work for those who can”’, in Hills and Stewart (2005).
Michielse, H. C. M. (1990) ‘Policing the poor: J. L. Vives and thesixteenth-century origins of modern social administration’,Social Service Review, 64(1):1–21.
Millar, J. and Glendinning, C. (1987) ‘Invisible women, invisiblepoverty’, in C. Glendinning and J. Millar (eds) Women andpoverty in Britain, Brighton: Wheatsheaf.
Minority Report, Royal Commission on the Poor Laws (1909)Minority Report of the Royal Commission on the Poor Lawsand the Relief of Distress, London: HMSO.

185
Mitchell, D. (1991) Income transfers in ten welfare states,Aldershot: Avebury.
Owen, A. D. K. (1933) A survey of the standard of living inSheffield, Survey Pamphlet 9, Sheffield: Social SurveyCommittee.
Oxley, H., Dang, T.-T. and Antolín, P. (1999) Poverty dynamics insix OECD countries, Paris: Organisation for Economic Co-operation and Development.
Pahl, J. (1989) Money and marriage, London: Macmillan.Park, A., Curtice, J., Thomson, K., Jarvis, L. and Bromley, C. (eds)
(2003) British social attitudes: The 20th report, London: Sage.Parker, G. (1985) With due care and attention, London: Family
Policy Studies Centre.Pedersen, S. (1993) Family, dependence and the origins of the
welfare state in Britain and France 1914–1945, Cambridge:Cambridge University Press.
Pember Reeves, M. S. (1914) ‘Family life on a pound a week’(Fabian Tract No 162), London: Fabian Society. (The mostaccessible modern version is: S. Alexander (ed) (1988)Women’s source library vol. VII: Women’s Fabian Tracts,London: Routledge.)
Piachaud, D. (1981) ‘Peter Townsend and the Holy Grail’, NewSociety, 57 (10 Sept.): 419–21.
Piachaud, D. (1988) ‘Poverty in Britain 1899 to 1983’, Journal ofSocial Policy, 17(3): 335–49.
Rathbone, E. (1917) ‘The remuneration of women’s services’,Economic Journal, 27 (Mar.): 55–68.
Rathbone, E. (1924) The disinherited family, London: EdwardArnold.
Rowntree, B. S. (1901) Poverty: A study of town life, London:Macmillan.
Rowntree, B. S. (1918) The human needs of labour, London:Nelson.
Rowntree, B. S (1937) The human needs of labour, new edn,revised and rewritten, London: Longmans Green.
References

One hundred years of poverty and policy
186
Rowntree, B. S. (1941) Poverty and progress: A second socialsurvey of York, London: Longmans.
Rowntree, B. S. (2001) Poverty: A study of town life, centennialedn, Bristol: Policy Press.
Rowntree, B. S. and Lavers, G. R. (1951) Poverty and the welfarestate: A third social survey of York dealing only witheconomic questions, London: Longmans.
Royal Commission on the Poor Laws (1909) Report, London:HMSO.
Sassi, F. (2005) ‘Tackling health inequalities’, in Hills and Stewart(2005).
Sefton, T. (2002) Recent changes in the distribution of the socialwage, CASE Paper 62, London: London School of Economics.
Sefton, T. and Sutherland, H. (2005) ‘Inequality and povertyunder New Labour’, in Hills and Sutherland (2005).
Sen, A. (1983) ‘Poor relatively speaking’, Oxford EconomicPapers, 35: 153–69.
Simey, T. S. and Simey, M. B. (1960) Charles Booth: Socialscientist, Oxford: Oxford University Press.
Slack, P. (1988) Poverty and policy in Tudor and Stuart England,London: Longman.
Slack, P. (1990) The English Poor Law, 1531–1782, Basingstoke:Macmillan.
Smith, A. (1776) An inquiry into the nature and causes of thewealth of nations, London: Home University Library.
Stevenson, J. and Cook, C. (1979) Society and politics during theDepression, London: Quartet Books.
Stewart, K. (2005a) ‘Towards an equal start? Addressingchildhood poverty and deprivation’, in Hills and Stewart(2005).
Stewart, K. (2005b) ‘Changes in poverty and inequality in theUK in international context’, in Hills and Stewart (2005).
Taylor, R. M. (1938) A social survey of Plymouth: Second report,London: P. S. King and Son.

187
Taylor-Gooby, P. and Hastie, C. (2002) ‘Support for statespending: Has New Labour got it right?’, in A. Park, J. Curtice,K. Thomson, L. Jarvis and C. Bromley (eds), British socialattitudes: The 19th report, London: Sage.
Thatcher, A. R. (1968) ‘The distribution of earnings ofemployees in Great Britain’, Journal of the Royal StatisticalSociety, series A, 131(2): 133–70.
Timmins, N. (1995) The five giants: A biography of the welfarestate, London: HarperCollins.
Tout, H. (1938) The standard of living in Bristol, Bristol:Arrowsmith.
Townsend, P. (1954) ‘Measuring poverty’, British Journal ofSociology, 5(2): 130–7.
Townsend, P. (1962) ‘The meaning of poverty’, British Journal ofSociology, 13(3): 210–27.
Townsend, P. (1979) Poverty in the United Kingdom: A survey ofhousehold resources and standards of living,Harmondsworth: Penguin.
UNICEF (United Nations Children’s Fund) (2000) A league tableof child poverty in rich nations, Innocenti Report Card 1,Florence: Innocenti Research Centre.
Van Reenen, J. (2004) ‘Active labor market policies and theBritish New Deal for unemployed youth in context’, in R.Blundell, D. Card and R. Freeman (eds), Seeking a premierleague economy, Chicago: University of Chicago Press.
Veit-Wilson, J. (1986) ‘Paradigms of poverty: A rehabilitation ofB. S. Rowntree’, Journal of Social Policy, 15(1): 69–99.
Veit-Wilson, J. (1994) ‘Condemned to deprivation? Beveridge’sresponsibility for the invisibility of poverty’, in Hills, Ditch andGlennerster (1994).
Wardley, P. and Woollard, M. (1994) ‘Retrieving the past: Areclamation and reconstruction of the social survey of Bristol,1937’, History and Computing, 6(2): 85–105
Webb, J. (2002) ‘Always with us? The evolution of poverty inBritain, 1886–2002’, D.Phil. thesis, University of Oxford,Oxford.
References

One hundred years of poverty and policy
188
Webb, B. and Webb, S. (1929) English local government: EnglishPoor Law history, London: Longmans
Wedderburn, D. (1962) ‘Poverty in Britain today: The evidence’,Sociological Review 10(3): 257–82.
Whiteside, N. (1983) ‘Private agencies for public purposes: Someperspectives on policy making in health insurance betweenthe wars’, Journal of Social Policy, 12, P2: 165–94.
Wittenberg, R., Comas-Herrara, A., Pickard, L. and Hancock, R.(2004) Future demand for long-term care in the UK: Asummary of projections of long-term care finance for olderpeople to 2051, York: Joseph Rowntree Foundation.