one-dimensional scanning of moisture in heated porous building materials with nmr
TRANSCRIPT
Journal of Magnetic Resonance 208 (2011) 235–242
Contents lists available at ScienceDirect
Journal of Magnetic Resonance
journal homepage: www.elsevier .com/locate / jmr
One-dimensional scanning of moisture in heated porous building materialswith NMR
G.H.A. van der Heijden ⇑, H.P. Huinink, L. Pel, K. KopingaDepartment of Applied Physics, Transport in Permeable Media, Eindhoven University of Technology, P.O. Box 513, 5600 MB Eindhoven, The Netherlands
a r t i c l e i n f o
Article history:Received 6 August 2010Revised 26 October 2010Available online 17 November 2010
Keywords:MRINon-isothermalMoisture transportConcrete
1090-7807/$ - see front matter � 2010 Elsevier Inc. Adoi:10.1016/j.jmr.2010.11.010
⇑ Corresponding author. Fax: +31 402432598.E-mail address: [email protected] (G.H.A. van der Heijde
a b s t r a c t
In this paper we present a new dedicated NMR setup which is capable of measuring one-dimensionalmoisture profiles in heated porous materials. The setup, which is placed in the bore of a 1.5 T whole-bodyscanner, is capable of reaching temperatures up to 500 �C. Moisture and temperature profiles can be mea-sured quasi simultaneously with a typical time resolution of 2–5 min.
A methodology is introduced for correcting temperature effects on NMR measurements at these ele-vated temperatures. The corrections are based on the Curie law for paramagnetism and the observedtemperature dependence of the relaxation mechanisms occurring in porous materials. Both these correc-tions are used to obtain a moisture content profile from the raw NMR signal profile.
To illustrate the methodology, a one-sided heating experiment of concrete with a moisture content inequilibrium with 97% RH is presented. This kind of heating experiment is of particular interest in theresearch on fire spalling of concrete, since it directly reveals the moisture and heat transport occurringinside the concrete. The obtained moisture profiles reveal a moisture peak building up behind the boilingfront, resulting in a saturated layer. To our knowledge the direct proof of the formation of a moisture peakand subsequent moisture clogging has not been reported before.
� 2010 Elsevier Inc. All rights reserved.
1. Introduction
The presence of water in building materials plays an importantrole in many damage processes. Especially the two phase changesof water, freezing and boiling, can lead to damage. On the otherhand, salts that are present in building materials may cause dam-age if water is present to dissolve and transport them [1,2].
An extreme example of moisture related damage to a buildingmaterial is fire spalling of concrete. If a fire occurs in a concretetunnel or building, the surface of a concrete wall is heated to tem-peratures well above 100 �C within minutes, rising up to 1200 �C.Moisture in the concrete will start to boil and the water vapourcan only escape via the heated surface. Because concrete is a verylow permeable material, high vapour pressures may be generated.A combination of these high vapour pressures, thermal stressesresulting from large temperature gradients, and weakening of theporous matrix due to dehydration can cause the concrete to spall(delaminate) [3]. Under extreme conditions it can even give riseto explosive spalling.
In fire spalling of concrete moisture and heat transport at hightemperatures play an important role. Both these transportprocesses take place inside a building material. Combined mea-
ll rights reserved.
n).
surements of moisture content and temperature inside a material,as a function of position and time, are essential to understand theprocess but are difficult to obtain. It has been demonstrated thatwith NMR it is possible to measure the moisture content in a build-ing material in a quantitative way [4,6,7].
In this paper we present a new dedicated NMR setup which iscapable of measuring both moisture content and temperature pro-files during extreme one-sided heating of porous materials such asconcrete, fired-clay brick, wood, and gypsum. These measurementsgive a unique insight in the physical processes in for instance firespalling of concrete. During a one-sided heating experiment themoisture content changes rapidly and a large temperature gradientis present in the sample. Interpretation of the NMR signal profilesis not straightforward since this temperature gradient will influ-ence the measured signal profiles. Furthermore, in order to obtaina satisfactory temporal resolution the used NMR pulse sequence islimited in its duration. We will present a measurement and correc-tion method by which quantitative moisture profiles can be ob-tained. We will use an experiment on a concrete sample todemonstrate this method.
In Section 2 the NMR setup and the materials and methods willbe introduced, and the theory behind non-isothermal NMR will bediscussed. In Section 3 the result of a concrete fire spalling exper-iment and the used signal corrections will be presented. Finally, inSection 4 the concluding remarks will be given.
236 G.H.A. van der Heijden et al. / Journal of Magnetic Resonance 208 (2011) 235–242
2. Non-isothermal NMR experiments
2.1. NMR setup
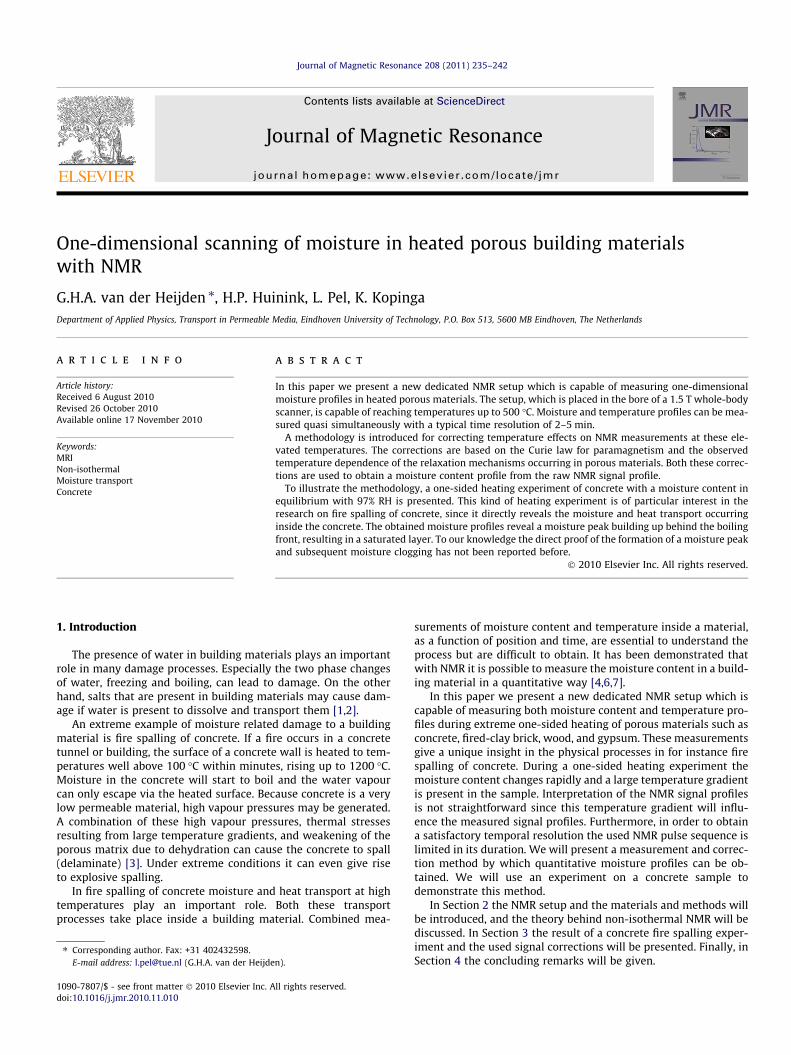
The fire spalling experiments were performed using a home-built NMR setup, which was especially designed for non-isother-mal moisture measurements on building materials. A schematicdiagram of this setup is shown in Fig. 1. The setup can be placedentirely in the bore of a 1.5 T whole-body medical scanner (Gyro-scan, Philips), which is used only for its main magnetic field. Twocoils, in an anti-Helmholtz configuration, with a diameter of35 cm, provide a constant magnetic field gradient G in the directionof B0. The magnitude of the gradient is 100 mT m�1, providing aspatial resolution of about 4–5 mm with the used pulse sequences.
A home built birdcage coil (12 legs, low-pass configuration) isused for sending the RF pulses (B1) and receiving the NMR signalfrom the sample. The coil is made from copper strips wrappedaround an aluminium oxide (Al2O3) tube. The coil is 140 mm longand has a diameter of 140 mm. A birdcage type coil is used becauseit generates a homogeneous B1 field perpendicular to the long axisof the cylindrical sample. Therefore, the coil can be placed parallelto the main magnetic field, providing optimal use of the availablespace inside the bore. The coil is designed with an internal Faradayshield, in order to prevent changes in the dielectric constant of thesample from de-tuning the RF coil [4]. In this way, quantitativemoisture content measurements can be performed.
The Al2O3 tube can withstand temperatures far above therequirements of the experiments (melting temperature 2072 �C).Furthermore, it does not give any background signal, which is impor-tant when measuring a moisture content as low as 0.03 m3 m�3 inconcrete at high temperatures. Two trimming capacitors (specifiedvoltage of 12 kV) were used for tuning and matching. In order to en-sure a constant resonance frequency and sensitivity of the coil,capacitors with a high thermal stability were used.
A high power RF amplifier (3.6 kW, 63.9 MHz) is used in orderto achieve the relative short RF pulses (�50 ls) needed for NMRmeasurements on concrete. The Faraday cage placed around thecoil has a twofold purpose: it shields the NMR coil from spuriousRF signals and it prevents the RF pulses from reaching the elec-tronic systems of the medical scanner.
In order to simulate the conditions as occur in a fire, the concretehas to be heated up quickly. With an array of four 100 W halogenlamps, capable of generating a heat flux of 12 kW m�2, we are able
G
B1
r
z
B0
gradient coils
external Faraday cage
RF coil
insulationsample
10 cm
AlO tube2 3
lamp array
flowFaraday shield
Fig. 1. Schematic diagram of the NMR setup. A whole-body 1.5 T MRI scannergenerates the main magnetic field B0. Two coils in an anti-Helmholtz configurationprovide a constant magnetic field gradient G of 100 mT m�1. A bird-cage RF coilwith a diameter of 140 mm is used for both sending the RF pulses and receiving theNMR signal. The bird-cage coil is constructed on an aluminium oxide (Al2O3) tube.An array of four 100 W halogen lamps is used to heat the sample, which is thermallyinsulated and positioned in the bird-cage coil.
to mimic a ‘fire’ inside the NMR setup. The reflectors of the lampsare gold plated to ensure maximum reflection of infrared radiationtowards the sample surface. To minimise heating of the RF coil, thelamp array is cooled. The heat flux from the lamp was calibratedcalorimetrically and varies linearly with the applied electrical powerto the lamp [8]. The maximum temperature which can be reached atthe heated surface is about 400–500 �C. Although we do not reachthe maximum temperatures occurring in a real life fire (�1000 �C),we are in the region of temperatures where the most interestingmoisture related processes occur, such as boiling at temperatureshigher than 100 � C, moisture clogging, and dehydration of theconcrete.
The temperatures inside the sample were measured using type-Kthermocouples. The thermocouples were found to slightly decreasethe signal to noise ratio of the measurements. At the receiving end ofthe thermocouple wires a low-pass filter is used to minimise the RFsignal at the inputs of the thermocouple amplifier.
2.1.1. Pulse sequenceTo obtain a full moisture profile of the sample a so-called ‘multi
frequency scan’ was used. Slice selection is achieved with a con-stant magnetic gradient. A solid echo (90y – s – 90x – s – echo) isused to obtain the signal of at each selected frequency. The fre-quencies are scanned in an interleaved manner in order to mini-mise the measurement time [5]. The bandwidth of the coil(�400 kHz) is large enough to scan the entire sample without mov-ing it. To obtain a complete one-dimensional signal profile, theNMR signals measured at different frequencies/positions are com-bined. In order to obtain a good temporal resolution the completeNMR signal decay cannot be measured at each point of the profile,but is only determined at a suitably chosen position.
2.1.2. Sample preparationThe concrete sample is pressed in a PTFE holder to seal all sides
except for the heated surface (transverse plane of the cylinder). Inthis way the moisture transport is limited to one dimension. PTFEwas used because it does not contain hydrogen. A major drawbackof PTFE is that toxic fumes can be released when it is heated above300 �C. Therefore, a ventilation system is used to extract smoke orfumes produced in the setup during the experiment. The flow ofheat is limited to one dimension by insulating the sample usingmineral wool, at the same time preventing the RF coil from heat-ing. From numerical analysis of the heat conduction of the setupgeometry and the materials used, the radial temperature gradientis estimated to be 5–10% of the longitudinal temperature gradient.By creating a one dimensional moisture and heat transport exper-iment, the conditions inside a concrete wall are simulated.
At the start of the experiment one moisture and temperatureprofile is measured to record the initial state of the sample. Thefirst moisture profile (homogeneous moisture content) is used tocorrect subsequent profiles for the longitudinal inhomogeneity ofthe RF field. Next the heating is turned on and the moisture andtemperature profiles are measured every 2–5 min, depending onthe number of averages needed to obtain a satisfactory signal tonoise ratio.
2.2. Concrete characterisation
Concrete is a porous material with pore-sizes ranging from onlya few nanometers to several microns [9]. The pores can be subdi-vided in gel pores (2–10 nm), capillary pores (10–200 nm), andcracks or air voids (>1 lm). The degree of saturation of this poresystem will depend on the relative humidity (RH). At 40% RH thegel pore system is saturated and above this RH the capillary poreswill start to fill. At 100% RH the cracks are also filled with waterand the material is fully saturated. The water which is found in
G.H.A. van der Heijden et al. / Journal of Magnetic Resonance 208 (2011) 235–242 237
the pore system is called evaporable or free water, which is definedas water removed by drying at 105 �C. However, a significantamount of water is chemically bound to the cement paste by thehydration reaction. The chemically bound water is released fromthe concrete at temperatures ranging from 105 �C to 500 �C by areaction called dehydration.
All water in the concrete, either free or chemically bound, willcontribute to the NMR signal. However, a wide range in mobilitiesof the water molecules is found in concrete, which will result in awide range of relaxation times. The relaxation time of chemicallybound water in concrete is about 20 ls [10]. The signal decay offree water inside concrete ranges from 100 ls to about 40 ms.The NMR signal decay obtained from a saturated concrete samplewill therefore contain a wide range of relaxation times T2 corre-sponding to the different pore systems:
SðtÞ ¼X
i
Ai exp � tT2;i
� �; ð1Þ
where Ai is the amplitude of the contribution of a pore sub system:chemically bound water, gel pores, capillary pores, and cracks/airvoids.
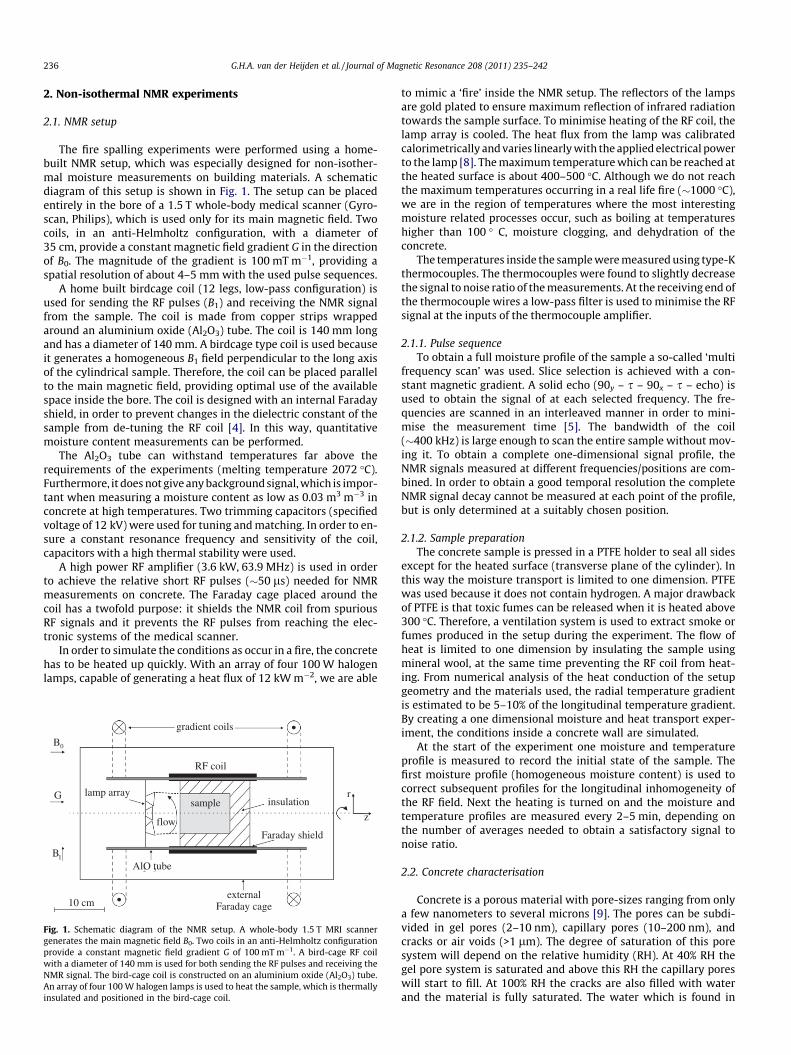
In Fig. 2a relaxation time distributions are shown for the con-crete (water cement ratio 0.5) which is used in the experiments.An Ostroff–Waugh sequence with an inter-echo time of 160 lswas used to measure the signal decay. The top curve correspondsto a capillary saturated concrete. The regions of the different com-ponents are indicated by the dashed lines. The three main contri-butions to the signal are water in the gel, capillary pores, and airvoids or micro-cracks (>1 lm). The arrow indicates the progressionof the drying. It can be seen that the longer T2 components de-crease in amplitude first, which is to be expected since the largestpores in the material are emptied first. Note that the gel pores aredominant in terms of signal contribution. In the saturated concrete,the capillary pores contribute 8% to the total signal, which de-creases to zero at a temperature of 105 �C. The fact that the gelpores are dominating the NMR signal is also important in deter-mining the first order correction parameters which will be dis-cussed in the next section.
The NMR signal was calibrated with respect to the total mois-ture content in the concrete. To this end the sample was initiallycapillary saturated. Mass and NMR signal were recorded simulta-neously while the sample was dried slowly at room temperature.The signal is shown as a function of the normalised mass (m/m0)in Fig. 2b. Where m0 is the mass of a capillary saturated concrete
0.1 1 10 10002468
10121416
S (a
.u.)
capillarypores
micro cracksair voids
gel pores
T (ms)2
drying
(a)Fig. 2. Characterisation with NMR of the concrete sample for different moisture contendrying of a saturated concrete. The signal decays were measured using an Ostroff–Wamoisture present in the concrete. The NMR signal is plotted as a function of the normaliroom temperature and for a set of drying-temperatures from 105 to 800 �C (see inset). Thtemperatures above 250 �C the signal decreases to zero. The background signal is in the
sample. The normalised mass is used because in this way bothevaporable and chemically bound water can be depicted on thesame axis. For temperatures up to 105 �C the NMR signal at anecho time te is proportional to the amount of evaporable moisturepresent in the concrete. This is indicated by the linear fit (solid line)of the NMR signal vs. moisture content in the range of 1–0.94.
After drying at a constant temperature of 105 �C a signal S [ 0.1was measured. The signal must be originating from chemicallybound water in the concrete. The NMR signal was also calibratedwith respect to amount of chemically bound water at temperaturesabove 105 �C (see inset in Fig. 2b). To this end the sample was driedat several temperatures until a constant mass was obtained. Notethat the NMR signal was measured after the sample was cooleddown to room temperature under a 0% RH atmosphere. In thisway, no moisture was absorbed during cooling and the moisturecontent reached at a certain temperature is preserved.
The NMR signal decreased for temperatures from 105 �C to130 � C (see inset graph). The decrease in signal is caused by a de-crease of water which is strongly absorbed in pores with sizes ofonly a few nanometers (smallest gel pores) which will boil/evapo-rate at temperatures up to 130 �C.
The mass loss in the temperature range of 130–250 �C indicatesthat the chemically bound moisture content of the concrete de-creases. However, the signal remains constant (see inset graph),which indicates that the water lost in this temperature range isnot contributing to the NMR signal. When the temperature is fur-ther increased from 250 �C to 500 �C more water is lost and the sig-nal decreases to zero. Although the relaxation time (�20 ls) ismuch shorter than the inter-echo time, the signal to noise ratiowas sufficient to obtain a signal. If the concrete is fully hydratedthe amount of chemically bound water in the concrete mix is�10% by mass. Furthermore, not all chemically bound water hasthe same relaxation time, and therefore does not contribute tothe same extent to the signal at te. The relationship between signaland moisture content for temperatures above 105 �C is not linear.Therefore, it is not possible to obtain a degree of dehydration ofthe concrete from the measured signal.
2.3. Non-isothermal NMR
The NMR measurements described above were performed atroom temperature. In our experiments the free moisture contentis of interest and we have observed that the NMR signal can be cal-ibrated with respect to the amount of free water. However, in a
105 oC
evaporable water
chemicallybound water
0.92 0.94 0.96 0.98 1.000.0
0.2
0.4
0.6
0.8
1.0250ºC
800ºC
105ºC
500ºC
300ºC
m / m0 (-)
0.90 0.91 0.92 0.93 0.940
0.02
0.04
0.06
0.08
0.10
0.12
0.14
S (a
.u.)
(b)ts. (a) The relaxation time distributions (Contin inversion routine) obtained duringugh sequence. (b) A calibration of the NMR signal with respect to the amount ofsed mass m/m0. The NMR signal from the chemically bound moisture is obtained ate amount of signal measured for temperatures from 130 �C to 250 �C is constant. Atorder of 10�3.
238 G.H.A. van der Heijden et al. / Journal of Magnetic Resonance 208 (2011) 235–242
one-sided heating experiment the temperature will increases wellabove 100 �C and large temperature gradients will be present inthe sample. Therefore, in the next section the theory is explainedwhich will be used to correct the signal in order to obtain a quan-titative moisture content.
2.3.1. Temperature dependent magnetisationThe nuclear magnetisation M of a material placed in an external
magnetic field B0 depends on the absolute temperature of thematerial [11]:
MðTÞ ¼ nl�hx4kT
;
where n is the number of nuclei, l the magnetic moment of 1H, ⁄xthe energy difference between the two possible energy states, k theBoltzmann constant, and T the absolute temperature.
The magnitude of the measured signal is not only determinedby the nuclear magnetisation, but also by the relaxation times.Both spin–spin T2 as spin–lattice T1 relaxation are temperaturedependent, and can cause a change in the observed signal [12].The transverse magnetisation Mxy in a Hahn spin-echo experimentwith a repetition time tr and an echo time te is given by:
Mxyðte; tr; TÞ ¼ M0ðTÞ exp � te
T2ðTÞ
� �1� exp � tr
T1ðTÞ
� �� �; ð2Þ
provided that T1� T2. The influence of the temperature on thetransverse magnetisation can be analysed by taking the partialderivative with respect to temperature [12]:
@ ln Mxyðte; tr ; TÞ@T
¼ �1Tþ te
T22
@T2
@T� tr
T21
exp � trT1
� �
1� exp � trT1
� � @T1
@T: ð3Þ
In order to separate the different contributions to the tempera-ture dependence, we have chosen to take the derivative of the log-arithm of the magnetisation. The first term at the right hand siderepresents the inverse temperature dependence of the magnetisa-tion. The second and third term represent the temperature depen-dence of T2 and T1, respectively. The magnitude of these terms islargely determined by the ratio between the experimental param-eters tr and te, and T1 and T2, respectively. In case of concrete T1� 1ms. With a repetition time of 0.1 s, the temperature dependence ofT1 can be neglected. However, since the magnetisation thermalisesexponentially with T1, the approximation given above is only validif the amount of heating in a typical time t = T1 is small. In the fol-lowing experiment the temperature increase in a time T1 is about10�3 �C.
However, depending on the porous material, we cannot alwaysconduct our experiment in such a way that the influence of thetemperature dependence of T2 can be neglected. For example, inconcrete the relaxation time of water in the gel pores is in the orderof 200–400 ls. The echo time we use in our experiments is 160 ls.Consequently, any change in T2 with temperature will be reflectedin the magnitude of the measured signal. In the next section wewill discuss the temperature dependence of the transverse relaxa-tion time of water inside a porous material in more detail.
2.3.2. Temperature dependent relaxationIn a porous material, different dominant relaxation mechanisms
can exist depending on the pore size, surface relaxivity, and chosenNMR parameters such as the field gradient and echo time. In thediscussion of relaxation mechanisms of water in a porous materialthe focus will be on the transverse relaxation, since in these mate-rials in general T1 P T2 and the influence of T1 can minimised byusing a sufficiently large long delay. Furthermore, we will only take
into account the situation found in concrete where relaxation isdominated by surface relaxation.
2.3.2.1. Surface relaxation. In bulk water, the water molecules expe-rience no restrictions in their movement. However, water mole-cules in a porous material will spend a certain time in thevicinity of the pore wall. The chance of relaxing is higher close tothe surface. This can be either due to a susceptibility mismatch be-tween water and the porous material, due to the presence of para-magnetic ions at the surface, or due to crystal defects in thesurface, resulting in the presence of unpaired electron spins (espe-cially in oxides) [13].
Depending on the pore-size distribution of the material, differ-ent surface relaxation regimes can be identified. Consider the casein which there is a fast exchange in the timescale of the experiment(te) between water close to the surface and the centre of a pore,which is the so-called fast diffusion regime. In this regime therelaxation rate is given by [14]:
1T2;S¼ 1
T2;Bþ q2
SV; ð4Þ
where q2 is the surface relaxivity, S/V is the surface to volume ratioof the pore, and T2,B the bulk relaxation time which can be neglectedbecause for water T2,B� T2,S. If the surface relaxivity is known, therelaxation times measured by NMR can be used to calculate the sur-face to volume ratio of a porous material. By assuming a certainpore size geometry, e.g. cylindrical or spherical, one can obtain apore-size distribution.
The temperature dependent factor in the fast diffusion regime isthe surface relaxivity. Without going into the details of the chem-ical composition of the surface, one can describe the temperatureinfluence on the surface relaxivity by an Arrhenius type equation[15]:
q2ðTÞ ¼ q2;0 expDERT
� �; ð5Þ
where q2,0 is the surface relaxivity at a certain reference tempera-ture and DE is the effective surface interaction energy. The effectiveinteraction energy is a combination of the energies involved in sur-face diffusion and surface relaxation, respectively. It must be notedthat this type of description is purely phenomological and that thetemperature dependence of the surface relaxivity depends stronglyon the chemical composition of the surface.
3. Results
To demonstrate the capabilities of the NMR setup and to showhow the temperature influences the NMR measurements we willgive an example of a one-sided heating experiment of concrete.First we will present the uncorrected ‘raw’ signal profiles. Next,we will discuss the corrections which will be applied to obtainthe quantitative moisture content.
3.1. Signal profiles
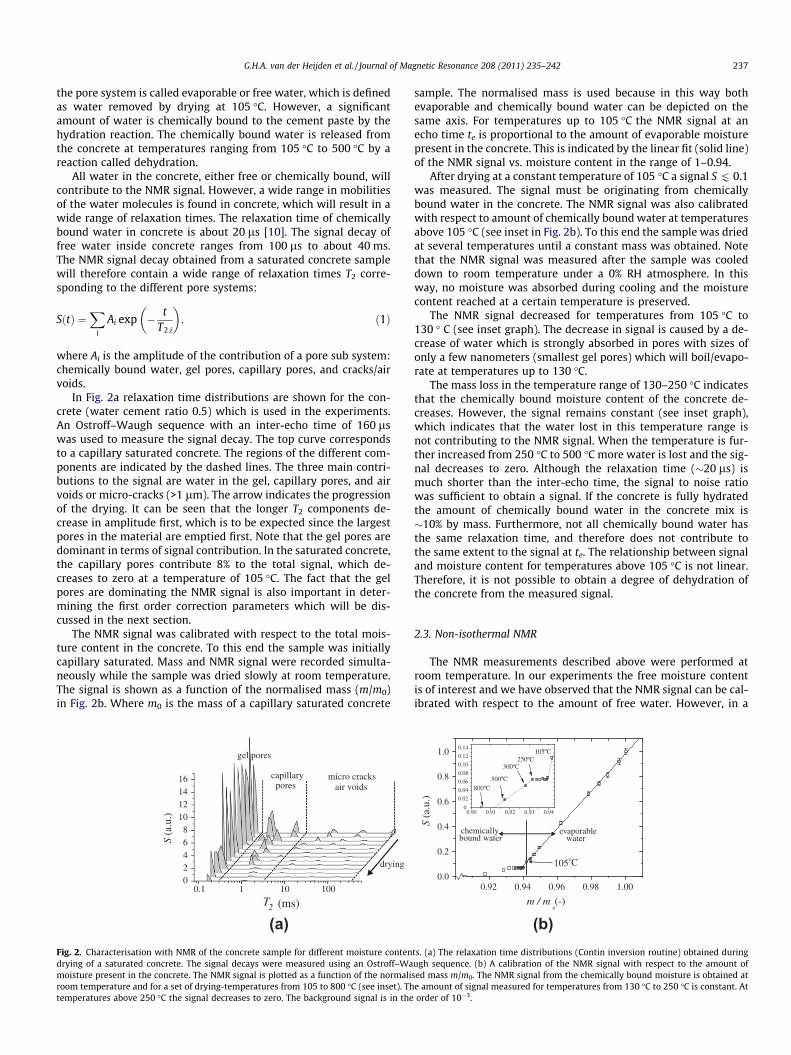
The concrete sample used in the experiment was equilibrated atan RH of 97%, corresponding to a moisture content of 0.07 m3 m�3.The sample is heated with a heat flux of 12 kW m�2. The measuredsignal and temperature profiles are shown in Fig. 3. In this figure,the heated surface is located at 0 mm, and the back of the sampleis at 100 mm. No corrections for the temperature dependence ofmagnetisation or relaxation have been applied. However, the sig-nal profiles are normalised with respect to the initial signal profileS0. At the start of the experiment the moisture is homogeneouslydistributed throughout the sample (S/S0 = 1). The profiles were

0 20 40 60 80 1000
0.5
1
1.5
2
position (mm)
S/S 0(-
)
0 20 40 60 80 1000
100
200
300
400
position (mm)
T (º
C)
(a) (b)Fig. 3. (a) Uncorrected signal (S) profiles as a function of the position inside the concrete. The profiles are shown for every 8.5 min. The arrows in the figures indicate theprogress in time. The heated surface corresponds to x = 0 mm and the back of the sample to x = 100 mm. The profiles have been normalised with respect to the first profile (S0),but have not been corrected for temperature. The initial moisture content of 0.07 m3 m�3 corresponds to S/S0 = 1. (b) Time evolution of the temperature profiles, the positionsof the thermocouples are indicated by black dots.
G.H.A. van der Heijden et al. / Journal of Magnetic Resonance 208 (2011) 235–242 239
measured every 4.2 min, but for clarity only one out of every twoprofiles is shown.
In the signal profiles a clear front is observed, which indicatesthat liquid water is evaporated. Furthermore, it can be seen thatthe signal behind the front increases 10% above the initial signal le-vel, which is unexpected when drying.
In the region close to the surface (0–30 mm) the signal does notdecrease to zero and a background check with an empty coil re-vealed no signal. The temperature in this region is 250–350 �C.Therefore, this signal has to originate from the chemically boundwater in the cement paste (see Fig. 2b).
After 20 minutes, the temperature at the surface is 200 �C,whereas the back of the sample is still at 20 �C. The signal profilescannot be directly interpreted as moisture profiles, due to the largetemperature differences between the start of the experiment. Fur-thermore, a large temperature gradient is present in the sample. Inthe next section we will discuss the necessary temperature correc-tions for concrete.
3.2. Signal correction
The temperature dependence of the nuclear magnetisation is gi-ven by Eq. (2). The correction of the inverse temperature depen-dence is straightforward since all the signal can be re-scaled by1/T. Therefore we will focus on the temperature dependence ofthe relaxation times and the influence on the measured signal.
3.2.1. Relaxation correctionIn the NMR signal decay obtained from saturated concrete given
by Eq. (1) the temperature dependence can be introduced:
Sðt; TÞ ¼X
i
AiðTÞ exp � tT2;iðTÞ
� �: ð6Þ
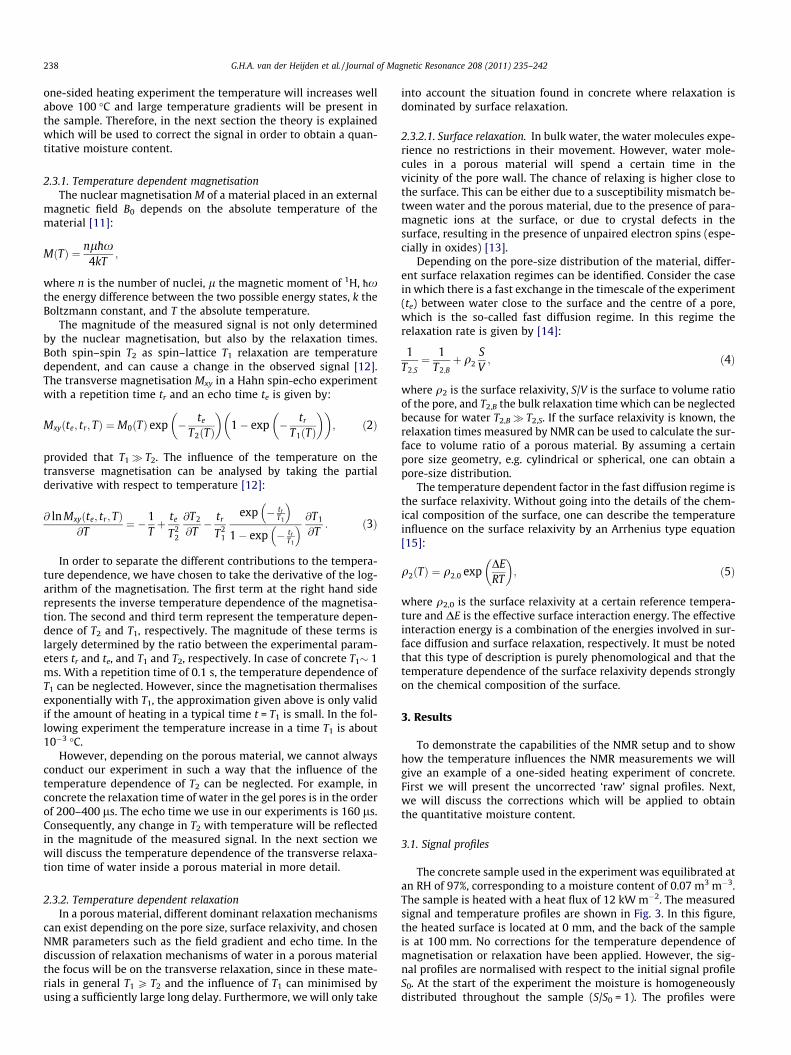
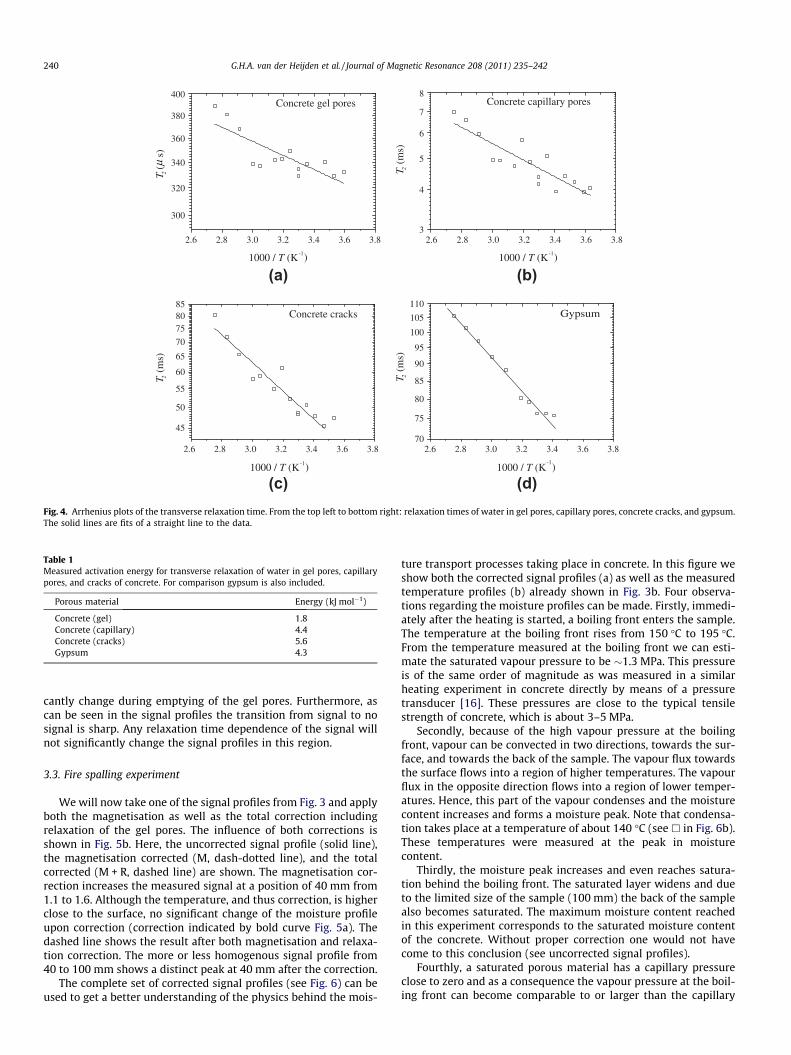
In concrete there are three dominant relaxation time contribu-tions. The temperature dependence of the these relaxation timesare shown as Arrhenius plots in Fig. 4. We have included gypsumfor comparison since in gypsum only one pore size (�1 lm) isfound, whereas in concrete multiple pore-sizes are present. Therelaxation times were obtained from a multi-exponential fit ofthe signal decay curves. As already shown in Section 2.2, for con-crete the signal decay can be described by three exponents whichcan be related to the three pore systems. It can be seen from Fig. 4that in all three pore systems the relaxation time increases withtemperature. The surface relaxivity therefore decreases with tem-perature. However, the energy corresponding to the surface inter-
actions is different for each of the pore systems. These activationenergies are listed in Table 1. We can see that as the pore size de-creases the effective energy decreases.
The relaxation times T2,i all have a different temperature depen-dence. Therefore, each pore system which is contributing to the to-tal signal should be corrected separately. To obtain a quantitativemoisture content h a temperature and pore system dependent cor-rection factor ci(T) is applied:
h ¼X
i
ciðTÞAiðTÞ exp � te
T2;iðTÞ
� �: ð7Þ
Note that we have written this equation for t = te because this isthe time at which the signal is recorded. The correction factor ci
contains both the magnetisation correction as well as the exponen-tial relaxation time correction factor. A full correction of the signalshould include a relaxation correction for all three relaxation timeswith temperature. Consequently, during the experiment at eachdegree of saturation and temperature the distribution of the mois-ture over the three pore systems needs to be known.
The overall influence of the relaxation correction for a particularpore system i on the total signal depends firstly on the amplitudeof the relaxation time contribution and secondly on the ratio te/T2. We have seen in Section 2.2 that the maximum contributionof the capillary pores and the micro-cracks to the total signalwas about 10%. Furthermore, the ratio te/T2 is 5 � 10�2 for the cap-illary pores and 3 � 10�3 for the micro-cracks. This already indi-cates that the influence of the temperature dependence for thesetwo pore systems is negligible. Therefore, in case of concrete forte = 160 ls correction of only the gel pores is sufficient.
To illustrate this we have plotted in Fig. 5a the correction factorci as a function of temperature. Three different corrections areshown: the correction for the nuclear magnetisation (solid line),the total correction including relaxation for the gel pores, and thetotal correction for the capillary pores.
In case of the gel pores the relaxation time correction results ina significantly different correction factor of about half of the initialcorrection. Note that the total correction of the gel pores is effec-tively smaller since the relaxation time correction for the gel poresis larger than one. For the capillary pores, this correction at 100 �Camounts to 1%, which is negligible. We have excluded the relaxa-tion time correction for the micro-cracks from the discussion sincethe correction factor will coincide with the solid line.
During heating of the concrete the amplitudes of the differentpore systems will decrease due to drying. It is observed that therelaxation time corresponding to the gel pores does not signifi-
2.6 2.8 3.0 3.2 3.4 3.6 3.870
75
80
85
90
95
100
105
110Gypsum
2.6 2.8 3.0 3.2 3.4 3.6 3.8
300
320
340
360
380
400
1000 / T (K-1)
Concrete gel pores
2.6 2.8 3.0 3.2 3.4 3.6 3.8
45
50
55
60
65
70
758085
T 2(m
s)
Concrete cracks
2.6 2.8 3.0 3.2 3.4 3.6 3.83
4
5
6
7
8Concrete capillary pores
T 2(μ
s)
1000 / T (K-1)
1000 / T (K-1) 1000 / T (K-1)
T 2(m
s)T 2
(ms)
(a) (b)
(c) (d)Fig. 4. Arrhenius plots of the transverse relaxation time. From the top left to bottom right: relaxation times of water in gel pores, capillary pores, concrete cracks, and gypsum.The solid lines are fits of a straight line to the data.
Table 1Measured activation energy for transverse relaxation of water in gel pores, capillarypores, and cracks of concrete. For comparison gypsum is also included.
Porous material Energy (kJ mol�1)
Concrete (gel) 1.8Concrete (capillary) 4.4Concrete (cracks) 5.6Gypsum 4.3
240 G.H.A. van der Heijden et al. / Journal of Magnetic Resonance 208 (2011) 235–242
cantly change during emptying of the gel pores. Furthermore, ascan be seen in the signal profiles the transition from signal to nosignal is sharp. Any relaxation time dependence of the signal willnot significantly change the signal profiles in this region.
3.3. Fire spalling experiment
We will now take one of the signal profiles from Fig. 3 and applyboth the magnetisation as well as the total correction includingrelaxation of the gel pores. The influence of both corrections isshown in Fig. 5b. Here, the uncorrected signal profile (solid line),the magnetisation corrected (M, dash-dotted line), and the totalcorrected (M + R, dashed line) are shown. The magnetisation cor-rection increases the measured signal at a position of 40 mm from1.1 to 1.6. Although the temperature, and thus correction, is higherclose to the surface, no significant change of the moisture profileupon correction (correction indicated by bold curve Fig. 5a). Thedashed line shows the result after both magnetisation and relaxa-tion correction. The more or less homogenous signal profile from40 to 100 mm shows a distinct peak at 40 mm after the correction.
The complete set of corrected signal profiles (see Fig. 6) can beused to get a better understanding of the physics behind the mois-
ture transport processes taking place in concrete. In this figure weshow both the corrected signal profiles (a) as well as the measuredtemperature profiles (b) already shown in Fig. 3b. Four observa-tions regarding the moisture profiles can be made. Firstly, immedi-ately after the heating is started, a boiling front enters the sample.The temperature at the boiling front rises from 150 �C to 195 �C.From the temperature measured at the boiling front we can esti-mate the saturated vapour pressure to be �1.3 MPa. This pressureis of the same order of magnitude as was measured in a similarheating experiment in concrete directly by means of a pressuretransducer [16]. These pressures are close to the typical tensilestrength of concrete, which is about 3–5 MPa.
Secondly, because of the high vapour pressure at the boilingfront, vapour can be convected in two directions, towards the sur-face, and towards the back of the sample. The vapour flux towardsthe surface flows into a region of higher temperatures. The vapourflux in the opposite direction flows into a region of lower temper-atures. Hence, this part of the vapour condenses and the moisturecontent increases and forms a moisture peak. Note that condensa-tion takes place at a temperature of about 140 �C (see h in Fig. 6b).These temperatures were measured at the peak in moisturecontent.
Thirdly, the moisture peak increases and even reaches satura-tion behind the boiling front. The saturated layer widens and dueto the limited size of the sample (100 mm) the back of the samplealso becomes saturated. The maximum moisture content reachedin this experiment corresponds to the saturated moisture contentof the concrete. Without proper correction one would not havecome to this conclusion (see uncorrected signal profiles).
Fourthly, a saturated porous material has a capillary pressureclose to zero and as a consequence the vapour pressure at the boil-ing front can become comparable to or larger than the capillary

2.0 2.2 2.4 2.6 2.8 3.0 3.2 3.40.5
0.6
0.7
0.8
0.9
1.0
1000 / T (K-1 )
no correction
20º C100º C200º C
1 / T magnetisation gel pores (T2 ~ 280 s) capillary pores (~ 3 ms)
0 20 40 60 80 1000
0.5
1
1.5
2
position (mm)
S/S 0( -
)
uncorrected
M
M+R
1
1.5
2
c(-
)
c(-
)
(a) (b)Fig. 5. (a) The first three contributions to the overall temperature correction as a function of temperature. The temperature correction factor for the nuclear magnetisation (1/T, solid line). The extra contribution of the surface relaxation for the concrete gel pores (dashed line). The extra contribution of the capillary pores (dash-dotted line). (b)Corrections applied to the raw signal profile in concrete after 42 min (solid line). The signal profile which is corrected for the temperature dependence of the magnetisation isindicated by M. The moisture profile which is corrected the temperature dependence of both magnetisation and relaxation is indicated by M + R. The total correction factor isshown by the bold curve.
0 20 40 60 80 100
0
0.07
position (mm)
3-3
θ(m
m)
0 20 40 60 80 1000
100
200
300
400
position (mm)
T (º
C)
capillary saturation
chemically bound water
(a) (b)Fig. 6. (a) Corrected moisture profiles and (b) temperature profiles. As the temperature increases quickly to above 100 �C a boiling front develops. The temperature at thefront is marked in the temperature profiles (5). The dashed line indicates the 100 �C isotherm. As the boiling front progresses a moisture peak develops. This peak increasesand reaches saturation after 30 min. The temperatures at the moisture peak are indicated in the temperature profiles (h). The temperature at the surface increases to about350 �C. The profiles are shown every 8.5 min. The arrows in the figures indicated the progress in time.
G.H.A. van der Heijden et al. / Journal of Magnetic Resonance 208 (2011) 235–242 241
pressure. It can possibly generate a liquid water flow towards theback of the sample. In practice it is observed that a concrete wallwill start to ‘bleed’ water from larger cracks at the cold side. Notethat the vapour cannot be transported through a saturated layer ofconcrete because the relative vapour permeability is zero. Thespeed at which the moisture content at the back side of the sampleincreases indicates that possibly liquid moisture is pushed back bythe increased vapour pressure. However, no direct evidence for thisprocess is available.
4. Conclusions
We have presented a new NMR setup which makes it possibleto measure non-isothermal moisture transport in a variety ofbuilding materials. Realistic temperature gradients, mimickingthat of a fire, can be applied. Simultaneous measurements of mois-ture and temperature yield valuable information on the physicalmechanisms behind damage processes. Up till now, the existenceof a moisture peak and the development of a saturated regionwas only predicted by models. To our knowledge this measure-ment is the first direct quantitative evidence for this process.
As we have shown, temperature measurements are essential inthese non-isothermal experiments, as they provide the proper cor-
rection needed to obtain accurate quantitative moisture profiles. Itmust be noted that the proper correction factor may be differentfor different porous materials. Therefore, for each porous materiala calibration of the NMR signal with temperature is needed.
Acknowledgments
This research was supported by the Dutch Technology Founda-tion (STW, Grant 07045). We would like to thank Jef Noijen andHans Dalderop for their help in constructing the NMR setup andgold coating of the halogen lamps.
References
[1] G.W. Scherer, Crystallization in pores, Cement and Concrete Research 29 (8)(1999) 1347–1358.
[2] G.A. Khoury, Effect of fire on concrete and concrete structures, Progress inStructural Engineering and Materials 2 (2000) 429–447.
[3] F.A. Ali, D. O’Connor, A. Abu-Tair, Explosive spalling of high-strength concretecolumns in fire, Magazine of Concrete Research 53 (3) (2001) 197–204.
[4] K. Kopinga, L. Pel, One-dimensional scanning of moisture in porous materialswith nmr, Review of Scientific Instruments 65 (12) (1994) 3673–3681.
[5] M.T. Vlaardingerbroek, J.A. den Boer, Magnetic Resonance Imaging, 3rd ed.,Springer Verlag, 2003.
[6] L. Pel, K. Kopinga, H. Brocken, Determination of moisture profiles in porousbuilding materials by nmr., Magnetic Resonance Imaging 14 (7–8) (1996) 931–932.

242 G.H.A. van der Heijden et al. / Journal of Magnetic Resonance 208 (2011) 235–242
[7] L. Pel, H. Brocken, K. Kopinga, Determination of moisture diffusivity in porousmedia using moisture concentration profiles, International Journal of Heat andMass Transfer 39 (6) (1996) 1273–1280.
[8] G.H.A. van der Heijden, H.P. Huinink, L. Pel, K. Kopinga, Non-isothermal dryingof fired-clay brick, an nmr study, Chemical Engineering Science 64 (12) (2009)3010–3018.
[9] T.C. Hansen, Physical structure of hardened cement paste. A classical approach,Materials and Structures 19 (114) (1986) 423–436.
[10] J.Y. Jehng, D.T. Sprague, W.P. Halperin, Pore structure of hydrating cementpaste by magnetic resonance relaxation analysis and freezing, MagneticResonance Imaging 14 (7–8) (1996) 785–791.
[11] C.P. Slichter, Principles of Magnetic Resonance, Springer Verlag, Berlin, 1989.
[12] D.H. Gultekin, J.C. Gore, Temperature dependence of nuclear magnetizationand relaxation, Journal of Magnetic Resonance 172 (1) (2005) 133–141.
[13] R.L. Kleinberg, Nuclear magnetic resonance, in: Po-Zen Wong (Ed.), Methods inthe Physics of Porous Media, Experimental Methods in the Physical Sciences,35th ed., Elsevier, 1999, pp. 337–385 (Chapter 9).
[14] K.R. Brownstein, C.E. Tarr, Importance of classical diffusion in nmr studies ofwater in biological cells, Physical Review A 19 (6) (1979) 2446.
[15] S. Godefroy, M. Fleury, F. Deflandre, J.P. Korb, Temperature effect on nmrsurface relaxation in rocks for well logging applications, The Journal ofPhysical Chemistry B 106 (43) (2002) 11183–11190.
[16] P. Kalifa, F.D. Menneteau, D. Quenard, Spalling and pore pressure in hpc at hightemperatures, Cement and Concrete Research 30 (12) (2000) 1915–1927.