one and two pen 12 inch circular chart … and two pen 12 inch circular chart ... installation,...
TRANSCRIPT

Form 3785 • Price $32.00Edition 1 • © June 1997
The Partlow Corporation • Two Campion Rd. • New Hartford, NY 13413 USA • 315-797-2222 • FAX 315-797-0403
ONE AND TWO PEN 12 INCH CIRCULAR CHART RECORDERS AND RECORDING CONTROLLERS
Installation, Wiring, Operation ManualMRC 8000

2
I nformation in this installation, wiring, and operation manual is subject to change without notice. One manual is provided with each instrument at the time ofshipment. Extra copies are available at the price publishedon the front cover.
Copyright © June 1997, The Partlow Corporation, all rightsreserved. No part of this publication may bereproduced, transmitted, transcribed or stored in aretrieval system, or translated into any language in anyform by any means without the written permission of thePartlow Corporation.
This is the First Edition of the MRC 8000 RecordingController Manual. It was written and produced entirely ona desk-top-publishing system. Disk versions are availableby written request to the Partlow Advertising andPublications Department.
We are glad you decided to open this manual. It is writtenso that you can take full advantage of the features of yournew MRC 8000 microbased chart recording controller.
It is strongly recommended that Partlow equipped applicationsincorporate a high or low limit protective device which will shutdown the equipment at a preset process condition in order topreclude possible damage to property or products.
NOTE

3
TABLE OF CONTENTS
SECTION 1 - GENERAL PAGE NUMBER1.1 Product Description 5
SECTION 2 - INSTALLATION & WIRING2.1 Installation & Wiring 82.2 Unpacking 82.3 Location 82.4 Mounting 82.5 Preparation for Wiring 102.6 Wiring Connections 14
SECTION 3 - CONFIGURATION3.1 Configuration (Set Up) 203.2 Configuration/Jumper Positioning 213.3 Operation Summary 213.4 Start Up Procedures 223.5 Front Panel Operation 22
SECTION 4 - OPERATION4.1 Off Control Mode 394.2 Alarm Operation 434.3 Tune Mode Operation 44
SECTION 5 - SERVICE5.1 Service 475.2 Changing Charts 475.3 Changing Pens 475.4 Calibration 485.5 Test Mode Procedures 535.6 Troubleshooting and Diagnostics (Error Code Definitions) 57
APPENDICESA - Board Layouts and Jumper Positioning
A-1 - Processor Board 64A-2 SPST Relay/SSR Driver Output Board 65A-3 Current Output Board 66
B - Glossary 67
C- Order Matrix 69
D- Product Specifications 70
E- Software Record/Reference Sheet 73Warranty 75

4
FIGURES & TABLESFigure 1-1 Recorder Description 5Figure 1-2 Recorder Display 7Figure 2-1 Installation Panel Dimensions Conduit Opening Locations 9Figure 2-2 Noise Suppression 11Figure 2-3 Noise Suppression 11Figure 2-4 Board and Terminal Locations 14Figure 2-5 AC Power Input 15Figure 2-6 Thermocouple Inputs 15Figure 2-7 RTD Inputs 15Figure 2-8 Milliamp, Volt and Millivolt Inputs 16Figure 2-9 Remote Setpoint Input VDC, mADC 16Figure 2-10 Digital Communications 17Figure 2-11A SPST Relay Output 17Figure 2-12 SSR Output 18Figure 2-13 Current Output 18Figure 2-14 24 VDC Power Supply Option 19Figure 2-15 Position Proportioning Control Output 19Figure 3-1 Keypad Features 24Figure 5-1 Changing Pens 47Table 3-1 Program Mode Configuration Procedure 28Table 3-2 Tune Mode Configuration Procedure 35Table 3-3 Enable Mode Configuration Procedure 37Table 5-1 Calibration Procedure 49Table 5-2 Test Procedures and Description 54
FLOW CHARTSFlow - Alarm Set Mode 33
Flow - Calibration 48Flow - Enable Mode 38Flow - Program Mode 25Flow - Setpoint Select 40Flow - Standby 43Flow - Test 53Flow - Tune Mode 34

5The number of keys and LED's will depend upon the configuration of individual unit.
Product Description 1.11.1.1 GENERALThe instrument is a microprocessor based circular chart Recorder or Recording Controllercapable of measuring, displaying, recording and controlling from a variety of inputs. Applica-tions include temperature, level, pressure, flow and others. The instruments can be specifiedas either a single or as a dual pen model.
Recording, control functions, alarm settings and other parameters are easily entered via thekeypad. All user's data can be protected from unauthorized changes by the Enable modesecurity system, and is protected against memory loss, as a result of AC power outage, bybattery back-up.
The process sensor input for each pen is user configurable to directly connect to eitherthermocouple, RTD, mVDC, VDC, or mADC inputs. Changes in input type can easily be madeby the user. Thermocouple and RTD linearization, as well as thermocouple cold junctioncompensation, are performed automatically. The instrument process variable inputs areisolated. An isolated 24 VDC regulated transmitter power supply can be provided in theinstrument for use with up to two 4 to 20 mADC process sensor transducers.
The instrument can be ordered to operate on either 115 VAC or 230 VAC power at 50/60 Hz.The 230 VAC option includes a switch for selecting either 230 VAC or 115 VAC operation.The instrument is housed in a structural foam enclosure suitable for panel or surfacemounting.
FIGURE 1-1

6
1.1.2 RECORDINGThe instrument records the selected process variable on a 12-inch circular chart. One box ofstandard charts is provided with each recorder. Charts are available in a wide selection ofranges. Chart rotation speed is programmable from 0.1 to 999.9 hours per revolution in 0.1hour increments. The instrument can be ordered with one or two pens. Pen 1 is red and Pen 2is green. Pens are the disposable fiber-tip type.
1.1.3 DISPLAYSEach instrument has a digital display and status indicators for each pen (See Figure 1-1, page5). On Recording Controllers, the display may be configured to display the Process Value,Process Value and Setpoint, Deviation from Setpoint only, Deviation and Setpoint, or Setpointonly. During configuration the display(s) is/are used to show the enabled modes of operationand the parameter codes.
The display at the left is for Pen 1, the display at the right is for Pen 2 (if provided). OnRecorders, the display includes status indicators for Alarm 1 and Alarm 2, degrees C,degrees F, engineering units, and setpoint (for limits). On Recording Controllers, the displayincludes status indicators for Manual mode operation, Output 1, Output 2 , Alarm, degrees C,degrees F, engineering units, setpoint and minus sign. See Figure 1-2 ( page 7).
Display resolution is programmable for 0.1 or 1 degree for thermocouple and RTD inputs, andnone, one, two or three decimal places for other input types.
1.1.4 CONTROLThe instrument can be provided with relay, solid state relay driver and milliamp DC outputs.Instruments can be programmed for on-off, time proportioning, current proportioning orposition proportioning control depending upon the hardware present. Switching between theControl mode and the Manual mode of operation is easily accomplished with a dedicated keyon the keypad. Switching is bumpless from the Control to the Manual mode, and while inmanual, manipulation of proportional outputs is possible. Each pen of a dual pen recordingcontroller is provided with its own AUTO/MANUAL key . Other standard control featuresinclude proportional control output limits, setpoint limits, anti-reset windup and a uniqueAutomatic Transfer function. If configured, the Automatic Transfer function allows manualcontrol of the proportional output until the process reaches the setpoint at which time theinstrument will go into the Control (automatic) mode of operation.
1.1.5 ALARMAn Alarm indicator is standard for each pen. Two alarm functions are provided for each penand the alarm indicator will light if either alarm for that pen is on. Alarm settings are program-mable. Alarm type may be selected as process direct or reverse (high or low), deviation fromsetpoint direct or reverse, and deviation band open or closed within the band. Alarm outputscan be provided by assigning any relay(s) Single Pole/Single Throw (SPST) or Solid StateRelay (SSR) driver to the respective alarm.
1.1.6 PROCESS VALUE RE-TRANSMISSION OUTPUTIf an instrument is specified with mADC current output(s), any of the outputs may be pro-grammed to operate as a process value re-transmission output. The output is scaleable but

7
can not be used as a control output while assigned as a process value re-transmission output.
1.1.7 DIGITAL COMMUNICATIONSThe instrument can be ordered with a Digital Communications option that provides thecapability of bi-directional communications with a supervisory computer. A dual peninstrument can have an individual address selected for each pen. Refer to the Communica-tions Protocol Manual (Form 2878) for more details regarding the communications option.This manual is included with the unit when the communications option is specified.
FIGURE 1-2
RECORDERS:
RECORDING CONTROLLERS:
CFU
Alarm 1 Alarm 2
ALRM1 ALRM2
Minus Sign
Limit Setpoint
CFU
Alarm
ALRM
Minus Sign
OUT2OUT1MAN
SP
Manual Output 1 Output 2
Setpoint
Digital Display
Digital Display

8
Installation and Wiring 2.1Read these instructions carefully before proceeding with installation and operation. Electricalcode requirements and safety standards should be observed. Installation should be performedby qualified personnel.
CAUTION: The Instrument AC power input is specified in the model number and on thewiring label affixed to the the top center of the platen. Verify the AC power input requiredby the instrument prior to proceeding with installation.
Unpacking 2.2Remove the instrument from the carton and inspect for any damage due to shipment. If anydamage is noticed due to transit, report and file a claim with the carrier. Write the modelnumber and serial number of the instrument on the inside of the front cover of this OperationManual for future reference.
Location 2.3Locate the instrument away from excessive moisture, oil, dust, and vibration. Do not subjectthe instrument to operating temperatures outside of the 32°F to 131°F (0°C to 55°C) range.
Mounting 2.4Figure 2-1A and 2-1B (below and page 2) shows an installation view and physicaldimensions for a panel mounted instrument. The panel where the instrument will bemounted must provide rigid support for the approximately 25 pound instrument.Adjacent instruments may be mounted within a minimum of 2 inches horizontally and1 inch vertically, providing that proper panel support is supplied.
Panel Mounting Hardware Required: (not provided with instrument)(4) #10 flat head bolts with nuts(4) lock washers
Panel Mounting1. Cut panel opening to the dimensions illustrated in Figure 2-1A (below).2. Pre-drill four 3/16 dia. holes for mounting or use the drill template molded into thecase after inserting the instrument into the panel.3. Insert the instrument in the panel opening. Firmly fasten the instrument to thepanel using the nuts, bolts and lock washers.
Surface MountingInstall the mounting brackets, ordered separately, on the vertical sides of instrumenthousing. Use the brackets to fasten the instrument to the surface. Hardware recom-mended - #10-24 SCRs.

9
FIGURE 2-1
(MIN. HORZ. SPACING)6.156"
(156.36mm)
(MIN. VERT. SPACING)3.600"
(91.44mm)3/16" DIA.
12.700"(322.58mm)
14.180"(360.17mm)
10.000"(254.00mm)
12.700"(322.58mm)
Figure 2-1A
0.7"(17.78mm)
5.24"(133.10mm)
17.04"(432.82mm)
EC1EC5
EC2 EC3EC6
EC4
14.12"(358.65mm)
12.600"(320.04mm)
7.747"(196.77mm)
Figure 2-1B
2.12"(53.85mm)
12.60"(320.04mm)
2.044"(58.93mm)

10
Preparations for Wiring 2.5
2.5.1 WIRING GUIDELINESElectrical noise is a phenomenon typical of industrial environments. The following are guide-lines that must be followed to minimize the effect of noise upon any instrumentation.
2.5.1.1 INSTALLATION CONSIDERATIONSListed below are some of the common sources of electrical noise in the industrial environ-ment:• Ignition Transformers• Arc Welders• Mechanical contact relay(s)• Solenoids
Before using any instrument near the devices listed, the instructions below should befollowed:
1. If the instrument is to be mounted in the same panel as any of the listed devices, separate them by the largest distance possible. For maximum electrical noise reduction, the noise generating devices should be mounted in a separate enclosure.
2. If possible, eliminate mechanical contact relay(s) and replace with solid state relays. If a mechanical relay being powered by an instrument output device cannot be replaced, a solid state relay can be interposed to isolate the instrument. (Continued on next page)
3. A separate isolation transformer to feed only instrumentation should be considered. The transformer can isolate the instrument from noise found on the AC power input.
4. If the instrument is being installed on existing equipment, the wiring in the area should be checked to insure that good wiring practices have been followed.
2.5.1.2 AC POWER WIRINGEarth GroundThe instrument includes noise suppression components that require an earth groundconnection to function. To verify that a good earth ground is being attached, make a resis-tance check from the instrument chassis to the nearest metal water pipe or proven earthground. This reading should not exceed 100 ohms. Each instrument should have a dedicatedearth ground. Do not chain link multiple instrument ground wires.
Neutral (For 115VAC)It is good practice to assure that the AC neutral is at or near ground potential. To verify this, avoltmeter check between neutral and ground should be done. On the AC range, the readingshould not be more than 50 millivolts. If it is greater than this amount, the secondary of thisAC transformer supplying the instrument should be checked by an electrician. A properneutral will help ensure maximum performance from the instrument.
2.5.1.3 WIRE ISOLATION/SEGRATIONThe instrument is designed to promote proper separation of the wiring groups that connect tothe instrument. The AC power wire terminals are located near the top of the instrumentboards. The analog signal terminals are located near the bottom of the instrument boards.Maintain this separation of the wires to insure the best protection from electrical noise. If thewires need to be run parallel with any other wiring type(s), maintain a minimum 6 inch spacebetween the wires. If wires must cross each other, do so at 90 degrees to minimize the

11
contact with each other and amount of cross talk. Cross talk is due to the EMF (ElectroMagnetic Flux) emitted by a wire as current passes through it.
2.5.1.4 USE OF SHIELDED CABLEShielded cable helps eliminate electrical noise being induced on the wires. All analog signalsshould be run with shielded cable. Connection lead length should be kept as short as pos-sible, keeping the wires protected by the shielding. The shield should be grounded at one endonly. The preferred grounding location is at the sensor, transmitter or transducer.
2.5.1.5 NOISE SUPPRESSION AT THE SOURCEUsually when good wiring practices are followed, no further noise protection is necessary.Sometimes in severe environments, the amount of noise is so great that it has to be sup-pressed at the source. Many manufacturers of relays, contactors, etc. supply "surge suppres-sors" which mount on the noise source.
For those devices that do not have surge suppressors supplied, RC (resistance-capacitance)networks and/or MOV (metal oxide varistors) may be added.
Inductive Coils - MOV's are recommended for transient suppression in inductive soils con-nected in parallel and as close as possible to the coil. See Figure 2-2. Additional protectionmay be provided by adding an RC network across the MOV.
Contacts - Arcing may occur across contacts when the contact opens and closes. This resultsin electrical noise as well as damage to the contacts. Connecting a RC network properlysized can eliminate this arc.
For circuits up to 3 amps, a combination of a 47 ohm resistor and 0.1 microfarad capacitor(1000 volts) is recommended. For circuits from 3 to 5 amps, connect 2 of these in parallel.See Figure 2-3.
FIGURE 2-2
FIGURE 2-3
A.C. MOVInductiveLoad
C
R
0.5mfd
1000V
220ohms
115V 1/4W230V 1W
A.C.
MOV
RInductiveLoadC

12
2.5.2 SENSOR PLACEMENT (THERMOCOUPLE OR RTD)If the temperature probe is to be subjected to corrosive or abrasive conditions, it should beprotected by the appropriate thermowell. The probe should be positioned to reflect trueprocess temperature:
In liquid media - the mose agitated area.In air - the best circulated area.
THERMOCOUPLE LEAD RESISTANCEThermocouple lead length can affect instrument accuracy, since the size (gauge) and thelength of the wire affect lead resistance.
To determine the temperature error resulting from the lead length resistance, use the followingequation:
Terr = TLe * L where; TLe = value from appropriate TableL = length of leadwire in thousands of feet.
TABLE 1
Temperature error in °C per 1000 feet of Leadwire AWG Thermocouple Type No. J K T R S E B N C 10 .68 1.71 .76 2.05 2.12 1.15 14.00 2.94 2.53 12 1.08 2.68 1.21 3.30 3.29 1.82 22.00 4.68 4.07 14 1.74 4.29 1.95 5.34 5.29 2.92 35.00 7.44 6.37 16 2.74 6.76 3.08 8.30 8.35 4.60 55.50 11.82 10.11 18 4.44 11.00 5.00 13.52 13.65 7.47 88.50 18.80 16.26 20 7.14 17.24 7.84 21.59 21.76 11.78 141.00 29.88 25.82 24 17.56 43.82 19.82 54.32 54.59 29.67 356.50 75.59 65.27
TABLE 2
Temperature error in °F per 1000 feet of Leadwire AWG Thermocouple Type No. J K T R S E B N C 10 1.22 3.07 1.37 3.68 3.81 2.07 25.20 5.30 4.55 12 1.94 4.82 2.18 5.93 5.93 3.27 39.60 8.42 7.32 14 3.13 7.73 3.51 9.61 9.53 5.25 63.00 13.38 11.47 16 4.93 12.18 5.54 14.93 15.04 8.28 99.90 21.28 18.20 18 7.99 19.80 9.00 24.34 24.56 13.44 159.30 33.85 29.27 20 12.85 31.02 14.12 38.86 39.18 21.21 253.80 53.79 46.48 24 31.61 78.88 35.67 97.77 98.26 53.40 641.70 136.07 117.49
ExampleA recorder is to be located in a control rrom 660 feet away from the process. Using 16 AWG,Type J thermocouple, how much error is induced?
Terr = TLe * L = 4.93 (°F/1000 ft) from Table 2.
Terr = 4.93 (°F/1000 ft)
Terr = 3.3 °F

13
RTD LEAD RESISTANCERTD lead length can affect instrument accuracy. Size (gauge) and length of the wire usedaffects lead length resistance.
To determine the temperature error resulting from the lead length resistance, use the followingequation:
Terr = TLe * L where; TLe = value from Table 3 if 3 wire or Table 4 is 2 wire.L = length of leadwire in thousands of feet.
TABLE 3 3 Wire RTD
AWG No. Error °C Error °F 10 +/-0.04 +/-0.07 12 +/-0.07 +/-0.11 14 +/-0.10 +/-0.18 16 +/-0.16 +/-0.29 18 +/-0.26 +/-0.46 20 +/-0.41 +/-0.73 24 +/-0.65 +/-1.17
TABLE 4 2 Wire RTD
AWG No. Error °C Error °F 10 +/-5.32 +/-9.31 12 +/-9.31 +/-14.6 14 +/-13.3 +/-23.9 16 +/-21.3 +/-38.6 18 +/-34.6 +/-61.2 20 +/-54.5 +/-97.1 24 +/-86.5 +/-155.6
ExampleAn application uses 2000 feet of 18 AWG copper lead wire for a 3-wire RTD sensor. What isthe worst-case error due to this leadwire length?
Terr = TLe * L
TLe = +/- .46 (°F/1000 ft) from Table 1
Terr = +/- .46 (°F/1000 ft) * 2000 ft
Terr = +/- 0.92 °F

14
Wiring Connections 2.6All wiring connections are typically made to the instrument at the time of installation. Connec-tions are made at the terminal boards provided, two 12 gauge wires maximum. Terminalboards are designated TB1 through TB13. See Figure 2-4 for the terminal board locations.The number of terminal boards present on the instrument depend upon the model number/hardware configuration.
FIGURE 2-4
2.6.1 ELECTRICAL CONDUIT OPENINGSThe instrument case will have 3 or 4 conduit openings, depending upon the number of outputsspecified. To help minimize electrical noise that may adversely affect the operation of theinstrument the wires indicated below should be routed through the conduit opening specified.See Figure 2-1 (page 9) for conduit opening locations.
EC4- AC Power InputEC1/EC2- Analog input and mADC outputsEC3/EC4- SPST relay or SSR driver outputs
Unused conduit openings should be sealed.
2.6.2 AC POWER WIRING CONNECTIONSWARNING: Avoid electrical shock. AC power wiring must not be connected at the sourcedistribution panel until all wiring connections are completed.
TB3 TB4 TB5
TB1
1 2
1 2 1 2 3 4 5 1 2 3 4 5
1 2 3 4 1 2 3 4
TB6 TB7
RELAY/SSR DriverBoard
1 2 1 2
Current Output Board
Processor Board
TB 2
1 2TB8 TB9
15
TB4 or TB5
1 2 3 4 5+ -
Grounded orUngroundedThermocouplesmay be used
FIGURE 2-5AC Instrument Power InputConnect the 115 VAC hot and neutral to terminals 1 and 2 respectively of TB1. See Figure 2-4(page 14) for Terminal Board locations on the instrument. Connect the 230 VAC one leg toeach terminal, be sure to check the position of the Voltage Selector switch provided with 230VAC instruments. The switch position must match the voltage input to the instrument.
FIGURE 2-6Thermocouple Inputs Use TB4 for the Pen 1 input, and TB5 for the Pen 2 input. Connect the positive leg of thethermocouple to terminal 1, and the negative to terminal 2. Be sure that the input conditioningjumpers are properly positioned for a thermocouple input. See Appendix A-1 (page 62).
FIGURE 2-7RTD InputsUse TB4 for the Pen 1, and TB5 for the Pen 2 input. Connections are shown for 3 wire and 2wire RTD inputs. If a three wire device is used, install the common legs to terminals 2 and 3. Ifa two wire device is used, install a jumper between terminals 2 and 3. Be sure that the inputconditioning jumpers are properly positioned for an RTD input. See Appendix A-1 (page 62).
TB4 or TB5
1 2 3 4 5-+
TB4 or TB5
1 2 3 4 5-+
Jumper
3 Wire RTD 2 Wire RTD
SUPPLIED BYCUSTOMER
1 2
TB1Connect the ACground at thegreen ground screwon the top right sideof the inside of thecase
Line 1 Line 2

16
FIGURE 2-8Volt, Millivolt and milliamp InputMake the volt, millivolt and milliamp connections as shown below. Use TB4 for thePen 1 input,and TB5 for the Pen 2 input. Terminal 1 is positive and terminal 2 is negative. The milliampinput requires the installation of an appropriate shunt resistor (ordered separately) betweenterminals 1 and 2. Be sure that input conditioning jumpers are in the correct positions for theinput being connected. See Appendix A-1 (page 62).
NOTE: Fault Detection is not functional for 0-5V or 0-20mA inputs.
FIGURE 2-9Remote Setpoint Input VDC , mADCIf Remote Setpoint option has been specified, make connections as shown. The remotesetpoint input may be selected as either 0 to 5 VDC or 1 to 5 VDC input in the Program modesection. Make sure the configuration properly matches the input used. Use TB4 for Pen 1, andTB5 for Pen 2 if Pen 2 is provided and specified with the Remote Setpoint option. Connectthe positive lead to terminal 4, and the negative lead to terminal 3 (Terminal 3 is the ground,terminal 4 is the input, terminal 5 is 5 VDC.) If a 4 to 20 mADC remote setpoint is to be used,the instrument remote setpoint input should be configured for 1 to 5VDC in the Programmode, and a 250 ohm resistor should be installed across terminals 4 and 3. A 250 ohmresistor is provided with the instrument, one per pen. The resistor(s) are shipped in the plasticbag that is clipped to the inside of the instrument cover. This is the same bag that containsthe spare pen cartridge(s).
1 2 3 4 5+ -
TB4 or TB5
SHIELDEDTWISTEDPAIR
SOURCE+ - MAY BE
GROUNDED OR UNGROUNDED
1 2 3 4 5+ -
TB4 or TB5
SHIELDEDTWISTEDPAIR
SOURCE- +
1 2 3 4 5+ -
TB4 or TB5
SHIELDEDMULTI-CONDUCTORCABLE
150 OHM TO 10K OHM POTENTIOMETER

17
FIGURE 2-10Digital Communications OptionsConnections are made as shown using TB2. Refer to the Protocol Manual, Form #2878 formore details regarding the connections and how to use this option. This document is providedonly when this option has been specified. If the communications network continues on to otherinstruments, connect the cable shields together, but not to the instrument. A terminatingresistor should be installed at the terminals of the last unit in the communications loop. If thecommunications network ends at the instrument, the shield is not connected.
2.6.4 OUTPUT CONNECTIONSRelay output(s), if provided in the instrument, may be assigned to control or alarm outputfunctions for Pen 1 and/or Pen 2 (if present). Current outputs may be assigned to control andprocess value retransmission output for Pen 1 and/or Pen 2 (if present). The assignment ofthe output function (s) are/is accomplished in the Program mode. SPST relay and/or SSRdriver output(s) is/are designated as Relay A through Relay D.
FIGURE 2-11SPST Relay OutputConnections are made to relays A through D as shown. Terminal connections are made usingTB6 (Relay/SSR Driver A, B) and TB7 (Relay/SSR Driver C, D).
TOWARD THE COMPUTER
TB2
1 2
NETWORKCONTINUATION(IF APPLICABLE)
Serial A Serial B
1 2 3 4
LOAD
POWER
HOT
NEU
5 AMPERESMAXIMUMAT 115 VACN.O. C N.O. C
TB6 Relay A & B, Relay A Terminals 1 & 2TB7 Relay C & D, Relay C Terminals 1 & 2

18
FIGURE 2-12SSR Driver OutputConnections are made to relays D through A as shown. Terminal connections are made usingTB7 and TB6, depending on the number of SSR Driver outputs specified.
FIGURE 2-13Current OutputConnections are made to current outputs A and B as shown. Each current output is program-mable as either 4 to 20 mADC or 0 to 20 mADC. Each output must be assigned to the desiredfunction in the Program mode. Terminal connections are made using TB8 and TB9 for currentoutput A and B respectively. Connect positive lead (+) to terminal 1 and the negative lead (-)to terminal 2. Each current output will operate up to a 650 ohms maximum load.
1 2
SHIELDEDTWISTEDPAIR
LOAD+ -
650 OHMS MAXIMUM
1 2 3 4SSR
+ -
TB6 OR TB7

19
FIGURE 2-14Transmitter Power Supply InputIf the isolated 24 VDC regulated transmitter power supply has been specified, the connectionsshould be made as shown. Connections are made using TB3, terminal 1 is positive andterminal 2 is negative. The power supply is capable of providing the power needed by up to 2transducers (40 mADC maximum).
FIGURE 2-15Position Proportioning Control OutputPosition Proportioning control requires that two relays (or SSR Drivers) and the PositionProportioning Auxiliary input be specified. On a dual pen instrument, either pen may beconfigured with Position Proportioning control provided the outputs and auxiliary inputs havebeen properly specified.
SHIELDEDTWISTED
PAIRS
1 2 3 4 5+ -
TB4 or TB5TB3
1 2+ -
+ -
1 2 3 4 5+ -
TB4 TB3
1 2+ -
1 2 3 4 5+ -
TB5
+ - + -
TWO WIRE TRANSMITTERS
TWO WIRE TRANSMITTERS
TWO WIRE TRANSMITTERS
Modulating Motor SlidewireFeedbackResistancemin. 135ohmsmax. 10Kohms
L1
L2
OPEN
CLOSE
L
H
C
3
4
5TB4orTB5
1
2
3
4 TB6 orTB7

20
Configuration 3.1After completing installation and wiring of the instrument the configuration (set up) proceduresmust be performed to prepare the instrument for operation on the intended application. Theprocedures include selecting specific parameters, entering data and possible jumper position-ing. Once properly configured the instrument will retain the user selections in memory so thisprocedure need not be repeated unless required by changes in the application.Parameter selections and data entry are made via the front keypad. To ease configurationand operation, user entered data has been divided up into several sections referred to asmodes. Each mode contains a different type of data or may be used for specific operatingfunctions. For two pen instruments, some modes are common to both pens. These modes areas follows:
RECORDER-
RECORDING CONTROLLER-
MODE DISPLAY CODE FUNCTION DESCRIPTIONOff oFF Operation Outputs and Alarms
are OffChart may stoprotating(selectable)
Operate* oPEr Operation Limits and Alarmsare Active
Control** CtrL Control Outputs and Alarmsare Active
Test tESt Service Tests InstrumentOperation
Calibration CAL Service Calibrates, ResetsInstrument
Program Prog Configuration Configure OperatingParameters
Alarm Set* ASEt Configuration & Enter Alarm Settings Operation
Tune** tunE Configuration & Enter Tune andOperation Alarm Settings
Setpoint Selection** SPS Operation Selects Remote orLocal SetpointOperation (RemoteSetpoint Optional)
* Applies to Recorders** Applies to Recording Controllers
Operation(oPEr )
Test(tESt)
Program(Prog )
Alarm Set(ASEt )
Calibrate(CAL )
Control(CtrL )
Test(tESt)
Program(Prog )
Tune(tunE )
Setpoint Select (SPS)
Calibrate(CAL )
Standby(Stby )
OFF (oFF)

21
Manual** Stby Operation Provides for manualoperation ofproportional output
Enable EnAb Configuration Mode securitysystem, can lock outeverything except Offand Control (SeeAppendix A-1, page62, for hardwarelockout information)
Associated with each mode is a series of unique displays that are accessed via the frontkeypad.
Prior to first time operation of the instrument, the configuration procedures for the Programand Tune modes must be performed as applicable. Calibration and Test modes are not usedas part of the instrument configuration or operation. These are used for service and mainte-nance functions and are discussed in Section 5.4 & 5.5 of this manual (page 46 - 54).
Shipped Configuration/Jumper Positioning 3.2Each instrument is factory shipped ready to accept a thermocouple input on TB 4 and TB 5.All parameters in each mode are set to default values. These defaults are shown in tabularform after the description for each mode. Instrument AC power input is as specified in theinstrument model number and is shown on the ratings label. The 230 VAC option includes aswitch in the instrument for selecting either 230 VAC or115 VAC input power. If this feature isprovided, verify AC input and switch position before applying power to the instrument.
3.2.1 JUMPER POSITIONINGJumpers are used to condition the sensor inputs and to provide a security lockout feature. Alljumpers are located on the instrument Processor board. The instrument board layout andjumper locations and functions are shown in Appendix A-1 (page 62). Check the jumperpositions in the instrument and verify that they are in the proper position for the intendedapplication.
The sensor input jumpers JU4, JU5, JU6 and JU7 condition the sensor input signalsand must be used in conjunction with input type selections made in the Program mode.(page 28).
Operation Summary 3.33.3.1 MODE SELECTIONIf the instrument is either in the Off mode, the Operation mode (recorders), or the Controlmode (recording controllers), repeated pressing and releasing of the SCROLL key will causethe instrument to display the code corresponding to each mode that is enabled. To enter amode while the code is displayed, press the DOWN key. If a mode does not appear, refer tothe Enable mode section for information on how to determine if the mode is on.
Entry into any mode except the Operate, Control, Tune, Manual, or Enable modes, will causethe output(s) to turn off and any process re-transmission value output(s) to be 0 %. Entry intothe Off mode will cause process re-transmission to remain active.
* Applies to Recorders** Applies to Recording Controllers

22
Start up Procedures 3.4All configuration parameters are listed in Tables 3-1 through 3-5.
For a single pen instrument, parameters for each mode are displayed in the left display. If theinstrument being configured is a two pen model, a sequence of applicable parameters will bedisplayed in the Pen 2 display after the Pen 1 parameters have been reviewed and config-ured. After the Pen 2 parameters have been completed, parameters common to both pens willbe configured and displayed in the Pen 1 display.
The instrument is provided with a time out feature. If the instrument is in any mode (exceptwhile executing a calibration or test procedure) and no keypad activity takes place for 30seconds, the instrument will time out and exit the mode automatically. The display will becomethe code for the respective mode. If a mode code is displayed for 5 seconds with no keypadactivity, then the time out will cause the instrument to proceed to either the Control or Offmode, depending upon whether the mode entered was an operational mode (Tune, Manual,Enable) or non operational mode (Test, Program, Cal).
3.4.1 POWER UP PROCEDURE
Step 1Verify that all electrical connections have been properly made before applying power to theinstrument.
Step 2Upon power up, a brief flash on all displays (upper and, if equipped, lower) will occur to showthe instrument is "alive". Then 8XXX will be displayed (X representing digits), then XXXX,then XXXX, identifying the twelve digit model number as defined in the order matrix. Next, theEPROM part number will be indicated P-XX. After the EPROM part number, the softwarerevision level will be displayed in the format rX.XX followed by P.dn (if Pen Action on PowerUp, PAPu , in Program Mode is set to 0, pens go to "home" position on power up). During thisdisplay, the decimal point after the "P" will blink to show the mode is active. Upon successfulcompletion of this routine, CtrL, OPEr or oFF will be displayed for about three seconds. Themode displayed will be the mode that the instrument was in when the power was turned off.During this time the operator may select another mode (Tune, Manual, Enable) or non-operational mode (Test, Program, Cal).
Step 3If any error messages are displayed, refer to Section 5.6 (page 55) for a definition of theerror message and the required action.
Front Panel Operation 3.5
3.5.1 DIGITAL DISPLAY AND STATUS LEDsThe digital display provided for each pen has 4 digits and a decimal point. Each digit hasseven segments and is capable of producing numeric characters from 0-9 and certain alphacharacters. The digital display is used to provide indication of process variable as well asdisplaying codes used for configuration and operation of the instrument. The display includesthe following Status Indicator LED’s;

23
RECORDER:ALRM1 Red Rcdr - Lights when Alarm 1 is on.
Limit - Lights when Limit has been exceeded.ALRM2 Red Lights when Alarm 2 is on.C Red Lights to indicate that the process value is in terms of
degrees C (Celsius).F Red Lights to indicate that the process value is in terms of
degrees F (Fahrenheit).U Red Lights to indicate that the process value is in terms of
Engineering units.- Red Lights to indicate a negative displayed value.SP Green Indicates that the value displayed is the setpoint(Limits only)
RECORDING CONTROLLER:MAN Amber Lights when the Manual StbY mode is on.OUT1 Red Lights when Output 1 is on or mADC output selected.OUT 2 Amber Lights when Output 2 is on or mADC output selected..ALRM Red Lights when either Alarm is on. C Red Lights to indicate that the process value is in degrees C
(Celsius). F Red Lights to indicate that the process value is in degrees F
(Fahrenheit). U Red Lights to indicate that the process value is in terms of
Engineering units. SP Green Indicates that the value displayed is the setpoint. - Red Lights to indicate a negative displayed value.
Refer to Figure 1-2 (page 7) for the display features illustration.
3.5.2 KEYPAD CONTROLSThe keys on the keypad functions include:
SCROLL : Used to : 1. Display the enabled modes.2. While in a mode, used to sequence the parameter codes and values.3. Exit some Test and Calibration functions4. Work in conjunction with other keys:
a. With the UP key to display proportional output %b. With the DOWN Key;
1) On power up to alter model #2) Enter Cal/Test functions
UP: Used to: 1. Exit a mode.2. Turn a mode On in the Enable mode3. Increase a parameter numerical value4. View the setpoint for Pen 1 (Press release)5. Increase the setpoint value (Press hold)6. Work in conjunction with other keys:
a. With the SCROLL key to display proportional output %b. With the DOWN key;
1) Lamp test (Press release)2) Enter the Enable mode (Press and hold for 11
seconds)
AUTO
MAN
AUTO
MAN

24
DOWN: Used to: 1. Enter a mode2. Turn a mode Off in the Enable mode3. Decrease a parameter numerical value4. View the setpoint for Pen 2 (if provided)5. Decrease the setpoint value (Press hold)6. Step display through parameter codes in a mode7. Work in conjunction with other keys:
a. With the SCROLL key;1) On power up to alter the model number displayed2) Enter Cal/Test functions
b. With the UP key;1) Lamp test (Press release)2) Enter the Enable mode (Press and hold for
11 seconds)
RESET: Used to: Reset the limit output only when the condition that caused the(Limit Only) limit has been cleared.
AUTO/MAN : Used to: 1. In the Control mode to enter the Manual mode if proportionalThe upper key is for output(s) selectedPen 1, the lower key 2. In the Manual mode to enter the Control mode if proportionalis for Pen 2 (if provided) output(s) selected
FIGURE 3-1
LAMP TESTFrom the Off, OPEr or Control modes, all display and status LEDs can be illuminated simulta-neously by depressing the UP and DOWN keys at the same time. Any defective LEDs will notlight.
CHANGE CHART (also see Changing Charts, Section 5.2)If the UP and DOWN keys are held depressed for more than 2 seconds but less than 4seconds, the display will show CChg momentarily. The pen(s) will move to and remain at apoint above the top graduation on the chart and the chart will stop rotating to allow the chart tobe changed. The pens will remain fully upscale with the chart OFF; otherwise, the unit willcontinue to operate normally in the current mode. To restore pen(s) position and chartrotation, press the UP and DOWN keys for more than 2 seconds, but less than 4 seconds.
PEN RESYNCHRONIZATIONTo resynchronize the pen(s), depress the UP and DOWN keys for 4 seconds, the display willshow P dn momentarily, the pen(s) are driven to the "Pen Home" position below the bottomgraduation on the chart while the unit resynchronizes their position. After about 14 seconds,the pen(s) will return to their correct position. All other functions of the unit's present modecontinue to operate normally.
PEN 1
PEN 2
Recorders:NO KEYS
Limits:RESET
Recording Controllers:AUTO/MAN
SCROLLKey
UPKey
DOWNKey

25
PROGRAM MODE FLOW CHART
ONOFF
Actual Display
On/Off Display - Use arrow keysto turn on or off
Scroll Key
Numeric Display - Use arrow keys to change value
Up Arrow Key
Down Arrow
KEY
iCor
out1 *
o1uL *
o1LL *
out2 *
inPS
Prog
o2uL *
o2LL *
AL1
AL2
diSP *
dPoS
Euu
EuL
HyCo *
A
A
B
HyAo
rSP *
rSPu *
* Applies to Recording Controllers Only

26
ONOFF
Actual Display
On/Off Display - Use arrow keysto turn on or off
Scroll Key
Numeric Display - Use arrow keys to change value
Up Arrow Key
Down Arrow
KEY
SPuL
SPLL
AtFr *
Prnd
dFF
rSPL *
PFF
Pout
Pou
PoL
Cru
CrL
P1EC *
P2EC *
PAEC
C
CB
rLyA
rLyb
rLyC
D
* Applies to Recording Controllers Only

27
E
CurA
Curb
rLyd
D
CoAr
Crt
Cobr
E
Com (Optional)
PAPu
Coo
CCon
Cbs
CAd1
CAd2
* Applies to Recording Controllers Only

28
TABLE 3-1 PROGRAM MODE CONFIGURATION PROCEDUREPress the SCROLL key until Prog is displayed. Press the DOWN key to enter the Programmode. Pen 1 will be displayed in the left display. To enter the Pen 1 parameter, press theDOWN key. To enter the Pen 2 parameter, if provided, press the SCROLL key, then theDOWN key. To enter the unit parameter, press the SCROLL key with either Pen 1 or Pen 2displayed until unit is displayed, then press the DOWN key. Press the SCROLL key toadvance the display through the parameter codes and their values. Use the UP and DOWNkeys to adjust the values. After adjusting a parameter, press the SCROLL key to proceed tothe next parameter. After all selections have been made, press the UP key with a parameterin the display (not a setting) to exit the mode. For two pen instruments the parameters andvalues which are applicable to Pen 1 will appear in the left display, then the parameters andvalues which are applicable to Pen 2 will appear in the right display. Then the unit parametersand values will appear in the left display.
For illustration purposes all available Program mode parameters have been listed. Theparameters that will appear on the specific instrument will depend upon the model number(hardware configuration) of the instrument and on the parameter selections previously made.
For future reference, record the parameter selections for the application in the “Your Setting”column and on the Software Reference Sheet in Appendix E (Page 72). Use the SoftwareReference Sheet to program the instrument.
To prevent unauthorized changes to the Program mode, the mode can be disabled (turnedoff) in the Enable mode.
NOTE: All Steps and Values with an * apply to pen that is a Recording Controller.
DISPLAY AVAILABLE FACTORY YOURSTEP DESCRIPTION CODES SETTINGS SETTING SETTING1 Input Select inPS 0=J T/C degrees C 1
1=J T/C degrees F2=K T/C degrees C3=K T/C degrees F4=T T/C degrees C5=T T/C degrees F6=R T/C degrees C7=R T/C degrees F8=S T/C degrees C9=S T/C degrees F10=E T/ C degrees C11=E T/C degrees F12=B T/ C degrees C13=B T/C degrees F14=N T/ C degrees C15=N T/C degrees F16=C T/ C degrees C17=C T/C degrees F20=RTD degrees C21=RTD degrees F30=0 to 5 VDC31=1 to 5 VDC32=0 to 50 mVDC33=10 to 50 mVDC34=0 to 25 mVDC
2 Input Correction iCor -300 to 300 degrees/units 0
3* Output 1 out1 0 = None 01=On-Off- Direct2=On-Off- Reverse3=Time Proportioning- Direct4=Time Proportioning -Reverse
NOTE:Fault Detection is not functionalfor 0-5V or 0-20mA inputs.

29
5=Current Proportioning -Direct6=Current Proportioning -Reverse7=Position Proportioning (open)
4* Output 1 Percent o1uL 0 to 100 percent 100Upper Limit(o1uL and o1LL willnot be seen if out1 = 0,1,2)
5* Output 1 Percent o1LL 0 to 100 percent 0Lower Limit
6* Output 2 out2 0 = None (Position 0 Proportioning - Direct Closed)
1=On-Off- Direct2=On-Off- Reverse3=Time Proportioning- Direct4=Time Proportioning-Reverse5=Current Proportioning- Direct6=Current Proportioning -Reverse7=Position Proportioning (Reverse/Closed)
7* Output 2 Percent o2uL 0 to 100 percent 100Upper Limit (o2uL ando2LL will not been seen ifout2 = 0,1,2,7)
8* Output 2 Percent o2LL 0 to 100 percent 0Lower Limit
9 Alarm 1 AL1 0 to 6 0the Alarm Point 0 = Noneis selected in the 1=Process Alarm-DirectTune mode 2=Process Alarm-Reverse
3=Deviation Alarm-Direct *4=Deviation Alarm-Reverse *5=Deviation Band Alarm-Open within band *6=Deviation Band Alarm-Closed within band *
10 Alarm 2 AL2 Same selections as Alarm 1 0
11* Display Select diSP 1=Process value only 12=Process value/setpoint3=Deviation only4=Deviation and setpoint5=Setpoint only
12 Decimal Position dPoS 0 to 3 00=None1=One decimal place2=Two decimal places3=Three decimal placesRTD and thermocouple inputsare limited to either 0 or1 decimal positions
13 Engineering Units Euu -9999 to 9999 1000Upper Value (Euu andEuL will be seen if the peninput select = 30,31,32,33,34)
14 Engineering Units EuL -9999 to 9999 0Lower Value
DISPLAY AVAILABLE FACTORY YOURSTEP DESCRIPTION CODES SETTINGS SETTING SETTING

30
15* Hysteresis for HyCo 0 to 300 3Control Outputs Width of Hysteresis Band
(See page 66 for definition)
16 Hysteresis for HyAo 0 to 300 3Alarm Outputs Width of Hysteresis Band
(see page 66 for definition)
17* Remote Setpoint rSP 0 to 2 0If rSP is set to zero 0=Not Usedthen rSPu and rSPL 1=1 to 5 VDCare not seen 2=0 to 5 VDC
18* Remote Setpoint rSPu -9999 to 9999 1400Upper Value
19* Remote Setpoint rSPL -9999 to 9999 0Lower Value
20* Setpoint Upper Limit SPuL -9999 to 9999 1400
21* Setpoint Lower Limit SPLL -9999 to 9999 0
22* Automatic Transfer AtFr 0 to 2 00 = No Automatic Transfer1=Transfers when the processvalue goes below the setpoint2=Transfers when the processvalue goes above the setpoint
23 Process Rounding Prnd 0 to 100 0of Displayed Value 0 = No rounding
24 Display Filter Factor dFF 1 to 20 11= no filtering(number of values averaged)
25 Process Filter Factor PFF Same selection as dFF 1
26 Process Value Output Pout 0=Not selected 0Retransmission 1=Selected(If Pout =0 then Pou andPoL will not be displayed)
27 Process Output Pou -9999 to 9999 2000Upper Value
28 Process Output PoL -9999 to 9999 0Lower Value
29 Chart Range Cru -9999 to 9999 200Upper Value
30 Chart Range CrL -9999 to 9999 0Lower Value
31* Proportional P1EC 0 to 100% 0Output 1 Actionon Error Condition(If out1= 0,1,2 thenP1EC will not be displayed)
32* Proportional P2EC 0 to 100% 0
DISPLAY AVAILABLE FACTORY YOURSTEP DESCRIPTION CODES SETTINGS SETTING SETTING

31
Output 2 Actionon Error Condition(If out2 = 0,1,2,7 thenP2EC will not be displayed)
33 Pen Action on PAEC 0 or 1 1Error Condition 0 = Pen goes to 0 % of chart
1 = Pen goes to 100 % of chart
Pressing the SCROLL key with the PAEC parameter value displayed in the Pen 1 window willadvance the display of a single pen instrument to the unit parameters. Pressing the SCROLLkey with the PAEC parameter displayed in the Pen 1 window of a two pen instrument willadvance the display to be PEns in the Pen 2 window. The Pen 2 Program mode parameterselections can be made now. Pressing the SCROLL key with the PAEC parameter valuedisplayed in the Pen 2 window will cause the display to advance to the unit parametersdisplayed in the Pen 1 window.
UNIT PARAMETERS
34 Relay A Assignment rLyA 0 to 8 01=Assigned to Alarm 1-Pen 12=Assigned to Alarm 2-Pen 13=Assigned to Alarm 1-Pen 24=Assigned to Alarm 2-Pen 25=Assigned to Output 1-Pen 1*6=Assigned to Output 2-Pen 1*7=Assigned to Output 1-Pen 2*8=Assigned to Output 2-Pen 2*
35 Relay B Assignment rLyb Same selection as rLyA 0
36 Relay C Assignment rLyC Same selection as rLyA 0
37 Relay D Assignment rLyd Same selection as rLyA 0
38 Current Output A CurA 0 to 6 0Assignment 0=Not Assigned
1=Assigned to Process Value Output-Pen 12=Assigned to Process Value Output-Pen 23=Assigned to Output 1-Pen 1*4=Assigned to Output 2-Pen 1*5=Assigned to Output1-Pen 2*6=Assigned to Output 2-Pen 2*
39 Current Output B Curb Same selection as CurA 0Assignment
40 Current Output A CoAr 0 to 1 1Range 0=0-20 mA
1=4-20 mA
41 Current Output B Cobr Same selection as CoAr 1Range
42 Chart Rotation Time Crt 0.1 to 999.9 hours per 1.0rotation
43 Pen Action on Power Up PAPu 0=Pen(s) go to the "home" 0 posistion (toward chart cetner) when powered up1=Pen(s) remain in last position prior to power down
DISPLAY AVAILABLE FACTORY YOURSTEP DESCRIPTION CODES SETTINGS SETTING SETTING

32
44 Chart Operation Coo 0 to 1 0in Off Mode 0=Chart continues rotating
in the Off mode1=Chart stops rotating whilein the Off mode
COMMUNICATIONS OPTIONS PARAMETERS
45 Communication CCon 0 to 4 3Configuration 0=Off
1=Monitor Mode (Read Only)2=Normal Mode (Read and Write)3=Total Access with Limit Checking4=Total Access without Limit Checking
46 Communication Bit CbS 1 to 6 6Rate Selection 1=300Will not be seen if 2=600CCon=0 3=1200
4=24005=48006=9600
47 Communications CAd1 0 to 99 1Address-Pen 1Will not be seen ifCCon=0
48 Communications CAd2 0 to 99 2Address-Pen 2(If provided)Will not be seen ifCCon=0
DISPLAY AVAILABLE FACTORY YOURSTEP DESCRIPTION CODES SETTINGS SETTING SETTING

33
ALARM SET MODE FLOW CHART (APPLIES TO RECORDERS)
TABLE 3-3 ALARM SET MODE CONFIGURATION PROCEDUREPress and release the SCROLL key until ASEt i s displayed, then press the DOWN key. Pressthe SCROLL key to advance the display through the parameters and their values. Use the UPand DOWN keys to select (adjust) the values. After selecting a parameter, press the SCROLLkey to proceed to the next parameter. Pen 1 selections will appear in the Pen 1 window andthe Pen 2 ( if provided) selections will appear in the Pen 2 window. After all selections havebeen made, press the UP key with a parameter in the display (not a setting) to exit the mode.
DISPLAY AVAILABLE FACTORY YOURSTEP DESCRIPTION CODE SETTINGS SETTING SETTING1 Process Alarm 1 PAL1 -9999 to 9999 degrees/units 0
2 Process Alarm 2 PAL2 -9999 to 9999 degrees/units 0
If ASEt does not appear on the display refer to the Enable mode section of this manual fordirections on how to determine if the ASEt mode is enabled. If ASEt appears on the display,but pressing the DOWN key causes the display to change to oFF, this indicates that noalarm(s) have been selected in the Program mode.
ALARM OPERATIONThere are two types available per pen, Process Direct or Process Reverse. These areselected in the Program mode.Process Alarm Direct - the alarm will be ON if the process value is greater than the processalarm value selected in the Alarm Set mode.Process Alarm Reverse - the alarm will be ON if the process value is less than the processalarm value selected in the Alarm Set mode.The alarms will be active while the instrument is in the Operate mode.Alarm output chatter can be reduced by using the hysteresis (adjusted in Program mode) tocreate a deadband around the alarm point.
PAL2
PAL1
ASEt
ONOFF
Actual Display
On/Off Display - Use arrow keysto turn on or off
Scroll Key
Numeric Display - Use arrow keys to change value
Up Arrow Key
Down Arrow
Key

34
PAL1
dAL1
bAL1
PAL2
dAL2
SoP
tunE
bAL2
Pb1
Pb2
rSEt
ArSt
rAtE
Ct1
Ct2
SEnS
A
A
FoP
LIMIT SETPOINT OPERATIONThe instrument must be in the Operate mode to allow setpoint value to be displayed andadjusted. In the Operate mode, to view the setpoint, press and release the UP or DOWN key.The displayed value is the setpoint. To change the setpoint value, press and hold theappropriate key. Press and hold the UP key to increase the setpoint or press and hold theDOWN key to decrease the setpoint. The setpoint will change slowly at first then faster as thekey is held.To reset the limit output, press the RESET key after the limit condition has been cleared.
NOTE: The setpoint cannot be changed if the Limit setpoint has been exceeded.
TUNE MODE FLOW CHART (APPLIES TO RECORDING CONTROLLERS)

35
TABLE 3-2 TUNE MODE CONFIGURATION PROCEDURE (APPLIES TO RECORDING CONTROLLERS)The Tune mode allows the entry, review or altering of the process control Tune adjustmentsand alarm setting(s).
To enter the Tune mode, press and release the SCROLL key until tunE is displayed, thenpress the DOWN key. Press the SCROLL key to advance the display through the parametersand their values. Use the UP and DOWN keys to select (adjust) the values. Each time theDOWN key is pressed while a parameter code is being displayed, such as SoP, the nextparameter code in the sequence will be displayed (PAL1 ).
After selecting a parameter, press the SCROLL key to proceed to the next parameter. Pen 1selections will appear in the Pen 1 window and the Pen 2 ( if provided) selections will appearin the Pen 2 window after the Pen 1 parameters have been displayed. After all selectionshave been made, press the UP key with a parameter in the display (not a setting) to exit themode.
For illustration purposes, all available Tune mode parameters have been listed. Theparameters that will appear on the specfic instrument will depend upon the parameterselections previously made in the Program mode.
For future reference, record the parameter selections for the application in the "Your Setting"column and on the Software Reference Sheet in Appendix E (page 72). Use the SoftwareReference Sheet to program the instrument.
To prevent unauthorized changes to the Tune mode, the mode can be disabled (turned off) inthe Enable mode.
The Tune mode is adjusted on-line. The instrument will react to changes as they aremade.
DISPLAY AVAILABLE FACTORY YOURSTEP DESCRIPTION CODES SETTINGS SETTING SETTING1 Second Output Position SoP -1000 to 1000 units 0
(Will not be seen if out2 =0,7)
2 Process Alarm 1 PAL1 -9999 to 9999 units 0(The Alarm setting seenwill depend upon the Alarmselected in the Program mode)
3 Deviation Alarm 1 dAL1 -3000 to 3000 units 0
4 Deviation Band Alarm 1 bAL1 1 to 3000 units 1
5 Process Alarm 2 PAL2 -9999 to 9999 units 0
6 Deviation Alarm 2 dAL2 -3000 to 3000 units 0
7 Deviation Band Alarm 2 bAL2 1 to 3000 units 1
8 Proportional Band Pb1 1 to 3000 units 100Output 1 (Will only be seenif out1 =3,4,5,6,7)
9 Proportional Band Pb2 1 to 3000 units 100Output 2 (Will only beseen if out2=3,4,5,6)
10 Manual Reset rSEt -1500 to 1500 units 0(Will only be seen ifPb1/Pb2 were shown)
36
11 Automatic Reset ArSt 0.0 to 100.0 repeats 0.0Integration per minute(Will be seen if Pb1 orPb2 was shown)
12 Rate Derivative rAtE 0.0 to 10.0 minutes 0.0(Wll be seen ifPb1 or Pb2 was seen)
13 Cycle Time Output 1 Ct1 1 to 240 seconds 30(Will be seen if out1 =3,4,7)
14 Cycle Time Output 2 Ct2 1 to 240 seconds 30(Will be seen if out2 =3,4)
15 Position Proportioning SEnS 0.0 to 50.0 percent 1.0Sensitivity (Will be seenif out1 =7 and/or out2=0,7)
16 First Output Position FoP -1000 to 1000 units 0
DISPLAY AVAILABLE FACTORY YOURSTEP DESCRIPTION CODES SETTINGS SETTING SETTING
37
TABLE 3-3 ENABLE MODE CONFIGURATION PROCEDURETo enter the Enable mode, press the UP and DOWN keys while in OPEr, CtrL, or oFFmodes. All the display lamps will light. After 2 seconds, the display will show Cchg and thepen(s) will move to and remain at a point above the top graduation on the chart. Continue topress the UP and DOWN keys, after 2 additional seconds, the display will show P dn and thePen(s) are driven below the bottom graduation on the chart. After 6 more seconds, thedisplay will show EnAb . Release the keys and the display will change to EtSt . Press andrelease the DOWN key and each mode to be enabled/disabled will be displayed. With theenable mode prompt for the desired mode displayed press the SCROLL key to verify that thedisplayed mode is either on (enabled) or oFF (disabled). Press the DOWN key to turn off themode, press the UP key to turn on the mode or press the SCROLL key to advance the displayto the next enable mode prompt. Use the "Your Setting" column in the table to record yoursettings.
A hardware jumper located on the Processor Board (See Appendix A-1, Page 62) can beused to lock/unlock the Enable mode. When the jumper is moved to the locked position, entryinto the Enable mode is not possible until the jumper is moved to the unlocked position.
Test Mode EtSt on or oFF oFFCalibration Mode ECAL on or oFF oFFProgram Mode EPro on or oFF onAlarm Set Mode* EASt on or oFF onTune Mode** Etun on or oFF onManual (Stby) Mode** ESby on or oFF onSetpoint Select mode** ESPS on or oFF on(Optional)Setpoint Change*** ESPC on or oFF on
* RECORDERS** RECORDING CONTROLLERS
*** LIMITS OR RECORDING CONTROLLERS
DISPLAY AVAILABLE FACTORY YOURDESCRIPTION CODES SETTINGS SETTING SETTING

38
ENABLE MODE FLOW CHART
RECORDERS RECORDING CONTROLLERS
ONOFF
Actual Display
On/Off Display - Use arrow keysto turn on or off
Scroll Key
Numeric Display - Use arrow keys to change value
Up Arrow Key
Down Arrow
Key
ECAL
EPro
Etun
ESbY
ESPS
EtSt
EnAb
ESPC
ONOFF
ONOFF
ONOFF
ONOFF
ONOFF
ONOFF
ONOFF
ECAL
EPro
EASt
EtSt
EnAb
ONOFF
ONOFF
ONOFF
ONOFF
Press UP and DOWNARROWS for 10 secondsto enter this loop.
ESPC
ONOFF

39
Operation 4.1
4.1.1 OFF MODEIn the Off mode, the instrument control and alarm function (s) are turned off. ProcessRetransmission signal(s) remain active. The chart rotation can be selected in the Programmode to stop or continue to rotate when the instrument is in the Off mode. The pen(s) willremain active. The Off mode can be entered by pressing and releasing the SCROLL key untilthe display reads oFF, then pressing the DOWN key. The display will read oFF and thencurrent process variable at two second intervals. Entering the Off mode of a dual peninstrument will cause both pens to enter the Off mode. The second pen display will be blankas the left display reads oFF and displays the process value for the second pen at the sametime as the left display.
4.1.2 CONTROL MODE (APPLIES TO RECORDING CONTROLLERS)In the Control mode, the instrument control function(s) and alarm(s) are actively responding tothe process variable as selected in the Program and Tune modes and the chart will berotating at the rate selected. The Control mode allows setpoint changes form either localsetpoint (standard) adjustment by an operator at the front keypad or from remote setpointsource (optional). Other operations in the Control mode include a lamp test and proportionaloutput display.
4.1.2.1 LOCAL SETPOINT OPERATIONSingle Pen Instruments: The instrument must be in the Control mode to allow setpoint valueto be displayed and adjusted. In the Control mode, to view the setpoint, press and release theUP and DOWN key. The green LED under the SP label will light to indicate that the displayedvalue is the setpoint. To change the setpoint value, press and hold the appropriate key.Press and hold the UP key to increase the setpoint or press and hold the DOWN key todecrease the setpoint. The setpoint will change slowly at first, then faster as the key is held.If the setpoint will not increase, check the Program mode to see that you are not trying toincrease the setpoint above the setpoint upper limit SPuL . If the setpoint will not decrease,check the Program mode to see that you are not trying to decrease the setpoint below thesetpoint lower limit SPLL . If the setpoint will not increase or decrease, check that the SetpointChange mode is On in the Enable mode.
Dual Pen Instruments: The setpoint of each instrument can be reviewed separately. Pen 1:To review and change the local setpoint for Pen 1, press the UP key. The green LED in theupper display will light indicating that the setpoint value is displayed. The setpoint can now beraised by pressing and holding the UP key or decreasing by pressing the DOWN key. Pen 2:The setpoint for Pen 2 is viewed and changed in the same manner, except the DOWN keymust be pressed to access the Pen 2 setpoint. The setpoint will change slowly at first, thenfaster as the key is held. If the setpoint will not increase, check the Program mode to see thatyou are not trying increase the setpoint above the setpoint upper limit SPuL . If the setpointwill not decrease, check the Program mode to see that you are not trying to decrease thesetpoint below the setpoint lower limit SPLL . If the setpoint will not increase or decrease,check that the Setpoint change mode is On in the Enable mode.
4.1.2.2 REMOTE SETPOINT OPERATIONSingle Pen Instruments: If the instrument is specified and provided with Remote Setpointcapability (auxiliary input of 0-5VDC or 1-5VDC), and the Remote Setpoint has been properlyconfigured in the Program mode, the Setpoint Select mode will be accessible, if enabled.Press and release the SCROLL key until SPS appears in the display, then press the DOWNkey. The display will show Loc if the local (keypad entered) setpoint is being used or rSP ifthe remote setpoint is in use. Press the SCROLL key to select the setpoint mode that will beused by the instrument. Press the UP key to exit the Setpoint Select mode.
40
Dual Pen Instruments: If the instrument is specified and provided with the Remote Setpointcapability for either or both pens and the Remote Setpoint has been properly configured in theProgram mode for either or both pens, the Setpoint Select mode will be accessible, if enabled.Press and release the SCROLL keys until SPS appears in the display, then press the DOWNkey. The left display will light and the upper display will blank if pen 1 is selected for a remotesetpoint. If only pen 2 is selected as a remote setpoint, then the left display will blank and theright display will light. If both pens are selected for remote setpoint, the right display isaccessed by pressing the DOWN key while the left display shows the setpoint mode selectedfor that pen. The display(s) will show Loc if the local (keypad entered) setpoint is being usedor rSP if the remote setpoint is in use. Press the SCROLL key to select the setpoint mode thatwill be used by the instrument. Press the UP key to exit the Setpoint Select mode. If aproblem develops with the remote setpoint signal for either pen, the left display will show rSEr ,the remote setpoint error code.
Digital Communications: The setpoint can be adjusted from a supervisory computer system.Dual pen instruments are capable of having independent setpoint adjustments for each pen.
SETPOINT SELECT FLOW CHART (APPLIES TO RECORDING CONTROLLERS)
4.1.2.3 ON-OFF CONTROLOn-Off control can only be implemented on controllers provided with SPST relay or SSR driveroutput's. On-Off operation can be assigned to either or both output 1 and 2 for each pen. TheOn-Off control can be selected as direct or reverse acting. Direct action is typically used incooling applications. The output device will turn On when the process value is greater than thesetpoint. Reverse action is typically a heating application. The output device will turn On if theprocess value is below the setpoint. A hysteresis adjustment is provided for On-Off outputs oneach pen. This adjustment is in terms of degrees/engineering units and defines the width ofthe hysteresis band about the setpoint. This parameter may also be referred to as adeadband. Relay chatter can be eliminated by proper adjustment of this parameter. Whenoperating in On-Off control, the control algorithm will turn the output On or Off depending uponthe setpoint, the relative position of the process value, and the hysteresis adjustment. Therespective OUT1 or OUT2 indicator for the respective pen will illuminate to indicate that theoutput device is On.
rSP
LOC
SPS
ONOFF
Actual Display
On/Off Display - Use arrow keysto turn on or off
Scroll Key
Numeric Display - Use arrow keys to change value
Up Arrow Key
Down Arrow
KEY

41
4.1.2.4 TIME PROPORTIONING CONTROLTime Proportioning Control can be implemented on controllers provided with SPST relay orSSR driver output(s). Time proportioning can be programed for output 1 and/or 2 for eachpen. Time proportioning control is accomplished by cycling the output On and Off when theprocess value is within the proportional bandwidth selected at a prescribed time period. Thetime period is selected in the Tune mode by adjusting Ct1 and/or Ct2. The On time is apercentage of the Cycle Time.
Example: Calculated output % = 40%; Cycle Time adjustment = 20 secondsOutput On Time = .4 x 20 = 8 secondsOutput Off Time = .6 x 20 = 12 seconds
4.1.2.5 CURRENT PROPORTIONING CONTROLCurrent Proportioning control provides a proportional current output in response to processvalue and setpoint. The current output can be selected for direct or reverse operation. Directcurrent output control is typically used for cooling applications. The current output willincrease as the process value increases within the proportional bandwidth selected. Thereverse current output control is typically used in heating applications. The current outputwill decrease as the process value increases within the proportional bandwidth selected.
The instrument can be programmed to provide 0 to 20mADC or 4-20mADC current output(s).The output selected is dependent upon the final control element being used in the process.The output 1 and/or output 2 LED will be lighted whenever the Current Proportional outputsare selected.
4.1.2.6 POSITION PROPORTIONING CONTROLPosition Proportioning control can be implemented on those controllers provided with twoSPST relay outputs or two SSR Driver outputs and Slidewire Feedback option for therespective pen. This control implementation can be performed on each pen.
Position proportioning control permits the use of PID control where the final control element isa modulating device such as a motorized valve. In this form, each of the two required relaysor SSR Drivers will be used to control the valve. One output will be used to open the valve,the other is used to close the valve. The slidewire feedback is used to provide a signalrelative to the valve armature position to the instrument.
As with the other proportioning control forms, the process input, tuning parameters and thesetpoint are used by the control algorithm to calculate the output % required to correct for thedeviation between setpoint and process.
Proportional Output 1 Action P1EC on error condition does not apply to position proportioningcontrol. In an error condition, the unit goes only to 0% output (fully closed).
With Position Proportioning control, it may be necessary to adjust the Sensitivity Tune SEnSmode parameter to reduce or eliminate oscillations of the motor around setpoint. If oscillationoccurs, increase the SEnS value until the motor stops oscillating. If the differential betweenthe Open and Closed rotation is too large, then decrease the SEnS value. Also, for properPosition Proportioning operation, it is necessary to specify the actuation time of the valve ordamper from full open to full closed. If the motor has a stroke duration of 60 seconds, changethe value in the Cycle Time parameter Ct1 to 60. This ensures that controller will move themotor for the proper amount of time when making adjustments.

42
4.1.2.7 PROPORTIONAL OUTPUT PERCENTAGE DISPLAYWhile in the Control mode, pressing the UP and the SCROLL keys at the same time willcause the display to sequence through a series of display codes and values:
Po1 Percent Output (if applicable) Output 1% valuePo2 Percent Output (if applicable) Output 2% valueProc Process Value Actual Process Value
Each code and output value will be displayed only if the corresponding proportional output ispresent. Each code or value will be displayed for 1 second. This sequence of displays willcontinue until the SCROLL key is pressed, which will then return the display to the normalmode. Displays will sequenced for both Pen 1 and 2 as applicable on dual pen instruments.
4.1.3 MANUAL MODE FOR PROPORTIONAL OUTPUTS (APPLIES TO RECORDING CONTROLLERS)Manual adjustment of the proportional output(s) can be used to test the operation of theoutput(s), while tuning to establish basic process control, or to provide control of the propor-tional output(s) during the occurrence of certain error conditions.
Note: The proportional outputs do not change automatically in response to changes inthe process while in the Manual mode. Be sure to pay close attention to the process toavoid damage.
To enter the Manual mode, pres and release the AUTO/MAN key for the specific pen. If theStandby mode is On in the Enable mode and a control output is selected for proportionalcontrol, the instrument will enter the Manual mode. The Manual mode status LED will light forthat pen to indicate that the Manual mode is in use. Shifting from the Control to the Manualmode is bumpless. The proportional output(s) will stay at the last value(s) calculated by thecontrol algorithm. Po1 will appear on the display if output 1 is a proportional output or Po2 ifoutput 1 is not a proportional control.
In order to vary a proportional output value, press and release the SCROLL key until thedisplay code for the output is displayed, Po1 or Po2. Press the SCROLL key again to see thepercentage of output value. Press the UP key to increase the output percentage value. Pressthe DOWN key to decrease the output percentage value.
If no keys are pressed, the display will sequence through the following displays:
Po1 if output 1 is 3, 4, 5, 6, 7 then the output 1 percentage of output value
Po2 if output 2 is 3, 4, 5, 6, 7 then the output 2 percentage of output value
Proc will be displayed then current process value for that pen
In order to change a proportional value once the cyclic display begins, press and release theUP or DOWN key then press the SCROLL key until the display code for the output displayedis Po1 or Po2. Press the SCROLL key again to see the percentage of output value. Pressthe UP key to increase the output percentage value. Press the DOWN key to decrease theoutput percentage value.
To return to the Control mode of operation from the Manual mode, press the specified AUTO/Man key. If the Automatic Transfer feature is selected in the Program mode, the instrumentwill switch from Manual mode to the Control mode when process value reaches the setpointvalue.

43
STANDBY MODE FLOW CHART (APPLIES TO RECORDING CONTROLLERS)
Alarm Operation 4.2There are two alarms available per pen. The type of alarm is selected in the Program modeas follows:
1. Process Alarm Direct - the alarm will be On if the process value is greater than the process value selected.
2. Process Alarm Reverse - the alarm will be On if the process value is less than the process value selected.
3. Deviation Alarm Direct* - the alarm will be On if the process value is greater than the setpoint plus the deviation value selected.
4. Deviation Alarm Reverse* - the alarm will be On if the process value is less than the setpoint plus the deviation value selected.
5. Deviation Band Alarm Open Within* - the alarm will be On if the process value is greater than one half the deviation band alarm values selected above or below the setpoint.
6. Deviation Band Alarm Close Within* - the alarm will be On if the process value is less than one half the deviation band value selected above or below the setpoint.
* Applies to Recording Controllers
The alarms will be active while the instrument is in the Operation mode (Recorder) or Controlmode (Recording Controller). Relay and solid state relay drivers can be assigned to provideoutput capability for the alarm functions.
The alarm value (Process, deviation, or bandwidth) is selected in the Alarm Set mode(Recorder) or Tune mode (Recording Controller).
Alarm outputs chatter can be reduced by using the hysteresis for the alarm output adjustablein the Program mode to create a deadband around the alarm point.
Po2
Po1
Stby
ONOFF
Actual Display
On/Off Display - Use arrow keysto turn on or off
Scroll Key
Numeric Display - Use arrow keys to change value
Up Arrow Key
Down Arrow
KEY

44
Tune Mode Operation 4.3 (Applies to Recording Controllers)Proportional output controllers may require the adjustment (tuning) of the PID and otherrelated parameters. This provides a means for the instrument's control algorithm to beadjusted to meet specific application requirements.
4.3.1 SYSTEMATIC TUNING METHOD1. Changes in tuning parameters should be made one at a time.
2. After making any changes in tuning parameters, a disturbance should be introduced into the process so that the process reaction may be observed. This process reaction, or recovery, will tell whether the tuning parameters provide the desired control. It is usually easiest to make a step change in setpoint to introduce this disturbance.
3. The change in setpoint or disturbance, referenced above should be large enough to cause an observable deviation of process from setpoint. However, this change should not be so large that it will cause the controller output to proceed to either extreme limit.
4. Controller tuning for optimal control is not hard and fast, BE PATIENT: The process will take a certain amount of time to react to the setpoint changes during tuning. The amount of time depends upon the specific process, however, a period of 8 to 12 minutes should be allowed between changes. The important point to remember is to allow the process to react completely, do not rush through tuning of the controller. If the complete process reaction is not observed, optimum control may never be achieved.
5. Time Proportioning control output(s) require the cycle time to be adjusted for the application. Short cycle times typically result in the most accurate process control, but will cause the quickest "wear out" of any mechanical components.
6. Leave all other tuning parameters (except for the alarm settings) at the factory default settings. Obtain the best possible process reaction by adjusting the Proportional Band width parameter. The setting that achieves the best response for the process should be left in the controller programming, and should be noted on the Software Reference Sheet in Appendix E (page 72).
7. If there are to be no setpoint or load changes in the process, the Proportional Band adjustment may be all that is necessary for proper control. If an offset still exists (the process does not settle out at setpoint for the best possible proportional band adjustment), Manual Reset may be added to eliminate this offset.
8. Auto Reset may be added to eliminate process offsets with respect to setpoint. Increase Auto Reset from 0 to 0.2 increments. Start with a small amount. Increase this increment if there is no apparent reaction. Remember to allow the process 8 to 12 minutes to react to any changes.
9. If necessary, Rate may be added. Rate is a dynamic tuning parameter. Rate may be required to compensate for load changes or to inhibit process oscillations that occur when a large amount of auto reset (4 or 5 repeats/minute) is being used.
10. Controller tuning is not hard and fast. It may be necessary to adjust the tuning
45
parameters over a period of time to obtain optimal control of the process.
4.3.2 ZIEGLER NICHOLS TUNING METHODThis procedure has been determined empirically to yield ideal 1/4 amptitude decay tuningparameters that are determined by watching the system in a sustained oscillation (curve C,page 44, the ultimate proportional band and ultimate time period) and then using these valuesfrom this sustained oscillation to calculate ideal parameters.
To aid in determining the process oscillation, the instrument configuration parameters can beadjusted. By reducing the chart upper value Cru and increasing the chart lower value CrL ,the resolution of the oscillation can e better observed. Also the chart rotation time Crt can bereduced to improve the observation of the oscillation cycle time.
Determining Ultimate Proportional Band and Ultimate Time Period
1. Set Manual Reset rSet to 0.0, set ArSt to 0.0 and set rAtE to 0.0.
2. Enter the Control mode of operation, observe the process reaction.
3. Set the Proportional Band (PB) at 100 and upset the process and observe the response. One easy method for imposing the upset is to move the setpoint for a few seconds and then return it to its original value.
4. Achieve a response curve similar to the sustained oscillation (curve C), this is the Ultimate Proportional Band (UPB) and Ultimate Time Period (UTP).
a) If the response curve from step 3 does not damp out, as in curve A from thedrawing, the PB is too low. The PB should be increased and step 3 repeated.
b) If the response in step 3 damps out, the PB is too high. The PB should bedecreased and step 3 repeated.
These values obtained for Ultimate Proportional Band (UPB) and Ultimate Time Period (UTP)are used to calculate ideal P, PI, PD, PID tuning parameters using the following Ziegler-Nichols equations:
Proportional only control (P) P (Pb) = 2 x UPB (degrees or units)
Proportional plus automatic reset (PI) P (Pb) = 2.2 x UPB (degrees or units)I (ArSt ) = 1.2 / UTP (repeats per minute)
Proportional-plus-derivative (or rate) (PD) P (Pb) = 1.7 x UPB (degrees or units)D (rAtE ) = UTP / 8 (minutes)
Proportional-plus automatic reset-plusderivative (PID) P (Pb) = 1.7 x UPB (degrees or units)
I (ArSt ) = 2 / UTP (repeats per minute)D (rAtE ) = UTP / 8 (minutes)
If an over damped response is desired, multiply the proportional band by two.
(Referenced illustration on next page)

46
Curve A : unstableCurve B : stableCurve C : continuously cycling, ultimate PB and period
A
C
B
Period

47
Service 5.1This section contains information regarding calibration and test procedures that can beperformed in the field as well as items concerning the normal maintenance of the instrument.
Changing Charts 5.2Chart changes may be done while in the normal operating mode.
CAUTION: The chart flange assembly pin is sharp to perforate the chart. Use cautionwhile installing the chart to avoid coming into contact with the pin.
1. Depress and hold the UP and DOWN keys for between 2 and 3 seconds. Immediatelyafter depressing the keys, the unit will do a Lamp Test with all LED segments and indicatorslighted on the upper (and lower) display.
2. After 2-3 seconds, the display will show Cchg , the pen(s) will move to and remain at apoint above the top graduation on the chart and the chart will stop rotating. All other functionsremain active (Control, Display, etc).
3. Open the instrument door, snap up the chart hold down lever on the chart flange assembly,gently lift the pen(s) and remove old chart.
4. With the pen(s) held up, install new chart. Be sure to line up the chart time line so that thecurrent time is aligned with the time setting mark on the chart platen.
5. Snap down chart hold down lever and close the instrument door.
6. Depress and hold the UP and DOWN keys for between 2 and 3 seconds. Immediatelyafter depressing the keys, the unit will do a Lamp Test with all LED segments and indicatorslighted on the upper (and lower) display.
7. After 2-3 seconds, the display will show Cchg momentarily, then the pen(s) position andchart rotation will be restored.
Changing Pens 5.3Open the instrument door. Refer to Figure 5-1 for pen changing procedure. This procedure isalso provided on a label on the instrument chart platen. Be sure to replace the pen cartridgewith the same type (color) that was removed. Be careful not to bend the pen arm whilechanging the pen.
FIGURE 5-1Changing Pens
For five replacementpens order:Green #60500401Red #60500402
To install pen, slide pen intoholder (1) and push down (2)as shown by arrows
To remove pen forreplacement, pull up at backend (1) and push out.
12
1
2

48
Calibration 5.4CAUTION: Do not attempt any calibrations without the proper test equipment that meets orexceeds the specifications listed.Press and release the SCROLL key until CAL appears on the display , then press the DOWNkey to enter the mode. The display will change to CAL1 . Press the SCROLL key to advancethe display to the other calibration modes available. For two pen units, CAL5 will only needto be required on TB4 to calibrate Pen 1 and Pen 2 inputs. Both TB 4 and TB 5 inputs mustbe calibrated for thermocouple inputs. Table 5-1, page 47, provides a listing of field calibra-tion routines. All instruments are calibrated prior to shipment from factory.
CALIBRATION FLOW CHART
CAL2
CAL3
CAL4
CAL5
CAL6
CAL1
CAL
CAL7
Prog
CAL9
ONOFF
Actual Display
On/Off Display - Use arrow keysto turn on or off
Scroll Key
Numeric Display - Use arrow keys to change value
Up Arrow Key
Down Arrow
KEY

49
TABLE 5-1 CALIBRATION PROCEDURES
CalibrationProcedure DescriptionCAL 1 Reinitialization of program and tuning values.
CAL 2 Main calibration necessary for all input types.
CAL 3 Cold Junction Compensation calibration used to correct for componentvariation in the CJC circuit. Necessary for thermocouple inputs.
CAL 4 Cold Junction Utility, displays temperature the cold junction compensatoris sensing. No adjustment is made with this procedure.
CAL 5 RTD input calibration. Necessary to be performed on both terminal boards.
CAL 6 Cold Junction Compensation on/off. Used for validating thermocoupleinputs with a millivolt source. (Non temperature compensating)
CAL 7 Factory use only.
CAL 9 Pen position calibration used to calibrate pens to chart.
5.4.1 CAL 1 PARAMETER RE-INITIALIZATIONThis routine is used to clear all information in the Program and Tune modes. All parameterswill be reset to default values. Before performing this procedure, make sure that theProgram and Tune values are written down so that they can be re-entered after Calibra-tion 1 is completed. No test equipment required.
With CAL 1 displayed, while pressing the DOWN key, press the SCROLL key. The displaywill momentarily blank while the initialization is in progress. Upon completion of the routine, aPen Home function is automatically performed; P.dn is displayed during this period, with thedecimal point flashing to indicate this mode. Once the pen(s) reach Pen Home, CAL1 will bedisplayed.
5.4.2 CAL 2 MAIN CALIBRATIONThis routine determines and saves calibration values which correct for component variationsrelating to the basic measuring function of the unit. A 50.00 mVDC ± .01mVDC source isrequired for testing. Make sure that the Processor board jumpers JU4 and JU5 are in thenon-volt positions. See Appendix A-1 (page 62) for proper positioning. After completingCAL2, be sure to re-position these jumpers to the appropriate position for your input.
With CAL 2 displayed, press and hold the DOWN key, then press the SCROLL key. Releasethe keys when the instrument displays hLd1 . Short the input terminals or apply 0.00, ±.01mVDC to TB 4 terminals 1 and 2. Press the DOWN key and dELy will appear for 10 sec-onds, then SCAn will appear for 10 seconds. A calibration reference number will then appear,this should be 0 ± 50. If this number falls outside these limits, press the SCROLL key andCAL 2 will be displayed. Perform the calibration again. Repeat the calibration until the numberfalls within the tolerance limits. If the number remains outside the limits, check the connec-tions and try the calibration again. If the number does not approach the tolerance limitscontact the nearest representative or the factory for assistance. With an acceptable referencenumber on the display, remove the short and connect a 50.00, ±.01 mVDC source to the TB4 terminals 1 and 2. Be sure to observe the proper polarity when connecting the source.Terminal 1 is positive and terminal 2 is negative. Press the DOWN key, deLy will be dis-played for 10 seconds and then SCAn for 10 seconds. When the calibration is complete CAL2 will reappear.(Continued on next page)
50
Error recovery:See section 5.6 (page 55) for details. Ensure that the millivolt source is connected correctlyand functioning properly.
The calibration can be exited when hLd1 or the calibration reference number is displayed bypressing the SCROLL key.
CAL2 QUICK CALIBRATIONThis routine will allow the operator to execute a rough calibration on their unit via the keypadwith no other equipment or disturbance to established wiring. It is intended to provide a partialrecovery from a calibration corruption where the necessary equipment indicated may not beavailable. It should be noted that this is not intended as a substitution to the main calibrationprocedure described earlier and may considerable deter from the accuracy of the instrument.
With CAL2 displayed, press and hold the DOWN ARROW key, then press the SCROLL key.Release both keys and the instrument will display hLd1 . Press and hold the UP ARROW key,then press the SCROLL key. The display will momentarily blank and then CAL1 will bedisplayed. Release both keys and depress the UP ARROW key. CAL will be displayed.
5.4.3 CAL 3 COLD JUNCTION COMPENSATIONThis routine determines and saves calibration values which correct for component variationsrelating to the cold junction compensation. This calibration must be preceded by CAL 2 themain calibration, to properly calibrate the instrument. These two calibrations are all that isneeded for proper operation with thermocouple inputs
Test equipment: 1-type J thermocouple1-mercury thermometer +/-.25 degrees F for equivalentAllow 30 minutes of warm up time for the instrument with the thermocoupleconnected before proceeding with calibration.
Operation:With CAL 3 displayed press and hold the DOWN key, then press the SCROLL key . Theinstrument will display hoLd . Release both keys. Press the DOWN key , deLy will be dis-played for up to 10 seconds, then SCAn for 10 seconds. If SCAn remains in the display formuch longer than ten seconds, refer to the note below. The instrument will compute anddisplay the cold junction temperature to the nearest tenth of a degree C. Compare the displayreading with thermometer and use the UP and DOWN keys to correct the reading. To exit,press the SCROLL key and CAL 3 will be displayed again.
NOTE: If the display stays in SCAn for more than 10 seconds press the SCROLL key.CAL3 should be displayed. With CAL3 displayed, while pressing the DOWN key, press theSCROLL key. The instrument will display hoLd. Press the UP key. The instrument willbegin the calibration procedure with a default value and proceed to dELy as describedabove.
Error recovery:See section 5.6 (page 55) for details on specific errors. The calibration can be exited if hoLdor the CJC temperature is displayed by pressing the SCROLL Key.
5.4.4 CAL 4 COLD JUNCTION UTILITYThis procedure displays the temperature the cold junction compensator is sensing. No testequipment is required.
With CAL 4 displayed, press and hold the DOWN key, then press the SCROLL key . Releaseboth keys and SCAn will be displayed for 10 seconds while the instrument senses the CJCtemperature. The result will then be displayed to a tenth of a degree C. The input terminalsmust be shorted. CAL 3 must first be performed. The displayed temperature is not theambient temperature. It is the temperature of the CJC . To exit, press the SCROLL keyand CAL 4 will be displayed.
51
5.4.5 CAL 5 RTD INPUTThis procedure determines and saves calibration values relating to RTD inputs. This calibra-tion must be preceded by CAL 2 to properly calibrate the instrument. Both RTD inputs mustbe calibrated and both inputs must have valid inputs during the calibration. Decade boxeswith .01% resolution or equivalent are required. Make sure that the Processor boardjumpers JU4, JU6 and JU5, JU7 are in the proper positions. See Appendix A-1 (page62).
With CAL 5 displayed, press and hold the DOWN key and then press the SCROLL key. Thedisplay will now be PEn1 to indicate that the instrument is set to calibrate the RTD input onTB 4 . Press the DOWN key to change the display to PEn2 to calibrate the RTD input at TB5. Choose the input TB to be calibrated and press the SCROLL key, hLd1 will then bedisplayed. Connect the decade box at 100 ohm setting across the input terminals 1 and 2 anda jumper wire from terminal 2 to 3. Press the DOWN key and dELy will be displayed for 10seconds, then SCAn for ten seconds. When hLd2 is displayed, change the decade boxsetting to 277 ohms to the input terminals (do not disturb the wiring) and press the DOWNkey. The display will change to dELy for 10 seconds, followed by SCAn for ten moreseconds. CAL 5 will be displayed after the calibration is completed.
Error recovery:See section 5.6 (page 55) for details on specific errors.
The calibration can be exited when the instrument displays hLd1 by pressing the SCROLLkey.
5.4.6 CAL 6 COLD JUNCTION UTILITYThis routine provides selection of operating modes for the cold junction compensation usedfor thermocouple inputs.
With CAL 6 displayed, press and hold the DOWN key, then press the SCROLL key. Theinstrument will display C6 and the number of the mode in effect. Press the UP or DOWN keyto change the mode selection, indicated by the number to the right of the C6. Pressing theSCROLL key will exit the calibration with the last mode number displayed in effect.
The selected mode will remain in effect if power is interrupted. To return the instrument tonormal operation, CAL 6 must be exited, with mode zero selected, or CAL 1 must be exe-cuted to initialize all parameters.
Mode 0: Normal operating mode.
Mode 1: Cold Junction Compensation temperature will be internally fixed at 0 degrees C bythe software to facilitate linearization testing when using an uncompensated millivolt source tosimulate the thermocouple millivolt input signal .

52
5.4.7 CAL 9 PEN CALIBRATIONThis procedure is used to calibrate the pen(s). No special test equipment required.
Valid inputs must be connected to TB 4 and TB 5 before performing this calibration. With CAL9 displayed, push and hold the DOWN key, then press the SCROLL key . Release both keysand the display will indicate PEn1. For 2 Pen instruments, press the DOWN key to toggle thedisplay between pen 1 and pen 2. With desired pen displayed, press the SCROLL key.
P.dn will be displayed while the selected pen is moved to it's "HOME" position (toward thechart hub) with the decimal point flashing to indicate this mode. Once "Pen Home" is found,the pen will move to the inner ring and PEnL will be displayed. At this point, one of twoadjustments may be made; Pen Arc or Zero and Span.
Pen Arc - To adjust the pen arc, the UP and DOWN keys are pressed simultaneously to drawan arc for visual reference. The display will show P uP while the selected pen moved upscaleto the top stop position. The pen then moves back downscale to nominally place the pen atthe outer ring (100%) of the chart. The display will now display ArC . The pen arm may beloosened and the length adjusted to a position and angle to place the pen tip near the outerring then re-tighten the pen arm. Press any key and the pen will drive to "HOME", then backto the inner ring (0%) and PEnL will be displayed.
Zero and Span - To begin a pen zero, with PEnL in the display, the UP or DOWN key may bepressed to move the pen to the low end of the chart span (0%). When adjusted, press theSCROLL key and P uP is displayed while the pen is moved to the outer edge (100%) of thechart, then PEnh is displayed. To adjust pen span, use the UP and DOWN keys to adjust thepen for the high end (100%) of the chart. When adjusted, press the SCROLL key and P dnwill be displayed for about 5 seconds while the pen is moved to the 50% point on the chart,then PEn1 is displayed. Calibration may now be performed again to verify the accuracy, orpress the UP key twice to exit back to the CAL mode.
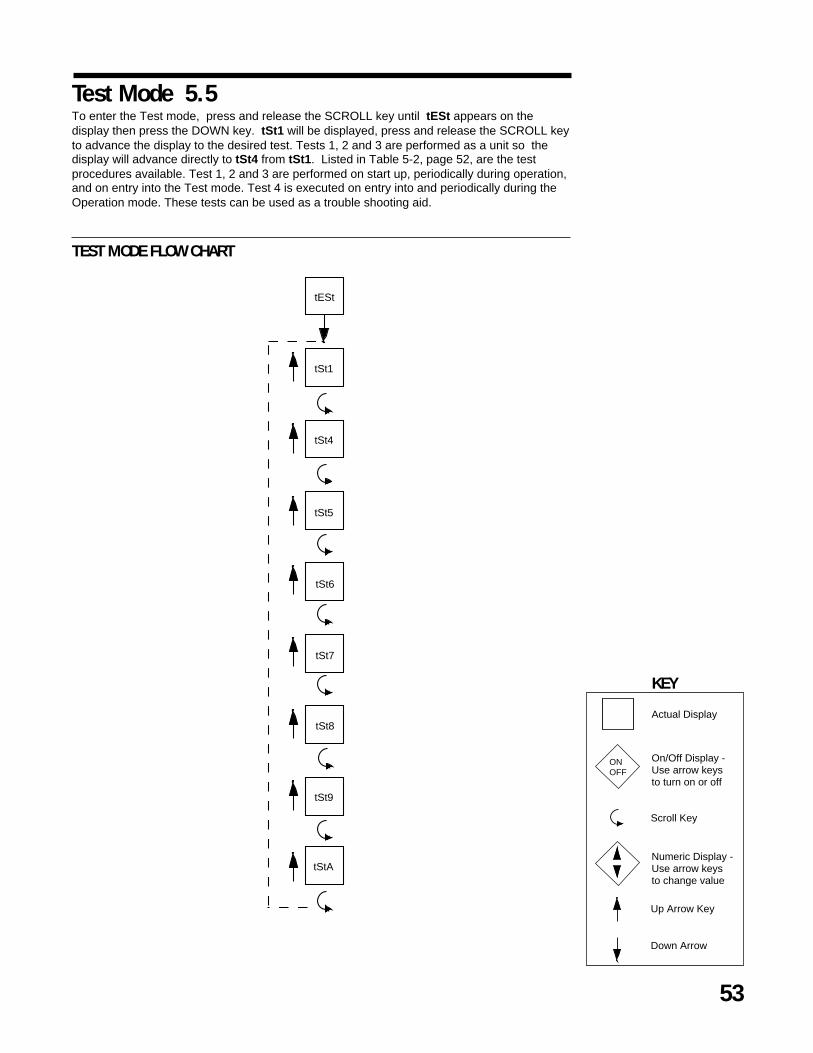
53
Test Mode 5.5To enter the Test mode, press and release the SCROLL key until tESt appears on thedisplay then press the DOWN key. tSt1 will be displayed, press and release the SCROLL keyto advance the display to the desired test. Tests 1, 2 and 3 are performed as a unit so thedisplay will advance directly to tSt4 from tSt1 . Listed in Table 5-2, page 52, are the testprocedures available. Test 1, 2 and 3 are performed on start up, periodically during operation,and on entry into the Test mode. Test 4 is executed on entry into and periodically during theOperation mode. These tests can be used as a trouble shooting aid.
TEST MODE FLOW CHART
tSt4
tSt5
tSt6
tSt7
tSt8
tSt1
tESt
tSt9
tStA
ONOFF
Actual Display
On/Off Display - Use arrow keysto turn on or off
Scroll Key
Numeric Display - Use arrow keys to change value
Up Arrow Key
Down Arrow
KEY

54
TABLE 5-2 TEST PROCEDURES AND DESCRIPTIONTest DescriptionTest 1 Microprocessor internal RAM test. Used to check the processor RAM to
make sure it is functioning correctly.
Test 2 External RAM test, used to test the RAM chip for proper function.
Test 3 EPROM checksum test, used to check that the EPROM program is correct.
Test 4 External RAM checksum test; instrument test and identifies how manytimes Errors16 or 17 have occurred.
Test 5 Verifies that all keys are functional and all LEDs are working.
Test 6 Used to verify that all relays and solid state relay driver outputs are workingcorrectly.
Test 7 This procedure will allow operator to adjust the current output value tocheck the output and to test the operation of the external device.
Test 8 Pen and chart motor operational check.
Test 9 Verifies that the auxiliary inputs are functioning properly.
Test A Communications Hardware Test.
5.5.1 TEST 1 INTERNAL RAM TESTTests the Random Access Memory internal to the microprocessor. No special test equipmentis required.
With tSt1 displayed, press and hold the DOWN key, then press the SCROLL key. tSt1 will bedisplayed momentarily while the test is in progress. Upon successful completion, the instru-ment will proceed to Test 2.
5.5.2 TEST 2 EXTERNAL RAM TESTTests the battery backed-up RAM external to the microcomputer. No special test equipment isrequired.
After completion of Test 1, tSt2 will be displayed momentarily while the test is in progress.Upon successful completion, the instrument will proceed to Test 3.
5.5.3 TEST 3 PROGRAM EPROM TESTThis is a checksum test to verify data integrity of the stored program. No special test equip-ment is required.
After completion of Test 2, tSt3 will be displayed momentarily while the test is in progress.Upon successful completion of Test 3 tst1 will be displayed.
5.5.4 TEST 4 EXTERNAL RAM CHECKSUM TESTThis is a checksum test to verify the integrity of data stored in RAM and indicate the numberof times the instrument has had an Error 16 or 17. The unit may have automatically recoveredfrom these errors. No special test equipment is required.
With tst4 displayed, press and hold the DOWN key then press the SCROLL key. The displaywill blank momentarily, then momentarily display two numbers, and then tst4 will be dis-played. These numbers indicate the number of times Error 16 and 17 have occurred respec-tively. Test 4 can be executed again, or another test may be selected.

55
Test 4 can be used to display the line frequency determined at power-up. With tSt4displayed, press and hold the DOWN key and then press the UP key. The display willblank momentarily, then show the line frequency it measured, then blank momentarily,and then display tSt4. The frequency measured, and displayed may not be exactly 50or 60, but the software will assume it is 50 or 60 during normal operation.
5.5.5 TEST 5 KEYPAD/DISPLAY TESTThis test allows the operator to verify that the keys work and that all display elements can belighted. No special test equipment is required.
With tSt5 displayed, press and hold the DOWN key, then press the SCROLL key and thenrelease both keys. The display will go blank. The following code will be displayed while thecorresponding key is pressed:
Key DisplaySCROLL SCrLUP uAroDOWN dAroRESET (upper) AutuRESET (lower) AutLAUTO/MAN (Pen 1) AutuAUTO/MAN (Pen 2) AutLUP and DOWN (All LED’s and segments lit)SCROLL and UP (exit)
To exit, press the SCROLL and UP keys simultaneously, tSt5 will be displayed.
5.5.6 TEST 6 RELAY/ SOLID STATE RELAY DRIVER OUTPUT TESTAllows the operator to verify that the Relay and /or the Solid State Relay Driver output(s) areworking. A volt/ohm meter will be required to test the output.
With tSt6 displayed, press and hold the DOWN key, then press the SCROLL key. oFF will bedisplayed. For SPST Relay outputs, connect the meter across the relay output in the ohmscale. The meter should read continuity with the relay On and infinity when the relay is Off.For SSR Driver outputs, connect the meter across the output in the Volt DC scale. The metershould read 5 VDC when the SSR driver is On and 0 VDC when the driver is Off. Press andrelease the DOWN key to advance through the following sequence:
RELAY ONDISPLAY SPSTrLYA ArLYb BrLYC CrLYd DoFF None
To exit, press the SCROLL key and tSt6 will be displayed. The existence of Relay andSolid State Relay Driver output(s) is dependent upon the hardware configuration.
5.5.7 TEST 7 CURRENT OUTPUT TESTThis test allows the operator to verify that the current output(s) are functioning properly or willallow the selection of an output value for testing of associated equipment. A milliamp meter isrequired for testing.
With tSt7 displayed press and hold the DOWN key, then press the SCROLL key. The displaywill indicate CurA , for the first current output. By pressing the DOWN key, the instrument willadvance through the selection sequence of Curb and then back to CurA. Choose the desiredoutput to be tested and connect the milliamp meter across the output terminals being tested.Be sure to observe the proper polarity when connecting the meter. Terminal 1 is positive and

56
terminal 2 is negative. Press the SCROLL key and the display will indicate 4 milliamps. Usethe UP and/or DOWN key to increase or decrease the current output in 1 mADC steps from 0to 20 mADC.The current output reading should be ± 0.1 mADC at any output value. A ± 5 % of spanadjustment for the current output(s) is provided by using the potentiometer adjacent to thecurrent output on the Current Output board. See Appendix A-4 (page 65). To exit the test,press the SCROLL key and tSt7 will be displayed. The existence of a mADC currentoutput is dependent upon the hardware configuration.
5.5.8 TEST 8 PEN/CHART MOTOR TESTThis test allows the operator to verify that pen and chart motors are functioning properly. Nospecial test equipment is required.
With tSt8 displayed press and hold the DOWN key, then press the SCROLL key. The displaywill show ALL while the test is in progress. This test functions automatically. The chart speedwill be at maximum, 72 seconds per revolution. Starting at the current pen position, pen 1 willmove (sweep) upscale for about 5 seconds, then downscale for about 5 seconds. Pen 2 (ifprovided) will sweep in the opposite direction. The pens will continue to cycle until the test isexited. To exit, press the SCROLL key. The display will show tSt8 .
5.5.9 TEST 9 AUXILIARY INPUT TESTThis test allows the operator to verify that the auxiliary input(s), if specified, pen positionfeedback input(s) are functioning properly.
Auxiliary inputs are the remote setpoint and position proportioning options. With tSt9 dis-played, press and hold the DOWN key, then press the SCROLL key. The display will showAi1 , Auxiliary Input 1. By pressing the DOWN key, the instrument will sequence through theselections for testing: Ai2 then back to Ai1 . With the desired input selected, press theSCROLL key. The corresponding value will be displayed. To terminate a particular test, pressthe SCROLL key. The display will show tSt9 .
5.5.10 TEST A COMMUNICATIONS HARDWARE TEST(COMMUNICATIONS OPTIONAL)This test allows the operator to verify that the communications hardware is functioningproperly.
With tStA displayed, press and hold the DOWN key then press the SCROLL key. The displaywill indicate SEnd . Press the DOWN key to toggle the display between SEnd and rEC . Withthe desired function selected, press the SCROLL key. In the SEnd (send or transmit) mode,the instrument will repeat the following sequence. First the transmitter will output a logic 1 onthe line for one second. Next the transmitter will change the logic level to 0 for one second.Then the transmitter will disable for one second. In the rEC (receive) mode, the transmitter iscontinuously disabled. In either mode, the instrument will monitor the line and display rEC1when a logic 1 is on the line or rEC0 when a logic 0 is on the line . In the SEnd mode, theinstrument will display rEC when the transmitter is disabled. To perform an internal test andverify the basic operation of the hardware, place the instrument in the Send mode and verifythat the display cycles through rEC1, rEC0 , and rEC. To verify that the transmitter functionsproperly, two LED’s, each with a current limiting resistor, can be connected with oppositepolarity observed to the TB 2 terminals 1 and 2. The following three states should be ob-served: one LED On, then the other LED On, then both Off. Alternately, a load resistor can beplaced on the terminals, and observe that the voltage generated across the load resistor is asfollows: >+3 VDC, then >-3 VDC, and then 0 VDC.
Another method, to test the communications hardware, would be to connect one or moreinstruments in the Receive mode to an instrument in the Send mode. All of the instruments inthe Receive mode should have their displays alternating in sync with the instrument in the

57
Send mode. When the sending instrument displays rEC, the receiving instruments shoulddisplay rEC1. To terminate the test, press the SCROLL key for one second. Upon exit, tStAwill be displayed. The existence of the communications hardware is dependent on thehardware configuration.
Trouble-shooting and Diagnostics 5.6The Trouble-shooting Guidelines Section consists of two columns. The first column is a list ofsome possible instrument conditions. The second column is a list of steps that should improvethe condition. The steps should be performed in order until the condition improves or all thesteps have been completed. If the instrument condition has not improved, contact the nearestrepresentative or the factory for assistance.
Trouble-shooting should be performed by qualified personnel using the proper equipment andfollowing all safety precautions. Whenever possible the trouble-shooting should be accom-plished with the electrical power disconnected. The instrument contains static sensitivecomponents so care should be taken to observe anti-static procedures.
CONDITION CORRECTION STEPSDisplay(s) is/are blank 1. Verify that the correct instrument power, as indicated
on the wiring label on the platen, is supplied to TB 1 terminals 1 & 2. Check the position of the power select switch, on 230 VAC models, correctly indicates the power that is connected to the instrument. If the switch does not indicate the correct voltage, reposition as necessary. If the voltage is not correct, check the power source.2. Turn off the instrument power. Wait about 5 seconds then turn the power on again.3. Turn off the instrument power, open the cover, loosen the platen hold down screw, and swing the platen out of the way. Inspect the instrument for poor connections.
a. The white ribbon cables that connect the Processor board (Appendix A-1, page 62) to the platen must be properly aligned and seated in the sockets.b. The display board(s) white ribbon cable(s) pins should be properly aligned and seated in the sockets on the platen board.c. Inspect the EPROM (U7), RAM (U8) and microprocessor chips (U5)to see that the legs are properly seated in their sockets on the Processor Board (page 62).d. Close the platen and tighten the hold down screw. Close the cover and turn on the power to see if the display(s) will now light.
4. Turn off the instrument power. Press and hold the UP and DOWN keys. Turn on the power. Hold the keys pressed for about 10 seconds. If the display(s) light the model number, Program and Tune mode parameters will need to be re-entered (pages 28 thru 35 or Software Ref. Sheet, page 72, if already filled out).

58
Model Number Displayed 1. Turn off the instrument power, wait 5 seconds thenduring power up is re-apply the power. Verify that the number displayedincorrect during the power up sequence is the same as
indicated on the label affixed to the platen. If the number displayed is incorrect, perform the following steps:
a. Turn off the power to the instrument. Press and hold the UP and DOWN keys. Turn on the power and keep the keys pressed until the model number displayed resets to 8XX0- 0000-0X11 where the digits X are determined by the firmware installed. Release the keys and turn off the power.b. To enter the correct model number, press and hold the SCROLL and DOWN keys and turn on the instrument power. 8XX0 should be displayed. Wait about 5 seconds and release the keys. The display should stay 8XX0. Use the UP/DOWN keys as neces sary to change the displayed number to match the first 4 digits of the model number as indicated on the label on the platen. After adjusting the first 4 digits to the proper values, press the SCROLL key and the display will change to 0000. Use the UP/ DOWN keys to set the next 4 digits of the model number to the correct values. Press the SCROLL key and the display will be 0X11. Use the UP/DOWN keys as necessary to adjust the last 4 digits of the number. Press the SCROLL key and the power up sequence will complete. The Program and Tune mode parameters will need to be re-entered (pages 28 thru 35 or Software Ref. Sheet, page 72, if already filled out).
Relay/SSR Driver 1. Verify that the Program and Tune modeMalfunction parameters are correctly set (pages 28 thru 35 or
Software Ref. Sheet, page 72, if already filled out).2. Turn off the power to the instrument. Wait about 5 seconds and turn the power on again. Confirm that the model number displayed during the power up sequence indicates that the output(s) is/are present in the instrument. See Appendix C (page 68) for the model number explanation/decoding. This number should match the number on the label affixed to the platen.3. Turn off the power to the instrument. Open the cover. Loosen the platen hold down screw and swing the platen open. Inspect the instrument Relay/SSR Driver board (See Figure 2-4, page 14) for the presence of the output device(s). A relay output will appear to be a cube. The SSR Driver will appear as a resistor and a jumper wire. The output will not work if the hardware is not present. Inspect that the output terminal connections are present and firmly attached.4. Check the output(s) operation by performing Test 6 as described in the Test section (page 53). If the output(s) function in the Test mode re-examine the Program and Tune mode parameters settings (pages 28 thru 35 or Software Ref. Sheet, page 72, if already filled out).

59
5. If the output appears not to turn off remove the power to the instrument. Open the cover and loosen the platen hold down screw. Swing the platen open. Clip the resistor located on the Relay Board adjacent to the output(s) that seem to stay on (See Appendix A-2, page 63). A .01 microfarrad, 1 KV capacitor should be connected from the terminal listed below, for the output where the resistor indicated was removed, to the AC ground.
Relay A R1 TB 6 Terminal 1Relay B R2 TB 6 Terminal 3Relay C R3 TB 7 Terminal 1Relay D R4 TB 7 Terminal 3
Close the platen and tighten the hold down screw. Closethe cover and turn the power on to the instrument.Check the operation of the output(s).
mADC Output(s) 1. Verify that the Program mode parameters areMalfunction correctly set (page 72).
2. Turn Off the power to the instrument. Wait about 5 seconds and turn the power on again. Confirm that the model number displayed during the power up sequence indicates that the output(s) is/are present in the instrument. See Appendix C ( page 68) for the model number explanation/decoding. This number should match the number on the label affixed to the platen.3. Turn off the power to the instrument. Open the cover. Loosen the platen hold down screw and swing the platen open. Inspect the instrument Current Output board (See Figure 2-6, page 15) for the presence of the output device(s). The output will not work if the hardware is not present. Inspect that the output terminal connections are present and firmly attached. Close the platen and tighten the hold down screw. Close the cover and turn on the power.4. Refer to the Test section and carry out the procedure for the Current Output(s) Test 7 (page 53). If the current output operates properly in the Test mode re-check the Program mode parameters (page 28 or Software Ref. Sheet, page 72, if already filled out).
Pen(s) do not operate 1. Verify that the Program mode parameters are properly set (page 28 or Software Ref. Sheet, page 72, if already filled out)2. If the process value in the display exceeds the chart upper or the chart lower values selected in the Program mode, the pen will appear stuck at the chart upper or lower edge respectively. Re-configure values as needed by the application (May require a new chart).3. Perform Test 8 as described in the Test section of the manual (page 54). If the pen(s) operate in Test 8, perform the pen calibration, Cal 9, as described in the Calibration section of the manual (page 50). Return the instrument to the oPEr and check the operation of the pen(s).4. Verify the instrument is not in Change Chart function.

60
ERROR CODE DISPLAYED
SnSr - Sensor Break or 1. Inspect the sensor for proper operation andOver Range connection to the instrument. Acceptable sensor
ranges for the instrument are listed in the Specifications section of Appendix D (page 69).2. Verify that the Program mode input selection matches the sensor input connected (page 28 or Software Ref. Sheet, page 72, if already filled out).3. Check that the input conditioning jumpers on the Processor board (Appendix A-1, page 62) are in the proper position for the sensor input. Check that the jumpers are in the proper position for the Terminal Board where the sensor is connected.4. Perform the calibration procedure(s), as described in the Calibration section (page 46), for the sensor input type.
Hi - Input more than 10% 1. Perform the steps listed for the SnSr Error Condition.Over Span (above)
Lo - Input more than 10% 1. Perform the steps listed for the SnSr Error Condition.Under Span (above)
o - display overranged 1. If this error code is displayed as a Program or Alarm(the “broken 6” Set mode parameter perform the CAL 1 procedure asappears on the left described in the Calibration section of the manualsegment of the display) (page 46).
2. If this error code appears as part of the model number during the power up sequence, follow the steps listed for the "Model Number is not correct " condition (page 56)3. If this error appears, check the Program mode parameter dPos , if not 0, change to 0 and see if the error clears.
Er 1 - Microprocessor RAM 1. Turn off the power to the instrument. Wait 5 seconds,Failure and turn the power on.
2. Turn off the power to the instrument. Open the cover, and loosen the platen hold down screw. Swing open the platen and inspect that the microprocessor chip is properly seated in the socket located on the Processor board (Appendix A-1, page 62). Close the platen and tighten the screw. Close the cover and turn on the power.
Er 2 - External RAM 1. Turn off the power to the instrument. Wait 5 seconds,Failure and turn the power on.
Er 3 - EPROM Checksum 1. Perform the steps listed for Er 1 except thatFailure the EPROM (U7) on the Processor board should be
inspected.

61
Er 4 - RTD Mismatch Error 1. Check the connections to the instrument for the RTD Input Calibration (CAL5) as described in the Calibration section (page 49). Repeat the RTD Input Calibration.
Er 5 - No Zero Crossings 1. Turn off the power to the instrument. Wait 5 seconds,Detected and turn the power on.
2. Connect the instrument to another AC power source.
Er 6 - AC line below 43 HZ 1. Turn off the power to the instrument. Wait 5 seconds, and turn the power on.2. Connect the instrument to another AC power source.
Er 7 - AC line over 64 HZ 1. Turn off the power to the instrument. Wait 5 seconds, and turn the power on.2. Connect the instrument to another AC power source.
Er 8 - Cal 2 Volt Input 1. Check that 50 mVDC is properly connected to theError instrument and is within the tolerance limits as
indicated in the CAL2 procedure of the Calibration section (page 47).2. Turn off the power to the instrument and open the cover. Loosen the platen hold down screw and swing the platen open. Inspect the Processor board (Appendix A-1, page 62) to insure that the input conditioning jumper JU4 is in the non-volt position. The jumper must be in the non-volt position to perform the CAL 2 procedure properly. Close the platen and tighten the hold down screw. Close the cover and turn on the power to the instrument.3. Perform the CAL2 procedure as described in the Calibration section (page 47).
Er 9 - ADC Reference 1. Perform the CAL2 procedure as described in theNumber Error Calibration section (page 47).
Er10 - ADC Reference 1. Perform the CAL2 procedure as described in theVoltage Error Calibration section (page 47).
Er11 - Cold Junction 1. Perform the CAL3 procedure as described in theCompensation Error Calibration section (page 48).
Er12 - CAL2 Voltage Error 1. Check that 50 mVDC is properly connected to the instrument and is within the tolerance limits as indicated in the CAL2 procedure of the Calibration section (page 47).2. Turn off the power to the instrument and open the cover. Loosen the platen hold down screw and swing the platen open. Inspect the Processor board (Appendix A-1, page 62) to insure that the input conditioning jumper JU4 is in the non-volt position.3. Perform the CAL2 procedure as described in the Calibration section (page 47).

62
Er13 - RTD CAL5 Input 1. Check that resistance device is of the correct valueError and properly connected to the instrument and is
within the tolerance limits as indicated in the CAL5 procedure of the Calibration section (page 49).2. Turn off the power to the instrument and open the cover. Loosen the platen hold down screw and swing the platen open. Inspect the Processor board (Appendix A-1, page 62) to insure that the input conditioning jumpers are in the correct position for the RTD input for the Terminal Board being calibrated. For TB 4, JU4 should be in the non-volt position and JU6 in the RTD position. For TB 5, JU5 should be in the non-volt position and JU7 in the RTD position.3. Perform the CAL5 procedure as described in the Calibration section (page 49).
Er14 - Cold Junction 1. Perform the CAL3 procedure as described in theCompensation Error Calibration section (page 48).
Er15 - Ground Reference 1. Perform the CAL2 procedure as described in theTolerance Error Calibration section (page 47).
Er16 - Program/ASEt Mode 1. Record all Program, Tune and Alarm Set modeparameters. Checksum Error Perform CAL 1 procedure as described in the
Calibration section (page 47). Re-enter all parameters.
Er17 - Calibration 1. Perform the calibration procedures that areChecksum Error needed for the input sensors that will be used (page
46).
Er36 - Incorrect Crystal 1. Turn off the power to the instrument, wait 5 seconds,For Digital Comm. then turn the power on.
Er37 - Incorrect Micro. 1. Turn off the power to the instrument wait 5 seconds,For Digital Comm. then turn the power on.
Er38 - Incorrect RAM 1. Turn off the power to the instrument, wait 5 seconds,for profiler then turn the power on.
2. Re-configure for non-profiler.
Momentary Er70 - 1. May occur when incrementing or decrementing aController unable to respond value. Error clears itself.within 250 milliseconds
Momentary Er71 - 1. Computer program must wait longer for a responseByte received before the from the instrument.response was transmitted

63
Momentary Er 72 - 1. Data received not valid, possible corruption on theIncorrect Block Check comm line. Possible noise problems. Check baudcharacter was received rates, instrument addresses, line connections, and
termination.
Momentary Er 73 - 1. Check baud rate.Byte received with incorrect 2. Possible noise problems. Check instrumentparity. addresses, line connections, and termination.

64
Appendix ABoard Layouts
FIGURE A-1 - PROCESSOR BOARD
UNLOCKED
JU4JU5
230
TB3 TB4 TB5
JU3
64K
JU4 PEN 1 INPUT
T/C,mV, RTD
VOLT/mA
JU5 PEN 2 INPUT
T/C,mV, RTD
VOLT/mA
JU6 /JU7RTDINPUT
NON-RTD
230/115 VACSWITCH 230 VACMODEL ONLY
EPROM SIZE
LOCKED
JU1ENABLE MODE
(REVERSE OF JU4)
JU6JU7
TB1
32K
Battery
JU3
JU1
Top
TB2
U7U5
RTD
230
SWI for Rev. Y and above SWI for Rev. X and below

65
If the relay is connected to ahigh impedance AC device,the snubber network used toprotect the relay contact maycause the output to appearto be activated when therelay is off. To cure theproblem, cut the snubberresistor for the output that isbeing affected.
Resistor RelayR1 Relay AR2 Relay BR3 Relay CR4 Relay D
FIGURE A-2 - SPST RELAY/SSR DRIVER OUTPUT BOARD
TB6 TB7
TS1 R1 TS2 R2 TS3 R3 TS4 R4
C1 C2 C3 C4
K1 K2 K3 K4
P7
(rlyA) (rlyB) (rlyC) (rlyD)

66
If this option board was ordered, you will find it located in the lower right hand corner of theinstrument.
FIGURE A-3 - CURRENT OUTPUT BOARD
TB10 TB11
R27R7

67
Appendix BGlossaryAutomatic Reset (Integral)This parameter is used so that the instrument will compensate for process variable deviationsfrom setpoint that occur when the process load characteristics change. Instructions fordetermining the automatic reset settings are given in Table 3-2 (Page 34). Factory defaultis.0.0. Display code ArSt.
Automatic TransferThis feature, if configured, allows manual control of the process until setpoint is reached, atwhich point the controller automatically transfers from manual to automatic control. Factorydefault value is 0 = no auto transfer. Display code AtFr .
Bumpless TransferThis feature prevents step changes in proportional outputs when changing from automatic tomanual control only.
Cycle TimeThis Tune mode parameter is used to select the on/off cycle time for time proportioningoutputs (Ct1 for Output 1 and/or Ct2 for Output 2).When usng the Position Proportioning option, Ct1 must be selected for the stroke time of themotor.
Display Filter FactorThis parameter is adjustable from 1 to 20 which represents the number of scans per secondof the process variable that are averaged together before updating the displayed and re-corded value. The factory default value is 1 = no filtering. Display code dFF.
Engineering Units Upper and Engineering Units LowerThese Program mode parameters are used with volt, millivolt, and milliamp inputs. TheEngineering Units Upper Euu should be selected as the value to be displayed when the inputis at maximum. The Engineering Units Lower EuL should be selected as the value to bedisplayed when the input is at minimum.
First Output PositionThis parameter is adjustable from -1000 to 1000 units and represents a shift or offset of theon-off actuation points or proportional band for the first output relative to the normal position.For example, a negative value could be used to offset an expected overshoot. First OutputPosition also shifts the proportional band with respect to the process value range outside ofwhich integral action is inhibited. Factory default is 0. Display code FoP.
HysteresisThis parameter is adjustable from 0 to 300 units representing the width of the band (halfabove and half below setpoint). Used with ON/OFF or Alarm outputs to reduce cycling. Forinstance, with a value of 4 and a setpoint of 70 the output will turn ON when the processvariable drops to 68 and stay ON until 72 is reached, then turn OFF the output. Factorydefault = 3. Display code HyAo for Alarm outputs. Display code HyCo for ON/OFF Controloutputs.
Input CorrectionThis parameter is adjustable from -300 to 300 units and is used as a method to compensatefor a linear sensor error. Factory default is 0 = no correction. Display code iCi1 , iCi2 .
Manual ResetThis parameter is adjustable from -1500 to 1500 units representing a manual shift of propor-tional band(s) relative to the normal position which is an even strattle of the setpoint. Manualreset is intended to be used when automatic reset is not used to allow compensation fordeviations from setpoint which remain after the process has stabilized. Factory default is 0.Increasing the value increases the process variable, i.e. if the process variable stabilizes toolow, increase the manual set. Integral action, and conversely reset-windup inhibit apply overthe same process value range regardless of the manual reset value. Display code rSEt .

68
Pen Action on Power UpThis parameter specifies whether the pen, on a power-up will drive to the "Home Position"(center of chart), then return to its correct postion. This is done as a cal check. Settings are0=go to "home" and 1=remain in last position prior to power down. Default is 0.
PlatenThe flat surface in the instrument upon which the chart rotates.
Position Proportioning SensitivityA percentage of the first output proportional band width (Pb1).
Process Filter FactorThis parameter is adjustable from 1 to 20 which represents the number of scans per secondof the process variable that are averaged together before updating the process value used forcontrol purposes. The factory default value is 1 = no filtering. Display code PFF.
Process Retransmission OutputAllows re-transmission of the process variable. Factory default is 0 = not selected. Displaycode Pout . If selected, must be assigned to a current output and scaled using Process Outputupper and lower values.
Process Output Upper and Lower Values(Used in conjunction with process retransmission output)These parameters specify the process value range over which the assigned current output willvary in a linear manner from 100% to 0%. If the process value is greater than Pou the outputwill be 100%. If the process value is less than PoL the output will be 0%. Factory defaultvalues are 2000 for the upper value and 0 for the lower value. Display codes Pou (upper) andPoL (lower).
Process RoundingThis parameter is adjustable from 0 to 100 units and is used to round the process value to thenearest value specified. This is for display only and does not affect the recorded value orcontrol action. Intended for use where the engineering units span is large, to reduce displayfluctuation. Factory default is 0 = no rounding. Display code Prnd . (e.g. Prnd = 3, ProcessValue = -6, -3, 0, 3, 6, 9....)
Proportional Band (PB)This parameter is adjustable from 1 to 3000 units (not Percent of span) and represents theprocess value range where the proportional output is at a percentage of the full output.Instructions for determining Pb are given in Section 4.3 (page 42) . Factory default is 100units. Display code Pb1 and Pb2.
Rate (Derivative)This parameter is adjustable from 0.0 to 10.0 minutes and specifies how the control actionresponds to the rate of change in the process variable. For example, if the process variable isrising rapidly to setpoint, power is turned off sooner than it would be if the rise were slow. Ineffect, derivative action anticipates lags within the system and shifts the proportioning band byan amount determined by the rate of change of the input sensor.
Magnitude of the shift is determined by a derivative time constant. If the time constant is, say,.1 minute (6 seconds), for every unit per second rate of change of the process variable at thesensor, the proportiong band is moved 7 units in the direction that helps control. Likewise, ifthe time constant is 1 minute (60 seconds), for every unit per second rate of change of theprocess variable at the sensor, the proportioning band is moved 60 units in the direction thathelps control. Factory default is 0.0 Display code rAtE .
Second Output Position (SoP)This parameter is adjustable from -1000 to 1000 units and represents a shift or offset of theon-off actuation points or proportional band for the second output relative to the normalposition. A positive value creates a gap where no control outputs are on, a negative valuecreates an overlap of control outputs (if the first output position is at the normal position).Second Output Position also shifts the proportional band with respect to the process valuerange outside of which integral action is highlighted (reset-windup inhibit). Factory default is 0.Display code SoP.

69
Appendix C Order Matrix
PEN 11 Recorder Only2 Recording Controller
PEN 20 None1 Recorder Only2 Recording Controller
*RELAY OUTPUTS0 None1 One SPST2 Two SPST4 Four SPST
*SSR DRIVER OUTPUTS0 None1 One2 Two4 Four
4 TO 20mA OUTPUTS0 None1 One2 Two
TRANSMITTER POWER SUPPLY0 None1 24VDC Regulated/Isolated
PEN 1 AUXILLIARY INPUT0 None1 Position Proportioning2 Remote Setpoint
PEN 2 AUXILLIARY INPUT0 None1 Position Proportioning2 Remote Setpoint
DIGITAL COMMUNICATIONS0 None2 RS-485 Total Access
ENCLOSURE OPTION1 Glass Window NEMA 32 Glass Window NEMA 4X3 Glass Window NEMA 3
with Door Lock4 Plastic Window NEMA 35 Plastic Window NEMA 4X6 Plastic Window NEMA 3
with Door Lock
* The total quantity of SPST Relays andSSR Drivers must be less than or equalto four.
Note: 4-20mA inputs are accommo-dated using the 1-5V input and a 250ohm Shunt Resistor, P/N 64411701 orthe 10-50mA input and a 2.5 ohmShunt Resistor, P/N 64411702. The250 ohm resistor is included for eachinput.
8
OPTION SUFFIX(Blank) None
VOLTAGE1 115VAC Input2 115/230VAC Input

70
Appendix D Product SpecificationsINPUTSInput Types/Range Type RangeThermocouple J 0°C to 760°C 0°F to 1400°F
K 0°C to 1360°C 0°F to 2500°FT -200°C to 400°C -330°F to 750°FR 200°C to 1650°C 400°F to 3000°FS 200°C to 1650°C 400°F to 3000°FE 0°C to 750°C 0°F to 1400°FB 200°C to 1800°C 400°F to 3300°FN 0°C to 1300°C 0°F to 2370°FC 200°C to 2300°C 390°F to 4170°F
RTD 100 ohm Platinum -140°C to 400°C -220°F to 750°F.00385 ohms/ohm/°C
Current DC 0 to 20mA, 4 to 20mAExternal Shunt Resistor, 2.5 ohms or 250 ohms
Voltage DC 0 to 25mV, 0 to 50mV, 10 to 50mV, 0 to 5 V, 1 to 5 VImpedance > 100M ohm for TC and mV inputs
100K ohms for 5V inputs2.5 ohms or 250 ohms for mA inputs
RTD Excitation Current 330 microamps, typicalInput Scan Rate 1 scan per secondInput Correction Offset Adjustment, -999 to 999 unitsRemote Setpoint 0 to 5V, 1 to 5V
Sensor Fault Detection Sensor break on all TCs, RTDs, 1volt, 1 to 5 volt, 4-20mA, and millivolt inputsNo sensor break can be detected for zero based Volt and Milliamp rangesDisplay goes to “SnSr” and pen goes upscale if a sensor break is detectedDisplay goes to “Hi” 5% above spanDisplay goes “Lo” 5% below span
Transmitter Power Supplies One isolated 50mA @ 24VDC supply available.
INPUT PERFORMANCEPerformance Under Reference Condition:Measurement Error Type J, K, T, E, N, C, T/C and RTD: ±0.25% of span ±1 degree
Type R, S, B, C, T/Cs: ±0.25% of span @ 25°CmVDC and VDC: ±0.25% of scaled span plus 1 least significant digit
Cold Junction Compensation Error ±0.2°C @ 25°CCold Junction Compensation Rejection 0.04°/°C deviation from 25°CLinearization Error TCs: ±0.25°C typical, ±0.5°C worst case with expectations
RTDs: ±0.1°C typical, ±0.3°C worst caseAmbient Temperature Error ±0.01% of span per°C deviation from 25°CCommon Mode Rejection 90 db minimum; 24VAC maximum for RTD input; 115 VAC maximum all others
for other inputsNormal Mode Rejection 85 dB minimum @60Hz or greaterIsolation RTD Inputs 24VAC. All other inputs 115VAC
Inputs share a common signal groundReference ConditionsAmbient Temperature 25°CRelative Humidity 60 - 70%Supply Voltage 115 VAC, 60 HzSource Resistance < 10 ohms for TC inputLead Resistance < 0.1 ohm/lead balanced (Pt100)

71
RECORDINGPen Type Disposable fiber tipPen Color Pen 1 - Red
Pen 2 - GreenChart Size 12 inchChart Drive Stepper motorChart Rotation User configurable: 0.1 to 999 hours, in 0.1 hour incrementsChart Span Bottom and top of span, -9999 to 9999 unitsFiltering 1 to 20 scans averaging (affects display and recording)
RECORDING PERFORMANCEChart Recording Accuracy 0.5% of chart span reference accuracyResolution 0.15% of chart spanDead Band 0.3% of chart spanResponse Time 20 seconds for full scale travelChart Rotation Accuracy ± 0.5% of rotation time, assuming all backlash removed
OPERATOR INTERFACEDisplay Four digit, 0.56" high, red, seven segment, LED displayResolution TCR and RTD: 0.1 and 1 degree
mV, V and mA: 0.001, 0.01, 0.1, and 1 unitStatus Indicators Recorders: ALRM1 and ALRM2; red LEDs
Controllers: MAN, OUT1, OUT2, ALRM; yellow, red, yellow, red LEDsKeypad Three keys for programming and unit operation
One or Two Auto/Man keys on controllersDisplay Modes Recorders: Process value(s)
Controllers: Process value(s) or deviation(s), with or without setpoint sequentially
ALARMSNumber Up to two process alarms for each of two inputsType Recorder: Process high or low
Controllers: Process, deviation, or bandHysteresis Fully adjustable, 0 to 300 units, straddles alarm pointSecurity Alarm setpoint changes can be prohibitedSensor Fault Action Alarms work normally in “Hi” and “Lo” conditions
Alarm relays are deenergized in a “SnSr” sensor break condition
ON/OFF OUTPUTSOn/Off Outputs Assignable to alarm or control outputsRelays SPDT, contacts rated 5 amps resistive at 115 VAC,
2.5 amps resistive at 230 VAC, 1/8 HP at 230 VAC (single phase),250 VA at 115/230VAC
Solid State Relay Driver Open collector output, can provide 40mA at 3 VDC or 20mA at 4 VDCShort circuit current is limited to 100mA
CURRENT OUTPUTSDrivers Assignable to process value or setpoint retransmission or control outputsOutput Span 0 to 20mA or 4-20mA, nominalResolution 0.02 % of 20mA; 12 bits over a 0 to 25.6mA spanAccuracy ±0.1% to 20mA span reference accuracyCompliance 650 ohm load
72
POWER REQUIREMENTSLine Voltage 115/230 VAC, ±10%, 50/60 HzPower Consumption: 25 VA Maximum
CONSTRUCTIONEnclosure Gasketed cover, case, and windows. Structural foam case and coved with plastic
or glass window area. Door lock availableNEMA Rating NEMA 3 standard, NEMA 4X optionalConduit Openings Four openings standard, 2 additional as requiredMounting Panel or wall or optional pipe mountingOverall Dimensions 14.12" wide X 16.77" high X 7.75" deep
(358.65mm wide X 425.96mm high X 196.85mm deep)Panel Cutout 12.7" wide X 12.7" high
(322.58mm X 322.58mm)Panel Depth 5.25" (133.35mm)Panel Protrusion 2.5" (63.5mm)Weight 20lbs maximum
EVIRONMENTAL AND OPERATING CONDITIONSOperating Temperature 0°C to 55°C (32°F to 131°F)Storage Temperature -40°C to 65°C (-4°F to 149°F)Humidity 10 to 90% RH, non-condensingVibration 0.5 to 100 Hz @ 0.2gMounting Position Up to 30° forward or backward tilt from vertical
Up to 10° side tilt from vertical
DIGITAL COMMUNICATONSCommunications Port RS-485 serial communications, Half-duplexProtocol Partlow ASCII - ANSI x 3.28, subcatagory 2.5 & A4Bit Rate 9600, 4800, 2400, 1200, 600, 300 bits per secondConfiguration Monitor: read only, Normal: read and writeAddress User configurable - 0 to 99 for each pen
GENERAL REFERENCE DATAData Backup Battery backed SRAM for all dataBattery Backup 5 years minimum life, 10 years typicallyWarranty Two years
APPROVALS AND COMPLIANCESafety UL Approved for USA - UL 1092, UL 916, and QUXY - File E67237: Pending
UL Certified for Canada - CSA Spec 142 - File E67237: Pending

73
ENABLE MODE
EtStECALEProEAStESPC
PAL1PAL2
ALARM SET Pen 1 Pen 2
inPSiCorAL1AL2disPdPoSEuuEuLHyAoSPuLSPLLPrnddFFPFFPoutPouPoLCruCrLPAEC
Appendix ESoftware Reference/Record Sheet
Recorders:Recorders:Recorders:Recorders:Recorders:
rLyArLybrLyCrLydCurACurbCoArCobrCrtPAPuCooCConCbSCAd1CAd2
PROGRAM MODEPen 1 Pen 2 unit
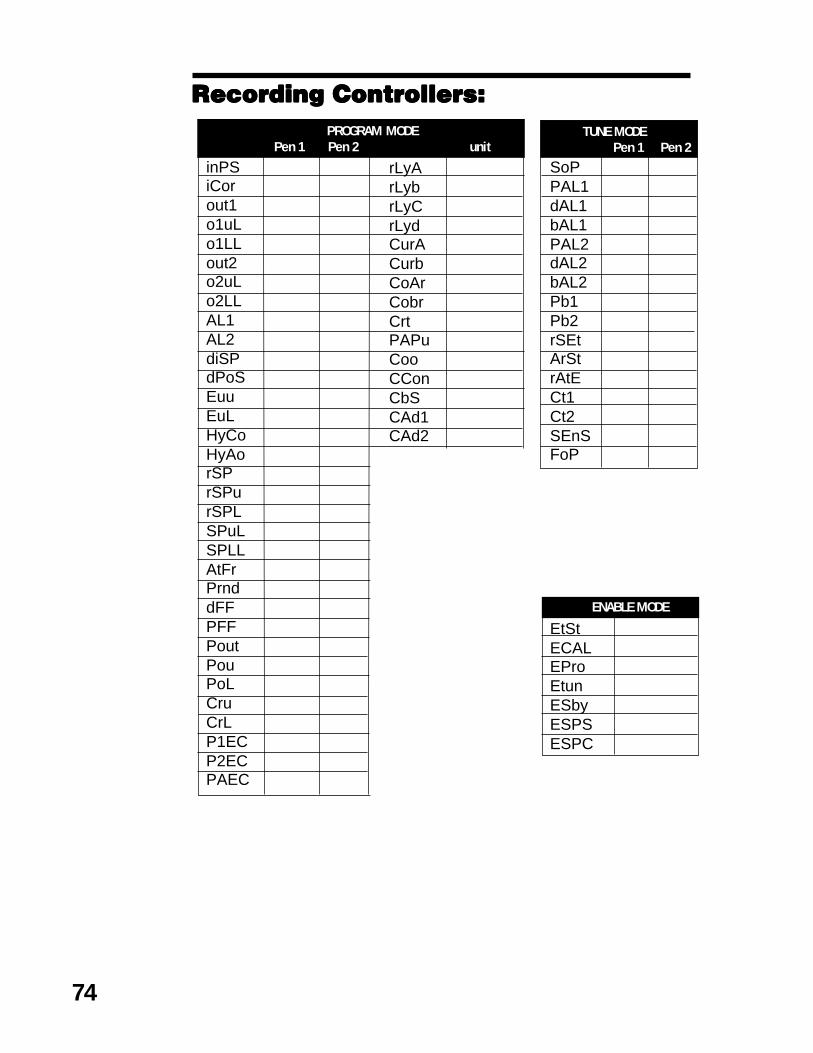
74
inPSiCorout1o1uLo1LLout2o2uLo2LLAL1AL2diSPdPoSEuuEuLHyCoHyAorSPrSPurSPLSPuLSPLLAtFrPrnddFFPFFPoutPouPoLCruCrLP1ECP2ECPAEC
TUNE MODE Pen 1 Pen 2
ENABLE MODE
rLyArLybrLyCrLydCurACurbCoArCobrCrtPAPuCooCConCbSCAd1CAd2
PROGRAM MODEPen 1 Pen 2 unit
SoPPAL1dAL1bAL1PAL2dAL2bAL2Pb1Pb2rSEtArStrAtECt1Ct2SEnSFoP
EtStECALEProEtunESbyESPSESPC
Recording Controllers:Recording Controllers:Recording Controllers:Recording Controllers:Recording Controllers:

75
Warranty and Return Statement
These products are sold by The Partlow Corporation (Partlow) under the warranties set forthin the following paragraphs. Such warranties are extended only with respect to a purchase ofthese products, as new merchandise, directly from Partlow or from a Partlow distributor,representative or reseller, and are extended only to the first buyer thereof who purchasesthem other than for the purpose of resale.
Warranty
These products are warranted to be free from functional defects in materials and workman-ship at the time the products leave the Partlow factory and to conform at that time to thespecifications set forth in the relevant Partlow instruction manual or manuals, sheet or sheets,for such products for a period of two years.
THERE ARE NO EXPRESSED OR IMPLIED WARRANTIES WHICH EXTEND BEYONDTHE WARRANTIES HEREIN AND ABOVE SET FORTH. PARTLOW MAKES NO WAR-RANTY OF MERCHANTABILITY OR FITNESS FOR A PARTICULAR PURPOSE WITHRESPECT TO THE PRODUCTS.
Limitations
Partlow shall not be liable for any incidental damages, consequential damages, specialdamages, or any other damages, costs or expenses excepting only the cost or expense ofrepair or replacement as described above.
Products must be installed and maintained in accordance with Partlow instructions. Users areresponsible for the suitability of the products to their application. There is no warranty againstdamage resulting from corrosion, misapplication, improper specifications or other operatingcondition beyond our control. Claims against carriers for damage in transit must be filed bythe buyer.
This warranty is void if the purchaser uses non-factory approved replacement parts andsupplies or if the purchaser attempts to repair the product themselves or through a third partywithout Partlow authorization.
Returns
Partlow’s sole and exclusive obligation and buyer’s sole and exclusive remedy under theabove warranty is limited to repairing or replacing (at Partlow’s option), free of charge, theproducts which are reported in writing to Partlow at its main office indicated below.
Partlow is to be advised of return requests during normal business hours and such returns areto include a statement of the observed deficiency. The buyer shall pre-pay shipping chargesfor products returned and Partlow or its representative shall pay for the return of the productsto the buyer.
Approved returns should be sent to: PARTLOW CORPORATION2 CAMPION ROADNEW HARTFORD, NY 13413 USA

ISO 9002 CertifiedPARTLOW CORPORATION • 2 CAMPION ROAD • NEW HARTFORD, NY 13413 USA • 1-800-866-6659 • 315-797-2222 • FAX 315-797-0403