onboard qc processing table of contents
TRANSCRIPT

Onboard QC Processing Table of Contents 1 Onboard QC Personnel and System ................................................................................ 2
1.1 Onboard QC Processing Geophysicists ....................................................................... 2 1.2 Onshore QC Processing Support ................................................................................. 2 1.3 Seismic Processing Hardware Description .................................................................. 2 1.4 Seismic Processing Software Description ................................................................... 2
2 Acquisition Quality Control.............................................................................................. 3
2.1 Introduction.................................................................................................................. 3 2.2 QC Processing Objectives............................................................................................ 3 2.3 Parameter Testing ........................................................................................................ 3 2.4 QC Processing Sequence ............................................................................................. 3 2.5 Velocity Analysis......................................................................................................... 4 2.6 Brute Stack................................................................................................................... 5 2.7 QC Workflows ............................................................................................................. 6 2.8 Noise Record and Channel RMS graph ....................................................................... 8 2.9 Ambient noise - Shot Vs Channel RMS Display....................................................... 11 2.10 Near Trace Display .................................................................................................... 14 2.11 Auxiliary Channel QC ............................................................................................... 15 2.12 Shot Record Displays................................................................................................. 18 2.13 Navigation Processing ............................................................................................... 18
3 Encountered problems..................................................................................................... 19
3.1 Propeller Noise........................................................................................................... 19 3.2 Swell noise ................................................................................................................. 21 3.3 Autofires/Misfires/Airleak......................................................................................... 22 3.4 Turn noise .................................................................................................................. 23 3.5 Spiky Channels .......................................................................................................... 24 3.6 Noise history display.................................................................................................. 25 3.7 RMS history displays................................................................................................. 26
4 Conclusion ........................................................................................................................ 28 5 Appendices........................................................................................................................ 29
5.1 SEGY Brute Stack Headers ....................................................................................... 29 5.2 Shipments................................................................................................................... 30 5.3 QC Line log................................................................................................................ 31
Bass Strait Oil Company Ltd Final Survey Report
AREA: T42P & T43P Tasmania, Australia 2008. Pacific Titan - Job 6374 Page 1
Bass Strait Oil Company Ltd Final Survey Report
AREA: T42P & T43P Tasmania, Australia 2008. Pacific Titan - Job 6374 Page 2
20 Onboard QC Personnel and System
20.1 Onboard QC Processing Geophysicists 5th May 2008 Tommy Timenes CGGVeritas, Chief Field Geophysicist Isabel Adjani Nicolas CGGVeritas, Field Geophysicist 25th May to 1st June 2008 Steffi Schwarz CGGVeritas, Chief Field Geophysicist
Dennis Jerome Aquino CGGVeritas, Field Geophysicist
20.2 Onshore QC Processing Support Ronny Tømmerbakke Support Geophysicist Cathrine Myrmehl Support Geophysicist Christophe Massacand Chief Operations Geophysicist
20.3 Seismic Processing Hardware Description Machines : 1 x Supermicro, built on SC833T-R760 Chassis
(Dual Core Xenon 2x3.2GHz CPU, 8Gb RAM) 1 x Win XP SP2 PC Hard Disk Drive : 1.6Tb Disk Monitors : 4 x 19in LCD Monitors Tape Drives : 2 x IBM 3590 tape drives Plotter : 1 x Isys V24 24in Thermal Plotter (B&W)
20.4 Seismic Processing Software Description Processing software : ProMAX 2D version 2003.12.1.1 Operating System : LINUX Red Hat Enterprise WS 3.0 Update 6 Plotting software : ZehPlot Express 4.7.0

Bass Strait Oil Company Ltd Final Survey Report
AREA: T42P & T43P Tasmania, Australia 2008. Pacific Titan - Job 6374 Page 3
21 Acquisition Quality Control
21.1 Introduction This report provides a summary of the steps taken for the onboard seismic data QC for this survey. Information important for the onshore processing of this data is either contained within this document, or its location is referenced. The SEBOA survey is comprised of several 2D seismic surveys for the SEBOA consortium (Santos, 3D Oil, Bass Straits Oil Company, Cue Energy Resources, Eagle Bay Resources, Exoil and Tap Oil). The survey sites are located offshore South East Basin and Bass Strait Basin in Australia and cover around 10,900 km. This report covers the Bass Strait survey of blocks T42P and T43P. The survey of blocks T42P and T43P was shot in two parts: sequences 001 to 004 were shot on 5th May 2008, and sequences 005 to 018 were shot from 25th May to 1st June 2008. Acquisition parameters for the project are the following:
• 1 Streamer x 6000m • Single source • 25 m SP interval • 6 seconds record length
21.2 QC Processing Objectives The main objective of the onboard QC processing was to identify problems associated with the data acquisition and recording. This included the assessment of noise in the data on a line by line basis in order to give an overall impression of the data quality. Various QC methods, including RMS noise displays, single and multi-trace displays, gun hydrophone channels and stacks were used to assess compliance with various acceptance criteria and to isolate any other acquisition issues. The general aim of the QC processing was not to attenuate noise but to show the data as it was recorded, or how it would be presented to the processing centre. A brute stack was produced for every line with minimal processing to enable a thorough QC of the data onboard. In addition to brute stack processing, gun hydrophone channels were checked to QC the performance of the source. Near trace and Shot vs. Channel RMS displays were generated and examined to identify any noise problems.
21.3 Parameter Testing Parameter testing consisted of choosing suitable parameters on the first sequence, along with NMO mutes, and post stack scaling for the displays, and checking that these parameters remained appropriate throughout the survey. Testing was kept to a minimum due to the high acquisition rate and resulting workload.
21.4 QC Processing Sequence

Bass Strait Oil Company Ltd Final Survey Report
AREA: T42P & T43P Tasmania, Australia 2008. Pacific Titan - Job 6374 Page 4
Data was recorded by the Observer department in duplicate onto 3590 tape cartridges (10Gb capacity). One 'primary' tape set and one 'copy' tape sets were generated. Upon completion of a line, the ‘original’ (or ‘primary’) tape was read to confirm the integrity of the data on tape. All SEG-D data on the primary tape was extracted and written to the ProMAX system disk. A listing of the field files (FFID), shot point numbers (SP) and number of channels was printed to clearly identify any lost shots or shots with missing navigation headers. Copy tapes were also checked for completeness of data on tape. The data included 480 seismic channels and 30 auxiliary channels ( -1 to -30). Informative auxiliary channels are Aux1 - System Start, Aux2 - Time Break, Aux4 - Waterbreak, Aux13 to Aux30 - Gun Near Field Hydrophones. Also recorded were the start of line (SOL) and end of line (EOL) noise records. Seismic data, noise records and auxiliary channels were input with a record length of 6000ms, and a 2ms sample interval was used in the acquisition. The cable length was 6000 meters with hydrophone group separation of 12.5 meters, and shotpoints were recorded at 25m intervals. A bulk shift static correction was applied to the data to correct for the 50ms instrument delay of the recording system. For QC purposes a nominal 2D geometry was applied to all the seismic trace data. The resulting offset / CDP binning information calculated was then loaded into the seismic trace headers. The data was re-sampled from 2 ms to 4 ms using a minimum phase, high fidelity anti-alias filter applied prior to resample. Further data reduction involved 2-to-1 Marine Trace Decimation after differential NMO, which increased the receiver spacing from 12.5 to 25 meters. To balance the amplitudes of the shot record, true amplitude recovery using a spherical divergence correction was used and applied to the whole shot record, based on a brute velocity function picked for the area. Band pass filtering (Ormsby 6-8-90-120) was also applied to the data, prior to NMO and stacking. Water bottom picks were automatically generated and manually QC’ed for the near channel. Trace editing involved killing any bad traces or shots based on Observer log comments and results of the QC.
21.5 Velocity Analysis Velocities were picked for every line at a 4 km interval using the ProMAX interactive velocity analysis package. This was comprised of a semblance display with RMS stacking velocity graph and interval velocity graph, CDP super gather panel and function stack panels. To improve the signal to noise ratio, super gathers were formed by combining 15 adjacent CDP gathers. Stack panels were created from these 15 CDPs using 31 functions varying +/- 35% from the regional velocity function of the first two sequences. Thereafter, the velocity functions of the nearest adjacent line shot in the same direction, were used as a guide.

Figure 21-1: Velocity analysis for sequence 017. Graphical user interface with semblance, super-CDP gather and function stacks. To speed up the on-screen velocity picking procedure, the velocity analysis displays were pre-computed. Normal move-out was applied to the gather to check that the events were lining up well. NMO corrected gathers were also displayed onscreen: both, at and between velocity locations, for further verification.
Figure 21-2: Velocity QC for sequence 017 using the Velocity Viewer/Point Editor to check for any errant picks.
Velocity table for each sequence was exported to ASCII format.
21.6 Brute Stack Brute stacks were produced as soon as possible after each line and presented to the onboard client to assess the noise impact on the data. A straight mean vertical stack algorithm was used for CDP stacking, with a root power scalar for normalization of 0.5. A bulk shift static correction was applied post-stack to correct for the gun and cable depths. Filtering was limited to a 6-8-90-120 Hz Ormsby band-pass filter. The raw brute stacks were captured to jpg and plotted to paper.
Bass Strait Oil Company Ltd Final Survey Report
AREA: T42P & T43P Tasmania, Australia 2008. Pacific Titan - Job 6374 Page 5

Figure 21-3: Brute stack for sequence 018 down to 6 seconds of data. Note string ringing.
21.7 QC Workflows This section describes the quality control steps that were taken. This acquisition QC allows for the onboard processors to find, log and analyse any potential problems with data acquisition. These were done in conjunction with the other onboard departments so as to maintain the highest possible standards of acquisition. The onboard QC workflows include a full set of quality controls used to detect seismic and positioning problems.
STEP DETAILS QC PROCEDURE/PRODUCT
Reformat to ProMAX internal format
Input full length record - 6000ms, 480 channels + 30 auxiliary channels
Check Job Listing for FFID/Shot numbering, Gun Seq, Main headers. Check for missing data
Noise Record Start And End Of Line. Ambient RMS Calculation
Check screen display and noise level Screen capture SOL & EOL records
Noise History Append Noise Calculation to History Screen capture Noise History – single display for entire project
Bass Strait Oil Company Ltd Final Survey Report
AREA: T42P & T43P Tasmania, Australia 2008. Pacific Titan - Job 6374 Page 6

Bass Strait Oil Company Ltd Final Survey Report
AREA: T42P & T43P Tasmania, Australia 2008. Pacific Titan - Job 6374 Page 7
STEP DETAILS QC PROCEDURE/PRODUCT
Raw Shots Display Every 1025m, 480 channels 6000ms
Check Channel Edits Check Data Quality
Auxiliary Channel QC Create Aux Channel Gathers Vertical Stack Gun Hydrophones for each Gun string
QC of Aux Channels Check for autofires, gun timing, air leaks
Near Trace Display Select First Channel and Display Check record length, data quality Screen capture
Shot vs Chan RMS Analysis
• Ormsby, Zero Phase, 4-8-90-120 Hz BPF applied. • 2 Windows: 50-500ms & 5450-5950ms. • Shot by shot Average Noise Calculation.
Check levels against job specs Check for bad channels Screen capture for both displays
RMS History Calculate Average for Sequence and append to RMS History File
Screen capture RMS History – single display for entire project
Trace Decimation Flow • Input Raw Shots • Apply Shot and Channel Edits based on Observer Logs and QC • -50ms static shift for Instrument Filter Delay • Ormsby, Minimum Phase, 4-8-90-120 Hz Band Pass Filter • Apply 2D Nominal Marine Geometry
Decimated shot display
Every 1250 m shot display on screen Check shots
Velocity Analysis Every 4 km, Semblance, Gathers, Variable Velocity Percentage Stack Panels
Pick velocities every 4km
Velocity QC
Start ProMAX Interactive Velocity QC and Editing tool.
Check velocity Field for Spikes and Picking errors. Display as Interval Velocities for additional QC
NMO gathers
Every 2km NMO CMP gathers on screen Check moveout of primaries.
Export Vels
Export Velocity Table to ASCII Save ASCII Vel file
Stack RMS Flow Calculate water column RMS value for posting on top of the stack
Shot Stack Flow Calculate average RMS level of each shot over entire line, measured within a window. Post in ProMAX database
QC for anomalous values
Screen capture
Channel Stack Flow Calculate average RMS level of each channel over entire line, measured within a window. Post in ProMAX database
QC for anomalous values
Screen capture

Bass Strait Oil Company Ltd Final Survey Report
AREA: T42P & T43P Tasmania, Australia 2008. Pacific Titan - Job 6374 Page 8
STEP DETAILS QC PROCEDURE/PRODUCT
Stack Flow • Input Decimated Shots
• Sort to CMP order
• Moveout with picked Velocity Field
• Surgical NMO mute
• 1/sqrt(n) fold compensated stack
• Apply Gun and Cable Statics
• 1/tv2
• amplitude recovery
• Ormsby, Minimum Phase, 4-8-90-120 Hz Band Pass Filter
Check quality of stack
Check completeness of Stack and corresponding SPs, FFIDs and CDPs
Screen capture
Stack Plot
Time Variable Amplitude Compensation QC of stack
SEG-Y stack
Write to SEG-Y & QC Save deliverable file
Nav Merge QC Merge lead trace of each cable with P190. Calculate direct arrival time and display over Seismic Near Trace Gather.
Check that predicted Direct Arrival Time closely follows the seismic data. Check that all traces have merged successfully.
End of Job
21.8 Noise Record and Channel RMS graph The noise records were recorded at the start and end of every line, and displayed for QC. Channel RMS values were computed for all 480 channels over the entire record for noise analysis, and graphed above the display. For every sequence the noise record at SOL and EOL was displayed on screen and archived to GIF format.
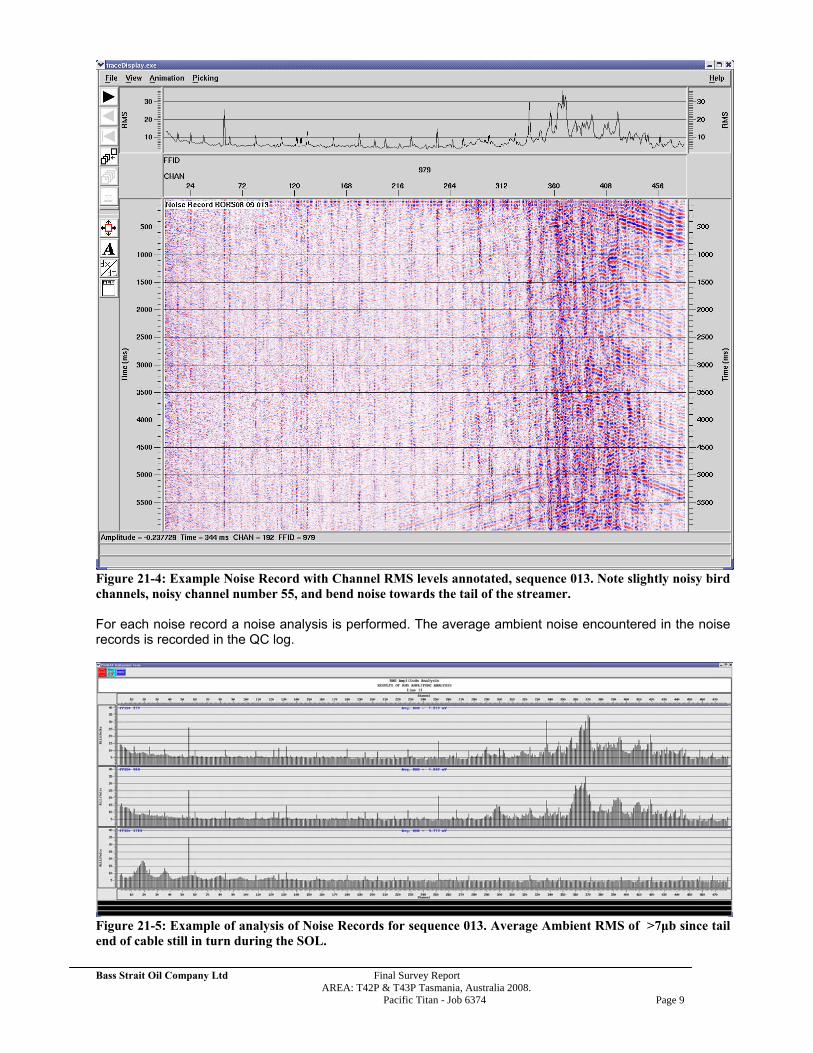
Figure 21-4: Example Noise Record with Channel RMS levels annotated, sequence 013. Note slightly noisy bird channels, noisy channel number 55, and bend noise towards the tail of the streamer. For each noise record a noise analysis is performed. The average ambient noise encountered in the noise records is recorded in the QC log.
Figure 21-5: Example of analysis of Noise Records for sequence 013. Average Ambient RMS of >7μb since tail end of cable still in turn during the SOL. Bass Strait Oil Company Ltd Final Survey Report
AREA: T42P & T43P Tasmania, Australia 2008. Pacific Titan - Job 6374 Page 9

Figure 21-6: Channel stack sequence 013. The display computes the average RMS of the last 500ms of each channel and writes it to the database.
Bass Strait Oil Company Ltd Final Survey Report
AREA: T42P & T43P Tasmania, Australia 2008. Pacific Titan - Job 6374 Page 10

Figure 21-7: Shot stack sequence 013. The display computes the average RMS of the last 500ms of each shot and writes it to database.
21.9 Ambient noise - Shot Vs Channel RMS Display Colour displays of Shot vs. Channel RMS values were produced for the whole cable for every line to assess the ambient noise level and the channel quality. Raw data with a sample rate of 1 ms was used to calculate the RMS values for every channel on every shot. RMS values were calculated from two windows, a shallow window of 50-500ms at the start of the record, and a deep window of 5450-5950ms at the end of the record. RMS values from all channels were averaged for each shot. They were displayed on the graph.
Bass Strait Oil Company Ltd Final Survey Report
AREA: T42P & T43P Tasmania, Australia 2008. Pacific Titan - Job 6374 Page 11
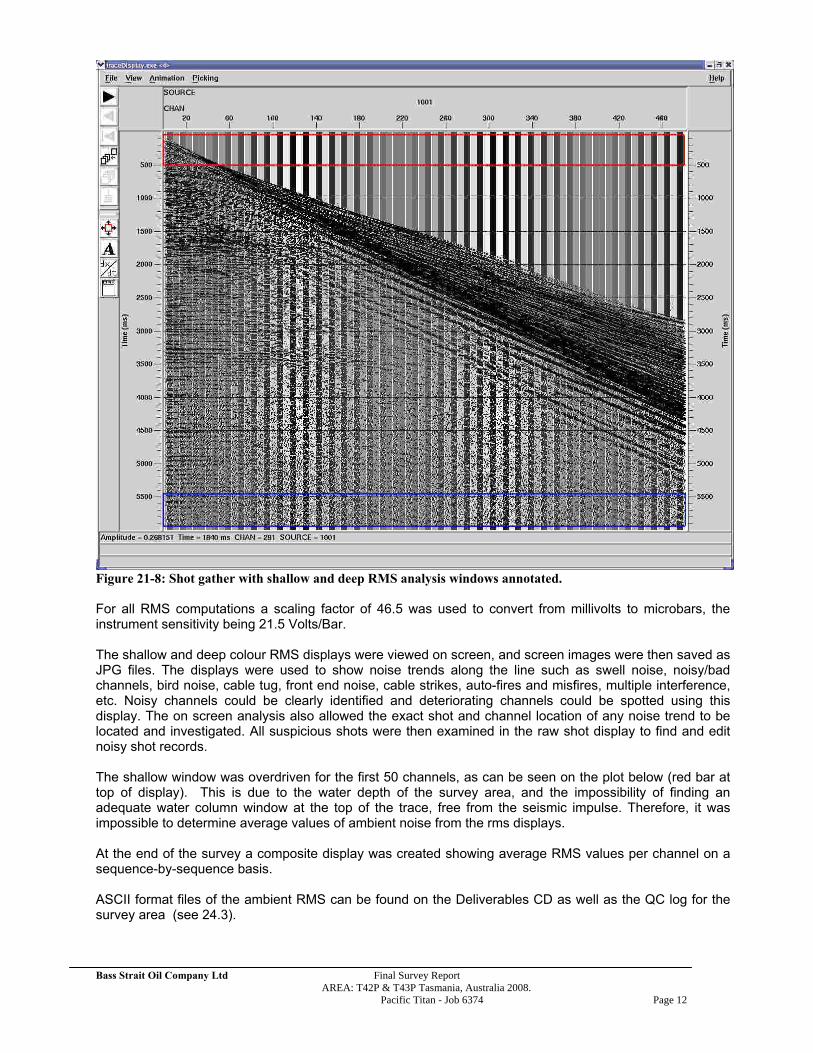
Figure 21-8: Shot gather with shallow and deep RMS analysis windows annotated.
For all RMS computations a scaling factor of 46.5 was used to convert from millivolts to microbars, the instrument sensitivity being 21.5 Volts/Bar. The shallow and deep colour RMS displays were viewed on screen, and screen images were then saved as JPG files. The displays were used to show noise trends along the line such as swell noise, noisy/bad channels, bird noise, cable tug, front end noise, cable strikes, auto-fires and misfires, multiple interference, etc. Noisy channels could be clearly identified and deteriorating channels could be spotted using this display. The on screen analysis also allowed the exact shot and channel location of any noise trend to be located and investigated. All suspicious shots were then examined in the raw shot display to find and edit noisy shot records. The shallow window was overdriven for the first 50 channels, as can be seen on the plot below (red bar at top of display). This is due to the water depth of the survey area, and the impossibility of finding an adequate water column window at the top of the trace, free from the seismic impulse. Therefore, it was impossible to determine average values of ambient noise from the rms displays. At the end of the survey a composite display was created showing average RMS values per channel on a sequence-by-sequence basis. ASCII format files of the ambient RMS can be found on the Deliverables CD as well as the QC log for the survey area (see 24.3).
Bass Strait Oil Company Ltd Final Survey Report
AREA: T42P & T43P Tasmania, Australia 2008. Pacific Titan - Job 6374 Page 12

Figure 21-9: Deep RMS window for sequence 017. Note the turn noise that affects channels 260-480 in SP 1001-1102, and noisy channel 55.
Bass Strait Oil Company Ltd Final Survey Report
AREA: T42P & T43P Tasmania, Australia 2008. Pacific Titan - Job 6374 Page 13

Figure 21-10: Example of Shallow rms window QC from sequence 014. The first 50 channels are dominated by direct arrival energy. Relatively low RMS values between SP 1050-1300 are caused by the vessel decreasing in speed. Note missed shot points in 1368, 1906 and 3801.
21.10 Near Trace Display The near traces were displayed on screen for every line in order to quickly determine any possible errors with acquisition, e.g. gun volume changes, bad records, time-break problems and any auto-fires not reported by the recording system. The near traces also provided a good indication of the geological conditions, including strength of the water bottom multiples, residual seismic multiple energy and swell noise contamination.
Bass Strait Oil Company Ltd Final Survey Report
AREA: T42P & T43P Tasmania, Australia 2008. Pacific Titan - Job 6374 Page 14
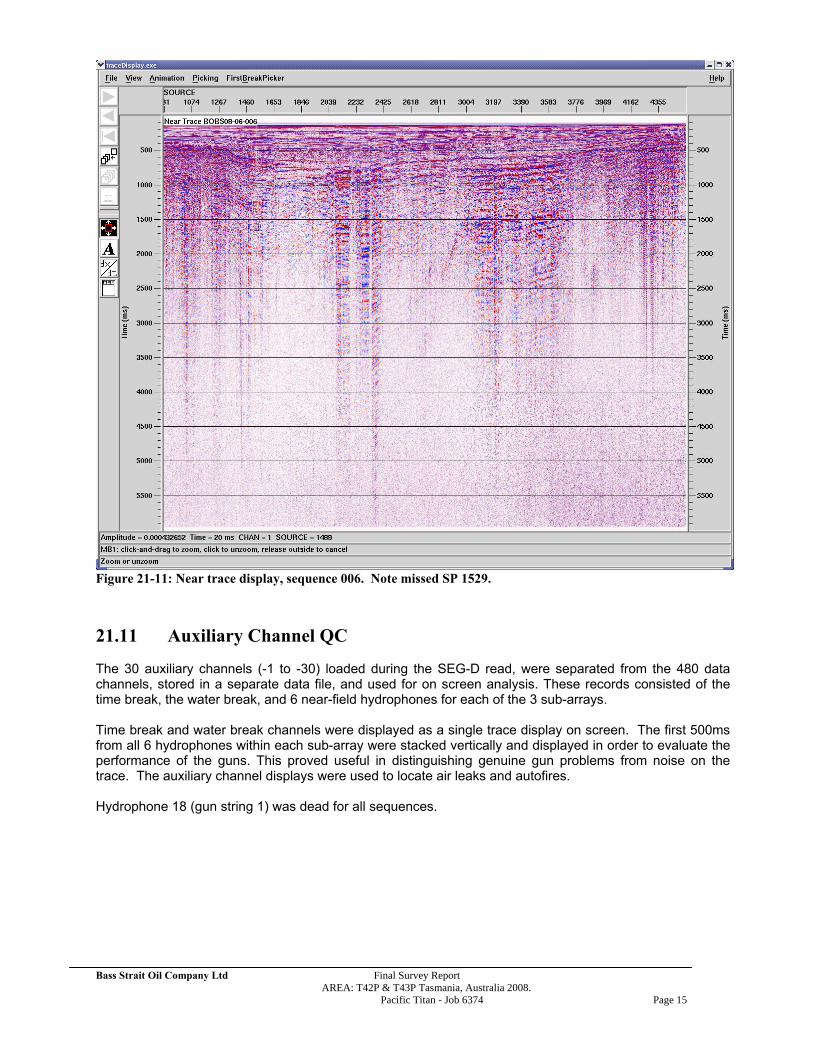
Figure 21-11: Near trace display, sequence 006. Note missed SP 1529.
21.11 Auxiliary Channel QC The 30 auxiliary channels (-1 to -30) loaded during the SEG-D read, were separated from the 480 data channels, stored in a separate data file, and used for on screen analysis. These records consisted of the time break, the water break, and 6 near-field hydrophones for each of the 3 sub-arrays. Time break and water break channels were displayed as a single trace display on screen. The first 500ms from all 6 hydrophones within each sub-array were stacked vertically and displayed in order to evaluate the performance of the guns. This proved useful in distinguishing genuine gun problems from noise on the trace. The auxiliary channel displays were used to locate air leaks and autofires. Hydrophone 18 (gun string 1) was dead for all sequences.
Bass Strait Oil Company Ltd Final Survey Report
AREA: T42P & T43P Tasmania, Australia 2008. Pacific Titan - Job 6374 Page 15

Figure 21-12: Timebreak QC (Auxiliary channel 1) for sequence 012.
Figure 21-13: Waterbreak hydrophone QC (Auxiliary channel 4) for sequence 012.
Bass Strait Oil Company Ltd Final Survey Report
AREA: T42P & T43P Tasmania, Australia 2008. Pacific Titan - Job 6374 Page 16

Figure 21-14: QC of vertically stacked near field hydrophones 1 to 6 on gunstring 1 (Auxiliary channels 13 to 18) of sequence 011. Note annotation of gun pressures and dead auxiliary 18. Gun volume change at SP 2455 is evident in auxiliary hydrophones 15 and 16.
Figure 21-15: QC of vertically stacked near field hydrophones 1 to 6 on gunstring 3 (Auxiliary channels 25 to 30). Note the decreased gun pressure starting at SP 2441 caused by a malfunctioning gun (gun 3-7) near auxiliary hydrophones 28 and 29.
Bass Strait Oil Company Ltd Final Survey Report
AREA: T42P & T43P Tasmania, Australia 2008. Pacific Titan - Job 6374 Page 17

21.12 Shot Record Displays Shot records were band pass filtered (Ormsby 6-8-90-120) and balanced with a true amplitude gain recovery. They were displayed every 500m for each line. Additional records were also examined on screen if an issue with acquisition was suspected, such as noise, residual seismic energy or auto-fires. The colour RMS displays were frequently used to pinpoint bad/suspicious shots, the shot gathers of which were subsequently investigated onscreen. Consistently noisy channels were also identified on the raw shot displays, and cross checked against the Observer Logs, which were modified if necessary.
Figure 21-16: Raw shots display on SP 1026 of sequence 017. Note the turn noise near the end of the cable.
21.13 Navigation Processing In order to QC the navigation data, the final processed P190 navigation files were merged with the near traces for each line. The predicted first break time was computed using the water velocity. This was displayed overlaid on the near trace as seen below (in red), to enable QC of the consistency between the predicted and the recorded first breaks.
Bass Strait Oil Company Ltd Final Survey Report
AREA: T42P & T43P Tasmania, Australia 2008. Pacific Titan - Job 6374 Page 18

Figure 21-17: Navigation QC display for sequence 012. 22 Encountered problems 22.1 Propeller Noise Channels 25 to 40 showed recurring coherent noise. The noise is affecting less than 10% of traces and has a maximum amplitude of 5-10μB. The most likely cause of this noise are water bottom reverberations of the propeller impulse. An investigational F-K filter effectively removes this noise with minimal data loss. More thorough testing and a meticulous surgical design of an F-K filter could further optimize noise removal and minimize data loss and introduction of artifacts.
Bass Strait Oil Company Ltd Final Survey Report
AREA: T42P & T43P Tasmania, Australia 2008. Pacific Titan - Job 6374 Page 19

Figure 22-1: Raw shot, zoomed in on the propeller noise. Note the coherent character of the noise. The following graphs show a noise record with annotated RMS and a Deep RMS window to further highlight the characteristics of the propeller noise.
Bass Strait Oil Company Ltd Final Survey Report
AREA: T42P & T43P Tasmania, Australia 2008. Pacific Titan - Job 6374 Page 20

Figure 22-2: SOL noise record for sequence 004 with annotated RMS graph on top of the record. Note propeller noise of 5-15μB on channels 25 to 40.
Figure 22-3: Deep RMS window for sequence 004. Note noise on channels 25 to 40.
22.2 Swell noise Bass Strait Oil Company Ltd Final Survey Report
AREA: T42P & T43P Tasmania, Australia 2008. Pacific Titan - Job 6374 Page 21
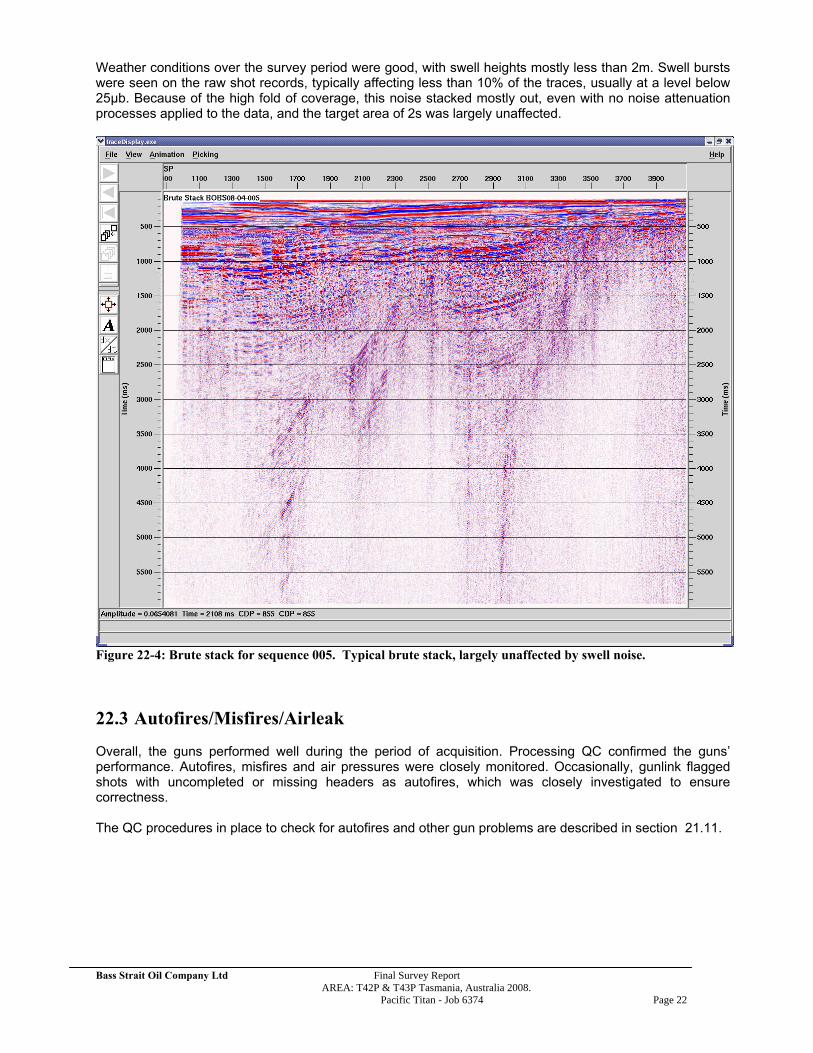
Weather conditions over the survey period were good, with swell heights mostly less than 2m. Swell bursts were seen on the raw shot records, typically affecting less than 10% of the traces, usually at a level below 25μb. Because of the high fold of coverage, this noise stacked mostly out, even with no noise attenuation processes applied to the data, and the target area of 2s was largely unaffected.
Figure 22-4: Brute stack for sequence 005. Typical brute stack, largely unaffected by swell noise.
22.3 Autofires/Misfires/Airleak Overall, the guns performed well during the period of acquisition. Processing QC confirmed the guns’ performance. Autofires, misfires and air pressures were closely monitored. Occasionally, gunlink flagged shots with uncompleted or missing headers as autofires, which was closely investigated to ensure correctness. The QC procedures in place to check for autofires and other gun problems are described in section 21.11.
Bass Strait Oil Company Ltd Final Survey Report
AREA: T42P & T43P Tasmania, Australia 2008. Pacific Titan - Job 6374 Page 22

Figure 22-5: QC of vertically stacked near field hydrophones 1 to 6 on gunstring 1 (Auxiliary channels 13 to 18) on sequence 007. Note dead hydrophone 18, no fire at SP 4461, and missing gun header on SP 4410 (reported as autofire by gunlink).
22.4 Turn noise On occasion the streamer was still in turn when the SOL noise files were recorded, due to the line run-in being constrained by safe navigation areas, with associated noise up to 150ub. This did not affect the chargeable SPs, only the noise records. Notes regarding the sequences affected can be found in the QC logs (see 24.3).
Bass Strait Oil Company Ltd Final Survey Report
AREA: T42P & T43P Tasmania, Australia 2008. Pacific Titan - Job 6374 Page 23

Figure 22-6: SOL noise display of sequence 017. Streamer still in turn while SOL noise records were taken.
22.5 Spiky Channels The number of bad channels did not exceed 1.3% for the entire survey. Channel 55 has been noisy for most of the survey. Additional channels 252, 7, and 255 were occasionally noisy. Other channel edits included those which failed the instrument tests based on observer logs as well as channels with reversed polarity. Further notes regarding the affected channels can be found in the QC logs (see 24.3).
Bass Strait Oil Company Ltd Final Survey Report
AREA: T42P & T43P Tasmania, Australia 2008. Pacific Titan - Job 6374 Page 24

reversed polarityfails instrumentation tests for more detailed info, see OBSERVER LINE LOGSnoisyeither dead or very noisyspiking
seq Q %1 7 59 85 242 337 452 6 1.32 7 59 85 242 337 452 6 1.33 0.04 59 91 242 337 4 0.85 51 55 242 337 452 5 1.06 51 55 242 337 452 5 1.07 51 55 242 337 452 5 1.08 51 55 242 337 452 5 1.09 51 55 242 255 337 5 1.0
10 51 55 242 337 4 0.811 51 55 242 337 4 0.812 51 55 242 252 337 5 1.013 51 55 242 252 337 5 1.014 51 55 242 252 337 5 1.015 51 55 242 337 4 0.816 51 55 242 337 4 0.817 51 55 85 242 337 5 1.018 51 55 85 242 252 337 6 1.3
channel
Figure 22-7: Channel edits.
22.6 Noise history display The following display shows the noise record history for all sequences, calculated from the SOL and EOL noise files. All channels for each noise record have been stacked together to a single trace, and these average channel values are annotated above the display. The streamer was still in turn during the taking of the start of line noise records for sequence 013, 014, 017 and 018.
Bass Strait Oil Company Ltd Final Survey Report
AREA: T42P & T43P Tasmania, Australia 2008. Pacific Titan - Job 6374 Page 25

Figure 22-8 : Noise history display for sequences 001 to 018.
22.7 RMS history displays The following display shows the line average RMS for each individual channel on the streamer for Sequences 001 to 018, calculated from the shallow RMS window at 50 to 500 ms.
Bass Strait Oil Company Ltd Final Survey Report
AREA: T42P & T43P Tasmania, Australia 2008. Pacific Titan - Job 6374 Page 26
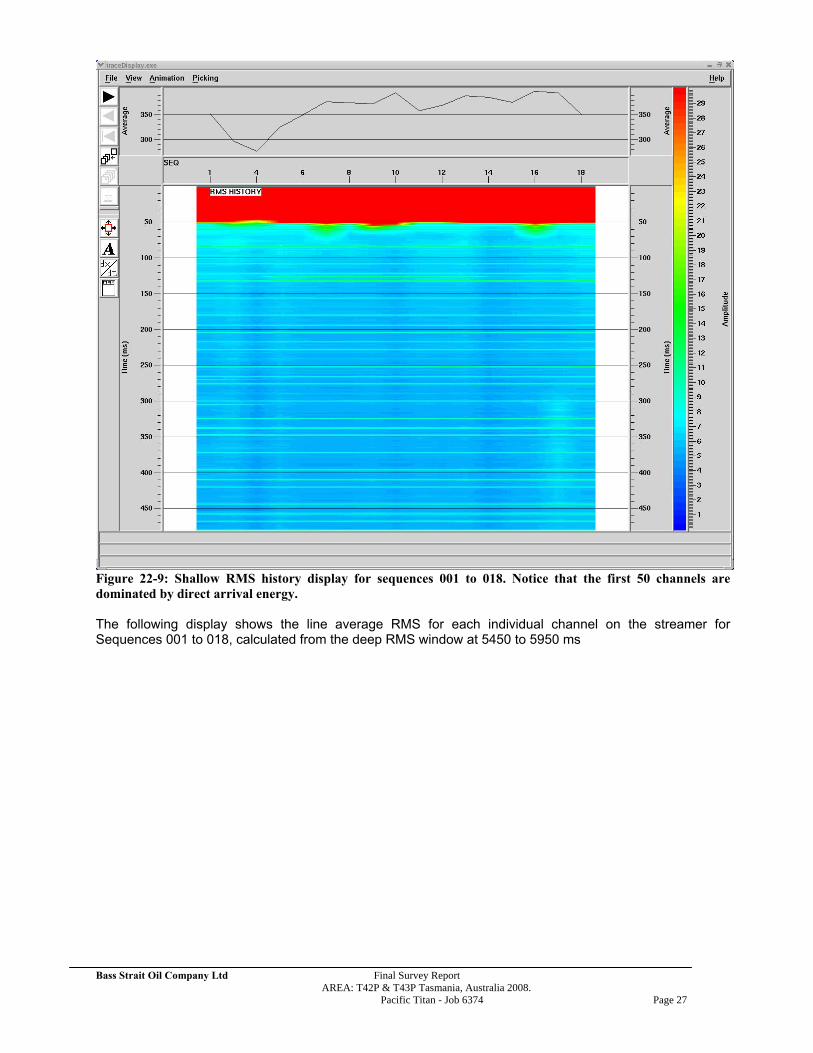
Figure 22-9: Shallow RMS history display for sequences 001 to 018. Notice that the first 50 channels are dominated by direct arrival energy. The following display shows the line average RMS for each individual channel on the streamer for Sequences 001 to 018, calculated from the deep RMS window at 5450 to 5950 ms
Bass Strait Oil Company Ltd Final Survey Report
AREA: T42P & T43P Tasmania, Australia 2008. Pacific Titan - Job 6374 Page 27

Figure 22-10 Deep RMS history display for sequences 001 to 018. 23 Conclusion Overall the data recorded on this survey was of good quality, helped by good acquisition conditions with low extraneous noise levels. A total of 18 sequences were shot and of good quality. Sequence 002 was not to be processed due to an airleak on gunstring 3. The number of bad channels did not exceed 1.3% for the entire survey. Some swell noise was evident, but the brute stacks were largely unaffected. The brute stacks showed good data quality mostly down to 3.0 seconds and contained dipping surfaces, truncated reflectors, diffractions, and multiples. Good evidence of the captured geology includes unconformities, onlapping features, anticlinal or folded structures, and fault planes. Signal penetration was good for the top half of the record, but poor beyond this, probably as a result of the high reflectivity of the intermediate layers. Strong multiples were observed.
Bass Strait Oil Company Ltd Final Survey Report
AREA: T42P & T43P Tasmania, Australia 2008. Pacific Titan - Job 6374 Page 28

Figure 23-1: Brute stack of sequence 005.
A QC log in Excel format detailing quality control analysis of each line was delivered to the client at the completion of the survey (see 24.3). 24 Appendices
24.1 SEGY Brute Stack Headers The following SEGY Stacks EBDIC header template was used. Items marked in bold differ from line to line. C 1 CLIENT: SEBOA CONSORTIUM COMPANY: CGG VERITAS C 2 SURVEY: GROUP SHOOT 2D AREA: EAST BASIN, OFFSHORE AUSTRALIA C 3 BOBS08-xx-0xx SP: xxxx-xxxx CDP: 1-xxxx C 4 DATA TRACES/STREAMER: 480 AUXILIARY TRACES/RECORD: 30 C 5 SAMPLE RATE: 2MS RECORD LENGTH: 6000ms C 6 RECORDING FORMAT: SEG-D 8058 REV 100 FILTERS: DIGITAL LOW CUT: ON C 7 ANALOG LOW CUT: 3 HZ 6 DB/OCTAVE HIGH CUT: 200 HZ 370 DB/OCTAVE C 8 STREAMER: SERCEL SEAL SOLID ACTIVE LENGTH: 6000 M C 9 GROUP INTERVAL: 12.5 M DEPTH: 8 M C10 SOURCE TYPE: BOLT AIRGUN VOLUME: 2130 CU IN C11 NO OF SUB ARRAY/SOURCE: 3 SUB ARRAY SEPARATION: 10 M C12 ARRAY PRESSURE: 2000 PSI ARRAY DEPTH: 6 M C13 Bass Strait Oil Company Ltd Final Survey Report
AREA: T42P & T43P Tasmania, Australia 2008. Pacific Titan - Job 6374 Page 29

Bass Strait Oil Company Ltd Final Survey Report
AREA: T42P & T43P Tasmania, Australia 2008. Pacific Titan - Job 6374 Page 30
C14 SEGY HEADER BYTES C15 Water Depth 185-188 C16 Line Number 189-192 C17 Cable 193-194 C18 Gun Sequence 195-196 C19 C20 SP ANNOTATED AT NEAR TRACE CDP C21 C22 PROCESSING: C23 C24 REFORMAT - SEGD TO PROMAX FORMAT C25 INSTRUMENT DELAY -50ms C26 SHOT AND CHANNEL EDITS BASED ON OBSERVER LOGS C27 BANDPASS FILTER, ORMSBY 6-8-90-120 HZ C28 RESAMPLE 2ms TO 4ms. HIGH FIDELITY ANTIALIAS FILTER C29 TRACE DECIMATION, 2:1, USING SINGLE NMO FUNCTION C30 TAR - T**2 CORRECTION C31 NMO, VELOCITIES PICKED AT 4 KM INTERVALS C32 CDP STACK, STRAIGHT MEAN SQUARE ROOT NORMALIZATION C33 GUN & CABLE STATIC 9ms C34 C35 CDP INTERVAL 12.5 METRES C36 C37 C38 MAY 2008
24.2 Shipments QC deliverables are included in the Primary and Copy Tape Shipments. The following QC products are being shipped to the client: Shipment No: PT-2008-040 (Primary data) Date: 1st June 2008 Contents cover Sequences: 1 to 18 1 x DVD containing QC Log File (MS Excel), Stack files (SEGY format), various QC screen displays (JPG format), velocities (ASCII format) and ambient noise (ASCII format) files. Shipped to:
Fugro Seismic Imaging Level 1, 69 Outram Street West Perth, WA 6005, Australia Attn: Phil Cook
Shipment No: PT-2008-041 Date: 1st June 2008 Contents cover Sequences: 001 to 018 1 x DVD containing QC Log File (MS Excel), Stack files (SEGY format), various QC screen displays (JPG format), velocities (ASCII format) and ambient noise (ASCII format) files. Shipped to:
Bass Strait Oil Company Level 1, 99 William Street Melbourne, Victoria 3000, Australia Attn: Keith Jackson

24.3 QC Line log A QC log was maintained for the duration of the project to monitor the workflows run, shot edits, problems encountered and any processing comments. This log file has been written to DVD, and u included in the final data shipment to the client.
Seq Line Date Dir FCSP LCSP no. o
f SPs
no. o
f CD
Ps
SEG
-D In
put
Noi
se R
ecor
ds
Raw
Sho
t Dis
play
Aux
iliar
y Q
C
RM
S D
ispl
ay S
hallo
w
RM
S D
ispl
ay D
eep
2D G
eom
etry
Pick
WB
Tim
es
Dat
abas
e
Nea
r Tra
ce Q
C
Trac
e D
ecim
atio
n
Stac
k R
MS
Velo
city
Ana
lysi
s
Cha
nnel
Sta
ck
Shot
Sta
ck
NM
O Q
C
Bru
te S
tack
Plot
Sta
ck
Arc
hive
Sta
ck &
Vel
Vels
to A
scii
RM
S A
rchi
ve
SEG
-Y S
tack
FTP
P190
P190
mer
ge /
QC
FTP
JPG
s
001 BOBS08-02-001 5-May 233° 3537 881 2657 5552 5/5 5/5 5/5 5/5 5/5 5/5 5/5 5/5 5/5 5/5 5/5 5/5 5/5 5/5 5/5 5/5 5/5 5/5 5/5 5/5 5/5 5/5 5/5 5/5 5/5002 BOBS08-04-002003 BOBS08-01-003 5-May 143° 2022 881 1142 2522 5/5 5/5 5/5 5/5 5/5 5/5 5/5 5/5 5/5 5/5 5/5 5/5 5/5 5/5 5/5 5/5 5/5 5/5 5/5 5/5 5/5 5/5 5/5 5/5 5/5004 BOBS08-03-004 5-May 326° 1001 2818 1818 3874 6/5 6/5 6/5 6/5 6/5 6/5 6/5 6/5 6/5 6/5 6/5 6/5 6/5 6/5 6/5 6/5 6/5 6/5 6/5 6/5 6/5 6/5 6/5 6/5 6/5005 BOBS08-04-005 25-May 057° 1001 4080 3080 6398 25/5 25/5 25/5 25/5 25/5 25/5 25/5 25/5 25/5 25/5 25/5 25/5 25/5 25/5 25/5 25/5 25/5 25/5 25/5 25/5 25/5 25/5 25/5 25/5 26/5006 BOBS08-06-006 26-May 235° 4545 881 3665 7568 26/5 26/5 26/5 26/5 26/5 26/5 26/5 26/5 26/5 26/5 26/5 26/5 26/5 26/5 26/5 26/5 26/5 26/5 26/5 26/5 26/5 26/5 26/5 26/5 26/5007 BOBS08-12-007 26-May 059° 1001 4711 3711 7660 26/5 26/5 26/5 26/5 26/5 26/5 26/5 26/5 26/5 26/5 26/5 26/5 26/5 27/5 27/5 27/5 27/5 27/5 27/5 27/5 26/5 27/5 26/5 26/5 27/5008 BOBS08-10-008 27-May 235° 4526 881 3646 7530 27/5 27/5 27/5 27/5 27/5 27/5 27/5 27/5 27/5 27/5 27/5 27/5 27/5 27/5 27/5 27/5 27/5 27/5 27/5 27/5 27/5 27/5 27/5 27/5 27/5009 BOBS08-14-009 27-May 061° 1001 4794 3794 7826 27/5 27/5 27/5 27/5 27/5 27/5 27/5 27/5 27/5 27/5 27/5 27/5 27/5 27/5 27/5 27/5 28/5 28/5 28/5 27/5 27/5 28/5 27/5 27/5 28/5010 BOBS08-16-010 28-May 234° 2890 881 2010 4258 28/5 28/5 28/5 28/5 28/5 28/5 28/5 28/5 28/5 28/5 28/5 28/5 28/5 28/5 28/5 28/5 28/5 28/5 28/5 28/5 28/5 28/5 28/5 28/5 28/5
011 BOBS08-05-011 28-May 322° 1001 3123 2123 4484 28/5 28/5 28/5 28/5 28/5 28/5 28/5 28/5 28/5 28/5 28/5 28/5 28/5 28/5 28/5 28/5 28/5 28/5 28/5 28/5 28/5 28/5 28/5 28/5 28/5
012 BOBS08-07-012 28-May 142° 2921 881 2041 4320 28/5 28/5 28/5 28/5 28/5 28/5 28/5 28/5 28/5 28/5 28/5 28/5 29/5 28/5 28/5 29/5 29/5 29/5 29/5 29/5 28/5 29/5 28/5 28/5 29/5013 BOBS08-09-013 29-May 327° 1001 3779 2779 5796 29/5 29/5 29/5 29/5 29/5 29/5 29/5 29/5 29/5 29/5 29/5 29/5 29/5 29/5 29/5 29/5 29/5 29/5 29/5 29/5 29/5 29/5 29/5 29/5 29/5014 BOBS08-15-014 29-May 147° 4002 881 3122 6482 29/5 29/5 29/5 29/5 29/5 29/5 29/5 29/5 29/5 29/5 29/5 29/5 29/5 29/5 29/5 29/5 29/5 29/5 29/5 29/5 29/5 29/5 29/5 29/5 29/5
015 BOBS08-17-015 30-May 327° 1001 3781 2781 5800 30/5 30/5 30/5 30/5 30/5 30/5 29/5 30/5 30/5 30/5 30/5 30/5 30/5 30/5 30/5 30/5 30/5 30/5 30/5 30/5 30/5 30/5 30/5 30/5 30/5
016 BOBS08-13-016 30-May 147° 3612 881 2732 5702 30/5 30/5 30/5 30/5 30/5 30/5 30/5 30/5 30/5 30/5 30/5 30/5 30/5 30/5 30/5 30/5 30/5 30/5 30/5 30/5 30/5 30/5 30/5 30/5 30/5017 BOBS08-11-017 31-May 326° 1001 3543 2543 5324 30/5 31/5 31/5 31/5 31/5 31/5 30/5 31/5 31/5 31/5 31/5 31/5 31/5 31/5 31/5 31/5 31/5 31/5 31/5 31/5 31/5 31/5 31/5 31/5 31/5018 BOBS08-08-018 31-May 236° 4906 881 4026 8290 31/5 31/5 31/5 31/5 31/5 31/5 31/5 31/5 31/5 31/5 31/5 31/5 31/5 31/5 31/5 31/5 31/5 31/5 31/5 31/5 31/5 31/5 31/5 31/5 31/5
Figure 24-1: Onboard QC Workflow Log.
Bass Strait Oil Company Ltd Final Survey Report
AREA: T42P & T43P Tasmania, Australia 2008. Pacific Titan - Job 6374 Page 31

Seq Line SHOTS STACK001 BOBS08-02-001 Av. Ambient RMS: 6.0 μb. Slight random burstout from SOL-SP2605. Good stack, with some minor swell bursts.002 BOBS08-04-002003 BOBS08-01-003 Av. Ambient RMS: 5.0 μb. Good stack004 BOBS08-03-004 Av. Ambient RMS: 5.1 μb. Good stack005 BOBS08-04-005 Av. Ambient RMS: 5.4 μb. Good stack006 BOBS08-06-006 Av. Ambient RMS: 6.0 μb. Good stack007 BOBS08-12-007 Av. Ambient RMS: 5.1 μb. Good stack008 BOBS08-10-008 Av. Ambient RMS: 5.6 μb. Good stack009 BOBS08-14-009 Av. Ambient RMS: 6.0 μb. Good stack010 BOBS08-16-010 Av. Ambient RMS: 4.9 μb. Good stack011 BOBS08-05-011 Av. Ambient RMS: 5.4 μb. Good stack012 BOBS08-07-012 Av. Ambient RMS: 5.7 μb. Good stack013 BOBS08-09-013 Av. Ambient RMS >7 μb at SOL d/t turn noise, decreasing to 5.8μb at EOL. Good stack014 BOBS08-15-014 Av. Ambient RMS >7 μb at SOL d/t turn noise, decreasing to 4.9μb at EOL. Good stack015 BOBS08-17-015 Av. Ambient RMS: 5.1 μb. Good stack016 BOBS08-13-016 Av. Ambient RMS: 5.9 μb. Good stack017 BOBS08-11-017 Av. Ambient RMS >25 μb at SOL d/t turn noise, decreasing to 5.6μb at EOL. Turn noise stacks below 3.5sec from SOL to SP 1102018 BOBS08-08-018 Av. Ambient RMS: 6.4 μb., slight increase in RMS between SPs 3300 and 4100 Good stack
Figure 24-2: Quality section of QC log.
Seq Line
Bad Shots: MSP - missed SP (not fired); REC - not recorded SP or bad due to recording system; GAF - gun autofire; GNF - gun no fire; GTE - gun timing error >1.5ms; NOR - noise on record out of specs; NAV - nav error or missing nav header; SE - spread error
Bad Channels : i=Failes Instrument Tests, n=Noisy, r=Reversed Polarity, s=Spiking, d=Dead for more detailed info, see OBSERVER LINE LOGS
1 BOBS08-02-001 NO HEADER: 3242,2734,1367,1275. MSP: 894. GNF: 1017,1010,1004,1002,1000,997. 7n,59r,85i,242i,337i,452i
2 BOBS08-04-0023 BOBS08-01-003 NO HEADER: 1667,922 7n,59r,85i,242i,337i,452i4 BOBS08-03-004 NO HEADER: 1993,2690. 7n,59r,85i,242i,337i,452i5 BOBS08-04-005 NO HEADER: 1284,1890 51i,55n,242i,337i,452i
6 BOBS08-06-006 NO HEADER: 4347,4081,3649,3256,2777,2453,2287,1708,1474,1378,1133 MSP: 1529 51i,55n,242i,337i,452i
7 BOBS08-12-007 NO HEADER: 1007,1339,2575,2659,2782,3554,3641,3765,3769,4410, MSP:4461 51i,55n,242i,337i,452i
8 BOBS08-10-008 NO HEADER: 4228,4065,4031,3720,3419,2847,2533,1744,1080 51i,55n,242i,337i,452i9 BOBS08-14-009 NO HEADER: 1175,1562,2256,2547,3099,3426 MSP:4433 51i,55n,242i,255n,337i
10 BOBS08-16-010 NO HEADER: 2350,1625,1420 MSP: 1868,1148 51i,55n,242i,337i11 BOBS08-05-011 NO HEADER: 2127,2194,2804,2934 51i,55n,242i,337i12 BOBS08-07-012 NO HEADER: 1602 MSP: 2531,2111 51i,55n,242i,252n,337i13 BOBS08-09-013 NO HEADER: 1122 51i,55n,242i,252n,337i14 BOBS08-15-014 NO HEADER: 1990,1952, 1861, 1117, MSP: 3801,1906,1368 51i,55n,242i,252n,337i15 BOBS08-17-015 NO HEADER: 1455,2542,3219 MSP: 2492 51i,55n,242i,337i16 BOBS08-13-016 NO HEADER: 2879,1973, MSP: 1662, GTE: 2282 51i,55n,242i,337i17 BOBS08-11-017 NO HEADER: 1322,1599,1895,3196,3380 51i,55n,85i,242i,337i
18 BOBS08-08-018 NO HEADER: 4692,4029,3089,2704,1926,1714,1145 MSP: 2995,2847 51i,55n,85i,242i,252n,337i Figure 24-3: Shot and Channel Edit Log.
Bass Strait Oil Company Ltd Final Survey Report
AREA: T42P & T43P Tasmania, Australia 2008. Pacific Titan - Job 6374 Page 32
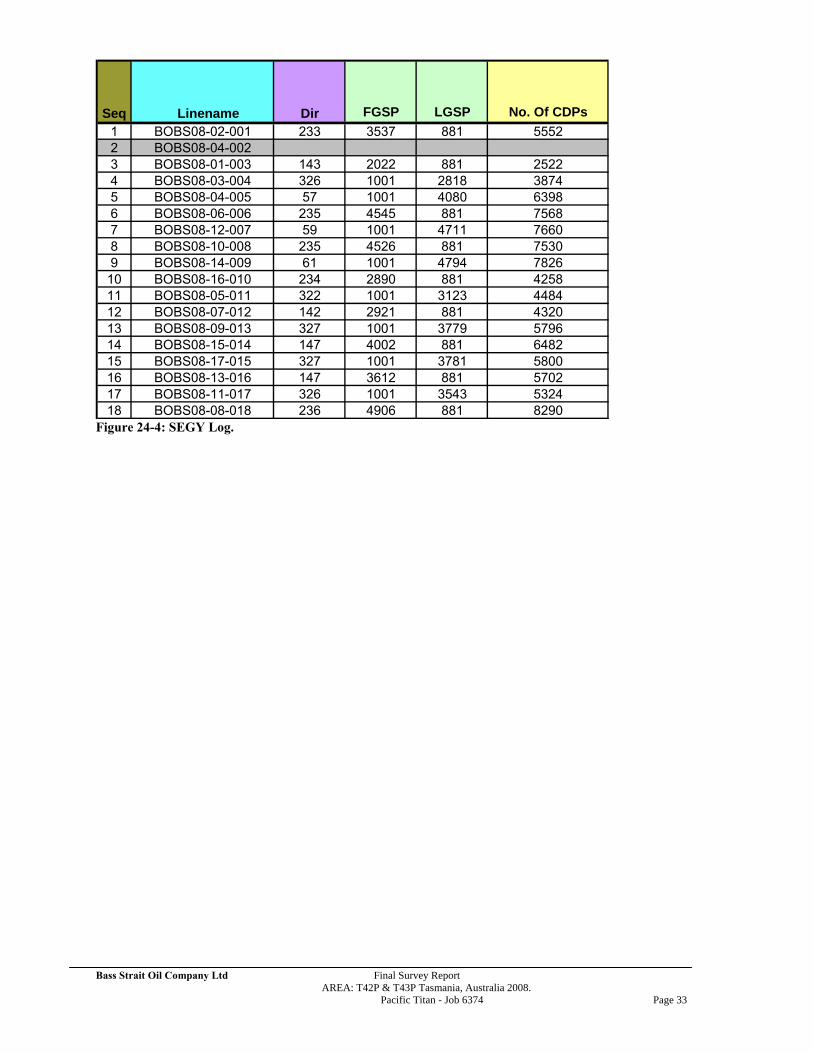
Seq Linename Dir FGSP LGSP No. Of CDPs1 BOBS08-02-001 233 3537 881 55522 BOBS08-04-0023 BOBS08-01-003 143 2022 881 25224 BOBS08-03-004 326 1001 2818 38745 BOBS08-04-005 57 1001 4080 63986 BOBS08-06-006 235 4545 881 75687 BOBS08-12-007 59 1001 4711 76608 BOBS08-10-008 235 4526 881 75309 BOBS08-14-009 61 1001 4794 7826
10 BOBS08-16-010 234 2890 881 425811 BOBS08-05-011 322 1001 3123 448412 BOBS08-07-012 142 2921 881 432013 BOBS08-09-013 327 1001 3779 579614 BOBS08-15-014 147 4002 881 648215 BOBS08-17-015 327 1001 3781 580016 BOBS08-13-016 147 3612 881 570217 BOBS08-11-017 326 1001 3543 532418 BOBS08-08-018 236 4906 881 8290
Figure 24-4: SEGY Log.
Bass Strait Oil Company Ltd Final Survey Report
AREA: T42P & T43P Tasmania, Australia 2008. Pacific Titan - Job 6374 Page 33