on workplace safety - federal aviation administration · thomas f. hilton civil aeromedical ......
TRANSCRIPT
DOT/FAA/AM-97/8
Office of Aviation Medicine Washington, D.C. 20591
IIIIIIIIIIIIIUnJIUI 0 m11 PB99-122061
Where the Safety Rubber Meets the Shop FJoor: A Confirmatory Model of Management Influence on Workplace Safety
Richard C. Thompson Thomas F. Hilton
Civil Aeromedical Institute Federal Aviation Administration Oklahoma City, Oklahoma 73125
L.Alan Witr
Barnett Banks, Inc. Jacksonville, Florida
March 1997
Final Report
This document is available to the public through the National Technical Information Service, Springfield, Virginia 22161.
U.S. Department of Transportation Federal Aviation Administration
NOTICE
This document is disseminated under the sponsorship of the U.S. Department of Transportation in the interest of
information exchange. The United States Government assumes no liability for the contents or use thereof.
PROTECTED UNDER INTERNATIONAL COPYRIGHT AU. RIGHTS RESERVED. NATIONAL TECHNICAL INFORMATION SERVICE U.S. DEPARTMENT OF COMMERCE

Technical Report Documentation Page I. Roport No. ; 3. RKiphutt's Cat.:og No. DOT/FAA/AM-97/8 PB99-l.2206l. 4. Tnle ond Subtit,_ 5. Report Dot• Where the Safety Rubber Meets the Shop Floor: A Confirmatory March 1997 Model of Management In.Ouence on Workplace Safety 6. Performing Organization Code
7. """""''' B. Ptrforrning Org~niution Report No.
Thompson, R.C., Ph.D.; Hilton, T.F., Ph. D.; and Win, L.A., Ph.D.' 9. Performing Organilzetion Name .nd Addrtlu 10. Work Unit No. CTRAIS)
FAA Civil Aeromedical Institute 'Barnett Banks, lnc. P.O. Box 25082 Jacksonville, FL 11. Contract or Grant No.
Oklahoma Cirv, OK 73125 12. Spollloring Agoncy neme ond Address 1 3. Type of Report and Period Covered
Office of Aviation Medicine Federal Aviation Administration 800 Independence Ave., S.W. Washingron, DC 20591 14. Sponsoring Agency Code
15. SUpplomentol Notll
16. Abltract
The role ofmanagement in establishing a safe work environment remains a topic that receives less attention in the literature than it deserves. Many authors have focused on safety p~s and associated indications of hrogram elfecrs. Pcesccipciw: articles advocating vacious management aviors abound. However, there is tili: empirical evidence that validates the important role management plays in establishing a climate that
sustains safe job behaviors. There is even less information about how management influences the safety atmosphere of the workplace. This paper presents a model that links management support, organizational climate, and self-retorted safety outcomes. Confirmatory factor analysis results indicate that man~erial influence on safety ehaviors varies as a function of man:r;ement role (manager/ supervisor) and sa ty outcomes (safety conditions/safety compliance). We deve oped the model on data collected in 1992 and confirmed it on data collected in the same organization (the Federal Aviation Administration's Logistics Center) in 1995. Results underscore the important role management plays in maximizing workplace safety.
17. Koy- 18. Distribution Statement
Organizational Climate, Safety Climate, Document is available to the public through the Safett Perceptions National Technical Information Service
Springfield, Virginia 22161 18. Security Clouil. lol tllit '-'' 20. Socurity Clluil. (of this pogol 21. No. of PI~S 22. Price
Unclassified Unclassified 12 Form DOT F 1700.7 (8· 721 Reproduction of completed page authorized
WHERE THE SAFETY RuBBER Mms THE SHOP FLOoR:
A CoNFIRMATORY MoDEL OF MANAGEMENT INFLUENCE ON WoRKPLACE SAFETY
INTRODUCTION
There has been little empirical research into under· standing how managers can promote workplace safety (e.g., Myers &: Facteau, 1992). However, it is well established that management's actions affect employee perceptions of their organization and its safety priorities (Cohen, 1977; Myers&: Facteau, 1992; Tuttle, Dachler, &: Schneider, 1975; Zohar, 1980). Manage· ment can communicate what is important in explicit and tangible ways through stated goals, rewarding job behaviors, establishing policies and procedures, etc. Each of these actions, in turn, contributes to an organization's climate (Schneider&: Rentsch, 1988). The climate of every organization includes a safety component.
When safety researchers examine organizational climate, their primary focus is usually to relate general components of an organization's climate (e.g., com· munication, management concern, management trust) to safety outcomes (Brown & Holmes, 1986; Coyle, Sleeman, & Adams, 1995; Dedobbeleer &: Beland, 1991; Zohar, 1980). Because safety is rarely the focus of climate research, there has been little attention paid to how managers can influence their organization's climate to improve workplace safety. Without some dynamic model to indicate how climate relates to
safety, it is difficult for managers to understand their role in creating and maintaining a safe workplace. This might help to explain why many managers express concern that despite stated support for their safety programs, workplace safety does not seem to improve.
Cohen, Smith, and Cohen (1975), Cleveland, Cohen, Smith, and Cohen (1978), and Janssens, Brett, and Smith (1995) have all demonstrated that management involvement and support are significant factors in establishing and maintaining a safe workplace. A number of authors have even linked workplace safety to management behaviors and various
1
organizational climate factors (e.g., Dejoy, 1985,1994; Myers & Facteau, 1992; Zohar, 1980). Yet, despite the widespread acceptance that organizational climate and management support for safety are related to workplace safety, very little research has been conducted to explore the nature of the relationship between these variables. This paper attempts to model the relationship between climate, management support for safety, and workplace safety.
Focus discussions with shop floor employees indicated a vague perception that management policy and practice often sent inconsistent messages. This inconsistency in actions and wor<is led employees to question priorities and whether safe behaviors were likely to be rewarded. Witt, Helman, and Hilton (I 994) formulated the hypothesis that three climate factors might be strongly influencing safety: (a) confusion over organizational goals (goal incongruence), (b) the perception that it would be impolitic to elevate safety issues to management (politics), and (c) the perception that elevated safety concerns might not be given a fair hearing (fairness).
Goal Congruence Vancouver and Schmidt (I 991) demonstrated that
lack of workforce-management congruence about organizational goals can adversely impact workforce perceptions. Goal incongruence can also affect other climate-related outcomes (Schneider, 1987}. Policypractice inconsistency can have other effects. For instance, Dejoy (1985, 1994) pointed out that employee attributions about management intentions can be a key influence on safety perceptions. For example, if management is perceived as willing to set aside safe practices to meet production goals, employees arc likely to attribute management's support for safety as being perfunctory. This could lead some employees to conclude tnat cutting corners will be rewarded.

Organizational !"olitics Organizational politics involves influencing the
decision making of others in an organization through means outside the formal organizational structure (Drory & Romm, 1990). Politics can include such actions as social ingratiating, hiding agendas, or not elevating unpleasant or controversial matters. Political behavior is generally perceived to be a negative attribute that communicates the political actor's needs ue bein1 pla.c:ed above the needs of the organization and other individuals (Drory & Romm, 1990; Gandz & Murray, 1980). Also, managers report that organizational politics occurs more frequently at middle and upper management levels (Madison, Allen, Porter, & Renwick,1980). Generally, KacmarandFerris (1991) have shown that there are various dimensions associated with the politics construct. The dimension consideredmostrelevantto safety was the "go along to get ahead" dimension, which emphasized not sending disagreeable messages to management. The general level of political behavior in an organization has been shown to influence the degree to which employees believe and trust what management says (Cohen, 1977; Kumar & Ghadially, 1989).
Faime•• Fairness, like politics, is a multidimensional con
cept. In the present case, we examined what Greenberg (1993) calls "interactional justice. • Interactional justice occurs when employees believe that concerns they elevate to their supervisor will be given a fair hearing by management. Reports by Bies and Moag (1986), Bies and Shapiro (1987), Shapiro (1993), and Shapiro and Brett (1991) have each demonstrated a relationship between perceived interactional fairness and levels of compliance with organizational procedures and rules. It follows that compliance with safety procedures and rules would be affected by perceived fairness in theworkplace.
Management Support for Safety While a number of dimensions have been found to
be related to safety climate, management support for safety stands out as a common factor (Brown & Holmes, 1986; Coyle, Sleeman, & Adams, 1995; Dedobbeleer & Beland, 1991; Zobar, 1980). Managemcntsupporrforsafetycan take two forms because
2
both managers and supervisors comprise management. Managers generally indicate their safety support indirectly. They establish priorities (i.e., policies, procedures, and goals), set production schedules that may accommodate to safe operations, and they control the incentives for complying with those priorities (e.g., compensation, awards, discipline). Supervisors, on the other hand, are the conduit linking management safety concerns to the shop floor. Therefore, they indicate management support for safety relatively more directly than do mangers (Kozlowski & Doherty, 1989). Supervisors monitor compliance wirh management's direction, and they provide feedback to employees regarding the appropriateness of rheir behaviors. Supervisors also provide input ro management regarding employee compliance or negligence (Niskanen, 1994). Such visible actions on the part of · supervisors more directly communicate management support for safety than many actions taken by managers.
Safety Outcome• Another important issue relates to identifying mea
sures that are indicative of workplace safety. Vojtecky and Schmitz (1986) reported results from a survey of 124 occupational health practitioners, indicating that the assessment of safety criteria presented a barrier in determining the effectiveness of most safety programs. Common sense would dictate that observed accident rates present an indisputable direct outcome measure for safety interventions. However, such measures are often problematic. There are four factors that can affect reliability: restriction of variance, random influences, inaccurate reporting, and variability in accident severity. First, because accidents are nor· mally rare events, accident rate data can be statistically unreliable due to restriction of variance (e.g .. Menckel & Carter, 1985; Zohar, 1980). Second, accidents are not always under the control of job incumbents. No matter· how compliant employees may be with safety procedures, extraneous random influences can cause or contribute to accidents. Therefore, uncontrollable events can also produce unreliability, especially if restriction of variance is a problem. Third, accidents are not always consistently recorded. There can be incentives for both the over reponing and under reporting of accidents. Either under reponing, over

reporting, or both can lead to unreliable measures. · Follnh, the l~el of accident SI:Vetity can affect reliability. Washing out sawdust from an employee's eye might go unrecorded, whereas surgical removal of a sliver from an employee's eye is more likely to become a matter of record. One observable alternative to accident rates is the cost of an accident, but cost data can be more WlJ"dillhJe than rates. An accident must be recorded before a cost can be estimated, and estimates themselves involve judgment {e.g., does one include insurance, lost time f~om work, interrupted productivity?). A second alternative is a safety audit, however, audits are costly to conduct and rest upon observable conditions. A frequent weakness of audits is a lack of connection to behaviors. Moreover, audit data are often subject to unreliability caused by the four factors mentioned above.
Self reports of safety behaviors and perceptions offer an alternative criterion measure for determining workplace safety (e.g., Dejoy,l994: Hofmann, Jacobs & Landy, 1995: Janssens, Brett & Smith, 1995). Although common method variance can inflate validities, it is possible to estimate their reliability ( Cronbach, 1951). Safety perceptions are more likely to be valid in the one-tailed sense. When accident
0 rcaaiaal:ioaa1
Supervisor Fairness
x' ( 47) = 88.95
~.8)
.16 (t=2.3)
4 Figure 1. Results of Path Analysis
3
rates are very rare, responden·tS might over estimate their safety out of <:omp\a.:ency. However, it is hard t<>
believe that anonymous respondents would underestimate their level of safety if people around them were being injured on a regular basis.
HYPOTHESES
Witt, Helman, and Hilton (1994) established that management support for safety can mediate the relationship between climate and safety outcomes. Figure 1 presents the results of their path analysis. Although Figure 1 establishes a relationship between climate, management support, and safety, it provides limited insight into the dynamics of management's role in influencing safety. In this study, we therefore pursued several additional hypotheses that followed from Witt, Helman, and Hilton.
Following the literature reviewed above, we first hypothesized that the politics-safety relationship would be mediated by manager support for safety,c.whereas the fairness-safety relationship would be mediated by supervisor support for safety. Second we hypothesized that the managerial suppon mediation effect would be more pronounced in relationship to perceived

p
safety conditions, whereas the mediator effect of supervisor support would be most pronounced in relationship to perceived safety compliance. Third, we hypothesized that this expanded model would successfully replicate on a second data set.
METHOD
A safety climate survey was administered at the Federal Aviation Administration's {FAA) Logistics Center in 1992 and 1995. The Logistics Center provides spare parts for all FAA air navigation aids, air uaffic control equipment, and FAA facility physical plant materials {e.g., air conditioner parts, back-up generator parts). In addition to its warehousing mission, the Center includes a large fabrication shop for altering or manufacturing unique replacements, as well as a large administtative office to coordinate requests for parts and equipment, to purchase equipment and raw materials, as well as to ship new, fabricated, or repaired materials.
The 1995 survey was a shorter version of the 1992 survey. The 1992 sample consisted of350 of the 507 ( 69%) employees who volunteered to complete the survey. The 1995 sample consisted of 329 of the 662 (50%) employees who volunteered to complete the survey during a mandatoty monthly safety meeting. The dimensions of interest on both surveys consisted of perceptions of organizational politics, interactional fairness, manager and supervisor support for safety, and perceptions of safety conditions and workforce compliance with safety. The items common to both surveys were nearly identical. However, the 1992 measures of safety perceptions and management supponforsafety (see Figure 1) were rescored in 1995 to create .separate measures of safety conditions and safety compliance, and manager and supervisor support for safety, respectively. Finally, goal congruence, which was assessed in the 1992 survey, was dropped in 1995 (to reduce the time and administrative complexity of the survey, at management's request). Assessment of congruence required using four separate questionnaires. Based upon the small conuibution of congruence presented in Figure 1, we agreed not to assess congruence in 1995.
4
Measures Politics was measured using a four-item scale based
upon the Kacmar and Ferris (1991). "go along to get along" construct (e.g., "Some employees may hesitate to speak up for fear of retaliation."). Fairness was measured usingafour-itemscale based upon Shapiro's (1993) notion of interactional fairness (e.g., "My supervisor considers my viewpoint when making decisions that affect me."). Manager support for safety was measured using a four-item scale following Dedobbeleer and Beland (1991; e.g., "Management places worker safety as a top priority."). Supervisor support for safety used. a four-item scale, also after Dedobbeleer and Beland (e.g., "My supervisor tells
· management about unsafe situations.")_. Safety outcomes included a four-item scale that as.<ed about safety conditions (e.g., "Aisles/passageways and working areas are free of uipping hazards. Compliance with safety rules (e.g., "To what extent do most people in your section use equipment designed to protect themselves."). All items were measured on five-point (suongly disagree to strongly agree) Liken-type scales. Accident rate data were also obtained from organization records.
RESULTS
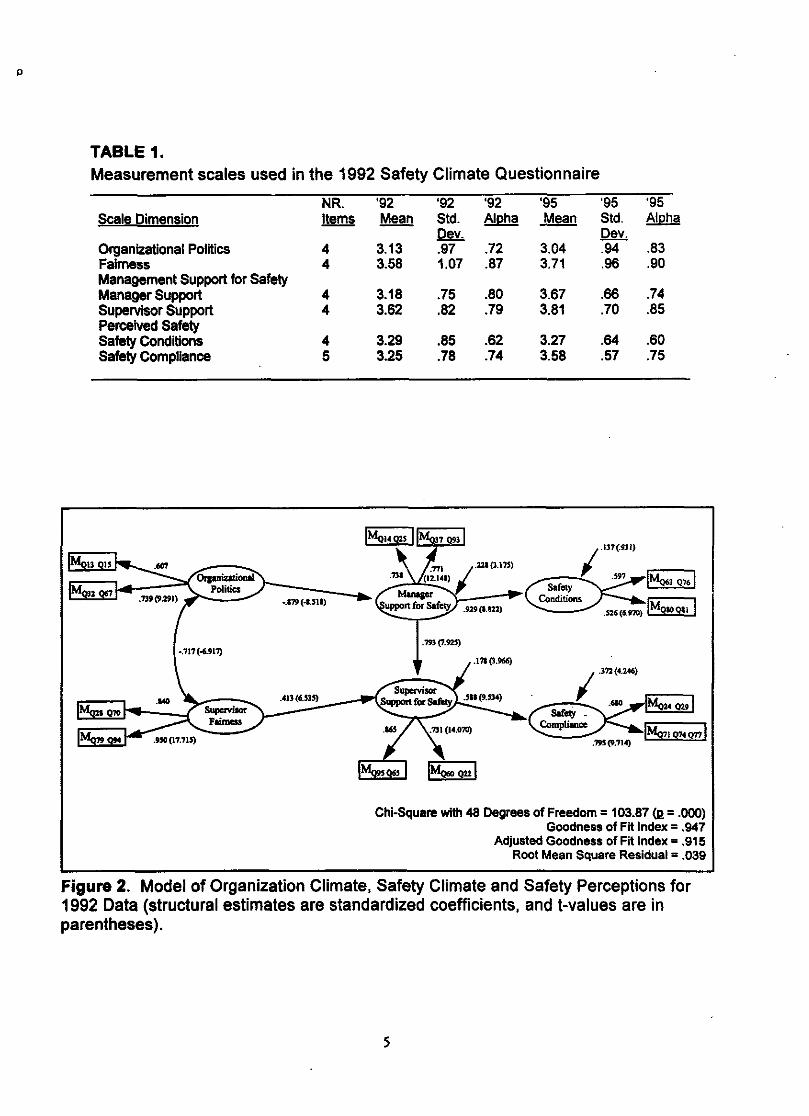
Table 1 presents the means for the revised 1992 and 1995 scores, their standard deviations, and coefficient alpha reliability estimates. As can be seen, the rescoring of management support and perceived safety did not adversely affect score reliabi!ities for either the 1992 or 1995 samples. As in the Witt, Helman, and Hilton (1994) study, accident rate data were once again found to be too unreliable to include in the analysis.
Measurement Models Prior to examining relationships among the mea
sured dimensions, the models for each construct were established using the 1992 data. First, the constructs were assessed individually. Model fit was examined, and adjustments were macie in an exploratotyfashion. Next, constructs were examined in pairs. Perceptions of organizational politics and fairness were combined first, followed by managementand supervisor support for safety, followed by safety conditions and safety
p
TABLE 1. Measurement scales used in the 1992 Safety Climate Questionnaire
NR. Scale Dimension Items
Organizational Politics 4 Fairness 4 Management Support for Safety Manager Support 4 Supervisor Support 4 Perceived Safety Safety Conditions 4 Safety Compliance 5
•.179(·Ull)
'92 '92 '92 '95 '95 '95 Mean Std. Alpha Mean Std. Alpha
Dev. Dev. 3.13 .97 .72 3.04 .94 .83 3.58 1.07 .87 3.71 .96 .90
3.18 .75 .80 3.67 .66 .74 3.62 .82 .79 3.81 .70 .85
3.29 .85 .62 3.27 .64 .60 3.25 .78 .74 3.58 .57 .75
.793(7.92$)
.171 (l.966)
Chi-Square with 48 Degrees of Freedom = 1 03.87 (I! = .000) Goodness of FH Index= .947
Adjusted Goodness of Fit Index= .915 Root Mean Square Residual = .039
Figure 2. Model of Organization Climate, Safety Climate and Safety Perceptions for 1992 Data (structural estimates are standardized coefficients, and t-values are in parentheses).
5

compliance. Finally, these scores were assessed in combination. All constructs were found to have good fit with no significant crossiQad.ings. These analyses identifled correlations among the error terms of some items. Correlations were eliminated by forming pairs of items averaged together to form "mini-means" following Bcrstcin and Tcng {1989).
Structural Relationships After the new measurement model for the con
structs was fully developed, the hypothesized structural relationships were tested. The expanded and revised basic model (Figure 2) was first rested. Figure 2 also presents the results of the structural assessment of the 1992 data. Consistentwith our first hypothesis, the general mediator role of management support for safety was significant, even though manager and supervisor support factors were treated as distinct constructs. That is, there was a direct effect between each climate measure specified as affecting each specified
·management support for safety measure. There was also a direct effect between each management support measure and each specified safety outcome. There were no significant paths between any climate and safety outcomes measure.
Consistent with our second hypothesis, Figure 2 shows that organizational politics was related to perceptions of management support, which in turn influenced perceptions of general safety conditions. Supervisor fairness influenced perceived supervisor support for safety, which in turn, influenced perceptions of safety compliance. Finally, manager support for safety was also found to influence perceptions of supervisor support. This latter result was not predicted, but is consistent with the general leadership research literature (see, for example, the lengthy review in Conger, 1989}.
The revised 1992 model established by Witt, Helman, and Hilton (1994) supporo:s the idea that an organization's general climate affects safety through management actions. Specifically, it shows that management influence is pervasive, not only influencing climate and safety but also affecting the influence of supervisors on safety perceptions. However, because of the exploratory development of both the measurement and structural models, it is possible that the
6
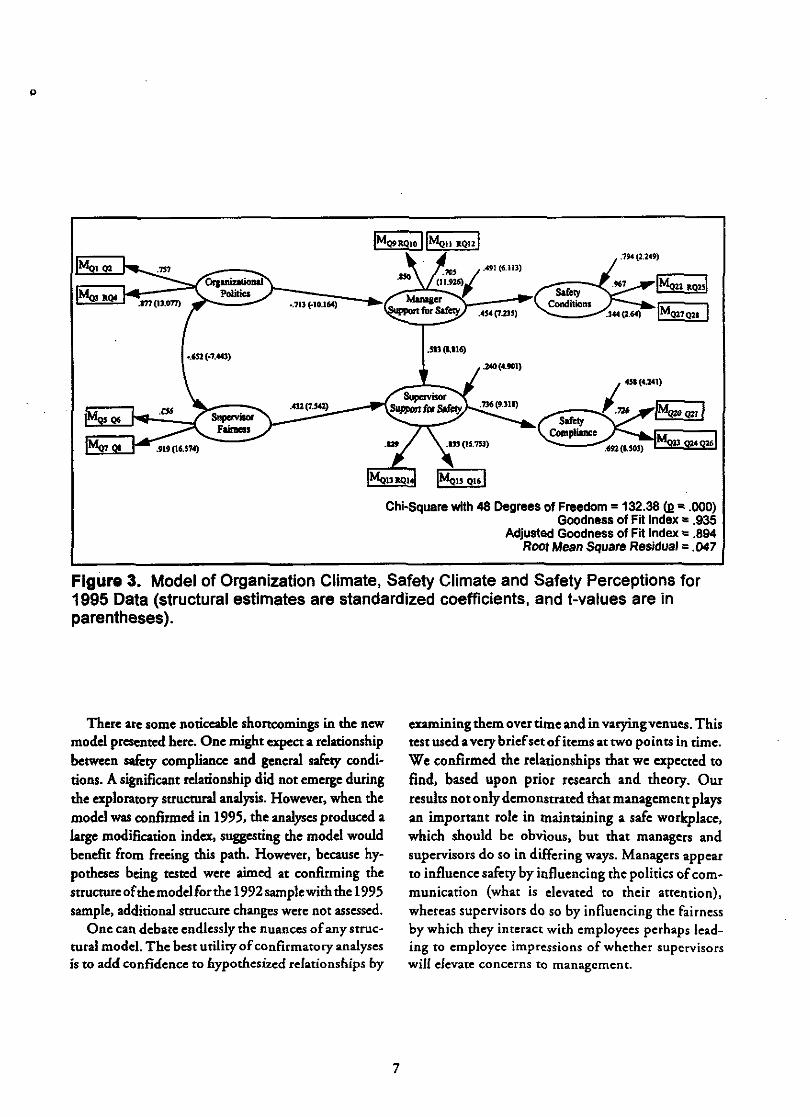
model that emerged did so because of capitalization on chance variations in the 1992 data. Therefore, the model was reassessed on the 1995 sample. The 1992 model was applied direcdyto the 1995 data using the same items, and free and fixed parameters from t.~e previous model without prior assessment of indicator measures or suuaure. The results of this analysis are summarized in Figure 3. Consistent with our third hypothesis, the expanded model fit both the 1992 and 1995 data sets. The fit statistics for the models indicate the 1992 data provided a somewhat better fitthan the J 995 data.
DISCUSSION
The present study extended earlier work demonstrating the important role managers play in establishing an organizational climate that affects workplace safety. The expanded model presented here clarifies that managers play a role in promoting safety by affecting the degree of politics in their organization's climate, which in turn, impacts perceived safety conditions. The expanded model also clarifies that supervisors play a role in promoting safety by affecting the level offairnes~ in their organization's climate, which in tum, impacts perceived compliance with safety rules. It would have been an added bonus if we could have rested these models using accident rate data, however, this was not possible. Previous literature suggests that accident rate data are not reliable in a great many organizations. As we noted in the introduction, unreliability may not be due to lax book keeping but pardy due to the rarity of accident events in many organizations.
We would argue that perceptual data, i.e., self reports, might be the preferred criteria for safety research. Minor accidents often go unreported, yet those unreported events may be the best indicator of improving or worsening safety conditions that might eventually lead to serious injury. Members of the workforce out on the shop floor arc likely to be sensitive to the type and frequency of accidents that go undcrrcportcd. Their perceived sense of workplace safety conditions tnight, therefore, be a better indicator of safety risk than the routine reports and other information available to management.
p
•.713 (-10.164)
.<32(7.!42)
·"' (1.116)
Chi-Square with 48 Degrees of Freedom= 132.38 (R" .000) Goodness of Fit Index = .935
Adjusted Goodness of Fit Index= .894 Root Mean Square Residual = .047
Figure 3. Model of Organization Climate, Safety Climate and Safety Perceptions for 1995 Data (structural estimates are standardized coefficients, and t-values are in parentheses).
There are some noticeable shortcomings in the new model presented here. One might expect a relationship between safety compliance and genend safety conditions. A significant relationship did not emerge during the exploratory suuctural analysis. However, when the model was confirmed in 1995, the analyses produced a large modification index, suggesting the model would benefit from freeing this path. However, because hypotheses being tested were aimed at confirming the srrucrure ofthemodelforthe 1992 sample with the 1995 sample, additional srrucarre changes were not assessed.
One can debate endlessly the nuances of any structural model. The best utility of confirmatory analyses is to add confidence to hypothesized relationships by
7
examining them over time and in varying venues. This test used a very brief set ofitems at two points in time. We confirmed the relationships that we expected to find, based upon prior research and theory. Our results not only demonstrated that management plays an important role in maintaining a safe workplace, which should be obvious, but that managers and supervisors do so in differing ways. Managers appear to influence safety by influencing the politics of communication (what is elevated to their attention), whereas supervisors do so by influencing the fairness by which they interact with employees perhaps leading to employee impressions of whether supervisors will elevate concerns to management.

REFERENCES
Berstein, I.H. & Teng, G. (1989). Factoring items and &ctoring scales are different: Spurious evidence for multidimensionality due to item categorization. Psychological Bulletin,1.!!2. 467-77.
Bies, R.J. & Moag. J.S. {1986). Interactional justice: Communication criteria offairness.ln R.J. Lewicki, B.H. Sheppard and M.H. Bazerman {Eds). Research on ntfOiilllion in organizations, (Vol 1., p. 43-55). Greenwich, CT: JAI Press.
Bies, R.J. &Shapiro, D.L. {1987). Interactionalf.Urness judgment: The influence of causal accounts. Social Jwtia Rtsearch, L 199-218.
Brown, R.L. & Holmes, H. (1986). The use of a factOranalytic procedure for assessing rhe validity of an employee safety climate modd. Accidtnt Prevtntion and Analysis, ll, 455-70.
Cleveland, R.J., Cohen, H.H., Smirh, M.J., and Cohen, A. (1978). Safety program Safety program practices in recordholding plants. Cincinnati, OH: Nationallnstitute for Occupational Saf'et)· and Health.
Cohen, A. (19m. Factors in successful occupational safety programs. Journal ofSafosy Research, 2.. 168-78.
Cohen, A. Smith, M, & Cohen, H.H. (1975). Safety program practices in high vs. low accident rate companies-An interim report. US Department ofHealrh, Education, and Wdfare Publication # 75-185. Cincinnati, OH: National Institute for Occupational Safety and Health.
Conger, J.A. (1989). The charismatic leader. San Francisco, CA: Jossey-Bass.
Coyle, I.R., Sleeman, S.D. &Adams, N. (1995). Safety climate. journal ofS4foty Research, ~ 247-54. ·
Cronbach, L.J. (1951). Coefficient alpha and the internalsttucture of tests. Psychometirica, 16,297-334.
Dedobbdeer, N., & Beland, F. (1991). A safety climate measure for consttuction sites. Journal of Safety Rtstarch,ll, 97-103.
Dejoy, D. (1985). Attributional processes and hazard control management in industry. journal of Safety Rtstarch,JR, 61-71.
Dejoy, D. (1994). Managing safety in the workplace: An attribution theory analysis and modd. Journal of Safety Research, ~ 3-17.
8
Drory, A. & Romm, T. (1990). The definition of organizational politics: A review. Human Relations, 2l, 1133-1154.
Gandz, J. & Murray, V. V. (1980). The experience of workplace politics. Acadtmy of Managtmtnt RtPitw, 12,237-51.
Greenberg, J. (1993). The social side of fairness: Interpersonal and information classes of organizational justice.ln R. Cropanzano (Ed.) Justice in the workplace: Approachingfoirntss in human resourct management (pp. 79-103). Hillsdale, NJ: Lawrence Earlbaum Assoc.
Hofmann, D.A., Jacobs, R. & Landy, F. (1995). High reliability process industries: Individual, micro, and macro organizational influences on safety performance.fournal ofSafoty Research, 26, 131-49.
Janssens, M., Brett,J.M.,andSmith, F. (1995). Confirmatory cross-cultural research: Testing the viability of a corporation-wide safety policy. Academy of Management journal, ~ 364-82.
Kacmar, K.M. & Ferris, G.R. (1991). Perceptions of organizational politics scale (POPS): Devdopment and construct validation. Educational and Psycho/ogicaiMellSUremtnt,ll, 193-205.
Kozlowski, S.W.J. & Doherty, M.L. (1989}. Integration of climate and leadership: Examination of a n~ected issue. journal of Applied Psychology, ~. 546-53.
Kumar, P. & Ghadially, R. (1989). Organizational politics and its effects on members in organizations. Human Relations, 42,305-14.
Madison, D.L., Allen, R.W., Porter, L.W., Renwick, P.A., & Mayes, B.T. (1980). Organizational politics: An exploration of managers' perceptions. Human Relations, .ll, 79-100.
Menckel, E. & Carter, N. (1985). The devdopment and evaluation of accident prevention routines: A case study. journal of Safety Research, !§., 73-82.
Myers, S.D., & Facteau, J.D. 1992, August. Understanding compliana behavior in oa:upatio>illl setlings: Implications for proar:tivt managtmtnt strategits. Paper presented at the meeting of rhe Academy of Management, Las Vegas, NV.
Niskanen, T. (1994). Assessing the safery environment in work organization of road maintenance jobs. Accident Analysis and Prt~~tntion, 26,27-39.
)
Schneider, B. (1987). The people make the place. Personnel Psychology, 40, 437-54.
Schneider, B. &Rentsch,J. (1988). Managing climates and cultures: A futures perspective. In: J. Hage {Ed.). Futumoforganiutions: lnnovatingro adapt strategy and human resourcts ro rapid technological change {pp. 181-200). Lexington, MA: Lexington Books.
Shapiro, D.L. (1993). Reconciling theoretical differen= un<)ng ptocedun.l justice r=rchers by reevaluating what it means to haveone'sviews "considered": Implications for third-party managers. In R. Cropanzano (Ed.} Justice in the worltplace: Approaching fairness in human resource management (pp. 51-78}. Hillsdale, NJ: Lawrence Earlbaum Assoc.
Shapiro, D.L & Brett, J.M. (1991}. Comparing the instrummt41 ana value-txpmsivt mothls of procedural fairness untkr conditions of high and low decision control. Paper presented at the National Academy of Management Meeting, Miami, FL.
*u.a. GOVERNMENT fiiNDNG OmCE: ttt7 .. SSfom/400'75 9
Tuttle, T.C., Dachler, H.P. & Schneider, B. (1975). Organizational psychology. In: B.L. Margolis and W.H. Kroes (Eds.), The human side of accident prevmtion, (pp. 7 -44). Springfield, II., Charles C. Thomas.
Vancouver, ].B. & Schmidt, N.W. (1991). An exploratory examination of person-organization fit: Organizational goal congruence. Personml Psychology, 44,333-52.
Vojtecky, M.A.& Schmitz, M.F. (1986). Program evaluation and health and safety training. journal of Saft'J Research, 1L 57-63.
Witt, L.A., Hdman, C., & Hilton, T.F., (1994}. Managnnmt injlutncts on perceived safety. Paper presented at the annual Meeting of the Amerkan Psychological Society, San Francisco, CA.
Zohar, D. {1980). Safety climate in industrial organizations: Theoretical and applied implications. journal of Applied Psychology, ~ 96-102.