on the violation of gradient wind balance at the top of...
TRANSCRIPT
On the violation of gradient wind balance at the topof tropical cyclonesYair Cohen1,2,3 , Nili Harnik1 , Eyal Heifetz1, David S. Nolan4 , Dandan Tao5 ,and Fuqing Zhang5
1Department of Geosciences, Tel Aviv University, Tel Aviv, Israel, 2Department of Environmental Sciences and Engineering,California Institute of Technology, Pasadena, California, USA, 3Jet Propulsion Laboratory, California Institute of Technology,Pasadena, California, USA, 4Rosenstiel School of Marine and Atmospheric Science, University of Miami, Coral Gables,Florida, USA, 5Department of Meteorology and Atmospheric Science, Pennsylvania State University, University Park,Pennsylvania, USA
Abstract The existence of physical solutions for the gradient wind balance is examined at the top of12 simulated tropical cyclones. The pressure field at the top of these storms, which depends on thevertically integrated effect of the warm core and the near surface low, is found to violate the gradient windbalance—termed here as a state of nonbalance. Using a toy model, it is shown that slight changes in therelative location and relative widths of the warm core drastically increase the isobaric curvature at the upperlevel pressure maps leading to nonbalance. While idealized storms return to balance within several days,simulations of real-world tropical cyclones retain a considerable degree of nonbalance throughout themodelintegration. Comparing mean and maximum values of different storms shows that peak nonbalancecorrelates with either peak intensity or intensification, implying the possible importance of nonbalance atupper levels for the near surface winds.
Plain Language Summary The assumption of a simple force balance (gradient wind balance) hasserved in idealized models for tropical cyclones in the past century. This assumption decouples the dynamicsof the tropical cyclone’s upper levels (15 km) from its surface winds. By examining the upper level of tropicalcyclones in state of the art computer model, is it shown here that in certain scenarios the gradient windbalance has no physical validity at the top of tropical cyclones. This study motivates detailed upper levelobservations as well as new idealized theories.
1. Introduction
Idealized theories for the circulation that develops in tropical cyclones (TCs) as a response to the release oflatent heat in the eyewall are based on the balanced vortex model [Eliassen, 1951; Charney and Eliassen,1964; Ooyama, 1969; Emanuel, 1986; Wirth and Dunkerton, 2009]. This model combines the hydrostatic andthe gradient wind balances (which together make thermal wind balance) with the radial momentum andthermodynamic equations. The assumption of gradient wind balance is motivated both by measurements[Willoughby, 1990] and by the requirement for balanced (and potentially predictable) flow at TC scale[Ooyama, 1982; Raymond et al., 2015]. Given these assumptions, the balanced vortex model is able todescribe the complexity of the coexisting horizontal and overturning circulations generated by heat andmomentum sources, in a manner that is simple enough to be analytically solved. This model predicts thatthe tangential winds will peak at lower levels and decay upward [Emanuel, 1986; Stern and Zhang, 2016],conserving the value of the absolute angular momentum, which is set at the top of the boundary layer.Based on this model a wide range of theories have been presented for the steady structure and energetics[Charney and Eliassen, 1964; Ooyama, 1969; Emanuel, 1986], intensity [Emanuel, 1995], intensification[Shapiro and Willoughby, 1982; Nolan et al., 2007], and existence of an eyewall [Wirth and Dunkerton, 2009].
In the balanced vortex model, the secondary circulation acts to exactly cancel the changes caused by eyewallheating and surface friction, maintaining thermal wind balance. Therefore, the upper level radial outflow isnot directly driven by the radial pressure gradient and is considered as a passive component of the TC,serving only to evacuate mass from the core in exact balance with the low-level frictional inflow.Accordingly, most of the focus in previous studies and observational campaigns has been on air-sea interac-tion and the low-level primary circulation. In recent years, as part of continuing efforts to improve our
COHEN ET AL. VIOLATION OF GRADIENT BALANCE IN TCS 8017
PUBLICATIONSGeophysical Research Letters
RESEARCH LETTER10.1002/2017GL074552
Key Points:• We find that for certain time periods atthe tops of simulated tropicalcyclones, gradient wind balance hasno physical solutions
• This invalidity is quantified using anondimensional number (nonbalanceindex) which peaks during theintensification stages of the storms
• Lifetime-total values of nonbalanceand intensification correlate; intensityduring maximum nonbalanceincreases with nonbalance index
Supporting Information:• Supporting Information S1• Figure S1• Table S1
Correspondence to:Y. Cohen,[email protected]
Citation:Cohen, Y., N. Harnik, E. Heifetz,D. S. Nolan, D. Tao, and F. Zhang (2017),On the violation of gradient windbalance at the top of tropical cyclones,Geophys. Res. Lett., 44, 8017–8026,doi:10.1002/2017GL074552.
Received 12 JUN 2017Accepted 17 JUL 2017Accepted article online 20 JUL 2017Published online 12 AUG 2017
©2017. American Geophysical Union.All Rights Reserved.
understanding of the TC intensification mechanism, much interest has been given to two relatively lessexplored components: warm-core structure and upper level dynamics.
The structure of the warm core (its height and the occasional existence of a double warm core) is consid-ered an important aspect of the dynamics of a TC and is used operationally by the National HurricaneCenter as an indication for the intensification of a storm or for upgrading a subtropical storm to a tropicalstorm [see, e.g., National Hurricane Center, 2010]. However, the mechanistic view of such a relationbetween the warm-core structure and TC intensity is still under debate. While some studies argue thatthe detailed structure of the warm core is related to TC intensity [Ohno and Satoh, 2015; Chen andZhang, 2013; Halverson et al., 2006; Durden, 2013] others have argued against such a relation [Stern andNolan, 2012; Stern and Zhang, 2013, 2016]. The arguments against a relationship between the warm-corestructure and intensity invoke hydrostatic balance to show that it is only the integrated effect of the warmcore, and not the details of its vertical structure (i.e., the altitude and number of temperature anomalies),which determines the surface pressure. However, this hydrostatic argument [see Hirschberg and Fritsch,1993] basically assumes that the time tendency of the pressure field at some upper level is negligible,so that surface pressure tendencies are affected only by changes in the integrated warm-core tempera-ture. Neglecting changes in the upper level pressure field is consistent with the balanced vortex modeland its underlying assumptions. Relaxing this assumption, however, complicates the dynamics becausethe surface pressure tendency must then be deduced from the continuity equation and the net massdivergence in the column [Steenburgh and Holton, 1993].
The effects of upper level dynamics have been considered in numerous studies in the context of an externallygenerated upper level trough [i.e., Kaplan and DeMaria, 2003; Molinari and Vollaro, 1989, 1990; Molinari et al.,1995; Montgomery and Farrell, 1993; Molinari et al., 2004; Peirano et al., 2016]. Emanuel and Rotunno [2011]studied the nonexternal effect by examining the self-stratification of the outflow along angular momentumsurfaces. Yet those branches of the circulation extend too far from the TC core to be hydrostatically related tothe surface pressure anomaly at the center.
As explained above, under the assumption of gradient wind balance, the pressure gradients are decoupledfrom the radial flow at the upper levels and these two aspects of a TC can be studied separately. Thus, thewarm-core structure is projected downward to yield the surface pressure variations, assuming that the upperlevel pressure gradients is insignificant. At the same time, a nontrivial upper level dynamic is consideredmainly to result from an interaction of the TC with external synoptic features. Both of these essentially con-strain the effect of the warm core on the upper level pressure field so that the latter will maintain gradientwind balance with the Coriolis and centrifugal forces.
While it is generally accepted that the warm core may generate a high-pressure center at the upper levels,it seems to be overlooked that around a high at the scale of a TC the gradient wind balance may be inva-lid. An invalidity of gradient wind balance (which may take place even with pressure gradients that arerelatively small compared to values found at the level of maximum winds) recouples the radial pressuregradient and the radial velocity at the outflow level. Such coupling may yield self-induced upper leveldynamics in TCs, which cannot be described by the balanced vortex model. The goal of this work is toexamine the validity of gradient wind balance at the upper levels of simulated TCs in differentphysical configurations.
2. Definition of Gradient Nonbalance
In axisymmetric and pressure coordinates, gradient wind balance stems from the radial component ofNewton’s second law acting on an air parcel, assuming inviscid flow:
∂u∂t
þ u∂u∂r
þ ω∂u∂p
¼ v2
rþ fv � g
∂Z∂r|fflfflfflfflfflfflfflfflfflffl{zfflfflfflfflfflfflfflfflfflffl}
gradient balance
(1)
Here u and v are the radial and tangential winds, defined, respectively, as positive for outward and cyclonicflow (counterclockwise in the Northern Hemisphere), r is the radius, ω is the vertical velocity in pressure coor-dinates, Z is the geopotential height (the height of a given pressure surface), g is the gravitational acceleration
Geophysical Research Letters 10.1002/2017GL074552
COHEN ET AL. VIOLATION OF GRADIENT BALANCE IN TCS 8018
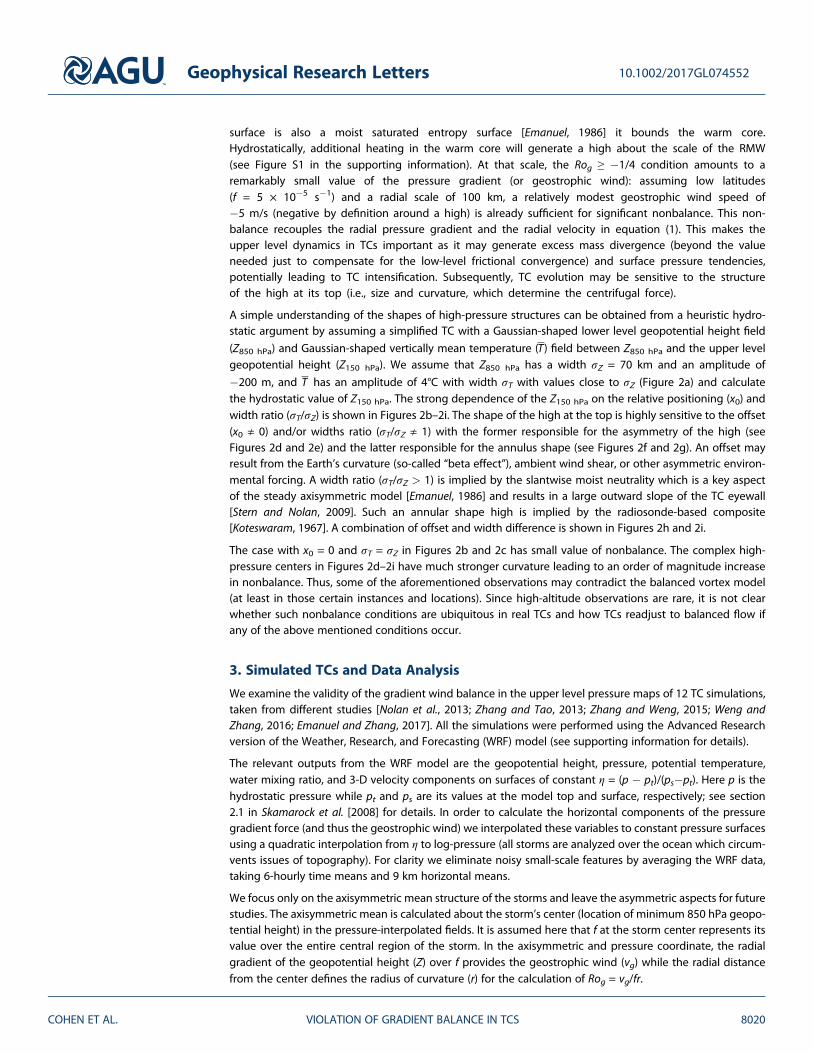
(assumed constant), f is the Coriolisparameter, and p is the pressure.Gradient wind balance is defined bythe vanishing of the sum of forceson the right-hand side (RHS) ofequation (1).
A nondimensional formulation isderived by assuming gradient windbalance and dividing the RHS ofequation (1) by f2r [Cohen et al., 2015]:
Ro2 þ Ro ¼ Rog: (2)
Here Ro = v/fr is the Rossby number,Rog = vg/fr is the geostrophic Rossbynumber with vg = (g∂Z/∂r)/f as thegeostrophic wind (defined to benegative around a high). Equation(2) classifies the possible solutions ofthe gradient wind balance around a
high (Rog < 0) or a low (Rog > 0). In Figure 1 the left-hand side of (2) is plotted as a function of Ro, withRog as a free parameter; for Rog < �¼ equation (2) has no solutions (see equation 3.16 in Holton [2004]).The common use of this plot is to classify the flow by the value of Ro, assuming it is a solution of gradient windbalance (Rog ≥�¼). Thus, one obtains the classification of the flow as inertially stable (Ro>�½) and inertiallyunstable (Ro<�½), with Ro =�½marking zero absolute vorticity and the margin of stability (see Cohen et al.[2015] for details).
Here however, we examine the pressure map (Rog) rather than the wind (Ro). Around a low (Rog > 0) anycombination of radii and pressure gradients (represented by Rog) can be balanced by a correspondingwind (Ro). Around a high (Rog < 0) equation (2) has no physical (mathematically real) solutions ifRog < �¼ (a strong enough pressure gradient and small enough radius) regardless of the wind (Ro). Interms of force balance, around a high (unlike around a low) the pressure gradient force and the centrifugalforce both point outward. If the pressure gradient is strong enough and/or if the curvature is strongenough (1/r is large), the Coriolis force cannot oppose the centrifugal and pressure gradient forces com-bined. Attempting to regain balance by increasing the velocity is futile as it will increase the outwardpointing centrifugal force (v2/r) more than the inward pointing Coriolis force (fv). We term such a scenarioas gradient nonbalance to differentiate it from gradient imbalance. The latter arise due to friction, strongaccelerations, and instability and may be eliminated (restoring balance) by a modification of the velocityto balance the pressure field.
Onemay think of nonbalance flow as analogues to themuchmore familiar scenario of nonhydrostatic flow. Inthe nonbalance flow, the radial pressure gradient is coupled with the radial velocity just as in a nonhydro-static flow, the vertical pressure gradient is coupled with the vertical velocity.
The existence of a high above the warm core of TCs is expected from hydrostatic considerations if the warmanomaly is sufficiently strong and/or deep. Observations of the tops of TCs (around the 150 hPa pressurelevel) are rather rare. Koteswaram [1967] reported the formation of a split high at upper levels (~15 km inaltitude), with two local maxima at a finite radius and a low at the center (see his Figure 16). Halversonet al. [2006] reported an example of the height of the tropopause having a dipole structure (see theirFigure 11).
The balanced vortex model predicts an anticyclonic circulation when the angular momentum surface,flaring outward and upward from the radius of maximum wind (RMW, hereafter), reaches to sufficientlylarge radius. This anticyclonic circulation (and the high pressure inferred from it via gradient balance)has to be weak and wide to satisfy the Rog ≥ �1/4 condition. As this absolute angular momentum
Figure 1. A canonical representation of the nondimensional gradient windbalance with Ro as the abscissa and Rog as the ordinate taken from Cohenet al. [2015]. Nonbalance as defined here occurs at values of Rog<�¼ in thelight green area. The solid-blue and dashed-red parts of the curve representparameter ranges of inertial stability (Rog > �¼; �½ < Ro) and possibleinertial instability and imbalance (Rog > �¼; Ro < �½), respectively.
Geophysical Research Letters 10.1002/2017GL074552
COHEN ET AL. VIOLATION OF GRADIENT BALANCE IN TCS 8019
surface is also a moist saturated entropy surface [Emanuel, 1986] it bounds the warm core.Hydrostatically, additional heating in the warm core will generate a high about the scale of the RMW(see Figure S1 in the supporting information). At that scale, the Rog ≥ �1/4 condition amounts to aremarkably small value of the pressure gradient (or geostrophic wind): assuming low latitudes(f = 5 × 10�5 s�1) and a radial scale of 100 km, a relatively modest geostrophic wind speed of�5 m/s (negative by definition around a high) is already sufficient for significant nonbalance. This non-balance recouples the radial pressure gradient and the radial velocity in equation (1). This makes theupper level dynamics in TCs important as it may generate excess mass divergence (beyond the valueneeded just to compensate for the low-level frictional convergence) and surface pressure tendencies,potentially leading to TC intensification. Subsequently, TC evolution may be sensitive to the structureof the high at its top (i.e., size and curvature, which determine the centrifugal force).
A simple understanding of the shapes of high-pressure structures can be obtained from a heuristic hydro-static argument by assuming a simplified TC with a Gaussian-shaped lower level geopotential height field
(Z850 hPa) and Gaussian-shaped vertically mean temperature (T) field between Z850 hPa and the upper levelgeopotential height (Z150 hPa). We assume that Z850 hPa has a width σZ = 70 km and an amplitude of
�200 m, and T has an amplitude of 4°C with width σT with values close to σZ (Figure 2a) and calculatethe hydrostatic value of Z150 hPa. The strong dependence of the Z150 hPa on the relative positioning (x0) andwidth ratio (σT/σZ) is shown in Figures 2b–2i. The shape of the high at the top is highly sensitive to the offset(x0 ≠ 0) and/or widths ratio (σT/σZ ≠ 1) with the former responsible for the asymmetry of the high (seeFigures 2d and 2e) and the latter responsible for the annulus shape (see Figures 2f and 2g). An offset mayresult from the Earth’s curvature (so-called “beta effect”), ambient wind shear, or other asymmetric environ-mental forcing. A width ratio (σT/σZ > 1) is implied by the slantwise moist neutrality which is a key aspectof the steady axisymmetric model [Emanuel, 1986] and results in a large outward slope of the TC eyewall[Stern and Nolan, 2009]. Such an annular shape high is implied by the radiosonde-based composite[Koteswaram, 1967]. A combination of offset and width difference is shown in Figures 2h and 2i.
The case with x0 = 0 and σT = σZ in Figures 2b and 2c has small value of nonbalance. The complex high-pressure centers in Figures 2d–2i have much stronger curvature leading to an order of magnitude increasein nonbalance. Thus, some of the aforementioned observations may contradict the balanced vortex model(at least in those certain instances and locations). Since high-altitude observations are rare, it is not clearwhether such nonbalance conditions are ubiquitous in real TCs and how TCs readjust to balanced flow ifany of the above mentioned conditions occur.
3. Simulated TCs and Data Analysis
We examine the validity of the gradient wind balance in the upper level pressure maps of 12 TC simulations,taken from different studies [Nolan et al., 2013; Zhang and Tao, 2013; Zhang and Weng, 2015; Weng andZhang, 2016; Emanuel and Zhang, 2017]. All the simulations were performed using the Advanced Researchversion of the Weather, Research, and Forecasting (WRF) model (see supporting information for details).
The relevant outputs from the WRF model are the geopotential height, pressure, potential temperature,water mixing ratio, and 3-D velocity components on surfaces of constant η = (p � pt)/(ps�pt). Here p is thehydrostatic pressure while pt and ps are its values at the model top and surface, respectively; see section2.1 in Skamarock et al. [2008] for details. In order to calculate the horizontal components of the pressuregradient force (and thus the geostrophic wind) we interpolated these variables to constant pressure surfacesusing a quadratic interpolation from η to log-pressure (all storms are analyzed over the ocean which circum-vents issues of topography). For clarity we eliminate noisy small-scale features by averaging the WRF data,taking 6-hourly time means and 9 km horizontal means.
We focus only on the axisymmetric mean structure of the storms and leave the asymmetric aspects for futurestudies. The axisymmetric mean is calculated about the storm’s center (location of minimum 850 hPa geopo-tential height) in the pressure-interpolated fields. It is assumed here that f at the storm center represents itsvalue over the entire central region of the storm. In the axisymmetric and pressure coordinate, the radialgradient of the geopotential height (Z) over f provides the geostrophic wind (vg) while the radial distancefrom the center defines the radius of curvature (r) for the calculation of Rog = vg/fr.
Geophysical Research Letters 10.1002/2017GL074552
COHEN ET AL. VIOLATION OF GRADIENT BALANCE IN TCS 8020
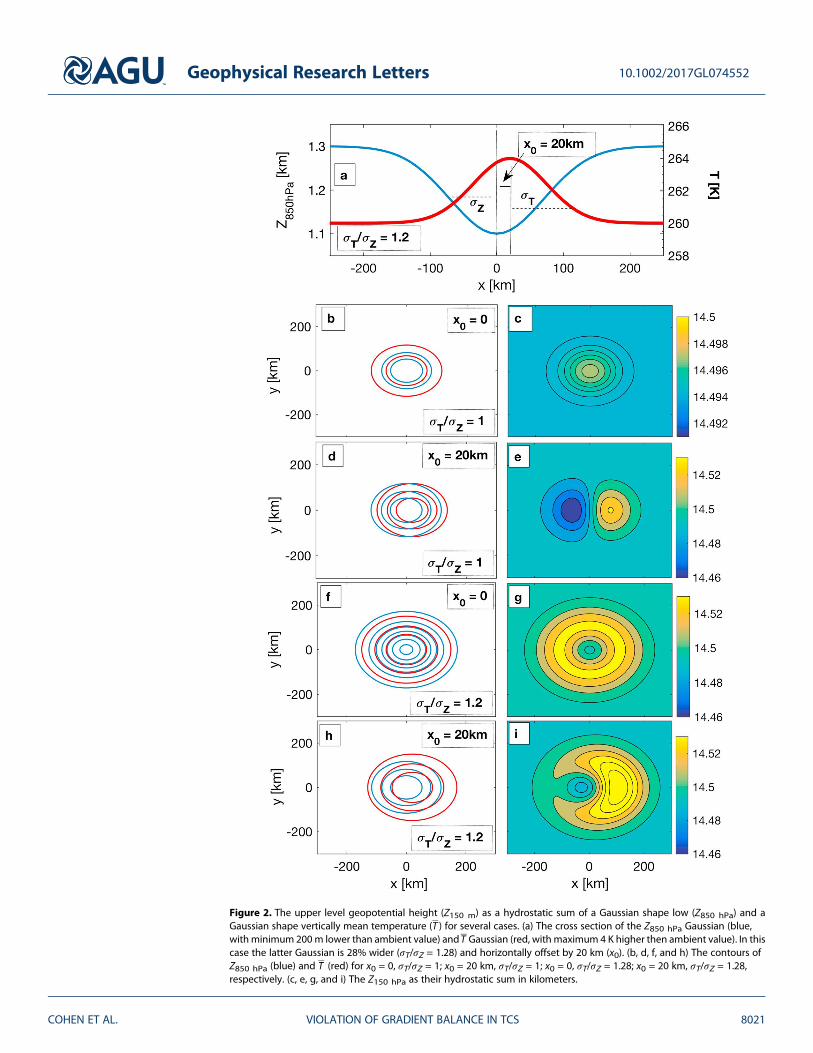
Figure 2. The upper level geopotential height (Z150 m) as a hydrostatic sum of a Gaussian shape low (Z850 hPa) and aGaussian shape vertically mean temperature (T ) for several cases. (a) The cross section of the Z850 hPa Gaussian (blue,with minimum 200m lower than ambient value) andT Gaussian (red, with maximum 4 K higher then ambient value). In thiscase the latter Gaussian is 28% wider (σT/σZ = 1.28) and horizontally offset by 20 km (x0). (b, d, f, and h) The contours ofZ850 hPa (blue) and T (red) for x0 = 0, σT/σZ = 1; x0 = 20 km, σT/σZ = 1; x0 = 0, σT/σZ = 1.28; x0 = 20 km, σT/σZ = 1.28,respectively. (c, e, g, and i) The Z150 hPa as their hydrostatic sum in kilometers.
Geophysical Research Letters 10.1002/2017GL074552
COHEN ET AL. VIOLATION OF GRADIENT BALANCE IN TCS 8021

In order to produce an index that quantifies the nonbalance state in the axisymmetric mean we radiallyintegrate Rog at the 150 hPa. Since the parts in the Rog profile that can be balanced (Rog ≥�1/4) do not cancelout with nonbalanced parts (Rog < �1/4) we eliminate the former by defining this index as follows:
Λ ¼ 1r12
∫r1
0
X2
sgn Xð Þ þ 1½ �� �
rdr (3)
Here X = �(Rog + ¼) so that positive X corresponds to nonbalance, while the integration domain, r1, is takento be three times RMW. This positive index, Λ, reflects the accumulated magnitude of the nonbalancenormalized by the storm size and Λ = 0 corresponds to potentially balanced flow.
Figure 3. The 150 hPa geopotential height field (in km) in two different simulations (columns) and at three different times(rows). The left column is INR with time marking hours from the start of the simulation. The right column is simulatedJoaquin 2015 at three different times.
Geophysical Research Letters 10.1002/2017GL074552
COHEN ET AL. VIOLATION OF GRADIENT BALANCE IN TCS 8022
4. Results
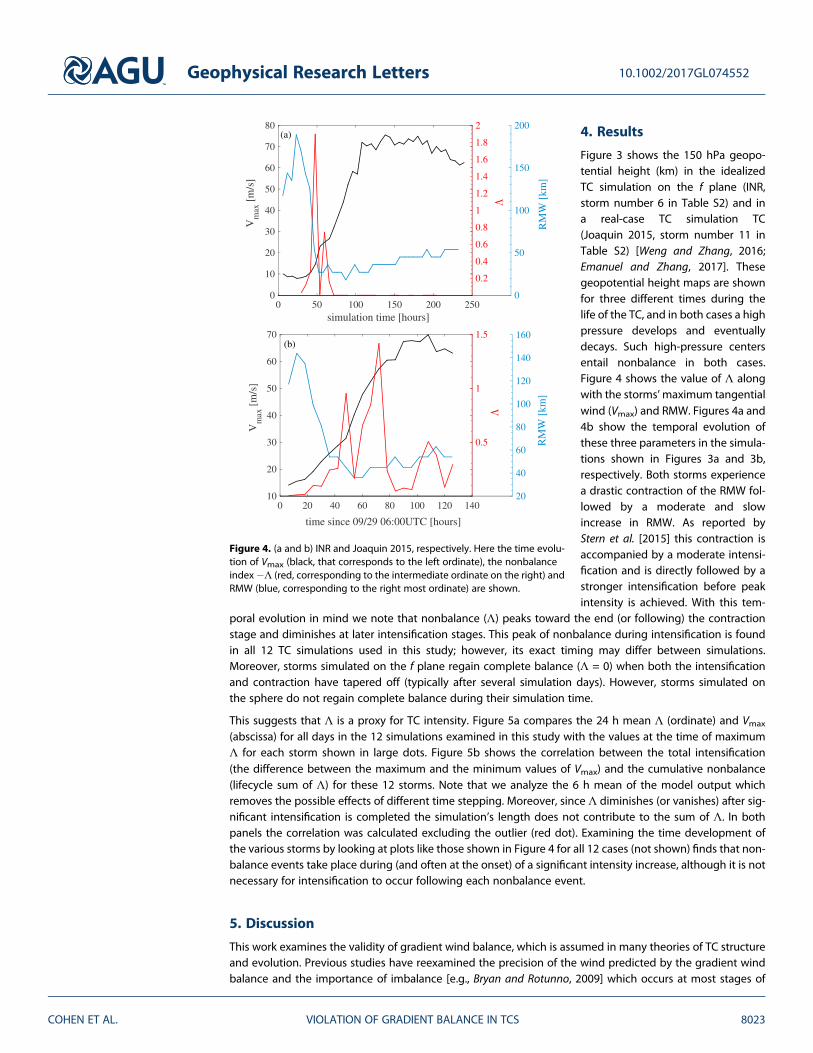
Figure 3 shows the 150 hPa geopo-tential height (km) in the idealizedTC simulation on the f plane (INR,storm number 6 in Table S2) and ina real-case TC simulation TC(Joaquin 2015, storm number 11 inTable S2) [Weng and Zhang, 2016;Emanuel and Zhang, 2017]. Thesegeopotential height maps are shownfor three different times during thelife of the TC, and in both cases a highpressure develops and eventuallydecays. Such high-pressure centersentail nonbalance in both cases.Figure 4 shows the value of Λ alongwith the storms’maximum tangentialwind (Vmax) and RMW. Figures 4a and4b show the temporal evolution ofthese three parameters in the simula-tions shown in Figures 3a and 3b,respectively. Both storms experiencea drastic contraction of the RMW fol-lowed by a moderate and slowincrease in RMW. As reported byStern et al. [2015] this contraction isaccompanied by a moderate intensi-fication and is directly followed by astronger intensification before peakintensity is achieved. With this tem-
poral evolution in mind we note that nonbalance (Λ) peaks toward the end (or following) the contractionstage and diminishes at later intensification stages. This peak of nonbalance during intensification is foundin all 12 TC simulations used in this study; however, its exact timing may differ between simulations.Moreover, storms simulated on the f plane regain complete balance (Λ = 0) when both the intensificationand contraction have tapered off (typically after several simulation days). However, storms simulated onthe sphere do not regain complete balance during their simulation time.
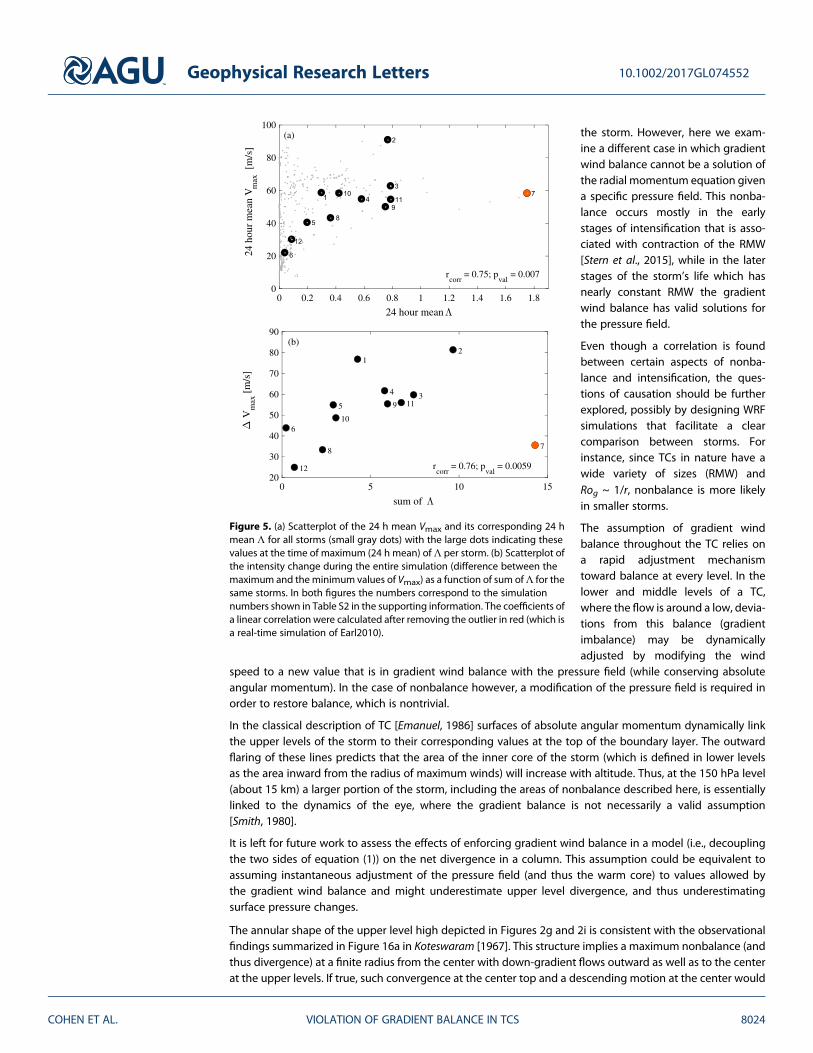
This suggests that Λ is a proxy for TC intensity. Figure 5a compares the 24 h mean Λ (ordinate) and Vmax
(abscissa) for all days in the 12 simulations examined in this study with the values at the time of maximumΛ for each storm shown in large dots. Figure 5b shows the correlation between the total intensification(the difference between the maximum and the minimum values of Vmax) and the cumulative nonbalance(lifecycle sum of Λ) for these 12 storms. Note that we analyze the 6 h mean of the model output whichremoves the possible effects of different time stepping. Moreover, since Λ diminishes (or vanishes) after sig-nificant intensification is completed the simulation’s length does not contribute to the sum of Λ. In bothpanels the correlation was calculated excluding the outlier (red dot). Examining the time development ofthe various storms by looking at plots like those shown in Figure 4 for all 12 cases (not shown) finds that non-balance events take place during (and often at the onset) of a significant intensity increase, although it is notnecessary for intensification to occur following each nonbalance event.
5. Discussion
This work examines the validity of gradient wind balance, which is assumed in many theories of TC structureand evolution. Previous studies have reexamined the precision of the wind predicted by the gradient windbalance and the importance of imbalance [e.g., Bryan and Rotunno, 2009] which occurs at most stages of
Figure 4. (a and b) INR and Joaquin 2015, respectively. Here the time evolu-tion of Vmax (black, that corresponds to the left ordinate), the nonbalanceindex�Λ (red, corresponding to the intermediate ordinate on the right) andRMW (blue, corresponding to the right most ordinate) are shown.
Geophysical Research Letters 10.1002/2017GL074552
COHEN ET AL. VIOLATION OF GRADIENT BALANCE IN TCS 8023
the storm. However, here we exam-ine a different case in which gradientwind balance cannot be a solution ofthe radial momentum equation givena specific pressure field. This nonba-lance occurs mostly in the earlystages of intensification that is asso-ciated with contraction of the RMW[Stern et al., 2015], while in the laterstages of the storm’s life which hasnearly constant RMW the gradientwind balance has valid solutions forthe pressure field.
Even though a correlation is foundbetween certain aspects of nonba-lance and intensification, the ques-tions of causation should be furtherexplored, possibly by designing WRFsimulations that facilitate a clearcomparison between storms. Forinstance, since TCs in nature have awide variety of sizes (RMW) andRog ~ 1/r, nonbalance is more likelyin smaller storms.
The assumption of gradient windbalance throughout the TC relies ona rapid adjustment mechanismtoward balance at every level. In thelower and middle levels of a TC,where the flow is around a low, devia-tions from this balance (gradientimbalance) may be dynamicallyadjusted by modifying the wind
speed to a new value that is in gradient wind balance with the pressure field (while conserving absoluteangular momentum). In the case of nonbalance however, a modification of the pressure field is required inorder to restore balance, which is nontrivial.
In the classical description of TC [Emanuel, 1986] surfaces of absolute angular momentum dynamically linkthe upper levels of the storm to their corresponding values at the top of the boundary layer. The outwardflaring of these lines predicts that the area of the inner core of the storm (which is defined in lower levelsas the area inward from the radius of maximum winds) will increase with altitude. Thus, at the 150 hPa level(about 15 km) a larger portion of the storm, including the areas of nonbalance described here, is essentiallylinked to the dynamics of the eye, where the gradient balance is not necessarily a valid assumption[Smith, 1980].
It is left for future work to assess the effects of enforcing gradient wind balance in a model (i.e., decouplingthe two sides of equation (1)) on the net divergence in a column. This assumption could be equivalent toassuming instantaneous adjustment of the pressure field (and thus the warm core) to values allowed bythe gradient wind balance and might underestimate upper level divergence, and thus underestimatingsurface pressure changes.
The annular shape of the upper level high depicted in Figures 2g and 2i is consistent with the observationalfindings summarized in Figure 16a in Koteswaram [1967]. This structure implies a maximum nonbalance (andthus divergence) at a finite radius from the center with down-gradient flows outward as well as to the centerat the upper levels. If true, such convergence at the center top and a descending motion at the center would
Figure 5. (a) Scatterplot of the 24 h mean Vmax and its corresponding 24 hmean Λ for all storms (small gray dots) with the large dots indicating thesevalues at the time of maximum (24 h mean) of Λ per storm. (b) Scatterplot ofthe intensity change during the entire simulation (difference between themaximum and theminimum values of Vmax) as a function of sum ofΛ for thesame storms. In both figures the numbers correspond to the simulationnumbers shown in Table S2 in the supporting information. The coefficients ofa linear correlation were calculated after removing the outlier in red (which isa real-time simulation of Earl2010).
Geophysical Research Letters 10.1002/2017GL074552
COHEN ET AL. VIOLATION OF GRADIENT BALANCE IN TCS 8024
be consistent with the circulation observed in the eye of TCs. However, the annular high found in these fewobservations is narrow compared with that found in high-resolution WRF simulations. There is a need formore detailed upper level observations at altitudes around 15 km (150 hPa) in order to examine the existenceof nonbalance and its impacts. The recent Tropical Cyclone Intensity observational campaign [e.g., Rogerset al., 2017], which was aimed at the upper levels of TCs, is promising in this regard.
ReferencesBryan, G. H., and R. Rotunno (2009), Evaluation of an analytical model for the maximum intensity of tropical cyclones, J. Atmos. Sci., 66(10),
3042–3060.Charney, J. G., and A. Eliassen (1964), On the growth of the hurricane depression, J. Atmos. Sci., 21(1), 68–75.Chen, H., and D. L. Zhang (2013), On the rapid intensification of Hurricane Wilma (2005). Part II: Convective bursts and the upper-level warm
core, J. Atmos. Sci., 70(1), 146–162.Durden, S. L. (2013), Observed tropical cyclone eye thermal anomaly profiles extending above 300 hPa, Mon. Weather Rev., 141(12),
4256–4268.Cohen, Y., Y. Dvorkin, and N. Paldor (2015), Linear instability of warm core, constant potential vorticity, eddies in a two-layer ocean, Q. J. R.
Meteorol. Soc., 141, 1884–1893.Eliassen, A. (1951), Slow thermally or frictionally controlled meridional circulation in a circular vortex, Astrophys. Norv., 5, 19.Emanuel, K. A. (1986), An air-sea interaction theory for tropical cyclones. Part I: Steady-state maintenance, J. Atmos. Sci., 43(6), 585–605.Emanuel, K. A. (1995), Sensitivity of tropical cyclones to surface exchange coefficients and a revised steady-state model incorporating eye
dynamics, J. Atmos. Sci., 52(22), 3639–3976.Emanuel, K., and R. Rotunno (2011), Self-stratification of tropical cyclone outflow. Part I: Implications for storm structure, J. Atmos. Sci., 68(10),
2236–2249.Emanuel, K., and F. Zhang (2017), The role of inner core moisture in tropical cyclone predictability and practical forecast skill, J. Atmos. Sci., 74,
2315–2324, doi:10.1175/JAS-D-17-0008.1.Halverson, J. B., J. Simpson, G. Heymsfield, H. Pierce, T. Hock, and L. Ritchie (2006), Warm core structure of Hurricane Erin diagnosed from high
altitude dropsondes during CAMEX-4, J. Atmos. Sci., 63(1), 309–324.Hirschberg, P. A., and J. M. Fritsch (1993), On understanding height tendency, Mon. Weather Rev., 121(9), 2646–2661.Holton, J. R. (2004), An Introduction to Dynamic Meteorology, 4th ed., Elsevier Acad. Press, New York.Kaplan, J., and M. DeMaria (2003), Large-scale characteristics of rapidly intensifying tropical cyclones in the North Atlantic basin, Weather
Forecasting, 18(6), 1093–1108.Koteswaram, P. (1967), On the structure of hurricanes in the upper troposphere and lower stratosphere, Mon. Weather Rev., 95(8),
541–564.Molinari, J., and D. Vollaro (1989), External influences on hurricane intensity. Part I: Outflow layer eddy angular momentum fluxes, J. Atmos.
Sci., 46(8), 1093–1105.Molinari, J., and D. Vollaro (1990), External influences on hurricane intensity. Part II: Vertical structure and response of the hurricane vortex,
J. Atmos. Sci., 47(15), 1902–1918.Molinari, J., S. Skubis, and D. Vollaro (1995), External influences on hurricane intensity. Part III: Potential vorticity structure, J. Atmos. Sci., 52,
3593–3606.Molinari, J., D. Vollaro, and K. L. Corbosiero (2004), Tropical cyclone formation in a sheared environment: A case study, J. Atmos. Sci., 61(21),
2493–2509.Montgomery, M. T., and B. F. Farrell (1993), Tropical cyclone formation, J. Atmos. Sci., 50(2), 285–310.National Hurricane Center (2010), Hurricane Igor discussion number 40. [Available at http://www.nhc.noaa.gov/archive/2010/al11/al112010.
discus.040.shtml.]Nolan, D. S., Y. Moon, and D. P. Stern (2007), Tropical cyclone intensification from asymmetric convection: Energetics and efficiency, J. Atmos.
Sci., 64(10), 3377–3405.Nolan, D. S., R. Atlas, K. T. Bhatia, and L. R. Bucci (2013), Development and validation of a hurricane nature run using the joint OSSE nature run
and the WRF model, J. Adv. Model. Earth Syst., 5(2), 382–405.Ohno, T., and M. Satoh (2015), On the warm core of a tropical cyclone formed near the tropopause, J. Atmos. Sci., 72(2), 551–571.Ooyama, K. (1969), Numerical simulation of the life cycle of tropical cyclones, J. Atmos. Sci., 26(1), 3–40.Ooyama, K. V. (1982), Conceptual evolution of the theory and modeling of the tropical cyclone, J. Meteor. Soc. Jpn., 60(1), 369–380.Peirano, C. M., K. L. Corbosiero, and B. H. Tang (2016), Revisiting trough interactions and tropical cyclone intensity change, Geophys. Res. Lett.,
43, 5509–5515, doi:10.1002/2016GL069040.Raymond, D., Z. Fuchs, S. Gjorgjievska, and S. Sessions (2015), Balanced dynamics and convection in the tropical troposphere, J. Adv. Model.
Earth Syst., 7, 1093–1116, doi:10.1002/2015MS000467.Rodgers, R., S. Aberson, D. Cecil, J. Doyle, J. Morgerman, T. Kimberlain, L. K. Shay, and C. Velden (2017), Re-writing the tropical record books:
The extraordinary intensification of Hurricane Patricia (2015), Bull. Am. Meteorol. Soc., doi:10.1175/BAMS-D-16-0039.1.Shapiro, L. J., and H. E. Willoughby (1982), The response of balanced hurricanes to local sources of heat and momentum, J. Atmos. Sci., 39,
378–394.Skamarock, W.C., Klemp, J.B., Dudhia, J., Gill, O. D., Barker, D. M., Duda, M. G. Huang, X., Wang, W. and J. G. Powers (2008), A description of the
advanced research WRF version 3, tech. Note, NCAR/TN-475+STR, Natl. Cent. for Atmos. Res., Boulder, Colo.Smith, R. K. (1980), Tropical cyclone eye dynamics, J. Atmos. Sci., 37, 1227–1232.Steenburgh, W. J., and J. R. Holton (1993), On the interpretation of geopotential height tendency equations, Mon. Weather Rev., 121(9),
2642–2645.Stern, D. P., and D. S. Nolan (2009), Reexamining the vertical structure of tangential winds in tropical cyclones: Observations and theory, J.
Atmos. Sci., 66(12), 3579–3600.Stern, D. P., and D. S. Nolan (2012), On the height of the warm core in tropical cyclones, J. Atmos. Sci., 69(5), 1657–1680.Stern, D. P., and F. Zhang (2013), How does the eye warm? Part I: A potential temperature budget analysis of an idealized tropical cyclone,
J. Atmos. Sci., 70(1), 73–90.Stern, D. P., and F. Zhang (2016), The warm core structure of Hurricane Earl (2010), J. Atmos. Sci., 73, 3305–3328.
Geophysical Research Letters 10.1002/2017GL074552
COHEN ET AL. VIOLATION OF GRADIENT BALANCE IN TCS 8025
AcknowledgmentsThe work was supported by the IsraeliScience Foundation grant 1537/12. Partof the work was done during the sab-batical of NH at Stockholm University,supported by a Rossby VisitingFellowship from the InternationalMeteorological Institute of StockholmUniversity. F.Z. and D.T. are partiallysupported by the Office of NavalResearch (grant N000140910526) andthe Hurricane and Severe StormSentinel (HS3) investigation underNASA’s Earth Venture Program andNOAA’s Hurricane ForecastImprovement Program (HFIP). D.N. issupported by NASA CloudSat Programthrough grant NNX16AP19G. We thankYonghui Weng for performing the real-world TC simulations used in this study,and the Texas Advanced ComputingCenter (TACC) for the computing. TheHurricane Nature Run simulation wasperformed at the Center for ComputingSciences at the University of Miami.Useful comments from both T. Croninand from another, anonymous, reviewergreatly contributed to the final form ofthis work.
Stern, D. P., D. S. Nolan, and F. Zhang (2015), Revisiting the relationship between eyewall contraction and intensification, J. Atmos. Sci., 72,1283–1206.
Weng, Y., and F. Zhang (2016), Advances in convection-permitting tropical cyclone analysis and prediction through EnKF assimilation ofreconnaissance aircraft observations, J. Meteor. Soc. Jpn., 94, 345–358.
Willoughby, H. E. (1990), Gradient balance in tropical cyclones, J. Atmos. Sci., 47, 225–274.Wirth, V., and T. J. Dunkerton (2009), The dynamics of eye formation andmaintenance in axisymmetric diabatic vortices, J. Atmos. Sci., 66(12),
3601–3620.Zhang, F., and D. Tao (2013), Effects of vertical wind shear on the predictability of tropical cyclones, J. Atmos. Sci., 70(3), 975–983.Zhang, F., and Y. Weng (2015), Predicting hurricane intensity and associated hazards: A five-year real-time forecast experiment with
assimilation of airborne Doppler radar observations, Bull. Am. Meteorol. Soc., 96(1), 25–33.
Geophysical Research Letters 10.1002/2017GL074552
COHEN ET AL. VIOLATION OF GRADIENT BALANCE IN TCS 8026