on the top? dávid németh chief economist 27 november 2014
TRANSCRIPT

on the top?
Dávid Németh chief economist
27 November 2014

growth outlook
2

development of investments

stagnation of investment in 2015
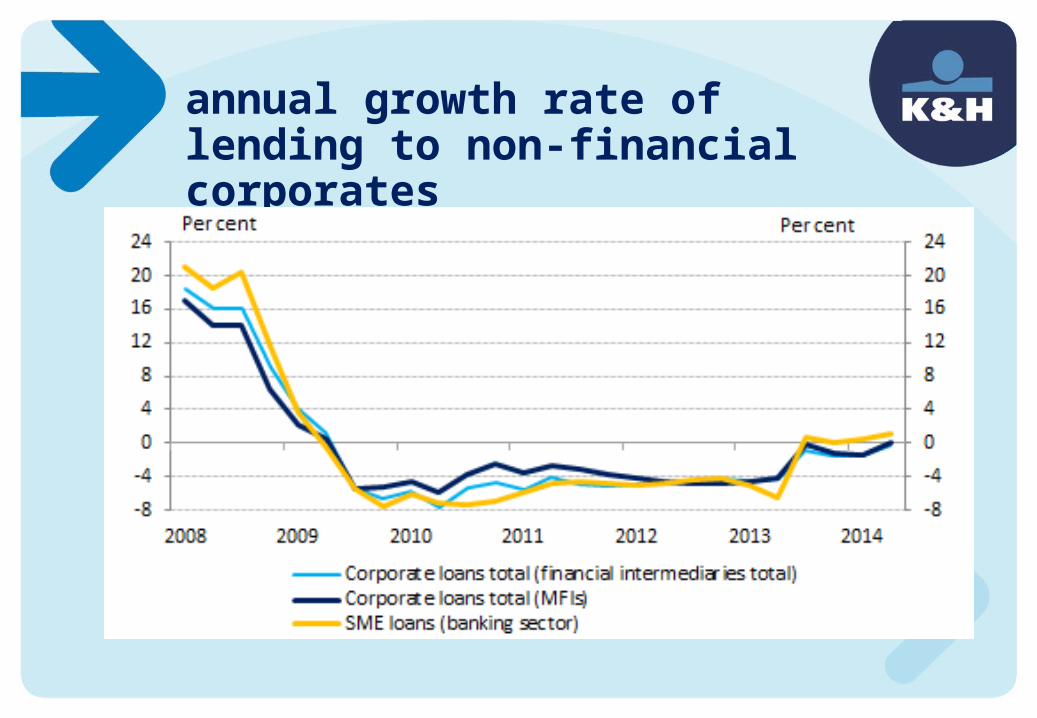
annual growth rate of lending to non-financial corporates

how consumption may develop?

contribution to GDP growth (demand side)
Forrás: KSH, K&H
-8,0
-6,0
-4,0
-2,0
0,0
2,0
4,0
6,0
8,0
06Q1 07Q1 08Q1 09Q1 10Q1 11Q1 12Q1 13Q1 14Q1 15Q1
Household consumption Government consumptionGross fixed capital formation Net exportGDP
K&H Forecast
'14 '15

inflation
8

infláció a fejlett gazdaságokban

10
inflációs várakozások a régióban

-14,0
-9,0
-4,0
1,0
6,0
11,0
16,0
2003 2004 2005 2006 2007 2008 2009 2010 2011 2012 2013 2014
Regulated prices vs CPI
-6,0
-4,0
-2,0
0,0
2,0
4,0
6,0
8,0
10,0
2003 2004 2005 2006 2007 2008 2009 2010 2011 2012 2013 2014
Alcohol, tobacco vs.CPI
inflationary development
Forrás: KSH, MNB, K&H
market priced goods and services vs. CPI
alcohol, tobacco vs. CPI regulated prices vs. CPI
-2,0
0,0
2,0
4,0
6,0
8,0
10,0
2006 2007 2008 2009 2010 2011 2012 2013 2014 2015
Inflation evolution (YoY %)
CPI (YoY %) MNB Core (YoY %) CPI adjusted for tax changes Inflation target
K&H Forecast
-8,0
-6,0
-4,0
-2,0
0,0
2,0
4,0
6,0
8,0
2003 2004 2005 2006 2007 2008 2009 2010 2011 2012 2013 2014
Goods Food Trade gds Free services

capital markets

base rate in the developed countries (%)
0
1
2
3
4
5
6
2001 2002 2003 2004 2005 2006 2007 2008 2009 2010 2011 2012 2013 2014
BOJ BOE FED ECB

decreasing rate environment in the region (%)
Forrás: NBH. K&H, Bloomberg
0
2
4
6
8
10
12
2007 2008 2009 2010 2011 2012 2013 2014
Czech Republic Poland Romania Slovakia

the tables have turned
Balance sheet of major central banks (in own currency)

market environment development of IRS (%)
Forrás: K&H, Bloomberg
2
3
4
5
6
7
8
9
10
11
12
2007 2008 2009 2010 2011 2012 2013 2014
1-year 3-year 5-year 10-year
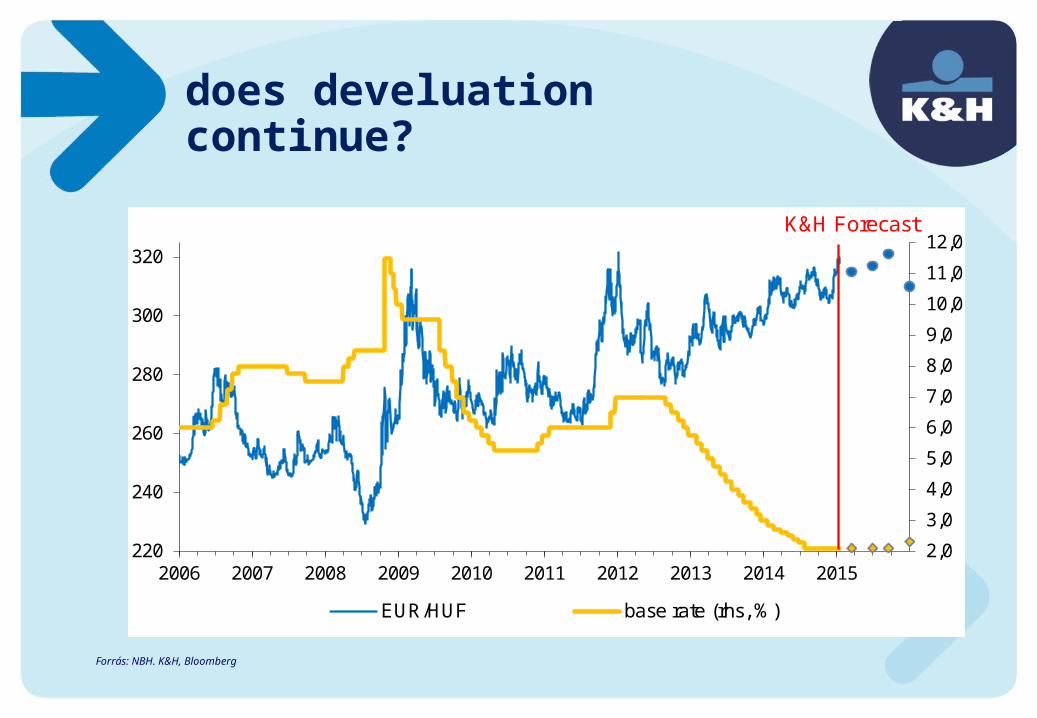
does develuation continue?
Forrás: NBH. K&H, Bloomberg
2,0
3,0
4,0
5,0
6,0
7,0
8,0
9,0
10,0
11,0
12,0
220
240
260
280
300
320
2006 2007 2008 2009 2010 2011 2012 2013 2014 2015
EUR/HUF base rate (rhs, %)
K&H Forecast

stability
18
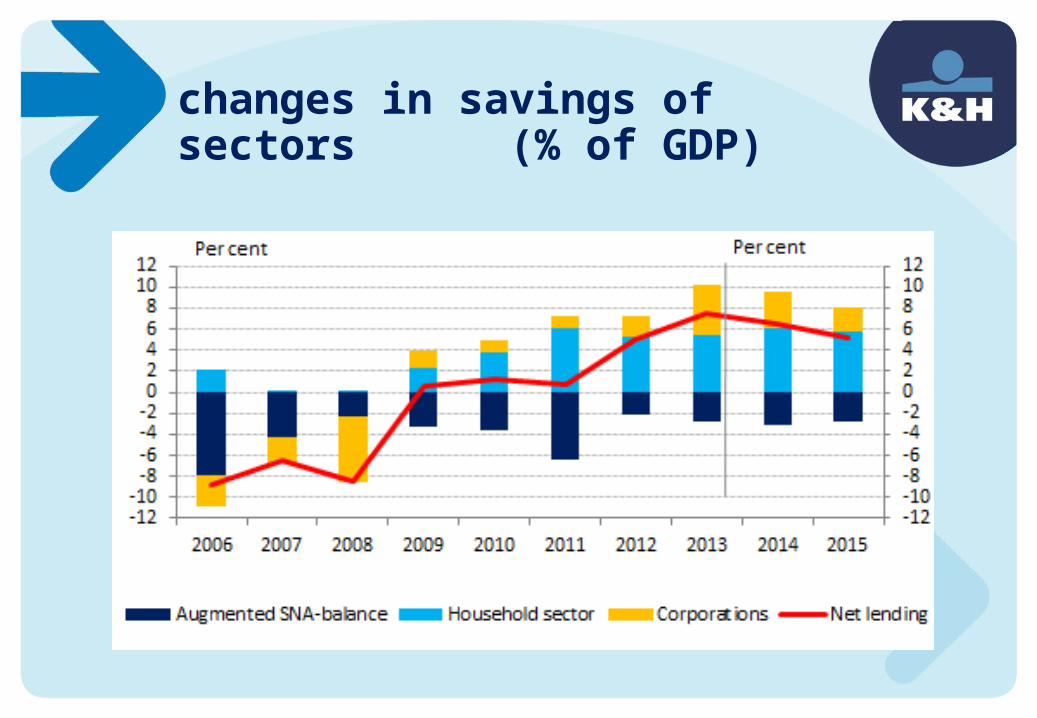
changes in savings of sectors (% of GDP)

breakdown of net external debt by sectors (% of GDP)
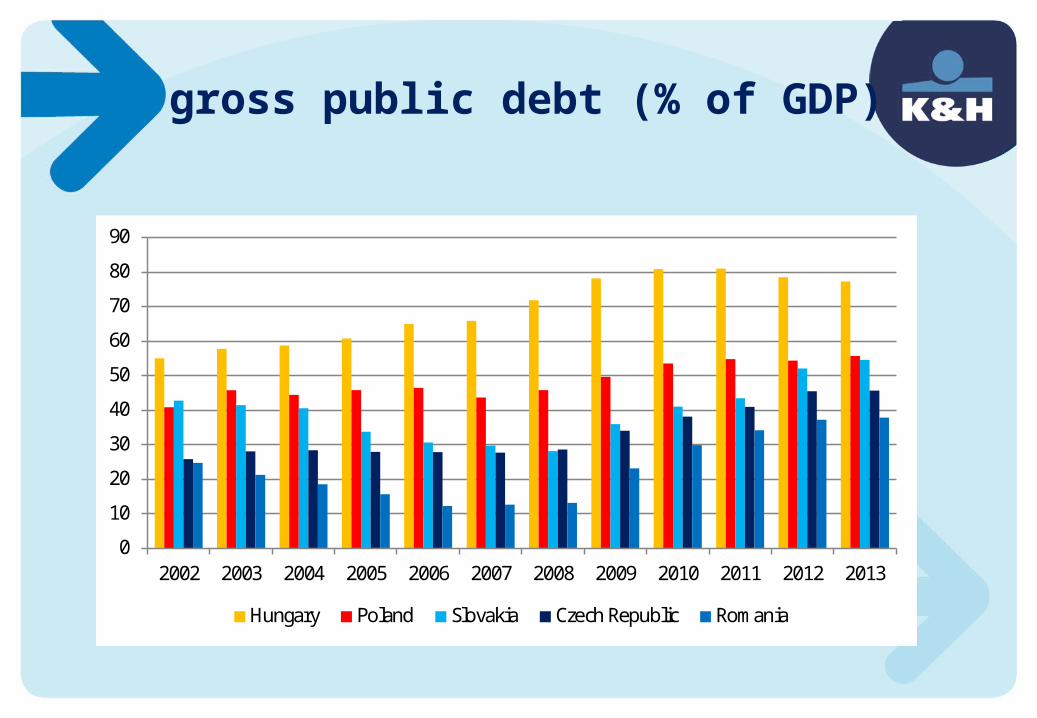
gross public debt (% of GDP)
0
10
20
30
40
50
60
70
80
90
2002 2003 2004 2005 2006 2007 2008 2009 2010 2011 2012 2013
Hungary Poland Slovakia Czech Republic Romania
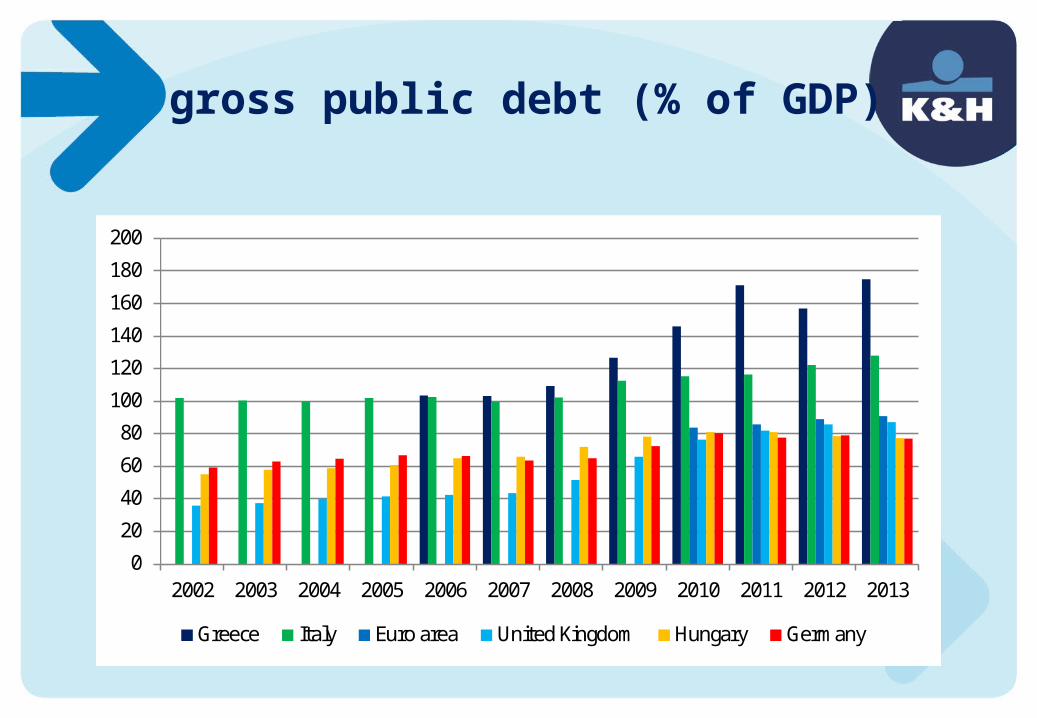
gross public debt (% of GDP)
0
20
40
60
80
100
120
140
160
180
200
2002 2003 2004 2005 2006 2007 2008 2009 2010 2011 2012 2013
Greece Italy Euro area United Kingdom Hungary Germany
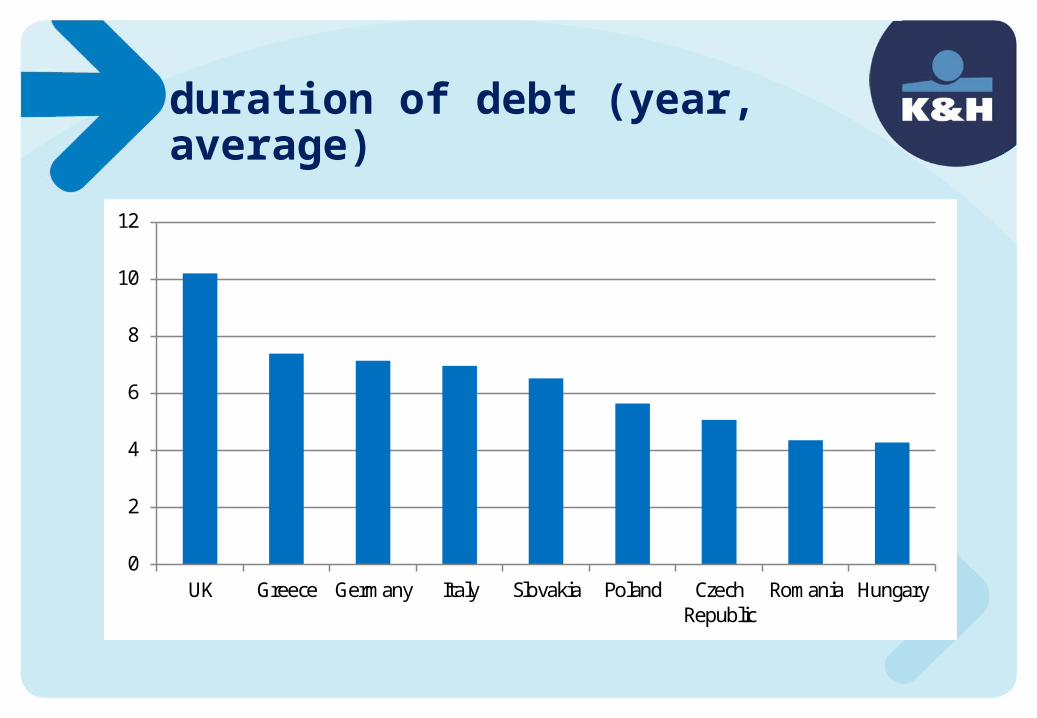
duration of debt (year, average)
0
2
4
6
8
10
12
UK Greece Germany Italy Slovakia Poland CzechRepublic
Romania Hungary
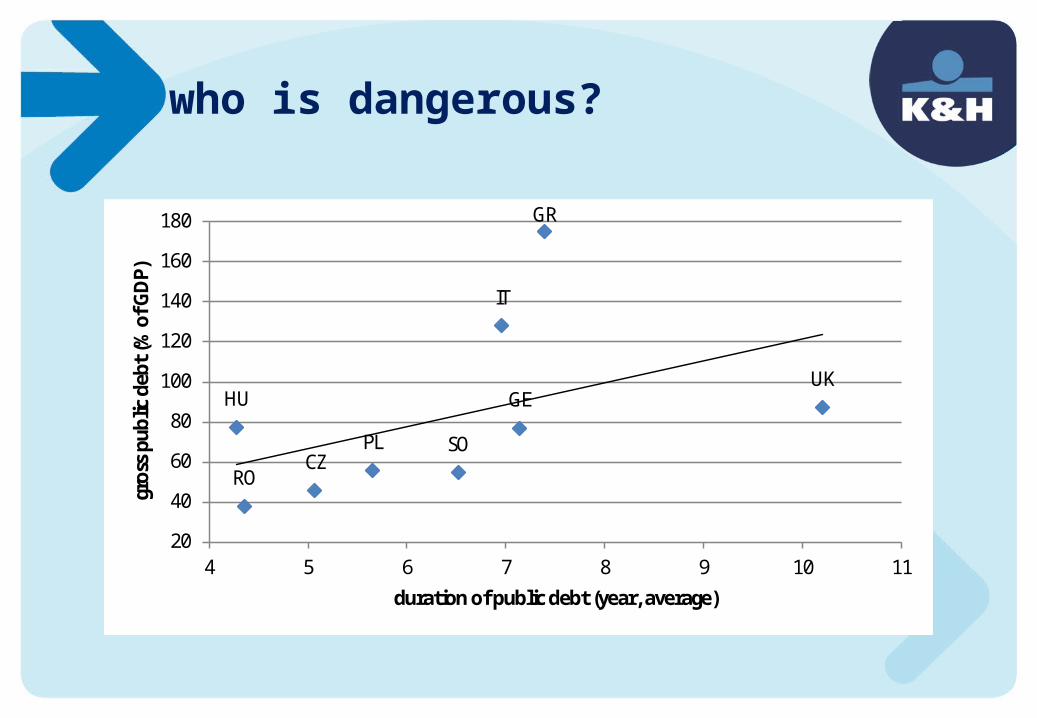
who is dangerous?
UK
GR
GE
IT
SOPLCZ
RO
HU
20
40
60
80
100
120
140
160
180
4 5 6 7 8 9 10 11
gros
s pu
blic
deb
t(%
of G
DP)
duration of public debt (year, average)

correlation between corporate lending and non-performing loans
Forrás: NBH. K&H, Bloomberg
Bank1
Bank2
Bank3
Bank4 Bank5
Bank6
Bank7
Bank8Bank9
-60
-50
-40
-30
-20
-10
0
10
0 5 10 15 20 25 30 35
Exch
ange
rate
adj
uste
d ch
ange
in c
orpo
rate
loan
s ou
tsta
ndin
g be
twee
n D
ecem
ber 2
008
and
June
20
14 (p
er c
ent)
NPL ratio of corporate loans, June 2014 (per cent)

household foreign currency loans as a percentage of GDP in regional comparison
Forrás: NBH. K&H, Bloomberg
024681012141618202224
02468
1012141618202224 per centper cent
Bulgaria Czech RepublicHungary PolandRomania Slovakia

developments in the loan-to-deposit ratio in an international comparison
Forrás: NBH. K&H, Bloomberg
60
70
80
90
100
110
120
130
140
150
160
60
70
80
90
100
110
120
130
140
150
160
Dec
-07
Mar Jun
Sep
Dec
-08
Mar Jun
Sep
Dec
-09
Mar Jun
Sep
Dec
-10
Mar Jun
Sep
Dec
-11
Mar Jun
Sep
Dec
-12
Mar Jun
Sep
Dec
-13
Mar
Jun-
14
HUF BnHUF Bn
Hungary Poland Slovakia Romania Bulgaria Czech Republic