on the relative pricing of long maturity s&p 500 index
TRANSCRIPT

Motivation Overview CDX Market The model Results Final Thoughts
On the relative pricing oflong maturity S&P 500 index options and CDX tranches
Pierre Collin-Dufresne Robert Goldstein Fan Yang
May 2010
——————————————————————

Motivation Overview CDX Market The model Results Final Thoughts
Motivation
Overview
CDX Market
The model
Results
Final Thoughts

Motivation Overview CDX Market The model Results Final Thoughts
Securitized Credit Markets Crisis
I Pre-crisis saw large growth in securitized credit markets (CDO).
I Pooling and tranching used to create ‘virtually risk-free’ AAA securities, in responseto high demand for highly rated securities.
I During the crisis all AAA markets were hit hard:I Home equity loan CDO prices fell (ABX.HE AAA < 60%).I Super Senior (30-100) tranche spreads > 100bps.I CMBX.AAA (super duper) >750bps.
I Raises several questions:Q? Were ratings incorrect (ex-ante default probability higher than expected)?
Q? Are ratings sufficient statistics (risk 6= expected loss)?
Q? Were AAA tranches mis-priced (relative to option prices)?
I Many other surprises:I Corporate Credit spreads widened (CDX-IG > 200bps).I Cash-CDS basis negative (-200 bps for IG; -700bps for HY).I LIBOR-Treasury and LIBOR-OIS widened (> 400bps).I Long term Swap spreads became negative (30 year swap over Treasury < −50 bps).I Defaults on the rise (Bear Stearns, Lehman).

Motivation Overview CDX Market The model Results Final Thoughts
Evidence from ABX markets
I ABX.HE (subprime) AAA and BBB spreads widened dramatically (prices dropped)
J.P.Morgan Inc.
I Stanton and Wallace (2009)

Motivation Overview CDX Market The model Results Final Thoughts
Evidence from CMBX markets
I CMBX (commercial real estate) AAA spreads widened even more dramatically
J.P.Morgan Inc.

Motivation Overview CDX Market The model Results Final Thoughts
Corporate IG CDX Tranche spreadsI The impact on tranche prices was dramatic
0.4
0.5
0.6
0.7
0.8
0.9
100
150
200
250
300
UPFRO
NT
SPRE
AD (b
ps)
0
0.1
0.2
0.3
‐50
0
50
1‐Aug‐04 17‐Feb‐05 5‐Sep‐05 24‐Mar‐06 10‐Oct‐06 28‐Apr‐07 14‐Nov‐07 1‐Jun‐08 18‐Dec‐08 6‐Jul‐09 22‐Jan‐10 10‐Aug‐10
Axis Title
DJ CDX.NA.IG (5Yr) CDX (5Y) 30‐100 SPREAD Mid CDX (5Y) 0‐3 UPFRONT Mid
I Implied correlation on equity tranche hit > 40%
I Correlation on Super-Senior tranches > 100%(!) with standard recovery assumption
I Relative importance of expected loss in senior tranche versus in equity trancheindicates increased crash risk.

Motivation Overview CDX Market The model Results Final Thoughts
Evidence from S&P500 Option markets
I Implied volatility index widened dramatically: increased market and crash risk.
40
50
60
70
80
90
VIX index
0
10
20
30
9/5/2005 3/24/2006 10/10/2006 4/28/2007 11/14/2007 6/1/2008 12/18/2008 7/6/2009 1/22/2010 8/10/2010

Motivation Overview CDX Market The model Results Final Thoughts
The Credit spread puzzle (pre-crisis)
source: Huang and Huang (2003)
I Huang and Huang (2003) find that Structural models, when calibrated to matchaverage loss rate, tend to underpredict yield spreads
I Chen, Collin-Dufresne, Goldstein (2008) find that standard models cannot explain thelevel of observed spreads because:
I (i) historical expected loss rates have been low, andI (ii) Idiosyncratic risk on typical IG bonds is very high (∼ 3/4 of total risk).

Motivation Overview CDX Market The model Results Final Thoughts
CDO collateral typically have high beta due to diversification
I Coval, Jurek, Stafford propose theory for large growth in structured product markets:
I Posit that ratings are sufficient statistic for expected loss.
I Tranching process pools risky securities (e.g., BBB) to create lower risk (e.g., AAA) andhigher risk (e.g., Z) securities by creating different levels of subordination (tranches).
I By nature of that process senior tranches have more systematic risk and thereforeshould have higher expected return for given expected loss (∼ rating).
I However investors focus only on expected loss (∼ rating).
⇒ Effectively, according to CJS, the banking sector exploits ‘naive’ investors bymanufacturing portfolios with same expected loss as generic AAA, but differentsystematic risk and selling them at identical prices.
I CJS find evidence for their story using CDX.IG synthetic tranche prices:
I Use pricing model for tranches based on the one-factor Gaussian copula marketstandard.
I Instead of assuming that the common factor has a Gaussian density (as in the standardmodel), the authors extract its density from long-term S&P500 option prices.
I Their results suggest that observed market spreads on all mezzanine and senior tranchesare substantially lower than model-implied ’fair’ spreads.
Motivation Overview CDX Market The model Results Final Thoughts
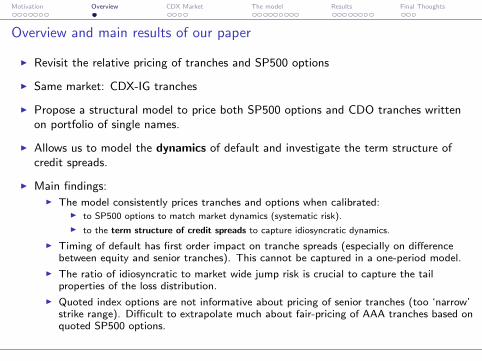
Overview and main results of our paper
I Revisit the relative pricing of tranches and SP500 options
I Same market: CDX-IG tranches
I Propose a structural model to price both SP500 options and CDO tranches writtenon portfolio of single names.
I Allows us to model the dynamics of default and investigate the term structure ofcredit spreads.
I Main findings:I The model consistently prices tranches and options when calibrated:
I to SP500 options to match market dynamics (systematic risk).
I to the term structure of credit spreads to capture idiosyncratic dynamics.
I Timing of default has first order impact on tranche spreads (especially on differencebetween equity and senior tranches). This cannot be captured in a one-period model.
I The ratio of idiosyncratic to market wide jump risk is crucial to capture the tailproperties of the loss distribution.
I Quoted index options are not informative about pricing of senior tranches (too ‘narrow’strike range). Difficult to extrapolate much about fair-pricing of AAA tranches based onquoted SP500 options.

Motivation Overview CDX Market The model Results Final Thoughts
The CDX index
I The CDX index is an insurance contract against credit events of a portfolio ofcounterparties (e.g., 125 names in CDX.IG):
I Prior to credit event:
protection buyer −−−−−−−−−−−−−−−−→outstanding notional×spread
protection seller
I Upon arrival of credit event of XYZ:
protection buyerXYZ delivervable bond−−−−−−−−−−−−−→ protection seller
protection buyerXYZ notional←−−−−−−−− protection seller
I Following credit event outstanding notional is reduced by notional of XYZ in portfolio(i.e., 1
125in CDX.IG).
I Contract expires at maturity or when notional exhausted.
I N.B.: CDX contract ≈ equally weighted portfolio of single name CDS contractsCDX spread ≈ average of single name CDS spreads

Motivation Overview CDX Market The model Results Final Thoughts
Synthetic CDO Tranches
I Selling protection on CDO tranche with attachment points [L,U] (i.e.,notional = U − L) written on underlying basket of 125 single names (CDX):
I Prior to a credit event:
protection buyer −−−−−−−−−−−−−−−−→outstanding notional×spread
protection seller
I Upon arrival of credit event (LGD = notional− deliverable bond price), if cumulative
loss exceeds lower attachment point (i.e., Lt =∑125
i=1 LGDi1{τi≤t} > L) then
protection buyermin(LGD,outstanding notional)←−−−−−−−−−−−−−−−−−− protection seller
I Following credit event outstanding tranche notional is reduced by LGD (up toexhaustion of outstanding notional).
I Also, super senior tranche notional is reduced by recovery (to satisfy ’adding upconstraint’).
I Contract expires at maturity or when tranche notional is exhausted.
I Tranche payoff is call spread on cumulative loss: max(Lt − L, 0)−max(Lt − U, 0).
⇒ Tranche valuation depends on entire distribution of cumulative portfolio losses andcrucially on default event correlation model.
Motivation Overview CDX Market The model Results Final Thoughts
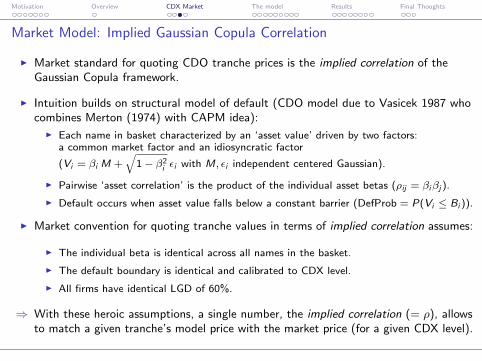
Market Model: Implied Gaussian Copula Correlation
I Market standard for quoting CDO tranche prices is the implied correlation of theGaussian Copula framework.
I Intuition builds on structural model of default (CDO model due to Vasicek 1987 whocombines Merton (1974) with CAPM idea):
I Each name in basket characterized by an ‘asset value’ driven by two factors:a common market factor and an idiosyncratic factor
(Vi = βi M +√
1− β2i εi with M, εi independent centered Gaussian).
I Pairwise ‘asset correlation’ is the product of the individual asset betas (ρij = βiβj ).
I Default occurs when asset value falls below a constant barrier (DefProb = P(Vi ≤ Bi )).
I Market convention for quoting tranche values in terms of implied correlation assumes:
I The individual beta is identical across all names in the basket.
I The default boundary is identical and calibrated to CDX level.
I All firms have identical LGD of 60%.
⇒ With these heroic assumptions, a single number, the implied correlation (= ρ), allowsto match a given tranche’s model price with the market price (for a given CDX level).

Motivation Overview CDX Market The model Results Final Thoughts
The implied correlation smile
I Market Quotes on Aug. 4, 2004 (CDX index spread 63.25 bp)
Tranche 0-3% 3-7% 7-10% 10-15% 15-30%CDX.IG (bps) 4138 349 135 46 14
I The market displays an implied correlation smile:
Imp Corr 21.7% 4.1% 17.8% 18.5% 29.8%
⇒ The smile shows that the Gaussian copula model is mis-specified (∼ option skew).
I Market quotes on June 1st 2005 IG4-5Y (CDX index spread of 42 bp):
Tranche 0-3% 3-7% 7-10% 10-15% 15-30%CDX.IG 3050 66 9.5 7.5 4Imp Corr 9.08% 5.8% 10.02% 16.77% 27.62%
I Market quotes on June 4, 2008 IG9-5Y (CDX index ref 118 bp):
Tranche 0-3% 3-7% 7-10% 10-15% 15-30% 30-100%CDX.IG 5150 435 232 130 70 41Imp Corr 40% 88.23% 4.31% 13.47% 32.06% 88.35%

Motivation Overview CDX Market The model Results Final Thoughts
A structural model for pricing long-dated S&P500 options
I The market model is the Stochastic Volatility Common Jump (SVCJ) model ofBroadie, Chernov, Johannes (2009):
dMt
Mt
= (r − δ) dt +√
Vt dwQ1
+ (ey − 1) dq − µ̄yλQdt − (ey
C − 1) (dqC − λQC
dt)
dVt = κV (V̄ − Vt )dt + σV
√Vt (ρdwQ
1+√
1− ρ2dwQ2
) + yV dq
dδt = κδ (δ̄ − δt ) dt + σδ√
Vt (ρ1 dwQ1
+ ρ2 dwQ2
+√
1− ρ21− ρ2
2dwQ
3) + yδ dq.
I We add stochastic dividend yield (SVDCJ) to be help fit long-dated options as well.
I The parameters of the model are calibrated to 5-year index option prices obtainedfrom CJS.
I State variables are extracted given parameters from time-series of short maturityoptions (obtained from OptionMetrics).
I Advantage of using structural model: Arbitrage-free extrapolation into lower strikes(needed for senior tranches).
Motivation Overview CDX Market The model Results Final Thoughts
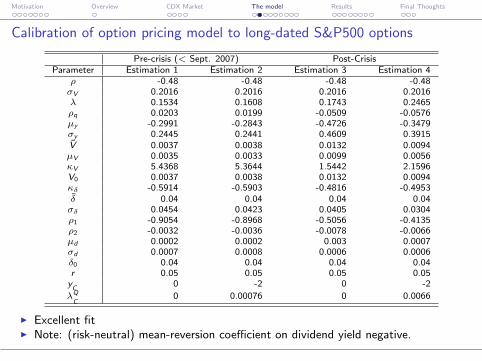
Calibration of option pricing model to long-dated S&P500 options
Pre-crisis (< Sept. 2007) Post-CrisisParameter Estimation 1 Estimation 2 Estimation 3 Estimation 4
ρ -0.48 -0.48 -0.48 -0.48σV 0.2016 0.2016 0.2016 0.2016λ 0.1534 0.1608 0.1743 0.2465ρq 0.0203 0.0199 -0.0509 -0.0576µy -0.2991 -0.2843 -0.4726 -0.3479σy 0.2445 0.2441 0.4609 0.3915V̄ 0.0037 0.0038 0.0132 0.0094µV 0.0035 0.0033 0.0099 0.0056κV 5.4368 5.3644 1.5442 2.1596V0 0.0037 0.0038 0.0132 0.0094κδ -0.5914 -0.5903 -0.4816 -0.4953δ̄ 0.04 0.04 0.04 0.04σδ 0.0454 0.0423 0.0405 0.0304ρ1 -0.9054 -0.8968 -0.5056 -0.4135ρ2 -0.0032 -0.0036 -0.0078 -0.0066µd 0.0002 0.0002 0.003 0.0007σd 0.0007 0.0008 0.0006 0.0006δ0 0.04 0.04 0.04 0.04r 0.05 0.05 0.05 0.05
yC
0 -2 0 -2
λQ
C0 0.00076 0 0.0066
I Excellent fitI Note: (risk-neutral) mean-reversion coefficient on dividend yield negative.

Motivation Overview CDX Market The model Results Final Thoughts
Pre-crisis Option pricing fit
0.4 0.6 0.8 1 1.2 1.4 1.6 1.810
15
20
25
30
MoneynessBla
ck−
Sch
oles
Impl
ied
Vol
atili
ties
(%)
Fitted five−year option−implied volatility function
No Catastrophe JumpBenchmarkData
0 0.5 1 1.5 2 2.5 30
0.5
1
1.5
Moneyness
Ris
k−N
eutr
al D
ensi
ty
Five−year option−implied risk−neutral distribution
No Catastrophe JumpBenchmark
0 0.5 1 1.5 2 2.5 30
0.5
1
1.5
Moneyness
Ris
k−N
eutr
al D
ensi
ty
Five−year option−implied risk−neutral distribution
BenchmarkCoval

Motivation Overview CDX Market The model Results Final Thoughts
During-Crisis Option pricing fit
0.4 0.6 0.8 1 1.2 1.4 1.6 1.820
22
24
26
28
30
32
34
Moneyness
Bla
ck−
Sch
oles
Impl
ied
Vol
atili
ties
(%)
Fitted five−year option−implied volatility function
No Catastrophe JumpBenchmarkData
0 0.5 1 1.5 2 2.5 30
0.1
0.2
0.3
0.4
0.5
0.6
0.7
Moneyness
Ris
k−N
eutr
al D
ensi
ty
Five−year option−implied risk−neutral distribution
No Catastrophe JumpBenchmark

Motivation Overview CDX Market The model Results Final Thoughts
A structural model of individual firm’s default
I Given market dynamics, we assume individual firm i dynamics:
dAi (t)
Ai (t)+ δA dt − rdt = βi
(√Vt dwQ
1+ (ey − 1) dq − µ̄yλ
Qdt)
+ σi dwi
+ (eyC − 1) (dqC − λ
QC
dt) + (eyi − 1) (dqi − λ
Qi
dt).
I NoteI β: exposure to market excess return (i.e., systematic diffusion and jumps).
I dqC : ‘catastrophic’ market wide jumps.
I dqi : idiosyncratic firm specific jumps.
I dwi : idiosyncratic diffusion risks.
I Default occurs the first time firm value falls below a default barrier Bi (Black (1976)):
τi = inf{t : Ai (t) ≤ Bi}. (1)
I Recovery upon default is a fraction of the remaining asset value: (1− `)Bi .

Motivation Overview CDX Market The model Results Final Thoughts
Pricing of the CDX index via Monte-Carlo
I The running spread on the CDX index is closely related to a weighted average of CDSspreads.
I Determined such that the present value of the protection leg (Vidx,prot ) equals thePV of the premium leg (Vidx,prem ):
Vidx,prem (S) = S E
[M∑
m=1
e−rtm (1− n(tm )) ∆ +
∫ tm
tm−1
du e−ru (u − tm−1 ) dnu
]
Vidx,prot = E
[∫ T
0
e−rt dLt
].
I We have defined:I The (percentage) defaulted notional in the portfolio:n(t) = 1
N
∑i 1{τi
≤t} ,
I The cumulative (percentage) loss in the portfolio: L(t) = 1N
∑i 1{τi
≤t} (1− Ri (τi ))

Motivation Overview CDX Market The model Results Final Thoughts
Pricing of the CDX Tranches via Monte-Carlo
I The tranche loss as a function of portfolio loss is
Tj (L(t)) = max[L(t)− Kj−1 , 0
]−max
[L(t)− Kj , 0
].
I The initial value of the protection leg on tranche-j is
Protj (0,T ) = EQ
[∫ T
0
e−rt dTj (L(t))
]I For a tranche spread Sj , the initial value of the premium leg on tranche-j is
Premj (0,T ) = Sj EQ
[M∑
m=1
e−rtm
∫ tm
tm−1
du(Kj − Kj−1 − Tj (L(u))
)].
I Appropriate modifications to the cash-flows
I Equity tranche (upfront payment),
I Super-senior tranche (recovery accounting).

Motivation Overview CDX Market The model Results Final Thoughts
Calibration of firms’ asset value processes
I Calibrate 7 (unlevered) asset value parameters (β, σ,B, λ1, λ2, λ3, λ4) to matchmedian CDX-series firm’s:
I Market betaI Idiosyncratic risk (estimated from rolling regressions for CDX series constituents using
CRSP-Compustat)I Term structure of CDX spreads (1 to 5 year)
I Set jump size to -2 (∼ jump to default).
I Calibrate catastrophic jump intensity λC = 0.00076 (less than 1 event per 1000 years)to match super-senior tranche spread (or set to zero for comparison).
I Set loss given default ` to 40% (∼ match historical average) in normal times.
I Set ` = 20% if catastrophe jump occurs (∼ Altman et al.).
I Market volatility, jump-risk, dividend-yield all estimated from S&P500 option data inprevious step.
Motivation Overview CDX Market The model Results Final Thoughts
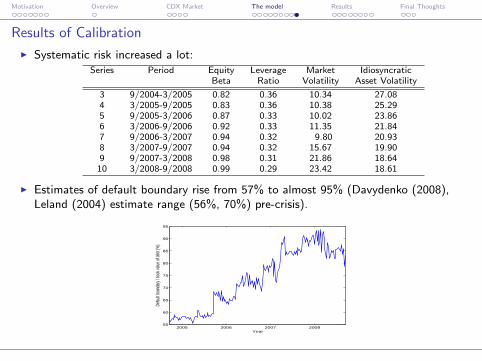
Results of Calibration
I Systematic risk increased a lot:Series Period Equity Leverage Market Idiosyncratic
Beta Ratio Volatility Asset Volatility
3 9/2004-3/2005 0.82 0.36 10.34 27.084 3/2005-9/2005 0.83 0.36 10.38 25.295 9/2005-3/2006 0.87 0.33 10.02 23.866 3/2006-9/2006 0.92 0.33 11.35 21.847 9/2006-3/2007 0.94 0.32 9.80 20.938 3/2007-9/2007 0.94 0.32 15.67 19.909 9/2007-3/2008 0.98 0.31 21.86 18.64
10 3/2008-9/2008 0.99 0.29 23.42 18.61
I Estimates of default boundary rise from 57% to almost 95% (Davydenko (2008),Leland (2004) estimate range (56%, 70%) pre-crisis).
2005 2006 2007 200855
60
65
70
75
80
85
90
95
Year
Defau
lt bou
ndar
y / bo
ok va
lue of
debt
(%)

Motivation Overview CDX Market The model Results Final Thoughts
Average tranche spreads predicted for pre-crisis period
I We report six tranche spreads averaged over the pre-crisis period Sep 04 - Sep 07:I The historical values;I Benchmark model: Catastrophic jumps calibrated to match the super-senior tranche;
Idiosyncratic jumps and default boundary calibrated to match the 1 to 5 year CDXindex.
I λQC
= 0: No catastrophic jumps; Idiosyncratic jumps and default boundary calibrated tomatch 1 to 5 year CDX index;
I λQi
= 0: Catastrophic jumps calibrated to match the super-senior tranche; Noidiosyncratic jumps; Default boundary calibrated to match only the 5Y CDX index.
I λQC
= 0, λQi
= 0: No catastrophic jumps; No idiosyncratic jumps; Default boundarycalibrated to match only the 5Y CDX index;
I The results reported by CJS
0-3% 3-7% 7-10% 10-15% 15-30% 30-100% 0-3% Upfrtdata 1472 135 37 17 8 4 0.34benchmark 1449 113 25 13 8 4 0.33λQ
C= 0 1669 133 21 6 1 0 0.40
λQi
= 0 1077 206 70 32 12 4 0.22
λQC
= 0, λQi
= 0 1184 238 79 31 6 0 0.26CJS 914 267 150 87 28 1 na|CJS−Data|
|Benchmark−Data| 24.3 6 9.4 17.5 ∞ ∞

Motivation Overview CDX Market The model Results Final Thoughts
Interpretation
I Errors are an order of magnitude smaller than those reported by CJS.
I However, model without jumps (λQC
= 0, λQi
= 0) generates similar predictions toCJS.
I Why? Problem is two-fold:
I Backloading of defaults in standard diffusion model:
Average CDX index spreads for different models
1 year 2 year 3 year 4 year 5 yearData 13 20 28 36 45Benchmark 13 20 28 36 45
λQ
C= 0 13 20 28 36 45
λQ
i= 0 6 7 16 29 45
(λQ
C= 0, λQ
i= 0) 0 3 13 28 45
I Idiosyncratic jumps generates a five-year loss distribution that is more peaked aroundthe risk-neutral expected losses of 2.4%.(loss distribution with λQ
C= 0, λQ
i= 0 has std dev of 2.9%, whereas loss distribution
with (λQi> 0, λQ
C= 0) has std dev of 1.7%).

Motivation Overview CDX Market The model Results Final Thoughts
In Summary:
I In order to estimate tranche spreads, it is necessary that the model be calibrated tomatch the term structure of credit spreads.
I Specifying a model with idiosyncratic dynamics driven only by diffusive risksgenerates a model where:
I the timing of defaults is backloaded.
⇒ Counter-factually low spreads/losses at short maturities, which biases down the equitytranche spread.
I the ratio of systematic to idiosyncratic default risk is too high.
⇒ Excessively fat-tailed loss distribution, which biases senior tranche spreads up.
I In addition, the super-senior tranche spread (and therefore, spreads on other seniortranches) cannot be extrapolated from option prices alone.
I However, spreads on other tranches can be interpolated reasonably well given optionprices and super-senior tranche spreads.
I S&P 500 options and CDX tranche prices market can be fairly well reconciled withinour arbitrage-free model.

Motivation Overview CDX Market The model Results Final Thoughts
Time Series Results
I Keeping parameters of the option pricing model fixed, each week, we fitI the state variables Vt and δt to match quoted option prices.I The intensity of the catastrophic jump to match the super-senior tranche,I The default barrier and idiosyncratic jump intensity parameters to match the term
structure of CDX index spreads with maturities of one-year to five-years.
2005 2006 2007 20080.025
0.03
0.035
0.04
0.045
Year
δ t
2005 2006 2007 20080
0.05
0.1
0.15
0.2
Year
Vt
2005 2006 2007 20080
5
10
15
Year
RM
SE
t (%
)

Motivation Overview CDX Market The model Results Final Thoughts
Series that we match ‘in-sample’ in benchmark model
2005 2006 2007 20080
100
200
3001−Year Index
Year
Spre
ads(
bps)
2005 2006 2007 20080
50
100
150
2002−Year Index
Year
Spre
ads(
bps)
2005 2006 2007 20080
50
100
150
2003−Year Index
Year
Spre
ads(
bps)
2005 2006 2007 20080
50
100
150
2004−Year Index
YearSp
read
s(bp
s)
2005 2006 2007 20080
50
100
150
2005−Year Index
Year
Spre
ads(
bps)
2005 2006 2007 20080
20
40
60
80
10030−100% Tranche
Year
Spre
ad(b
ps)

Motivation Overview CDX Market The model Results Final Thoughts
‘Out of Sample’ Time Series Predictions of benchmark model
2005 2006 2007 20080
0.2
0.4
0.6
0.80−3% Tranche
Year
Upfro
nt F
ee
2005 2006 2007 20080
2000
4000
60000−3% Tranche
Year
Spre
ad(b
ps)
Data Model Coval
2005 2006 2007 20080
500
1000
15003−7% Tranche
Year
Spre
ad(b
ps)
2005 2006 2007 20080
100
200
300
400
5007−10% Tranche
YearSp
read
(bps
)
2005 2006 2007 20080
100
200
30010−15% Tranche
Year
Spre
ad(b
ps)
2005 2006 2007 20080
50
100
15015−30% Tranche
Year
Spre
ad(b
ps)

Motivation Overview CDX Market The model Results Final Thoughts
Robustness Analysis
I We study the effects of relaxing some of our simplifying assumptions:I firm homogeneity,I no changes in capital structure,I uncorrelated idiosyncratic shocks (i.e., “no industry effects”),I constant firm-level asset dividend yield, (with stochastic market equity dividend yield)I constant interest rates.
I We still calibrate the model to 5-year option implied volatilities, 1-5 year CDX indices,and the super-senior tranche spreads.
0-3% 3-7% 7-10% 10-15% 15-30% 30-100% 0-3% Upfrtdata 1472 135 37 17 8 4 0.34benchmark 1449 113 25 13 8 4 0.33Dynamic capital structure 1452 116 27 14 8 4 0.34Stochastic firm payout 1441 122 29 14 9 4 0.33SVCJ 1330 138 47 26 12 4 0.30Heterogeneous initial credit spreads 1406 133 28 13 8 4 0.32Stochastic short-term rate 1484 114 22 11 8 4 0.36Industry Correlations 1370 153 31 16 10 5 0.31
Table: Robustness check
Motivation Overview CDX Market The model Results Final Thoughts
Details of robustness checks
I Dynamic capital structure: We assume that if a firm performs well, it will issueadditional debt, in turn raising the default boundary AB (t + dt) = max[AB (t), c A(t)]
I Stochastic asset dividend yield at the firm level: We specify the firm payout ratio asδA(t) = δ̄A + ξ(δt − δ̄), where δ̄A = 0.05 is the average payout ratio, and ξ = 0.7measures the correlation of dynamics of the firm payout ratio and marketdividend-price ratio.
I Constant market equity dividend yield: we specify market dynamics using the SVCJoption model so that both the market dividend price ratio and the firm payout ratioare constants in this scenario.
I Heterogeneity in initial credit spreads: We use our model to back out the defaultboundaries for each firm based on their average 5-year CDS spreads in the on-the-runperiod of Series 4. The 5-year CDS spreads are from Datastream. The cross-sectionalmean and the standard deviation of the log default boundaries are -1.59 and 0.344.we specify a distribution for the log default boundaries of the 125 firms using anormal distribution with the above parameters.
I Stochastic interest rates: We specify the spot rate to follow Vasciek (1977).
I Industry Correlations: we assume that there are approximately two firms per industrywith dynamics that are perfectly correlated. As such, instead of modeling 125 firms,we consider only 60 “industries”.

Motivation Overview CDX Market The model Results Final Thoughts
Conclusion of our analysisI It is possible to reconcile pricing of SP500 options and CDX-IG tranches within an
arbitrage-free structural model of default.
I It is crucial to calibrate the model to the term structure of credit spreads to correctlyaccount for the timing of defaults and the ratio of idiosyncratic to systematic defaultrisk.
I Difference between the equity and senior tranche ‘fair spreads’ are sensitive to thetiming of default. This is not easily captured in a static model.
I The ratio of idiosyncratic to systematic default risk varied much during the pre topost crisis period. More systematic risk implied from S&P 500 options actually leadto senior tranche spreads predicted by the model being larger during the crisis thanobserved (given that the model fits super-senior).
I If anything the model suggests that relative prices of tranches and options were ‘moreconsistent’ pre-crisis than during the crisis (in contrast to CJS (2009a,b)).
I Quoted index options are not very informative about pricing of super senior tranches:Quoted strike range is too ‘narrow.’
I Caveat: The recalibration of model parameters (default intensities) over time is notinternally consistent.

Motivation Overview CDX Market The model Results Final Thoughts
Are senior tranches priced inefficiently by naive investors?I Investors care only about expected losses (∼ ratings) and not about covariance
(ironic since they trade in correlation markets!).
⇒ Spreads across AAA assets should be equalized. Are they?
⇒ All spreads should converge to Physical measure expected loss.I We observe large risk-premium across the board (λQ/λP > 6.)I Large time-variation in that risk-premium.
⇒ Time-variation in spreads should be similar to that of rating changes (smoother?).
I Evidence seems inconsistent with marginal price setters caring only about expectedloss (∼ ratings).

Motivation Overview CDX Market The model Results Final Thoughts
What drives differences between structured AAA spreads?I ’Reaching for yield’ by rating constrained investors who want to take more risk
because their incentives (limited liability) and can because ratings simply do notreflect risk and/or expected loss.
I Taking more risk by loading on systematic risk was the name of the game (agencyconflicts).
I Possible that excess ‘liquidity’/leverage lead to spreads being ‘too’ narrow in allmarkets, but little evidence that markets were ex-ante mis-priced on a relative basis.
I Ex-post (during the crisis) other issues, such as availability of collateral and fundingcosts, seem more relevant to explain cross-section of spreads across markets.
I Indeed, how to explain negative and persistent:I swap spreads?
I cds basis?