on the reinforcement homogenization in cnt/metal matrix
TRANSCRIPT

On the reinforcement homogenization in CNT/Metal Matrix
Composites during Severe Plastic Deformation
Katherine Aristizabala, Andreas Katzensteinerb, Andrea Bachmaierb, Frank Mücklicha, Sebastian
Suáreza
aChair of Functional Materials, Department of Materials Science, Saarland University, Campus
66123, Saarbrücken, Germany
bErich Schmid Institute of Materials Science, Austrian Academy of Sciences, Jahnstrasse 12, A-
8700 Leoben, Austria
https://doi.org/10.1016/j.matchar.2018.01.007
Corresponding author. [email protected]
Abstract
Carbon nanotube (CNT)-reinforced nickel matrix composites with different concentrations were
processed by high pressure torsion (HPT). We thoroughly characterized the CNT agglomerates'
spatial arrangement at different stages of deformation in order to extract information valuable for
the optimization of the processing parameters and to elucidate the mechanisms involved during
the processing of particle reinforced metal matrix composites by HPT. From the electron
micrographs taken on the radial direction with increasing equivalent strains, we observed that
CNT agglomerates debond by relative sliding between CNT during HPT, becoming spherical at
higher stages of deformation. Furthermore, we introduced a model for the prediction of the
minimum strain required for a homogeneous distribution of a second phase during HPT, which
can be correlated to the material's three-dimensional structure and agrees well with the
experimental data.
Keywords: Carbon nanotubes; Metal-matrix composites; Severe Plastic deformation; Second-
phase distribution.

2
1. Introduction
The distribution of reinforcing phases in composite materials is of great importance
and has a big influence on their mechanical performance. Carbon nanotubes have been
widely used as reinforcing phase not only in polymer [1,2] and ceramic matrix composites
[3,4] but also in metal matrix composites [5–7]. Some authors have explored different
strategies for improving the distribution of CNT in MMC such as blending by mixing,
nano-scale dispersion, ball milling, cold spraying and molecular-level mixing [6,8,9]
However, blending by mixing has been found to deteriorate the mechanical properties of
the composites due to poor distribution of the CNT. Although nano-scale dispersion was
found to improve significantly the distribution of the CNT in Aluminum matrix, because it
consist in utilizing natural rubber in a mixture with the CNT and the metallic powder
alternatively stacked in a preform, it needs to be subjected to high temperatures (800°C) in
order to burn the rubber and to melt the metal, which would imply the use of even higher
temperatures in the case of nickel, which has a melting point of 1455°C, adding further
difficulties to the manufacturing process. Ball milling and molecular-level mixing methods
also improve significantly the dispersion of the CNT, both producing large agglomerates'
sizes of about some microns to some millimeters. Ball milling also results in severe
damage to the CNT. A thorough discussion of the advantages and drawbacks of each
technique is beyond the scope of this manuscript and can be found in [6] and the references
therein. Therefore, given their tendency to form agglomerates due to Van der Waals forces,
a homogeneous distribution of CNT is still a challenging task.

3
High-pressure torsion, a severe plastic deformation process, has shown to be a
powerful tool for improving the distribution of particles in MMC. I. Sabirov et al, showed
how ceramic particles are reduced in size and dispersed inside the metallic matrix by
debonding [10]. During HPT, the sample is placed between two anvils using high pressures
(> 2 GPa) and rotated in quasi-constrained conditions a certain number of turns (T). By the
action of plastic flow and the generation, mobility and re-arrangement of dislocations, a
refinement of the microstructure takes place and the strength of the material increases with
increasing strain until the saturation in the microstructural refinement is reached [11].
Nevertheless, these microstructures possess high stored energy in their large grain boundary
area. Recently, based on their ability to pin the microstructure [5], CNT have been used as
stabilizing phase against grain growth [12,13] in MMC processed by severe plastic
deformation. However, in order to efficiently fulfill their stabilization task, CNT should be
homogeneously distributed [14], which is also expected to increase the mechanical
performance of these MMC. For that purpose, the processing route used in this work started
by colloidal mixing of the CNT with the metallic Nickel powder, followed by the cold
pressing and hot sintering of the blends and succeeding processing by means of high
pressure torsion.
For qualitative assessment of the distribution, directly observation of electron
micrographs is sufficient. Previously, a preliminary assessment of the reinforcement
homogeneity in CNT/Ni MMC was carried out [15]. In the present study the aim is to
extract quantitative information from the electron micrographs on the CNT agglomerate
size and spatial distribution in MMC subjected to severe plastic deformation, and correlate

4
it to the mechanisms involved in the deformation of the reinforcement during processing,
seeking the optimization of the process parameters and the improvement of the physical
properties of the composites. Some quantitative methods on the evaluation of the dispersion
and distribution of CNT in MMC have been proposed in the literature [16–19]. A thorough
discussion of the different quantification methods can be found elsewhere [20].
Furthermore, event-to-event (nearest neighbor distance NND), based methods, commonly
used in spatial statistics, have been used in unidirectional composites [21]. Moreover, the
method of Region Homogeneity HRO has been proposed as an easy way of assessing the
distribution homogeneity of second phases in metallic materials [22] and also of CNT
agglomerates in MMC [23]. The advantages and limitations of the latter in the evaluation of
MMC processed by SPD are discussed here.
In this work, an extensive clustering and distribution homogeneity analysis was
performed with the aim of understanding the behavior of the CNT during the deformation
process as a function of the accumulated deformation. For the evaluation of the studied
composites’ homogeneity, a NND clustering analysis-based methodology is used, which
can be completely carried out using open source software [24,25]. From the electron
micrographs, a CNT agglomerate-debonding mechanism by relative sliding between CNT
during HPT is observed, which contributes to the understanding of the reinforcement
arrangement after the processing by severe plastic deformation of CNT MMC. Finally, a
model for the prediction of the minimum equivalent strain that should be applied during
HPT for a homogenous distribution of particles in MMC is proposed, which provides a
basis for the optimization of the processing parameters.

5
2. Experimental
2.1. Manufacturing and HPT processing of CNT/Ni composites
The composites were obtained via powder metallurgy and further processed by
HPT. The starting materials were MWCNT (CCVD grown, Graphene Supermarket, USA
density 1.84 g/cm3, diameter: 50-85 nm, length: 10-15 m, carbon purity: >94%) and
dendritic Ni powder (Alfa Aesar, mesh -325). A colloidal mixing process was used to blend
the precursor powders by which CNT are dispersed in ethylene glycol EG (CNT/EG
concentration ratio at 0.2 mg/ml) and mixed with Ni powder. A thorough description of this
process is reported elsewhere [26]. The CNT fractions used were 0.5, 1, 2 and 3 wt. % (2.4,
4.7, 9 and 13 vol. %, respectively). The powders were dried and cold pressed under 990
MPa and subsequently sintered in a hot uniaxial press HUP under vacuum (2 x 10⁻⁶ mbar)
at 750 °C for 2.5 h with a 264 MPa axial pressure. Sintered samples were further processed
by means of HPT at room temperature using 1, 4, 10 and 20 T under 4 GPa of pressure.
Samples with 1 wt. % CNT were processed 30 T at room temperature RT and at 200ºC,
were also analyzed. Fig. 1 shows schematically the HPT set up.

6
Figure 1 Schematic HPT set up used for sample processing.
2.2. Characterization
The HPT samples were cut in halves, embedded in conductive resin and fine
polished using polishing discs with the aid of 6, 3 and 1 m diamond suspensions and
finally with OPS colloidal silica. The samples were then characterized by scanning electron
microscopy (SEM) using a Helios NanoLabTM 600 dual beam field emission microscope
(FEI Company). The analysis of the microstructure was carried out along the middle plane,
in order to avoid the effect of the microstructural gradients along the height of the
specimens [27]. The images were taken every 1 mm with a resolution of 12.5 nm per pixel
along the radial direction, corresponding to increasing equivalent strain values, according to
εeq= 2πTrt√3
, where T is the number of turns, t is the sample thickness and r the distance from
the center of the sample [28]. In the case of HPT samples, the micrographs were acquired at
10 kX magnification, resulting in a field of view of (12.8 x 12.8) m2. The choice was

7
made based on the size of the agglomerates: if the images were to be taken at lower
magnifications, information about the smaller agglomerates in the case of the highly
deformed samples would be lost due to resolution issues. On the other hand, at higher
magnifications the larger agglomerates would be also neglected, since they would hardly fit
into the region of interest. Furthermore, the size was kept constant for comparison
purposes.
The images were digitally binarised and analyzed using the image processing
package FIJI [24]. Micrographs with corresponding binary images are shown exemplarily
in Fig. 2. The CNT agglomerates were considered as compact particles and a thorough
particle analysis was performed on each image. The particle analysis protocol was as
follows: the images were calibrated with the known scale; the threshold was adjusted
thoroughly, in order to separate the dark (CNT agglomerates) from the light regions (Ni
matrix), without removing pixels from the boundaries (manual segmentation was
performed when necessary) and finally, the images were made binary. Different size
descriptors (such as the area, the maximum and minimum Feret diameter and the perimeter)
and shape factors (such as roundness, circularity, aspect ratio etc.) can be obtained during
particle analysis. In this case, the particle area was obtained and the diameter of an
equivalent circumference was computed as the agglomerate equivalent diameter DCNT.
Additionally, the position of the agglomerate centers of mass was extracted and used to
calculate the NND (nearest neighbor distance). The evolution of the area weighted
agglomerate diameter and the mean NND with increasing equivalent strain were studied
(Fig. 3).

8
2.3 Quantitative assessment of the distribution homogeneity and clustering behavior
Furthermore, a set of samples was analyzed in terms of homogeneity and
distribution using two different methodologies. The quantitative assessment of the
homogeneity was carried out following the method proposed by Rossi et al [23]. The
agglomerate area fraction (phase amount) and the number of objects were obtained using
particle analysis in 20 different regions of interest using ROI manager in FIJI. The region
homogeneity HR is a constructed homogeneity obtained by multiplying the object number
homogeneity HNO and the phase amount homogeneity HPA. The partial homogeneities H
were calculated as the counterpart of the Gini G coefficients G: 𝐻 = 1 − 𝐺, which is a
Figure 2 Electron micrographs (upper row) and their respective binarized images
(lower row) from a 1 wt.% sample after 10 turns. The equivalent strain increases
from left to right. The dark regions correspond to CNT agglomerates.

9
measure of distribution inequality [22]. The Gini index of each parameter (object number
and phase amount as obtained from particle analysis in FIJI) was retrieved using the ineq
package in R studio, an integrated development environment for R, which is a
programming language for statistical computer and graphics [25].
Information about the agglomerates’ centers of mass was used for further point
pattern analysis by means of the nearest neighbor distance distribution function (G-
function) using the spatstat package in R Studio [29], in order to obtain more detailed
information about the spatial behavior between the individuals (CNT agglomerates' centers
of mass, treated as “points”) of the investigated population (studied areas, treated as “point
patterns”). This method consists on the comparison of the empirical cumulative distribution
function Gobs(r), with the nearest neighbor distribution function Gtheo(r) for complete spatial
randomness (CSR). The nearest neighbor distance distribution function for a CSR is
described by Gtheo(r)=1-exp(-NAπr2), where NA is the number of particles per unit area, and
r the evaluated distance. According to this, the condition Gobs(r) < Gtheo(r) is inherent of
regular patterns and the opposite case, Gobs(r) > Gtheo(r), is interpreted as “clustering” (for
example, Fig. a-c) because the NND are smaller than expected for the CSR case [30–32].
As there are numerous configurations for CSR, pointwise critical envelops with fixed
respective number of points (corresponding to each case), obtained from 100 Monte Carlo
simulations of CSR with a significance level of 2/101 = 0.0198 and spatial Kaplan-Meier
edge correction, which is performed in order to correct effects arising from the non-
visibility of points lying outside the evaluated field of view during the evaluation of the G-
Function [33], were plotted as the theoretical expected behavior.

10
Accordingly, the G-function is a useful tool in spatial statistics that summarizes the
“clustering” behavior of points in a point pattern. It displays the empiric cumulative
distribution of NND in contrast to that of the CSR with the same number of points within a
window of the same size. If a point pattern does not adjust to a Poisson pattern, then it can
be either clustered (i.e. when the particles are interacting and tend to come closer together)
or regular (i.e. when the points tend to avoid each other). It might be inferred that a
homogeneous sample, e.g. with a high HRO value, also does not display a clustering
behavior and vice versa. The G-Function can help to confirm or deny this statement. In this
case, border corrections are carried out and the size of the window is arbitrary. For this
reason, the G-function was chosen as a complementary method.
3. Results and discussion
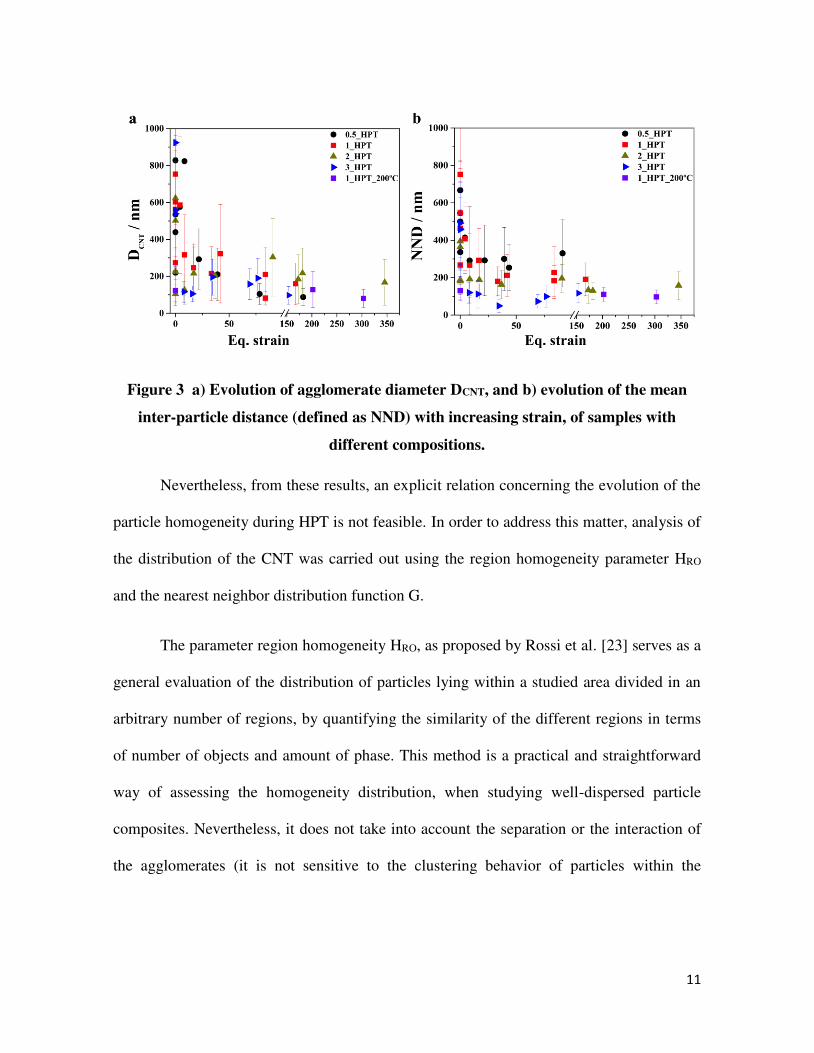
By plotting the area weighted mean agglomerate diameter DCNT and the mean NND
vs. Eq. Strain (Fig. 3) the evolution of both parameters with increasing strain can be
tracked. Results show that both, DCNT and NND decrease significantly in size during the
first stages of deformation approximately up to a strain of 20, but do not significantly
change afterwards, where both DCNT and NND are between 100 and 400 nm. The deviation
of the data also decreases with increasing strain. Fig. 3b also suggests that the agglomerates
come closer for higher CNT concentration. Furthermore, a previous study showed that the
agglomerate area fraction does not change significantly with increasing strain values [34].
Fig. 3 also displays information for a sample with 1 wt. % CNT processed with 30 T at
200 ºC. In the latter case, DCNT and NND are also within the same range discussed before.
11
Figure 3 a) Evolution of agglomerate diameter DCNT, and b) evolution of the mean
inter-particle distance (defined as NND) with increasing strain, of samples with
different compositions.
Nevertheless, from these results, an explicit relation concerning the evolution of the
particle homogeneity during HPT is not feasible. In order to address this matter, analysis of
the distribution of the CNT was carried out using the region homogeneity parameter HRO
and the nearest neighbor distribution function G.
The parameter region homogeneity HRO, as proposed by Rossi et al. [23] serves as a
general evaluation of the distribution of particles lying within a studied area divided in an
arbitrary number of regions, by quantifying the similarity of the different regions in terms
of number of objects and amount of phase. This method is a practical and straightforward
way of assessing the homogeneity distribution, when studying well-dispersed particle
composites. Nevertheless, it does not take into account the separation or the interaction of
the agglomerates (it is not sensitive to the clustering behavior of particles within the

12
analyzed regions). Furthermore, the analysis is limited to samples (micrographs) of the
same dimensions, since this method is area size sensitive.
On the other hand, when studying non-deformed MMC samples, lower
magnifications can be used in order to display a higher number of particles without
neglecting any significant information since the initial agglomerates are much larger
(DCNT > 2m) than in the case of highly deformed samples (DCNT ~100 nm, Fig. 3).
Furthermore, it is possible to keep the size of the analyzed area constant and HRO can be
used to compare the homogeneity of different kind of MMC samples. Nevertheless, the
inability of using lower magnifications and of keeping the size of the micrographs constant
without losing significant information restricts the usefulness of HRO in highly deformed
samples.
Fig. 4d displays the evolution of HRO for the samples with 1 wt. % CNT processed
at RT. Even though HRO does not significantly improve during HPT up to 30 T, in most
cases it is true that HRO increases with increasing strain except after only 1 T. Also, the
diameter of the agglomerates and the inter-particle distance decrease significantly
compared to the HUP samples (Fig. 3), and this is also an indicative of the improvement of
the agglomerate distribution. Fig. 4a to 4c correspond to the G-function of samples with
1 wt. % CNT processed 10 T, which displayed the higher improvement in HRO (Fig. 4d). In
all the cases a clustered behavior is present, as the empiric distributions are above the
envelope for 100 simulations of the theoretical CSR expectation. In the case of samples
with 1 wt. % CNT processed 30 T, HRO increases slightly with increasing strain above
HRO = 60 % (Fig. 4d). Fig. 4e to 4h show the G-function for the latter case. It can be seen

13
from Fig. 4e that even for zero equivalent strain the empiric cumulative distribution of
NND is closer to the CSR envelope. Nevertheless, for distances > 50 nm, a slight clustering
behavior is observable. It can be inferred that for eq. strains 84 < < 100 (Fig. 4c and 4f)
the agglomerate NND cumulative distribution starts to behave homogeneously (Fig. 4f to
4h Gobs stays within the envelope for completely random Poisson distributions).

14
Figure 4 (a-c) G(r) at different equivalent strains for 1wt.% CNT deformed at 10 T.
(d) HRO for the selected set of samples. (e-f) G(r) at different equivalent strains for
1wt.%CNT deformed at 30 T. Where ĜObs (r) is the observed value of G(r); Gtheo (r) is
the theoretical value of G(r) for complete spatial randomness; Glo (r) and Ghi (r)
represent the lower and upper bounds of G(r) from simulations. The deformation was
performed at room temperature.

15
A similar behavior can be seen in Fig. 5 for the samples with 1 wt. % CNT
processed 30 T at 200ºC. In this case is also true that when = 0, G(r) is closer to the
theoretical expectation CRS and for higher , G(r) is within the CRS envelopes, and for
distances < 100 nm the agglomerates are more separated than the CRS case.
Figure 5 G(r) for a 1wt.%CNT sample processed with 30 T at 200ºC, as a function of
the equivalent strain. The measured HRO is also displayed.
Sabirov [10] proposed the extended Tan and Zhang model (originally conceived for
cold rolled MMCs) as an assessment of the equivalent strain values required in HPT to
achieve a homogeneous particle distribution in ceramic particle reinforced MMC subjected
to extrusion according to 𝑑𝑝 ≥ 𝑑𝑚[( π6f)1
3]√R γ where dp is the particle size, dm is the matrix
powder size required to attain a homogeneous particle distribution; f the particle volume

16
fraction; R is the extrusion ratio; is the shear strain with γ = √3𝜀𝑒𝑞. This is based on the
assumption that the particles are spherical. They found that SiC and Al2O3 particles behave
differently during HPT and that the homogenization occurs according to Tan and Zhang
model [35]. Nevertheless, the experimental data did not adjust well to their proposed
model, which was attributed to the fact that the ceramic particles are de-clustered through a
debonding mechanism without deformation of the particle clusters.
Although, in the samples studied here, the agglomerates cannot be considered
spherical throughout the entire process because during the first stages of deformation
elongated CNT agglomerates in the shear direction are observed (Fig. 2, = 0).
Nevertheless, at higher applied strains, they start to debond forming more spherical
agglomerates (Fig. 2, eq. = 84). Contrary to ceramic particles, which are hard and brittle,
CNT are elastic and CNT agglomerates are bonded by Van der Waals forces that can be
overcome during deformation. According to this, CNT agglomerates debond by relative
sliding between CNT. Furthermore, sliding between CNT walls may also occur [36].
In the literature, a unique value of inter-particle distance, which only deals with the
case of equidistant particles, has been considered for the assessment of a uniform
distribution of particles during plastic deformation [10,35]. Nevertheless, as already
discussed, the particles can be homogeneously distributed according to different
configurations describing a Poisson distribution. Therefore, a model is proposed, starting
from the nearest neighbor distribution function in 3D, and its correlation with the CNT
agglomerates' spatial behavior. In this case, HPT is considered and the agglomerates are
assumed to be spherical.

17
The nearest neighbor distance NND distribution function in 3D for completely
random Poisson distribution is described by equation 1 [37]:
𝐷(𝑟) = 1 − exp (−𝑁𝑉 4𝜋3 𝑟3) ; 𝑟 ≥ 0 (1)
where NV is the mean number of objects per unit volume. NV for isolated spherical
objects of random diameter D is [37] (pg. 78):
𝑁𝑉 = 6𝑉𝑉𝜋𝐷3 (2)
Replacing 2 in equation 1 yields:
𝐷(𝑟) = 1 − exp (− 8𝑉𝑉𝐷3 𝑟3) (3)
For point fields it is true that the volume fraction equals the spherical contact
distribution VV=Hs(r) and from the completely random property of the Poisson field it
follows that the NND distribution D(r) and the spherical contact distribution function Hs(r)
are identical [37] (pg. 315) Hs(r) D(r), thus D(r) = VV. According to this and solving r in
equation 2:
𝑟 = 𝐷2 [− ln (1−𝑉𝑉)𝑉𝑉 ]1/3 (4)
Also, for uniform distribution of CNT, which are expected to be at the grain
boundaries due to the nature of the processing route (powder metallurgy), r should be equal
or greater than the grain size of the matrix after HPT GSfHPT:
𝑟 ≥ 𝐺𝑆𝑓𝐻𝑃𝑇 (5)

18
Furthermore, for simple shear a volume element, which may be a grain or a second
phase in a composite, will be deformed in an ellipsoid with apex ratio 𝑟′ . The reduction
ratio of an ellipsoid is given by √r' . For large shear strains ( > 2), r '= γ2, with γ = √3εeq
[28]. In the case of the studied CNT reinforced MMC, it is assumed that the agglomerates
are deformed in the same way as the matrix. Accordingly, after HPT the reduction ratio is
given by:
𝐺𝑆𝑖𝐻𝑃𝑇𝐺𝑆𝑓𝐻𝑃𝑇 = √3𝜀𝑒𝑞 (6)
GSiHPT corresponds to the grain size of the matrix before HPT, i.e. the grain size of the
composite after the sintering process by HUP GSiHPT = GSfHUP. Thus, replacing in equation
6 and solving GSfHUP:
𝐺𝑆𝑓𝐻𝑃𝑇 = 𝐺𝑆𝑓𝐻𝑈𝑃√3𝜀𝑒𝑞 (7)
and equation 5 can be expressed as:
𝐷2 [− ln (1−𝑉𝑉)𝑉𝑉 ]1/3 ≥ 𝐺𝑆𝑓𝐻𝑈𝑃√3𝜀𝑒𝑞 (8)
Previously, it was shown for consolidated CNT reinforced Nickel matrix composites
that, in the presence of CNT a grain growth stagnation takes place during sintering and
eventual annealing and the final grain size is related to the CNT volume fraction VV
according to the Zener based relationship GSfHUP= 0.99±0.07VV
0.4 [38].

19
Fig. 6 shows the experimental data of the mean grain size measured by EBSD of the
studied composites before HPT with the corresponding Zener based model.
Figure 6 Mean grain size of studied composites after HUP as a function of the
reinforcement volume fraction (VCNT). Dashed curves represent the empirical Zener
pinning model with respective upper and lower bounds (grey envelope).
Accordingly, and rearranging equation 8:
𝜀𝑒𝑞 ≥ 1.143𝑉𝑉(− 115) 𝐷 [− 1𝑙𝑛(1−𝑉𝑉)](13) (9)
According to equation 9, there is a minimum strain 𝜀ℎ𝑜𝑚 that should be applied in
order to obtain a homogenous distribution of CNT. It can be thus inferred that for
increasing CNT volume fraction VCNT a lower strain should be applied in order to obtain a
homogeneous distribution of CNT after HPT. This corresponds well with the literature,
20
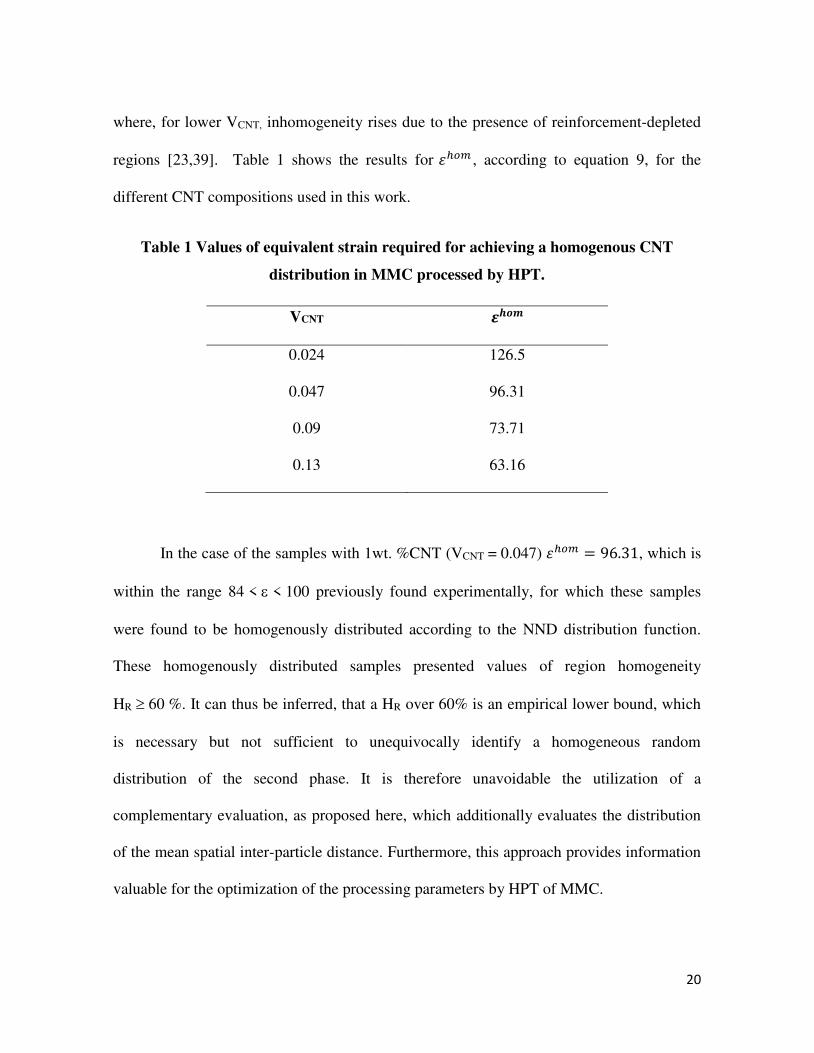
where, for lower VCNT, inhomogeneity rises due to the presence of reinforcement-depleted
regions [23,39]. Table 1 shows the results for 𝜀ℎ𝑜𝑚 , according to equation 9, for the
different CNT compositions used in this work.
Table 1 Values of equivalent strain required for achieving a homogenous CNT
distribution in MMC processed by HPT.
VCNT 𝜺𝒉𝒐𝒎
0.024 126.5
0.047 96.31
0.09 73.71
0.13 63.16
In the case of the samples with 1wt. %CNT (VCNT = 0.047) 𝜀ℎ𝑜𝑚 = 96.31, which is
within the range 84 < < 100 previously found experimentally, for which these samples
were found to be homogenously distributed according to the NND distribution function.
These homogenously distributed samples presented values of region homogeneity
HR 60 %. It can thus be inferred, that a HR over 60% is an empirical lower bound, which
is necessary but not sufficient to unequivocally identify a homogeneous random
distribution of the second phase. It is therefore unavoidable the utilization of a
complementary evaluation, as proposed here, which additionally evaluates the distribution
of the mean spatial inter-particle distance. Furthermore, this approach provides information
valuable for the optimization of the processing parameters by HPT of MMC.

21
Conclusions
The distribution homogeneity of CNT agglomerates in MMC processed by high-
pressure torsion is evaluated by the combination of the region homogeneity parameter HRO
and the nearest neighbor distribution function G(r). This methodology can be used as a
thorough evaluation of the distribution homogeneity of second phases in MMC.
Furthermore, CNT agglomerates debond by relative sliding between CNT during HPT,
which differs significantly to the debonding-mechanism in ceramic particles. Finally, a
model that predicts the minimum equivalent strain required for a homogenous second phase
distribution during HPT is developed, which correlates well with the experimental data and
provides a basis for the optimization of the processing parameters of MMC by severe
plastic deformation.
Acknowledgements
K. Aristizabal wishes to thank the German Academic Exchange Service (DAAD)
for their financial support. S. Suarez and K. Aristizabal gratefully acknowledge the
financial support from DFG (Grant: SU911/1-1). A. Katzensteiner and A. Bachmaier
gratefully acknowledge the financial support by the Austrian Science Fund (FWF): I2294-
N36.
References
[1] R. Haggenmueller, H.H. Gommans, A.G. Rinzler, J.E. Fischer, K.I. Winey, Aligned
single-wall carbon nanotubes in composites by melt processing methods, Chem.
Phys. Lett. 330 (2000) 219–225. doi:10.1016/S0009-2614(00)01013-7.

22
[2] C. Bower, R. Rosen, L. Jin, Deformation of carbon nanotubes in nanotube – polymer
composites, 74 (1999) 3317–3319.
[3] A. Peigney, C. Laurent, E. Flahaut, A. Rousset, Carbon nanotubes in novel ceramic
matrix nanocomposites, 26 (2000) 677–683.
[4] A. Peigney, E. Flahaut, C. Laurent, F. Chastel, A. Rousset, Aligned carbon
nanotubes in ceramic-matrix nanocomposites prepared by high-temperature
extrusion, Chem. Phys. Lett. 352 (2002) 20–25. doi:10.1016/S0009-2614(01)01441-
5.
[5] S. Suarez, F. Lasserre, F. Mücklich, Mechanical properties of MWNT / Ni bulk
composites : Influence of the microstructural refinement on the hardness, Mater. Sci.
Eng. A. 587 (2013) 381–386. doi:10.1016/j.msea.2013.08.058.
[6] S.R. Bakshi, D. Lahiri, A. Agarwal, Carbon nanotube reinforced metal matrix
composites - a review, Int. Mater. Rev. (2010).
doi:10.1179/095066009X12572530170543.
[7] T. Kuzumaki, K. Miyazawa, H. Ichinose, K. Ito, Processing of carbon nanotube
reinforced aluminum composite, J. Mater. Res. 13 (1998) 2445–2449.
doi:10.1557/JMR.1998.0340.
[8] H.J. Choi, G.B. Kwon, G.Y. Lee, D.H. Bae, Reinforcement with carbon nanotubes in
aluminum matrix composites, Scr. Mater. 59 (2008) 360–363.
doi:10.1016/j.scriptamat.2008.04.006.
[9] S.R. Bakshi, V. Singh, K. Balani, D.G. McCartney, S. Seal, A. Agarwal, Carbon
nanotube reinforced aluminum composite coating via cold spraying, Surf. Coatings
Technol. 202 (2008) 5162–5169. doi:10.1016/j.surfcoat.2008.05.042.

23
[10] I. Sabirov, O. Kolednik, R. Pippan, Homogenization of metal matrix composites by
high-pressure torsion, Met. Mater. Trans. A. 36 (2005) 2861–2870.
[11] R. Pippan, S. Scheriau, A. Taylor, M. Hafok, A. Hohenwarter, A. Bachmaier,
Saturation of Fragmentation During Severe Plastic Deformation, Annu. Rev. Mater.
Res. 40 (2010) 319–343. doi:10.1146/annurev-matsci-070909-104445.
[12] S. Suarez, F. Lasserre, F. Soldera, R. Pippan, F. Mücklich, Microstructural thermal
stability of CNT-reinforced composites processed by severe plastic deformation,
Mater. Sci. Eng. A. 626 (2015) 122–127. doi:10.1016/j.msea.2014.12.065.
[13] P. Jenei, J. Gubicza, E.Y. Yoon, H.S. Kim, J.L. Lábár, High temperature thermal
stability of pure copper and copper-carbon nanotube composites consolidated by
High Pressure Torsion, Compos. Part A Appl. Sci. Manuf. 51 (2013) 71–79.
doi:10.1016/j.compositesa.2013.04.007.
[14] A. Bachmaier, R. Pippan, Generation of metallic nanocomposites by severe plastic
deformation, Int. Mater. Rev. 58 (2013) 41–62.
doi:10.1179/1743280412Y.0000000003.
[15] K. Aristizabal, S. Suárez, A. Katzensteiner, A. Bachmaier, F. Mücklich, Evolution of
the microstructure in carbon nanotube reinforced Nickel matrix composites
processed by high-pressure torsion, IOP Conf. Ser. Mater. Sci. Eng. 258 (2017)
12008. doi:10.1088/1757-899X/258/1/012008.
[16] I.H. Sul, J.R. Youn, Y.S. Song, Quantitative dispersion evaluation of carbon
nanotubes using a new analysis protocol, Carbon N. Y. 49 (2011) 1473–1478.
doi:10.1016/j.carbon.2010.12.017.
[17] B.M. Tyson, R.K. Abu Al-Rub, A. Yazdanbakhsh, Z. Grasley, A quantitative

24
method for analyzing the dispersion and agglomeration of nano-particles in
composite materials, Compos. Part B Eng. 42 (2011) 1395–1403.
doi:10.1016/j.compositesb.2011.05.020.
[18] A. Yazdanbakhsh, Z. Grasley, B. Tyson, R.K. Abu Al-Rub, Dispersion
quantification of inclusions in composites, Compos. Part A Appl. Sci. Manuf. 42
(2011) 75–83. doi:10.1016/j.compositesa.2010.10.005.
[19] S.R. Bakshi, R.G. Batista, A. Agarwal, Quantification of carbon nanotube
distribution and property correlation in nanocomposites, Compos. Part A Appl. Sci.
Manuf. 40 (2009) 1311–1318. doi:10.1016/j.compositesa.2009.06.004.
[20] N. Saheb, N.U. Qadir, M.U. Siddiqui, A.F.M. Arif, S.S. Akhtar, N. Al-Aqeeli,
Characterization of nanoreinforcement dispersion in inorganic nanocomposites: A
review, Materials (Basel). 7 (2014) 4148–4181. doi:10.3390/ma7064148.
[21] R. Pyrz, Quantitative description of the microstructure of composites. Part I:
Morphology of unidirectional composite systems, Compos. Sci. Technol. 50 (1994)
197–208. doi:10.1016/0266-3538(94)90141-4.
[22] P. Rossi, M. Engstler, F. Mücklich, Quantitative Classification and Assessment of Sr
Modification in Hypoeutectic Al-Si and Al-Si-Mg Alloys, Pract. Metallogr. 52
(2015) 571–589. doi:10.3139/147.110361.
[23] P. Rossi, S. Suarez, F. Soldera, F. Mücklich, Quantitative Assessment of the
Reinforcement Distribution Homogeneity in CNT/Metal Composites, Adv. Eng.
Mater. 1 (2014) 1–5. doi:10.1002/adem.201400352.
[24] J. Schindelin, I. Arganda-Carreras, E. Frise, V. Kaynig, M. Longair, T. Pietzsch, S.
Preibisch, C. Rueden, S. Saalfeld, B. Schmid, J.-Y. Tinevez, D.J. White, V.

25
Hartenstein, K. Eliceiri, P. Tomancak, A. Cardona, Fiji: an open-source platform for
biological-image analysis, Nat Meth. 9 (2012) 676–682.
http://dx.doi.org/10.1038/nmeth.2019.
[25] RStudio Team, RStudio: Integrated Development for R. RStudio, Inc., Boston, MA,
(2016). http://www.rstudio.com/.
[26] L. Reinert, M. Zeiger, S. Suárez, V. Presser, F. Mücklich, Dispersion analysis of
carbon nanotubes, carbon onions, and nanodiamonds for their application as
reinforcement phase in nickel metal matrix composites, RSC Adv. 5 (2015) 95149–
95159. doi:10.1039/C5RA14310A.
[27] A. Hohenwarter, A. Bachmaier, B. Gludovatz, S. Scheriau, R. Pippan, Technical
parameters affecting grain refinement by high pressure torsion, Int. J. Mater. Res.
100 (2009) 1653–1661. doi:10.3139/146.110224.
[28] H.P. Stüwe, Equivalent strains in severe plastic deformation, Adv. Eng. Mater. 5
(2003) 291–295. doi:10.1002/adem.200310085.
[29] A. Baddeley, R. Turner, Journal of Statistical Software, J. Stat. Softw. 12 (2005).
doi:10.18637/jss.v069.i12.
[30] B.D. Ripley, Statistical Inference for Spatial Processes, Cambridge University Press,
New York, USA, 1988.
[31] N. Cressie, Statistics for Spatial Data, John Wiley & Sons, New York, USA, 1991.
doi:10.1111/j.1365-3121.1992.tb00605.x.
[32] Peter J. Diggle, Statistical Analysis fo Spatial Point Processes, Academic Press,
London, 1983.
[33] A. Baddeley, R.D. Gill, Kaplan-Meier estimators of distance distributions for spatial

26
point processes, Ann. Stat. 25 (1997) 263–292. doi:10.1214/aos/1034276629.
[34] A. Katzensteiner, K. Aristizabal, S. Suarez, R. Pippan, A. Bachmaier, Temperature
dependent structural evolution in nickel/carbon nanotube composites processed by
high-pressure torsion, IOP Conf. Ser. Mater. Sci. Eng. 194 (2017) 12019.
doi:10.1088/1757-899X/194/1/012019.
[35] M.J. Tan, X. Zhang, Powder metal matrix composites: Selection and processing,
Mater. Sci. Eng. A. 244 (1998) 80–85. doi:10.1016/S0921-5093(97)00829-0.
[36] A. Pantano, D.M. Parks, M.C. Boyce, Mechanics of deformation of single- and
multi-wall carbon nanotubes, J. Mech. Phys. Solids. 52 (2004) 789–821.
doi:10.1016/j.jmps.2003.08.004.
[37] J. Ohser, F. Mücklich, Statistical Analysis of microstructures in material sciences,
John Wiley & Sons, Chichester, UK, 2000.
[38] L. Reinert, S. Suarez, T. Müller, F. Mücklich, Carbon Nanoparticle-Reinforced
Metal Matrix Composites: Microstructural Tailoring and Predictive Modeling, Adv.
Eng. Mater. (2017) 1–6. doi:10.1002/adem.201600750.
[39] S. Yamanaka, R. Gonda, A. Kawasaki, H. Sakamoto, Y. Mekuchi, M. Kun, T.
Tsukada, Fabrication and thermal properties of carbon nanotube/nickel composite by
spark plasma sintering method, Mater. Trans. 48 (2007) 2506–2512.
doi:10.2320/matertrans.MRA2007084.