on the fire dynamics of vehicles and electrical … publications 521 on the fire dynamics of...
TRANSCRIPT

VTT PU
BLICATIO
NS 521
On the fire dynam
ics of vehicles and electrical equipment
Johan Mangs
Tätä julkaisua myy Denna publikation säljs av This publication is available from
VTT TIETOPALVELU VTT INFORMATIONSTJÄNST VTT INFORMATION SERVICEPL 2000 PB 2000 P.O.Box 2000
02044 VTT 02044 VTT FIN–02044 VTT, FinlandPuh. (09) 456 4404 Tel. (09) 456 4404 Phone internat. +358 9 456 4404Faksi (09) 456 4374 Fax (09) 456 4374 Fax +358 9 456 4374
ISBN 951–38–6273–9 (soft back ed.) ISBN 951–38–6274–7 (URL: http://www.vtt.fi/inf/pdf/)ISSN 1235–0621 (soft back ed.) ISSN 1455–0849 (URL: http://www.vtt.fi/inf/pdf/)
ESPOO 2004ESPOO 2004ESPOO 2004ESPOO 2004ESPOO 2004 VTT PUBLICATIONS 521
Johan Mangs
On the fire dynamics of vehiclesand electrical equipment
The fire behaviour of passenger cars, electronic cabinets, and electricalignition sources has been studied by experimental, modelling and statisticalmethods. Full-scale fire experiments on ordinary medium-size passengercars, and full and reduced scale experiments on electronic cabinets arepresented. Rate of heat release, mass loss and rate of mass loss, heat flux,carbon monoxide, carbon dioxide and smoke production rates, gas andsurface temperatures were determined as a function of time. The experimen-tal rate of heat release curves from the cars were parametrised, and the carfire was modelled by two fire plumes. Ignition power and energy sufficientfor sustained burning, and fire growth rate after ignition in an electroniccabinet were determined. The effect of the cabinet fire on an adjacent cabinetand a cabinet 1 m apart was studied, and times to ignition of cables in theadjacent cabinet were estimated. The potential rate of heat release bound incarbon (smoke) and carbon monoxide production due to incompletecombustion was determined. A model for estimating the maximum rate ofheat release in an electronic cabinet is proposed. An analytic formula issuggested to estimate the minimum rate of heat release needed for flashoverin an electronic cabinet. Electrical ignitions of fires were studied byanalysing statistical information from incident reports, by modelling themost frequent physical ignition mechanisms, and by experiments on somescenarios. The research presented gives new quantitative information onvariables essential for estimating fire safety of these subjects and structuresrelating to them.

VTT PUBLICATIONS 521
On the fire dynamics of vehicles and electrical equipment
Johan Mangs VTT Building and Transport
Department of Physical Sciences
Faculty of Science University of Helsinki
Helsinki, Finland
Academic dissertation
To be presented, with the permission of the Faculty of Science of the University of Helsinki, for public criticism in Auditorium E204 of the Department of Physical
Sciences, on April 28th, 2004, at 12 o'clock noon.

ISBN 951386273-9 (soft back ed.) ISSN 12350621 (soft back ed.)
ISBN 951386274-7 (URL: http://www.vtt.fi/inf/pdf/) ISSN 14550849 (URL: http://www.vtt.fi/inf/pdf/)
Copyright © VTT Technical Research Centre of Finland 2004
JULKAISIJA UTGIVARE PUBLISHER
VTT, Vuorimiehentie 5, PL 2000, 02044 VTT puh. vaihde (09) 4561, faksi (09) 456 4374
VTT, Bergsmansvägen 5, PB 2000, 02044 VTT tel. växel (09) 4561, fax (09) 456 4374
VTT Technical Research Centre of Finland, Vuorimiehentie 5, P.O.Box 2000, FIN02044 VTT, Finland phone internat. + 358 9 4561, fax + 358 9 456 4374
VTT Rakennus- ja yhdyskuntatekniikka, Materiaalit ja tuotteet, Kivimiehentie 4, PL 1803, 02044 VTT puh. vaihde (09) 4561, faksi (09) 456 4815
VTT Bygg och transport, Material och producter, Stenkarlsvägen 4, PB 1803, 02044 VTT tel. växel (09) 4561, fax (09) 456 4815
VTT Building and Transport, Building Materials and Products, Kivimiehentie 4, P.O.Box 1803, FIN02044 VTT, Finland phone internat. + 358 9 4561, fax + 358 9 456 4815
Technical editing Leena Ukskoski Otamedia Oy, Espoo 2004

3
Mangs, Johan. On the fire dynamics of vehicles and electrical equipment. Espoo 2004. VTT Publications 521. 62 p. + app. 101 p.
Keywords fire safety, fire experiments, fire development, ignition, fire growth, car fires,electronic cabinets, electric devices, cables, energy release, fire effluents,incomplete combustion
Abstract The fire behaviour of passenger cars, electronic cabinets, and electrical ignition sources has been studied by experimental, modelling and statistical methods. The research presented in this thesis gives new quantitative information on variables essential for estimating fire safety of these subjects and structures relating to them.
Full-scale fire experiments on ordinary medium-size passenger cars, equipped as in practise with oil, four tyres, spare tyre and 30 litres of petrol in the fuel tank are presented. Rate of heat release by means of oxygen consumption calorimetry, mass loss and rate of mass loss, heat flux, carbon monoxide and carbon dioxide production rate, smoke production rate, gas temperatures above the car and temperatures inside the car were determined as a function of time. The experimental rate of heat release curves are parametrised by superposition of one Boltzmann curve and three symmetrical Gaussian curves. The car fire is modelled by two fire plumes, one emerging from the centre of the windscreen of the car, the other from the centre of the rear window. Gas temperatures are calculated using rate of heat release for the model plumes and Alpert's equations for maximum ceiling jet temperature, and compared to experimental temperatures from the car fire experiments. The calculated and measured temperatures were found to be in good accordance. The results can be used in design calculations for car park buildings and other structures related to passenger cars.
Electrical ignitions of fires in nuclear power plants are studied by analysing statistical information from incident reports, by modelling the most frequent physical ignition mechanisms, and by experiments on some scenarios. Statistical data indicated cables have a significant role in electrical ignitions. Modelling
4
some relevant cable fire scenarios give quantitative information on the conditions and physical processes of possible cable fire situations.
Full and reduced scale experiments have been carried out on electronic cabinets with differing ventilation conditions, contents and structure, igniting the cabinet with a small propane burner beneath a cable or wiring bundle. Measurements on rate of heat release, mass loss, carbon monoxide, carbon dioxide and smoke (carbon) production rate, gas and surface temperatures were performed. The potential rate of heat release bound in carbon (smoke) and carbon monoxide production due to incomplete combustion was determined from measured production rates and reaction equations, and found to be considerable. Ignition power and energy sufficient for sustained burning leading to flashover in the cabinet were determined. The fire growth rate after ignition was concluded to be slow. The effect of the cabinet fire on an adjacent cabinet and a cabinet 1 m apart was studied, and times to ignition of cables in the adjacent cabinet were estimated.
A model for estimating the maximum rate of heat release in an electronic cabinet is proposed, and checked against experimental data. It is found to describe the main features of a burning cabinet after flashover when the fire becomes ventilation-controlled. The model seems to be quite insensitive to parameters of the burning cabinet and a formula is proposed which depends on cabinet dimensions only. Furthermore, an analytic formula is suggested to estimate the minimum rate of heat release needed for flashover in an electronic cabinet. The formula is consistent with available experimental data, although the amount of data is still small.
The results of the cabinet study can be used in safety assessment studies of fires originating in an electronic cabinet, e.g. estimating fire size, or as energy release input data in fire development calculations on control rooms in process plants and other sites containing electronic cabinets.
5
Preface This thesis is based on results of research commissions carried out at VTT Technical Research Centre of Finland. Although the primary purpose of the research has been to solve specific practical problems of interest for the customers, it has been possible to refine the results to scientific publications with kind permission of the customers. This writing of publications and completion of this thesis has been enhanced by the support of VTT Technical Research Centre of Finland, for which I express my gratitude.
I am indebted to my supervisor and co-author, Dr Olavi Keski-Rahkonen, for advice, encouragement and fruitful co-operation during the preparation of this study. I am also grateful to Dr. Esko Mikkola, manager of the Fire Research group, for his kind support during the accomplishment of this thesis.
I am thankful to Prof. Juhani Keinonen, Head of the Department of Physical Sciences, University of Helsinki, for his favourable attitude during my work on this thesis.
Carrying out full-scale fire experiments is teamwork. I express my warm thanks for skilful assistance to all my co-workers in the Fire Research and Fire Testing groups at VTT Technical Research Centre of Finland.
March 2004
Johan Mangs
6
Contents
Abstract ................................................................................................................. 3
Preface .................................................................................................................. 5
List of publications and author's contribution....................................................... 7
List of symbols and abbreviations ........................................................................ 9
1. Introduction .................................................................................................. 11
2. Experimental methods .................................................................................. 17 2.1 Rate of heat release.............................................................................. 17 2.2 Additional measurements .................................................................... 21
3. Fire development .......................................................................................... 25
4. Results and discussion .................................................................................. 29 4.1 Fire behaviour of passenger cars ......................................................... 29 4.2 Electrical ignition sources ................................................................... 35 4.3 Fire behaviour of electronic cabinets................................................... 40
4.3.1 Experiments and results .......................................................... 40 4.3.2 Cabinet fire modelling............................................................. 48
5. Conclusions................................................................................................... 53
References........................................................................................................... 56
Appendices Papers IV
Appendices of this publication are not included in the PDF version. Please order the printed version to get the complete publication (http://www.vtt.fi/inf/pdf/)

7
List of publications and author's contribution
This thesis is based on the following papers, which are referred to in the text by their Roman numerals IV.
I Mangs, J. & Keski-Rahkonen, O. 1994. Characterization of the fire behaviour of a burning passenger car, Part I: Car fire experiments. Fire Safety Journal, Vol. 23, No. 1, pp. 1735.
II Mangs, J. & Keski-Rahkonen, O. 1994. Characterization of the fire behaviour of a burning passenger car, Part II: Parametrization of measured rate of heat release curves. Fire Safety Journal, Vol. 23, No. 1, pp. 3749.
III Keski-Rahkonen, O. & Mangs, J. 2002. Electrical ignition sources in nuclear power plants: statistical, modelling and experimental studies. Nuclear Engineering and Design, Vol. 213, No. 23, pp. 209221.
IV Mangs J., Paananen J. & Keski-Rahkonen O. 2003. Calorimetric fire experiments on electronic cabinets. Fire Safety Journal, Vol. 38, No. 2, pp. 165186.
V Keski-Rahkonen O. & Mangs, J. 2003. Quantitative determination of source terms from fires in electronic cabinets: Maximum rate of heat release, minimum rate of heat release needed for flashover, and effluent yields from incomplete combustion. Submitted to Fire Safety Journal.
The papers relate mainly to problems presented by customers of VTT Technical Research Centre of Finland, for which Keski-Rahkonen and the author proposed the concepts of experiments. After approval, the author planned the experiments in detail and carried them out assisted by a team of technicians. Results for

8
immediate use were presented in technical reports, where data reduction and report writing was carried out by the author whereas Keski-Rahkonen did most of the analytical modelling.
In detail, the author was responsible for performance and analysis of results of the car fire experiments presented in Paper I, carried out the analysis presented in Paper II and wrote Papers I and II.
The author performed the statistical study of Paper III, carried out the experiments, assisted by some other researchers and technicians, and wrote the corresponding parts of Paper III.
Paper IV presents fire experiments on real and mock-up electronic cabinets. The author was responsible for performance of the real cabinet experiments together with some other researchers, and for analysis of the results. The author participated in the performance of the mock-up cabinet experiments, especially with data acquisition, and wrote Paper IV. The author carried out the analysis on the maximum rate of heat release from an electronic cabinet presented in Paper V particularising earlier attempts, carried out the analysis on potential rate of heat release bound in carbon and carbon monoxide production, and wrote the corresponding parts of Paper V.

9
List of symbols and abbreviations A area
cm mass concentration of smoke particles
C discharge coefficient
g acceleration of gravity
hk effective heat transfer coefficient
H height
H∆ enthalpy change
cH∆ heat of combustion
I intensity of light
k light extinction coefficient
χ combustion efficiency
L length
m& rate of mass loss, mass production rate
p pressure
Q& rate of heat release
r radial distance
R, R' rate of smoke production
RHR rate of heat release
ρ density
σ specific extinction coefficient per unit mass of smoke
t time
τ time constant, dimensionless temperature
T temperature
&V rate of volume flow

10
x volume fraction
Y yield
Subscripts
0 initial
∞ ambient
c cabinet
d decay
eff effective
e exit
g growth
i ignition, entrance
max maximum
min minimum
w wall
11
1. Introduction
Fire, if not deliberately arranged to provide useful effects, is defined in ISO 13943 (2000) as self-supporting combustion, which spreads uncontrolled in time and space. Unwanted fires cause great human suffering and property loss, and improving fire safety is a challenge from year to year. An essential approach is the use of scientific methods to increase the understanding of fire as a phenomenon obeying the laws of nature. The field of fire safety science is multi-disciplinary, incorporating many branches of physics, chemistry and engineering, applying experimental, theoretical as well as computational methods (diNenno et al. 1995).
In order to understand fire behaviour, a thorough knowledge of fire dynamics is of concern. Although fire is defined in terms of combustion, i.e. an exothermic reaction of a substance with an oxidiser (ISO 13943 2000), the development of the fire may be determined not only by the chemical reactions but in even higher degree by the physical state and distribution of the fuel, and also its environment (Drysdale 1999). The term "fire dynamics" describes thus fire behaviour not only in terms of chemistry but also using heat and mass transfer, and fluid dynamics.
Combustion (fire) is initiated by ignition after which the fire growths to a maximum, and finally decays. During this course heat, smoke and various, mostly toxic and corrosive compounds are released, all contributing to the fire hazard (Tewarson 1995). To be able to assess fire hazard, the rate of heat release and generation rates of fire products must be quantified.
The purpose of this thesis is to quantify fire behaviour of passenger cars, electronic cabinets, and electrical ignition sources. This includes studies of ignition, rate of heat release, smoke and carbon monoxide production and incomplete combustion, relying mainly on experimental methods. Simple models are proposed for rate of heat release from the studied objects. The main use of the results is in fire risk assessment of buildings containing these objects. The subjects relate to practical needs of customers, which utilised the results almost immediately. Since the results are fairly general, it is motivated to present them in a scientific way for wider use outside the original scope.

12
Car fires
The fire behaviour of passenger cars is treated in Papers I and II. The aim of the research was to determine a realistic scenario of a car fire in an open car park. An open car park is defined in terms of openings in external walls, distance between facades etc, with definitions differing somewhat from one country to another. In Finland, a car park building is considered open, if at each storey at least 30% of the wall area consists of openings, which are simultaneously at least 10% of the floor area. The openings shall be located in such a way that air is exchanged in the whole car park, the wall openings will thus be sufficient also for smoke venting (National building code of Finland E4 1997). A fire in an open car park occurs thus under well-ventilated circumstances and fire development will differ from an ordinary room fire. A local fire is hence likely to be a realistic basis for the design of fire resistance properties of open car parks. Quantitative knowledge about the fire behaviour of a burning passenger car, including the rate of heat release as the most important parameter, is thus needed.
Prior to the experiments reported in Paper I, some experiments on car fires in open car park buildings had been carried out (Butcher et al. 1968, Gewain 1973, Bennetts et al. 1985). The measurements in these experiments were restricted to gas and structure surface temperatures in the vicinity of the burning car. No calorimetric measurements on burning rate, or rate of heat release had been reported in open literature.
Paper I presents the first published calorimetric fire experiments on burning passenger cars. Three full-scale experiments were carried out on cars equipped as in practise with oil, petrol and ordinary passenger cabin materials. Besides measurements of rate of heat release, mass loss and rate of mass loss, heat flux, carbon monoxide, carbon dioxide and smoke production rate, and gas temperatures above the car, and temperatures inside the car were determined as a function of time.
For practical design work, a parametrised model for the fire behaviour of a burning passenger car was needed. This model should be simple enough, but still describe the essential features of the fire problem. Paper II presents a model to describe the fire behaviour of a burning passenger car. The model is checked by

13
calculating gas temperatures using Alpert´s equations (Alpert 1972) for maximum ceiling jet temperatures and comparing to gas temperatures measured in the experiments.
The model presented in Paper II has been used by the working group TWG 3.3 of ECCS (European Convention for Constructional Steelwork) committee T3 (1993) in its work on the fire safety requirements for open car parks.
After the car fire experiments of Paper I, some similar studies on car fires have been reported in open literature. Two full-scale calorimetric fire experiments on passenger cars have been carried out to obtain information on the consequences of a car fire in a shuttle train in the Channel Tunnel between England and France (Shipp and Spearpoint 1995). The experimental set-up differed from the experiments in Paper I as it simulated the geometry and physical properties of a tunnel shuttle wagon. The car was located inside a canopy connected to two calorimeter hoods. Steel sheet cladding, insulated on the outside, enclosed the canopy. The vehicles were middle-range cars, model 1982 and 1986, typical in design and materials usage.
Car fire experiments have been carried out to measure rate of heat release, taking into account the effect of new materials in cars of newer model, configuration with a ceiling above the car, and the car close to a wall or in a corner, and spread of fire from one car to another (Kruppa et al. 1998). This series contained 10 experiments, 5 with one car and 5 with two cars. The cars were either of old, 1970/1980, model or new, 1990 model. The experiments were carried out under a ceiling inside a hood collecting the combustion products, and rate of heat release was determined using oxygen consumption calorimetry.
Steinert (1999, 2000a, 2000b) has reported a series of 10 experiments to study the burning of and fire spread between cars parked next to each other, including 3 experiments with a single car, 6 with two cars and 1 with three cars next to each other. Distances between adjacent cars were 0.4 m or 0.8 m. The cars were small and middle-range, representing three types of car body materials, steel car body, car body containing plastics, and as a special case the plastic car body of Trabant. Reported years of manufacturing were in the range 1982 to 1987. The experiments were performed in a 4.5 m high room with floor area 5.4 m x 7.6 m and air intake from 4 openings 1.0 m x 0.5 m in area in the lower parts of the

14
side walls and through a door opening of area 3.0 m x 2.0 m. The room was connected to a chimney where rate of heat release was measured using oxygen consumption calorimetry.
Zhao (2001) presents two experiments with three cars of latest generation parked in an open car park. Gas and steel temperatures and vertical displacements of steel beams were reported, but no attempt to measure rate of heat release.
Kitano et al. (2000) report an experiment with passenger cars in a four-storey car park. The cars were located at the first floor, with two sides thermally insulated with aerated concrete boards and the other two sides open. Temperatures, displacement and strain of car park structures were measured. No attempt to measure rate of heat release was reported.
Electrical ignition sources
Although electrical ignition is a well-recognised initial fire source frequent in fire statistics of many countries, still there is little published information about specific electrical ignition sources. Information available is usually on a quite general level, and there is not much literature on the physical mechanisms behind ignitions of electrical origin. It is noted in a review focussing on single-phase, 120/240 V electrical distribution systems (Babrauskas 2001), that systematic research to quantify the mechanisms with which wiring faults lead to structure ignitions has been surprisingly low. In a recent state-of-the art report on nuclear power plant related fire safety research (OECD/NEA 2000) it is concluded, that even though the statistical fire event data are fairly well available in plant scale, component specific data are scarce or lacking. Although several experiments have been made to study fire development, there is a shortage of quantitative knowledge of ignitability of cables and other equipment such as electronic cabinets in nuclear power plants.
Paper III presents statistical, modelling and experimental studies on electrical ignition sources. Electrical failure mechanisms, first failed component and first ignited component or material were identified from the IAEA and OECD/NEA Advanced Incident Reporting System (AIRS) Database (IAEA 1997). Models for ignition by heating of a loose contact, and heating from overloading a cable and from electrical arcs are presented. The possibility of ignition from self-

15
ignition of a cable bundle is discussed, and results from experiments on ignition of a printed circuit board from overloaded components are presented.
The research was carried out concerning fire safety in nuclear power plants, but the results are generally applicable on electrical equipment, because both electricity as a physical phenomenon and most of the technical devices remain the same.
Electronic cabinet fires
Electrical and electronic devices such as circuit boards, relays and cables are often placed in relatively closed metal cabinets with small openings for ventilation. Electronic cabinets are present e.g. in power and industrial plants, computer centres and telecommunications facilities and generally in places with electric or electronic control systems. Ignition of combustible material and fire growth inside a single cabinet can spread the fire to neighbouring cabinets and the whole room containing cabinets which may lead to severe consequences for the operation of the entire system. Published, documented data on fires in electronic cabinets is however scarce in open literature (Chavez 1987, OECD/NEA 2000), and quantitative information of the development of a cabinet fire is needed for fire safety assessment.
Paper IV presents calorimetric fire experiments, both full-scale on real electronic cabinets and reduced scale experiments with mock-up cabinets. The real electronic cabinet experiments were designed to investigate worst-case scenarios of concern to end-users, and were carried out on cabinets representative of the equipment of the end-users. The primary objective of the experiments was to measure the rate of heat release from a fire in an electronic cabinet and to investigate the minimum ignition power and energy needed to reach established burning which could lead to flashover inside the cabinet. Other measurements were carried out at the same time to get as much information as possible from the experiments, with limited project resources and no possibilities to large experimental series. From the tests, differing in the amount of fire load, location of ignition, ignited material, ignition power and total ignition energy, and ventilation conditions, data were collected which could be used for source terms in numerical modelling of fires in rooms containing electronic cabinets.

16
Paper V presents a model for the maximum rate of heat release in an electronic cabinet after flashover. The model is validated using experimental data presented in Paper IV. A criterion for estimating the minimum rate of heat release needed for flashover in an electronic cabinet is proposed and checked against experimental data. Combustion is seldom complete in a fire, and is manifested in the gas phase as production of carbon monoxide and smoke, which has a large content of elemental carbon. The potential rate of heat release bound in carbon monoxide and carbon production is determined in Paper V using reaction chemistry and measured production rates of carbon monoxide and carbon in cabinet experiments presented in Paper IV. This information is important for assessing performance of numerical fire simulation codes.

17
2. Experimental methods
This chapter presents the main experimental methods used in the Papers. Full-scale fire experiments can be considered as studies of products and assemblies in sizes and configurations corresponding to actual end-use applications (Peacock & Babrauskas 1991). They provide information about the overall fire behaviour of a product, which may be difficult to extrapolate from bench-scale testing of the components of the product. Full-scale fire experiments are usually expensive to carry out, leading to short experimental series consisting of a few or even only one experiment. Typically they are extensively instrumented in order to obtain as much information as possible from one experiment. After ignition and established burning, the fire develops according to the properties of the specimen, which concurrently is destroyed. The interpretation of the measurements must take into account the material and structural properties of the specimen influencing fire development.
2.1 Rate of heat release
The most important single parameter describing a burning object is the rate of heat release, which quantifies e.g. the rate of fire growth and size of the fire (Babrauskas & Peacock 1992, Tewarson 1980). If the rate of mass loss m& is known, the rate of heat release Q& is obtained through
cHmQ ∆= && χ (1)
where combustion efficiency χ is a factor taking into account incomplete combustion and cH∆ is the heat of combustion (Drysdale 1999). This includes assuming an appropriate value for χ . The heat of combustion has been determined and tabulated for different fuels (DiNenno et al. 1995).
There exists an experimental method to determine the rate of heat release, oxygen consumption calorimetry, which is based on the observation that the heat released per unit of oxygen consumed, is approximately the same for most common combustibles present in fires. This was first pointed out by Thornton (1917) but was not utilised in fire research context until 1968 by Hinkley et al.

18
who suggested that changes in oxygen concentration of the flue gases could be used to determine the heat release rate of wood cribs (Janssens 1991). Huggett (1980) compared the heat released per unit mass of consumed oxygen for conventional organic fuels, and concluded that an average value of 13.1 MJ per kg of oxygen consumed was appropriate with an accuracy of ± 5% or better. Parker (1982, 1984) and Janssens (1991) have presented equations for calculating heat release by oxygen consumption for various applications. The method of oxygen consumption calorimetry for measuring rate of heat release is used in a lot of bench-scale and large-scale test methods, such as the cone calorimeter (ISO 5660-1 2002), the single burning item (EN 13823 2002) and the room/corner test (ISO 9705 1993).
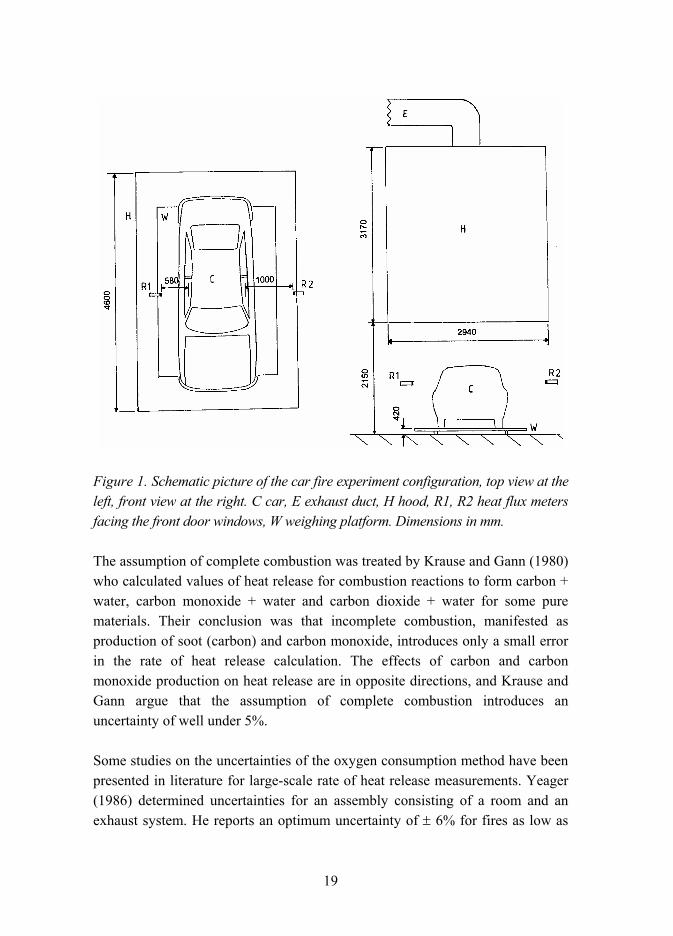
The method requires that all combustion products are collected and removed using a hood connected to an exhaust duct, where the flow rate and composition of the gases are measured. Figure 1 presents the experimental set-up of the car fire experiments described in Paper I as an example.
Janssens (1991) emphasises that the analysis is approximate and mentions the main simplifying assumptions as
• The amount of energy released by complete combustion per unit mass of oxygen is assumed to be constant. If the composition of fuel is known, a more precise value may be estimated.
• All gases are believed to be ideal gases, i.e. one mole of any gas is assumed to occupy a constant volume at the same pressure and temperature.
• Incoming air is assumed to consist of O2, CO2, H2O and N2. All "inert" gases, which do not take part in the combustion reactions, are lumped into the nitrogen.
• O2, CO2, and CO are measured on a dry basis, i.e. water vapour is removed from the sample before entering the gas analysers because of operating requirements of the analysers.
19
Figure 1. Schematic picture of the car fire experiment configuration, top view at the left, front view at the right. C car, E exhaust duct, H hood, R1, R2 heat flux meters facing the front door windows, W weighing platform. Dimensions in mm.
The assumption of complete combustion was treated by Krause and Gann (1980) who calculated values of heat release for combustion reactions to form carbon + water, carbon monoxide + water and carbon dioxide + water for some pure materials. Their conclusion was that incomplete combustion, manifested as production of soot (carbon) and carbon monoxide, introduces only a small error in the rate of heat release calculation. The effects of carbon and carbon monoxide production on heat release are in opposite directions, and Krause and Gann argue that the assumption of complete combustion introduces an uncertainty of well under 5%.
Some studies on the uncertainties of the oxygen consumption method have been presented in literature for large-scale rate of heat release measurements. Yeager (1986) determined uncertainties for an assembly consisting of a room and an exhaust system. He reports an optimum uncertainty of ± 6% for fires as low as
20
71 kW for an exhaust flow of 2 m3/s. Ahonen et al. (1987) consider the rate of heat release measurement system used in Paper I and with small exhaust line modifications in Paper IV. They report for tests where the combustion reaction and the heat release per unit volume of oxygen consumed are known, that the main source of error is the measurement of volume flow, and the inaccuracy of the calculation of the rate of heat release is about ±4%. The inaccuracy of the flow measuring system was less than ± 3% for volume flows in the range 13 m3/s NTP.
Dahlberg (1994) reports an error analysis for rate of heat release measurement with an industry calorimeter resulting in a mean square error of ± 7% in standard mode of operation (27 MW). Axelsson et al. (2001) have considered individual sources of errors for rate of heat release measurements in the standard room/corner (ISO 9705 1993) and single burning item (EN 13823 2002) test methods. The combined expanded uncertainty has then been calculated with a coverage factor of 2, giving a confidence level of ≈95%. Uncertainties of ± 10.6% at 150 kW level and ± 7.1% at 1 MW level for room/corner test and ± 13.5% at 35 kW level and ± 10.0% at 50 kW level for the single burning item test are reported. The higher uncertainties for lower rate of heat release levels are due to higher uncertainty in oxygen concentration measurement.
The rate of heat release measurements in papers I and IV were made according to the exhaust duct instrumentation and rate of heat release calculation procedure described in ISO 9705 (1993).
All potential heat is not released in unwanted fires, as combustion is very seldom complete which may result in residual char, melted unburned or partially burned products flowing away from the region of fire, and production of carbon monoxide and smoke. Smoke from a flaming fire has a large content of elemental carbon (Mulholland 1995). Carbon monoxide and smoke are present in the gas phase, e.g. in the burning of polyvinyl chloride with reaction equation (Tanaka 1983, Keski-Rahkonen and Hostikka 1999)
( )
( ) HClN2
OH21OCOCOC
OClNOHC
2222
2
npnkwvyx
zwnplkh
++−++++
→++ (2)
21
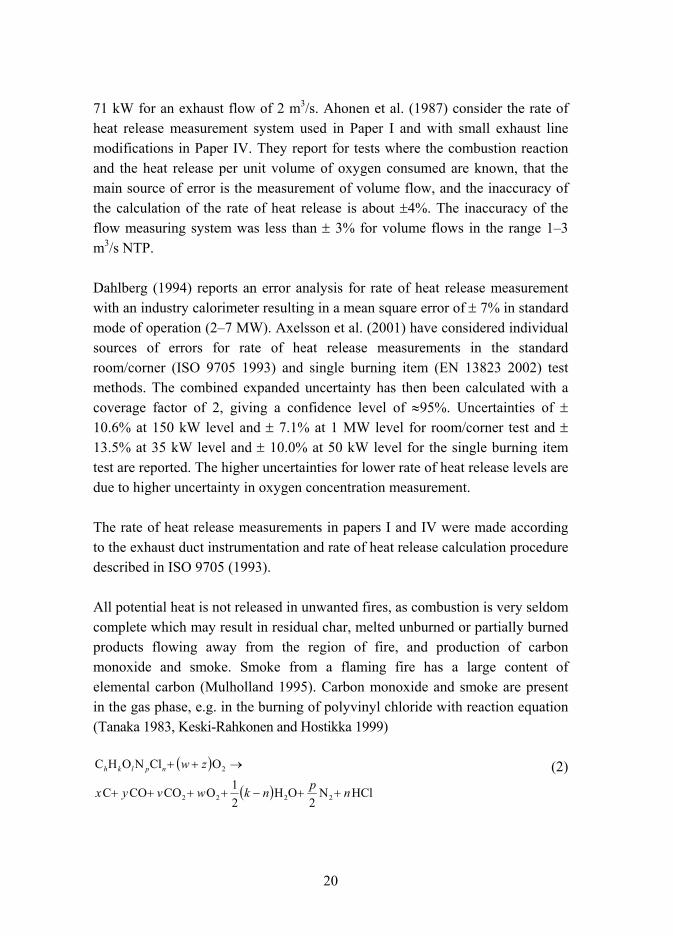
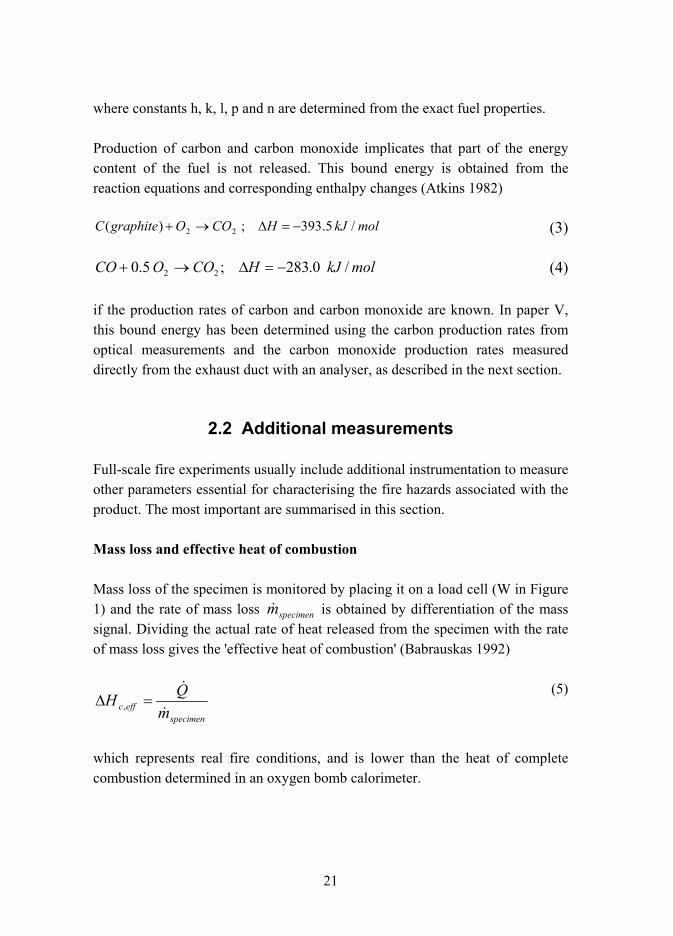
where constants h, k, l, p and n are determined from the exact fuel properties.
Production of carbon and carbon monoxide implicates that part of the energy content of the fuel is not released. This bound energy is obtained from the reaction equations and corresponding enthalpy changes (Atkins 1982)
molkJHCOOgraphiteC /5.393;)( 22 −=∆→+ (3)
molkJHCOOCO /0.283;5.0 22 −=∆→+ (4)
if the production rates of carbon and carbon monoxide are known. In paper V, this bound energy has been determined using the carbon production rates from optical measurements and the carbon monoxide production rates measured directly from the exhaust duct with an analyser, as described in the next section.
2.2 Additional measurements
Full-scale fire experiments usually include additional instrumentation to measure other parameters essential for characterising the fire hazards associated with the product. The most important are summarised in this section.
Mass loss and effective heat of combustion
Mass loss of the specimen is monitored by placing it on a load cell (W in Figure 1) and the rate of mass loss specimenm& is obtained by differentiation of the mass signal. Dividing the actual rate of heat released from the specimen with the rate of mass loss gives the 'effective heat of combustion' (Babrauskas 1992)
specimeneffc m
QH&
&=∆ ,
(5)
which represents real fire conditions, and is lower than the heat of complete combustion determined in an oxygen bomb calorimeter.
22
Heat flux
Knowledge of the heat flux from the fire is important in estimating ignition of nearby products and fire spread. Heat flux is monitored e.g. with total heat flux meters of Gardon type used in Paper I (R1 and R2 in Figure 1), which have an accuracy of ± 3% according to the manufacturer (Medtherm Bulletin 118, 1992).
Smoke production
Smoke production is usually obtained by installing a light source and a detector in the exhaust duct and measuring the extinction of a light ray of initial intensity I0 to intensity I having traversed a certain length L of smoky environment. The smoke production rate R is
R = k &V (6)
where the light extinction coefficient k is
k = (1/L)ln(I0/I) (7)
and &V is volume flow in exhaust duct at actual duct gas temperature. The smoke production rate in Equation (6) is expressed in units of m2/s. Axelsson et al. (2001) have studied individual error sources in the smoke production rate measurements in the standard room/corner (ISO 9705 1993) and single burning item (EN 13823 2002) test methods with incandescent lamp as light source. They present very level dependent combined expanded relative standard uncertainty for smoke production rate. The uncertainties vary from ± 103% at 0.1 m2/s level and ± 11.6% at 1.0 m2/s level to ± 4.9% at 10.0 m2/s level.
The production rate of smoke (carbon) expressed as a mass production rate is obtained from Equation (7) with an approximate method (Dobbins et al. 1994, Wu et al. 1997, Krishnan et al. 1999). The light extinction coefficient k is proportional to the mass concentration of smoke particles cm
k = σ cm (8)

23
where σ is the specific extinction coefficient per unit mass of smoke, which depends on the size distribution, and optical properties of smoke (Mulholland 1995). Experimental results for carbonaceous, flame-generated smoke have shown that σ is relatively independent of fuel type and size distribution (Dobbins et al. 1994, Krishnan et al. 1999). Mulholland and Croarkin (2000) have estimated a mean value of σ = 8.7 m2/g with an expanded uncertainty (95% coincidence interval) of ± 1.1 m2/g at a wavelength of 633 nm in their review on experimental studies of σ. This value applies to overventilated flaming fires such as burning in an open area. The value of σ may be smaller for underventilated fires such as burning in an enclosure (Mulholland and Croarkin 2000). One obtains thus the smoke (carbon) production rate R' in units g/s as
VkR &σ
=′ (9)
with a nearly universal value for σ.
The smoke density was measured from the attenuation of a polychromatic light beam in smoke, with an incandescent lamp as the light source in the experiments in Paper I and IV. The carbon production rate in the cabinet experiments was calculated in Paper V, using the value of specific extinction coefficient at 550 nm, where σ ≈ 8.5 m2/g (Dobbins et al. 1994). This is considered to be an appropriate estimate in the light of the above mentioned, although the size distribution of smoke in the experiments is unknown, as well as the wavelength distribution and detector response of the smoke density measurement equipment.
Temperatures
Gas and surface temperatures inside and outside the specimen are usually measured with thermocouples. Temperature measurement data may be used for estimating times to ignition of different parts of the specimen, if the material and its ignition temperature are known. Temperature measurements at specific locations are also useful as a means to verify fire models, as in Paper II where predicted temperatures from a modelled car fire are compared against measured temperatures.

24
Thermocouple junction temperatures are quite accurate. Manufacturing tolerances for thermocouples are given in standards, e.g. ANSI MC96.1 (1982) gives special tolerance ± 1.1 oC or ± 0.4%, whichever is greater, for K type thermocouples in the temperature range 0 to 1250 oC. The process of measuring temperature introduces additional errors. A thermocouple indicates its own temperature, which in general differs from the temperature of the surroundings, and results from heat transfer between the thermocouple and its environment (Moffat 1962).
Gas production
Gas concentrations can be measured in the exhaust duct with appropriate gas analysis equipment, e.g. volume fraction of carbon monoxide xCO or carbon dioxide xCO2 with an infrared analyser. Axelsson et al. (2001) have estimated a relative standard uncertainty for CO2 concentration in the standard room/corner test (ISO 9705 1993) to ± 0.82%. The production rate, e.g. COm& is obtained when the flow rate &V in the exhaust duct is measured as
COCOCO Vxm ρ&& = (10)
where ρCO is density of carbon monoxide at actual gas temperature (Tewarson 1995). If the mass loss rate of the burning specimen specimenm& is measured, one obtains the yield Y of the gas in question, e.g.
specimen
COCO m
mY&
&= (11)
i.e. the mass produced of gas per burned mass unit of specimen.
25
3. Fire development
This chapter presents the main concepts describing fire development, which are used in the Papers. Fire plumes and ceiling jets, compartment fire development and flashover are briefly discussed.
Fire plumes and ceiling jets
In the early stage of a fire in a compartment, when the fire is small, it will burn as in open air without interaction with the boundaries present in the compartment (Drysdale 1999). The hot gases above the fuel bed move upward due to buoyancy. This convective flow is referred to as a buoyant plume (Drysdale 1999). In a building, the fire plume will impinge on the ceiling, which will deflect the hot gases horizontally under the ceiling to other areas of the building remote from the fire. This relatively rapid gas flow in a shallow layer beneath the ceiling, which is driven by the buoyancy of the hot fire gases, is referred to as a ceiling jet (Evans 1995). If walls, beams or other obstacles confine the movement of the ceiling jet, the gases will form a hot gas layer, which fills all the available space. Alpert (1972) has developed correlations, based on measurements collected during test burns with different materials, to calculate the maximum gas temperature at a given position in a ceiling jet flow
HrHQTT 2.0,169.0 3/53/2 <=− −∞
& (12)
HrHrQTT 2.0,)/(0538.0 13/2 >=− −∞
& (13)
Here T (oC) is maximum temperature, T∞ (oC) is ambient temperature, )W(Q& is rate of heat release, H (m) distance from the fire to the ceiling and r (m) radial distance from plume axis. It is assumed in Equations (12) and (13) that the ceiling jet is not confined. The Alpert equations are applied in Paper II to estimate gas temperatures beneath the ceiling in an open car park, where the open walls will permit the hot ceiling jet to escape from the building and a hot gas layer is not presumed to accumulate.
26
Compartment fire development
If a fire in a compartment can grow in size, either by fire spread over the first ignited part or by fire spread to nearby material, the fire will reach a phase where the surroundings will influence its development. The compartment fire can schematically be divided into three phases (Drysdale 1999), with flashover occurring between phase 1 and 2:
1. the growth or pre-flashover phase in which the average compartment temperature is relatively low and the fire is localised near its origin
2. the fully developed or post-flashover phase, in which all combustible items in the compartment are burning and flames appear to fill the entire volume. The fire reaches its maximum, and may be either ventilation-controlled, i.e. the rate of burning is dependent on the rate of air flow through openings into the compartment, or fuel controlled, i.e. the rate of burning is independent of the size of the openings and is controlled by the surface area and burning characteristics of the fuel. The fully developed fire in a compartment is usually ventilation-controlled.
3. the decay phase, when most fuel is consumed and rate of heat release declines.
The time behaviour of the fire is of great importance for fire safety assessment and has been an object for much research. Several models have been developed, ranging from simplified models for "hand-calculating" purposes to field modelling requiring advanced computer facilities, with the rate of heat release as a central quantity. There is no general theory for predicting the progress of a fire (rate of heat release), and one must rely on experimental heat release curves (Cox 1995, Quintiere 1995). These can be put into a simple mathematical formulation for practical engineering purposes, e.g. as sketched out below and schematically presented in Figure 2.
The fire growth rate in the first phase, expressed in terms of rate of heat release, can in many cases be represented by a parabola (Heskestad & Delichatsios 1978, ISO/TR 13387-2 1999)

27
20 )(
g
i
tttQQ −
= && (14)
The reference heat release rate 0Q& can be selected freely but is often taken to be 1 MW. tg is the growth time and ti an ignition reference time.
During the fully developed phase, the fire reaches a more or less steady behaviour, and the rate of heat release can be approximated to be constant.
In the decay phase, the rate of heat release can be characterised by an exponential function (Keski-Rahkonen 1993)
⎥⎦⎤
⎢⎣⎡ −−= )(exp)(
τd
dtt
tQQ && (15)
where )( dtQ& is the rate of heat release at td , which is time at the start of the
decay phase and τ is a decay time constant.
0
20
40
60
80
100
120
140
160
180
RH
R
0 10 20 30 40 50 60 Time
DecayGrowth Fullydeveloped
Figure 2. The course of a compartment fire expressed as rate of heat release versus time. The fully developed phase is here characterised as steady burning (ventilation-controlled fire).

28
Equations (14) and (15) have been applied to describe the growth and decay phase of an electronic cabinet fire in Paper IV. Paper V presents a simple natural ventilation model for estimating the maximum rate of heat release in the fully developed phase in an electronic cabinet.
Conditions for flashover
After ignition and established localised burning, the fire can (Drysdale 1999)
1. burn itself out without spread to other combustible parts
2. self-extinguish or continue to burn at a very slow rate because of insufficient ventilation, or
3. grow to flashover, if there is sufficient fuel and ventilation.
The transition from the growth phase to the fully developed fire, e.g. flashover, implies a great change in the circumstances in the compartment, and conditions necessary for flashover are significant for fire safety assessment. In Paper V, a criterion for estimating the minimum rate of heat release minQ& needed to establish flashover conditions in an electronic cabinet is proposed.

29
4. Results and discussion This chapter presents the main results of Papers IV.
4.1 Fire behaviour of passenger cars
Paper I describes the car fire experiments and presents the results. Parametrisation of the rate of heat release curves are presented in Paper II, and a burning passenger car is modelled by two fire plumes.
Experimental results
Three full-scale experiments on passenger cars were carried out on inexpensive, ordinary medium-size cars manufactured in the late 1970s. Rate of heat release using oxygen consumption calorimetry, mass loss, heat flux, carbon monoxide, carbon dioxide and smoke production rates, gas temperatures above the car and temperatures inside the car were determined. The cars were allowed to burn until the fire went out.
The purpose of the car fire experiments was to obtain a rate of heat release curve. A heptane tray ignition source with a rather high power output of about 160 kW was therefore used to ensure self-sustaining fire and growth to a fully developed fire in the car. The windows were opened before the experiments, which also enhanced this purpose. The cars were ignited from the passenger cabin in one case and beneath the engine in two cases. The study did neither consider the ignitability of a passenger car, nor the role of a possible smouldering phase.
All combustible material in the cars was consumed, and the peak rates of heat release were in the range 1.52.0 MW. The total heat released during the experiments was 3.03.9 GJ. The rate of heat release curves contain several sharply rising peaks, which slowly decrease. These correspond to ignition and burning of different parts of the car, confirmed by observations during the experiments. Figure 3 shows the rate of heat release curve from experiment 1, where arrows indicate the rise of two distinct peaks, corresponding to increasing fire in the passenger cabin and to ignition of petrol from the filler pipe mouth and the rear part of the car.

30
A passenger car is an encapsulated structure with openings through which flames can emerge. The temperatures measured inside the car rise to post-flashover room fire temperatures, about 800 oC. Gas temperatures directly above openings like the windscreen and the rear window reach 600800 oC in temporary peaks during intense burning near the opening. Besides these peaks temperatures directly above an opening are in the range 200300 oC. Gas temperatures above shielded parts of the car, such as the bonnet or the roof, rise to 200400 oC. The fire behaviour of a passenger car can thus be described as a local fire with distinct fire plumes coming out from the openings.
The heat flux measurements give information on the possibility of fire spread to an adjacent car. The heat flux meters were facing the left and right front door windows at 1.0 m and 0.6 m distance, corresponding to typical distances to adjacent parked cars. Maximum heat flux at 1.0 m distance was 1922 kW/m2 for a duration of 413 min. Maximum heat flux at 0.6 m distance was 40 kW/m2 for 3 min and the heat flux was at 30 kW/m2 level for 414 min in the experiments. These levels were reached at 913 min after ignition. The critical heat flux, i.e. the limit above which a material can generate enough vapours to form a combustible mixture, for polymers commonly used in the automotive industry is in the range 1020 kW/m2 (Tewarson et al. 2000). The possibility of fire spread to an adjacent car thus exists, and the delay from ignition of the first car to reaching these heat flux levels is about 10 min.
Parametrisation and modelling
The rate of heat release curves as a function of time t were parametrised by superposition of a Boltzmann curve and three symmetrical Gaussian curves
))(exp()()(1
12/11101 a
ttttQtQ −−−= &&
(16)
4...2;)))(
(exp()( 20 =
−−= i
att
QtQi
iii&&
(17)
combining to the rate of heat release from the whole car as
∑=
=4
1)()(
iicar tQtQ &&
(18)
31
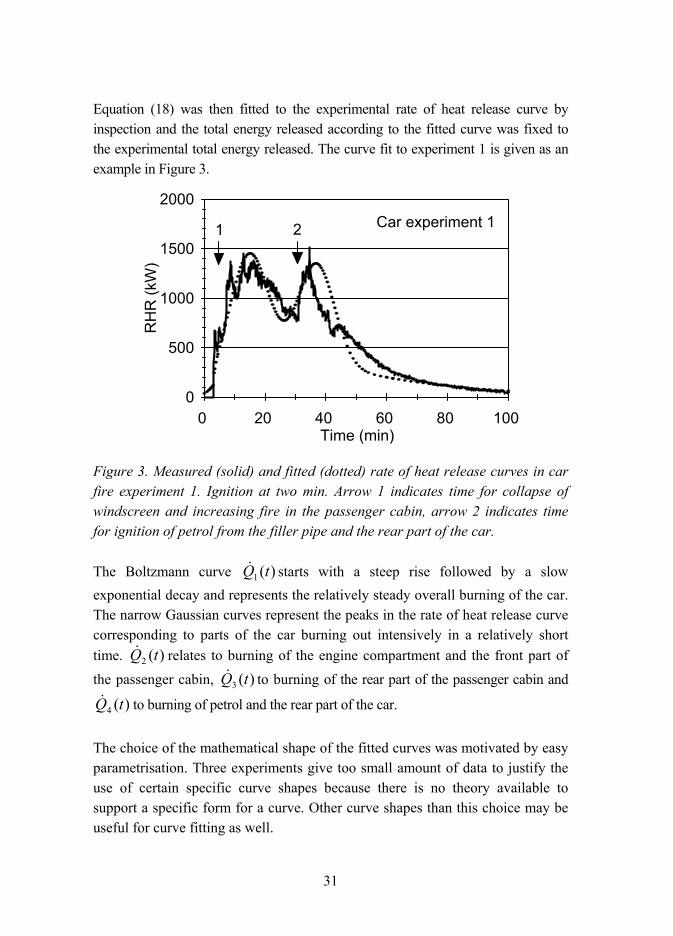
Equation (18) was then fitted to the experimental rate of heat release curve by inspection and the total energy released according to the fitted curve was fixed to the experimental total energy released. The curve fit to experiment 1 is given as an example in Figure 3.
0
500
1000
1500
2000
RH
R (k
W)
0 20 40 60 80 100 Time (min)
Car experiment 11 2
Figure 3. Measured (solid) and fitted (dotted) rate of heat release curves in car fire experiment 1. Ignition at two min. Arrow 1 indicates time for collapse of windscreen and increasing fire in the passenger cabin, arrow 2 indicates time for ignition of petrol from the filler pipe and the rear part of the car.
The Boltzmann curve )(1 tQ& starts with a steep rise followed by a slow exponential decay and represents the relatively steady overall burning of the car. The narrow Gaussian curves represent the peaks in the rate of heat release curve corresponding to parts of the car burning out intensively in a relatively short time. )(2 tQ& relates to burning of the engine compartment and the front part of the passenger cabin, )(3 tQ& to burning of the rear part of the passenger cabin and
)(4 tQ& to burning of petrol and the rear part of the car.
The choice of the mathematical shape of the fitted curves was motivated by easy parametrisation. Three experiments give too small amount of data to justify the use of certain specific curve shapes because there is no theory available to support a specific form for a curve. Other curve shapes than this choice may be useful for curve fitting as well.

32
Mean values of the coefficients ii aQ ,0& and times it for the fitted curves were
calculated to get an average curve, which was normalised to a total energy release of 4 GJ. This value was supposed to be representative of an ordinary passenger car in the light of the car fire experiments.
The car fire is modelled by two fire plumes (Figure 4a), as a car is a well encapsulated structure with separate openings and it is not possible to adequately describe the car fire with only one fire plume. The front plume, thought to emerge from the centre of the windscreen, describes the fire in the front part where engine, front tyres and front part of passenger compartment are the main fuel. The rear plume, thought to emerge from the centre of the rear window, describes the rear part of the car where fuel, boot, rear tires and rear part of passenger compartment are the main fuel. The plumes are mathematically expressed as
)()(5.0)( 21 tQtQtQ front&&& += (19)
)()()(5.0)( 431 tQtQtQtQrear&&&& ++= (20)
where the Boltzmann curve characterising the steady overall burning is equally divided between front and rear plumes. The rate of heat release curves for front and rear plumes in experiment 1 are shown in Figure 4b.
a)
0
500
1000
1500
2000
RH
R (k
W)
0 20 40 60 80 100 Time (min)
Car experiment 1Frontplume
Rearplume
b)
Figure 4. a) Locations of front and rear fire plumes in a car, b) fitted rate of heat release curves for front and rear fire plumes in car fire experiment 1.
The model was validated by calculating gas temperatures with Alpert´s equation (12) for the maximum ceiling jet temperature using the model rate of heat release

33
as input. The calculated temperatures were compared to the experimental temperatures above the windscreen and above the rear window as presented in Figure 5 for car fire experiment 1. The gas temperatures predicted by the two-plume model are consistent with the corresponding measured gas temperatures (Figures 9 and 10 of Paper II).
0
200
400
600
800
Tem
pera
ture
(C)
0 20 40 60 80 100 Time (min)
Car experiment 1
0
200
400
600
800
Tem
pera
ture
(C)
0 20 40 60 80 100 Time (min)
Car experiment 1
Figure 5. Measured (solid) and calculated (dotted) gas temperatures above a) the centre of the windscreen and b) above the centre of the rear window. Locations of thermocouples are indicated with dots in the figures.
Comparison to research carried out elsewhere after Papers I and II
The rate of heat release curves measured in the fire experiments on passenger cars inside a canopy (Shipp and Spearpoint 1995) are clearly higher than in Paper I. The first canopy experiment, ignited from the engine, lasted for 17 min after which it was terminated and the fire extinguished as the size of the fire threatened the experimental facilities. Maximum rate of heat release 7.5 MW and a total energy release of 4.0 GJ was recorded for this intense car fire. The other experiment, ignited from a seat, did not become as severe, and it was allowed to continue until only a tyre fire remained, and then extinguished after 57 min. Maximum rate of heat release 4.5 MW and a total energy release of 5.0 GJ was recorded. The differences in rate of heat release curves compared to Paper I may primarily be due to two reasons, also pointed out by Shipp and Spearpoint (1995). First, the cars in Paper I were late 1970 models while the cars in the canopy experiments were 1982 and 1986 models. The materials used in the cars and correspondingly fire behaviour may thus be different. Second, the experiments in Paper I were made in surroundings corresponding to open space,

34
while the canopy experiments were intentionally carried out to simulate a closed space. The interaction between the burning car and the environment is thus totally different, and the heat feedback in the canopy experiments has probably enhanced the fire intensity and the corresponding heat release.
Kruppa et al. (1998) give two examples of rate of heat release curves from their series of 10 car fire experiments. A rather flat curve with a maximum of 2 MW was presented for a car of older, 1970/1980 model, and a curve rising to about 1.5 MW level followed by a rise to about 5 MW level including a peak of short duration reaching 8.5 MW for a car of newer, 1990 model. Fire spread to a neighbouring car at 0.7 m distance from the burning car was noticed in all five experiments with two cars. The ignited part was either tyres or rubber around doors and ignition occurred about 12 min after ignition of the first car.
Steinert (1999, 2000a, 2000b) reports rate of heat release curves for single burning cars with maxima in the range 1.74.6 MW. The total energy released in the experiments with one car was 3.1, 3.2 and 8 GJ. In experiments with two or three cars rate of heat release maxima were in the range 5.58.9 MW. Rate of heat release at the moment of fire spread to an adjacent car was 1.94.3 MW in these experiments. Fire spread to an adjacent car in six out of seven experiments, with time of ignition of the adjacent car in the range 1252 minutes after ignition of the first car. In one experiment, fire did not spread to the adjacent car at a distance of 0.8 m. The ignited parts of the adjacent cars were rubber strips, and rubber seals around the windows, in one case a tyre and a rubber strip practically at the same time. Varnish and the plastic beneath ignited first in Trabant cars. No unambiguous conclusions could be drawn about the influence of car body material on fire spread to an adjacent car.
In an experiment with passenger cars in a four-storey car park (Kitano et al. 2000), the fire spread successively from car to car until extinguishment after spread to car no. 8 at 43 min after ignition. The fire spread to the second car after 8.5 min. In two experiments, each with three cars (Zhao 2001), fire spread from the ignited car in the centre to both neighbouring cars. Time for fire spread depended on wind condition but was not reported.
A comparison of these results with the measurements presented in Paper I indicate that the rate of heat release from a car of newer design is clearly higher

35
than from older cars. The probable reason is different materials used in car manufacturing. Various polymers have replaced metal parts, and the thermal properties of car parts have changed, leading to an increase in rate of heat release. This differing fire behaviour can be taken into account by adjusting the parameters in the model average rate of heat release curve and normalising the total energy released to represent the energy content of a modern car. The shortest reported times for spread of fire from the ignited car to an adjacent car, 8.512 min are in accordance with the 1013 min estimate from heat flux measurements in Paper I.
4.2 Electrical ignition sources
Electrical ignition sources in nuclear power plants are studied in Paper III using statistical, modelling and experimental methods.
Statistical analysis
The main database used when compiling the statistics was the October 1997 release of version 1.1 of the Advanced Incident Reporting System (AIRS) Database (IAEA 1997), which was considered to contain the most detailed incident reports. It was provided by the Finnish Radiation and Nuclear Safety Authority (STUK) on the condition of confidentiality. The database contained 2591 reports describing incidents from the period 19741997. The corresponding total number of reactor years is 86561. Reports related to fires were searched from the database, read through and 34 reports describing 39 fires originating from electrical faults were found. From these reports, failure mechanism leading to ignition, first failed component and first ignited component or material were identified. The description of the true root causes of the fire is incomplete in many of the reports introducing uncertainty into the results. Also some of the specified ignition mechanisms and failed components are described as "possible" or "supposed".
1 D. Ruatti, IAEA, private communication, May 7th, 1998.

36
Failure mechanisms overheating, short, ground fault and arcing were roughly equally frequent, 1318% of the identified mechanisms. Loose connections were mentioned in 8% of the reports. The large amount of unspecified or unclear mechanisms, one third of all cases, is notable. The true root fault mechanism is difficult to identify because the ignition and fire is often the result of a chain of faults. Three groups of ignition mechanisms could still be identified:
• arcing, short circuits and ground faults
• overheating by electrical overload
• overheating by loose connections, cold solder joints or other poor connections.
The failed component was a switch, breaker or relay in 31% of the cases, i.e. a component with movable mechanical parts. The most frequent single component was transformer, 26% of the cases. Three specific groups of critical components could thus be identified:
• switches, breakers and relays
• cables and contacts, splices and terminals
• transformers.
The failed electrical component is not necessarily the first ignited material. The most frequent first ignited material was oil in 28% of the cases. This is in correspondence with transformer as the most frequent single failed component. Cable insulation was mentioned as first ignited material in 21% of the reports, although cables were recognised as failed component in 10% of the cases. This corresponds to situations where the original fault has occurred in a switch, breaker, contact, terminal etc. igniting insulation of connected or nearby cable. The first ignited component was unknown in 26% of the cases.
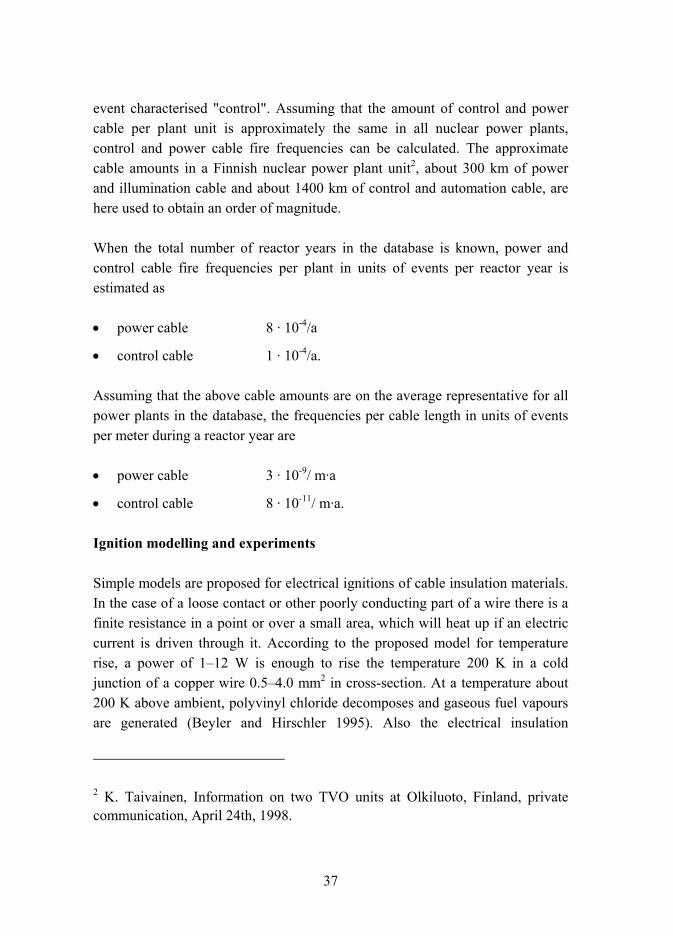
Ignition probabilities of power and control cables were estimated. The voltage in the failed circuit was described in the reports as power, control or not mentioned. Voltages explicitly mentioned in the power group were 380600 V, 3.36.9 kV and greater than 10 kV. Voltage was not specified in the control events. For ignition of cable insulation, seven events were characterised "power" and one
37
event characterised "control". Assuming that the amount of control and power cable per plant unit is approximately the same in all nuclear power plants, control and power cable fire frequencies can be calculated. The approximate cable amounts in a Finnish nuclear power plant unit2, about 300 km of power and illumination cable and about 1400 km of control and automation cable, are here used to obtain an order of magnitude.
When the total number of reactor years in the database is known, power and control cable fire frequencies per plant in units of events per reactor year is estimated as
• power cable 8 · 10-4/a
• control cable 1 · 10-4/a.
Assuming that the above cable amounts are on the average representative for all power plants in the database, the frequencies per cable length in units of events per meter during a reactor year are
• power cable 3 · 10-9/ m·a
• control cable 8 · 10-11/ m·a.
Ignition modelling and experiments
Simple models are proposed for electrical ignitions of cable insulation materials. In the case of a loose contact or other poorly conducting part of a wire there is a finite resistance in a point or over a small area, which will heat up if an electric current is driven through it. According to the proposed model for temperature rise, a power of 112 W is enough to rise the temperature 200 K in a cold junction of a copper wire 0.54.0 mm2 in cross-section. At a temperature about 200 K above ambient, polyvinyl chloride decomposes and gaseous fuel vapours are generated (Beyler and Hirschler 1995). Also the electrical insulation
2 K. Taivainen, Information on two TVO units at Olkiluoto, Finland, private communication, April 24th, 1998.
38
properties of cable insulation material have derated at this temperature to a degree that ignition mechanisms such as short circuits are possible (Keski-Rahkonen et al. 1997), and the possibility of ignition of cable insulation material exists.
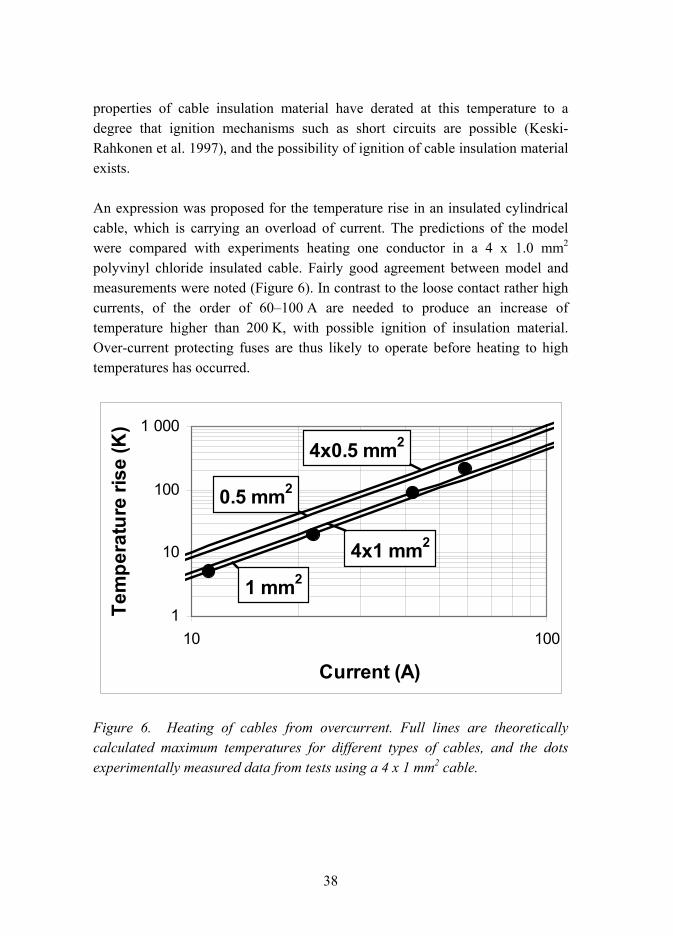
An expression was proposed for the temperature rise in an insulated cylindrical cable, which is carrying an overload of current. The predictions of the model were compared with experiments heating one conductor in a 4 x 1.0 mm2 polyvinyl chloride insulated cable. Fairly good agreement between model and measurements were noted (Figure 6). In contrast to the loose contact rather high currents, of the order of 60100 A are needed to produce an increase of temperature higher than 200 K, with possible ignition of insulation material. Over-current protecting fuses are thus likely to operate before heating to high temperatures has occurred.
1
10
100
1 000
10 100
Current (A)
Tem
pera
ture
rise
(K)
1 mm2
4x0.5 mm2
4x1 mm2
0.5 mm2
Figure 6. Heating of cables from overcurrent. Full lines are theoretically calculated maximum temperatures for different types of cables, and the dots experimentally measured data from tests using a 4 x 1 mm2 cable.

39
Physical models for electrical arcs are reviewed3. It is concluded that ignition of cable insulation is possible from an arc as the distances present between conductors in cables correspond to possible arc lengths. A stable arc small enough not to blow off the flames is possible provided power source voltage is above about 50 V, and the source impedance is in the region of 1100 Ω.
Experiments on self-ignition of cable bundles are presented, and considered to be an unlikely cause of ignition for cable bundles not well thermally insulated.
Seven fire experiments with microcircuits and tantalum capacitors, and three with power transistors on printed circuit boards were carried out under the hood of a cone calorimeter, without using the external heat flux cone or the spark ignitor. The main criteria for choosing the components were that they could tolerate enough power for ignition to be possible. They were gradually electrically overloaded, and voltage, current, and power dissipation were measured, in addition to cone calorimeter measurements. Capsules of microcircuits and tantalum capacitors ignited and burned for 530 s with a small flame in some of the experiments, but they did not ignite adjacent components or the circuit board. The rate of heat released from the microcircuits and capacitors was below the detection level of the cone calorimeter, estimated to 50100 W. The printed circuit board ignited in two experiments with power transistors, and burned with distinct flame for 25 s and 70 s respectively, until the input conductor to the transistor broke due to overloading. The power input level to the transistor was 7580 W immediately before ignition. Maximum rate of heat release was 450 W in the power transistor experiments.
The experiments with heavily overloaded electronic components did not generally lead to fire spread to adjacent material because of destruction of the components before ignition. Only power transistors mounted on printed circuit boards seemed able to start ignition of the circuit board.
3 The curves in Figures 5 and 6 in Paper III corrresponds to iron electrodes and not to copper electrodes as incorrectly presented.

40
4.3 Fire behaviour of electronic cabinets
Paper IV describes fire experiments on electronic cabinets and presents measured quantities and fire behaviour. In Paper V, an analytical expression for the maximum rate of heat release from an electronic cabinet is proposed. A criterion for estimating the minimum rate of heat release needed for flashover inside a cabinet is suggested. The potential rate of heat release bound in carbon and carbon monoxide resulting from incomplete combustion is determined from measured production rates and reaction equations.
4.3.1 Experiments and results
Thirteen fire experiments on electronic cabinets were carried out in three separate series, experiments 1 to 3, 4 to 6 and 7 to 10. These thirteen experiments include three attempts of ignition, which did not lead to sustained burning because of too low ignition energy. They occurred in experiments 2 and 6, and are denoted 2A, 2B and 6A, while experiments 2C and 6B lead to flashover.
Two real electronic cabinets were used, one relay cabinet in experiments 1 to 3 and one circuit board cabinet in experiments 4 to 6. They consisted of a solid steel frame, ceiling, doors and walls of 1.5 or 2.0 mm thick steel sheets. The open bottoms of the cabinets were closed in the experiments with a steel plate welded to the frame of the cabinet. A mock-up cabinet made of thin steel sheets was attached to the ignited cabinet in order to study the response of an adjoining cabinet to the fire. Another cabinet was placed at a distance of 1 m opposite the ignited cabinet to represent a neighbouring row of cabinets.
The experimental configuration is presented in Figure 7. All experiments were carried out beneath a hood H with a cross-section of 3.0 m x 3.0 m, connected to an exhaust duct E and a fan, which collected all combustion products. The main quantity to measure was the rate of heat release, additionally carbon dioxide, carbon monoxide and smoke production rates, mass loss and gas and wall temperatures in the cabinets were measured as presented in detail in Paper IV.

41
2630
185
2250
E
H
1000
F O
2260
b)
2630
185
2250
a)
W
E
H
F N
Figure 7. Experimental configuration in cabinet experiments 1 to 6. a) front view without opposite cabinet, b) side view. F fire cabinet, N adjoining cabinet, O opposite cabinet, W weighing device, H hood and E exhaust duct. In experiments 7 to 10 only the fire cabinet was present. Dimensions in mm.
Besides relays or circuit boards, the real cabinets contained mainly cables with polyvinyl chloride jacket and either polyvinyl chloride or polyethylene insulation, and wiring. The contents of the cabinets are presented in Table 1 of Paper IV and schematic drawings of the cabinets and their contents are presented in Figure 8. Each real cabinet was refurnished after the first experiment, the relay cabinet with the same amount of similar contents and the circuit board cabinet with 0.5 and 1.5 times the amount in the first circuit board cabinet experiment (number 4). Two mock-up air-chimney-like small cabinets made of 0.5 mm thick steel sheets without doors and containing cables only were used in experiments 7 to 10, each in two experiments. The ventilation in all cabinets was buoyantly driven.
42
CB
W
a)
b)
I1
I1
I2
63022
50
630
488
Verticalsteel sheet
R
R
R
R
R
RC
C
R
I2
CBR
C
I3
I3580
600
2250
C11
65
300
300
30018
00245
245
C
245
C
CC
c)
d)
e)
f)
g)
h)
600
CBR
I4 I4
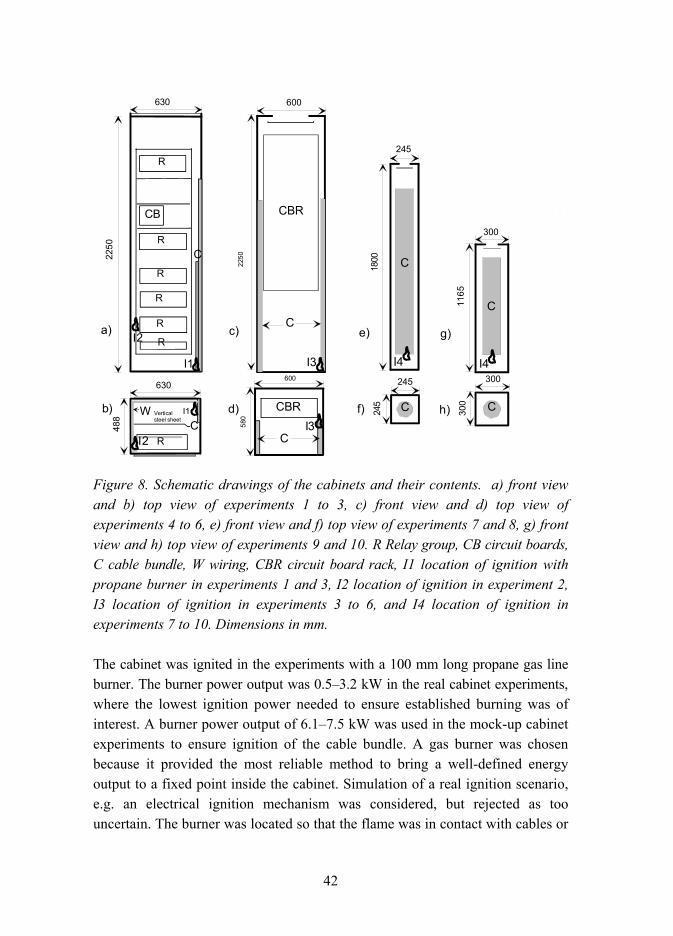
Figure 8. Schematic drawings of the cabinets and their contents. a) front view and b) top view of experiments 1 to 3, c) front view and d) top view of experiments 4 to 6, e) front view and f) top view of experiments 7 and 8, g) front view and h) top view of experiments 9 and 10. R Relay group, CB circuit boards, C cable bundle, W wiring, CBR circuit board rack, I1 location of ignition with propane burner in experiments 1 and 3, I2 location of ignition in experiment 2, I3 location of ignition in experiments 3 to 6, and I4 location of ignition in experiments 7 to 10. Dimensions in mm.
The cabinet was ignited in the experiments with a 100 mm long propane gas line burner. The burner power output was 0.53.2 kW in the real cabinet experiments, where the lowest ignition power needed to ensure established burning was of interest. A burner power output of 6.17.5 kW was used in the mock-up cabinet experiments to ensure ignition of the cable bundle. A gas burner was chosen because it provided the most reliable method to bring a well-defined energy output to a fixed point inside the cabinet. Simulation of a real ignition scenario, e.g. an electrical ignition mechanism was considered, but rejected as too uncertain. The burner was located so that the flame was in contact with cables or
43
wiring directly above the burner as indicated in Figure 8. The propane burner was turned off when the fire in the cable or wiring bundle was estimated to be large enough to sustain burning by itself. The fire was allowed to develop freely after ignition and data logging continued until the fire went out.
Experiments 1 and 4 were performed with the cabinets as delivered without pre-securing possible distortions in cabinet frames or doors due to melting or thermal expansion, corresponding to a realistic cabinet fire scenario. This lead to different ventilation conditions in the real cabinet experiments. This was especially noticeable in experiment 4, where the door locking mechanism failed and the doors opened partly. Before experiments 2, 3, 5 and 6 these damages and gaps were repaired and tightened as well as possible. Despite these securings, smaller gaps occurred during the experiments causing slightly changing ventilation conditions. The ventilation conditions in the mock-up cabinets in experiments 7 to 10 were steady as they were constructed taking the experiences from experiments 1 to 6 into account.
Rate of heat release
Rate of heat release curves from the cabinet experiments are presented in Figure 4 of Paper IV and in Figure 9 together with the potential rate of heat release bound in carbon and carbon monoxide. The influence of the increasing air intake due to the failing door locking mechanism after about 20 min is clearly seen as a distinct rise in rate of heat release (Figure 9, experiment 4) to a peak value of about 350 kW. The cabinet was practically intact during experiment 6B, where the growth, steady burning and decay phases are well distinguished (Figure 9). Maximum rate of heat release levels of 100150 kW were reached in relay cabinet experiments 1 and 2 where gaps in the cabinet walls occurred. The influence of ventilation is also noted in the relay cabinet series where the rate of heat release from the tightened cabinet in experiment 3 is lower than in the preceding experiments (Figure 9). In experiment 3, ventilation was still restricted by soot blocking the exit vents. In experiment 5, the peak rate of heat release remained at 50 kW level for only about 3 min. The cabinet did not reach flashover conditions and the fire remained local inside the cabinet.

44
0
50
100
150
200
RH
R (k
W)
0 30 60 90 120 150 180 Time (min)
Released
Bound in C and CO
Experiment 1
0
50
100
150
200
RH
R (k
W)
0 30 60 90 120 150 180 Time (min)
Released
Bound in C and CO
Experiment 2C
0
50
100
150
200
RH
R (k
W)
0 30 60 90 120 150 180 Time (min)
Experiment 3
Released
Bound in C and CO
0
100
200
300
400
RH
R (k
W)
0 30 60 90 Time (min)
Experiment 4
Released
Bound in C and CO
0
10
20
30
40
50
60
RH
R (k
W)
0 20 40 60 Time (min)
Experiment 5
Released
Bound in C and CO
0
50
100
150
200 R
HR
(kW
)
0 30 60 90 120 150 180 Time (min)
Experiment 6B
Released
Bound in C and CO
0
10
20
30
40
50
RH
R (k
W)
0 10 20 30 40 50 Time (min)
Experiment 7
Released
Bound in C and CO
0
10
20
30
40
50
RH
R (k
W)
0 10 20 30 40 50 Time (min)
Experiment 8
Released Bound in C and CO
0
10
20
30
40
50
RH
R (k
W)
0 10 20 30 40 Time (min)
Experiment 9
Released
Bound in C and CO
0
10
20
30
40
50
RH
R (k
W)
0 10 20 30 40 50 Time (min)
Experiment 10
Released
Bound in Cand CO
Figure 9. Measured rate of heat release in cabinet experiments and potential rate of heat release bound in carbon and CO. The RHR measurement in experiment 1 failed at about 72 min. The flat maximum in the "bound" curve in experiment 4 results from exceeding the measurement range of smoke density.

45
Incomplete combustion
The potential rate of heat release bound in carbon and carbon monoxide due to incomplete combustion was determined as presented in Figure 9 for all cabinet experiments, using the methods described in chapter 2. The ratio of potential rate of heat release bound in carbon and carbon monoxide to the experimental rate of heat release at time for maximum rate of heat release varies for the real cabinets from 10% in experiments 1 and 5, to 2535% in experiments 2C and 6B. In experiment 4, the ratio was as high as 50% at 20 min where exceeding of the measurement range of smoke density starts. The corresponding ratios for the mock-up cabinets in experiments 710 varied between 15 and 25%.
Generally, more potential RHR was bound in carbon than in carbon monoxide in the experiments. Rate of heat release bound in carbon was 1.5 to 2 times rate of heat release bound in carbon monoxide at the time of intense burning. In experiment 1 the proportions were reverse and in experiment 6B equal.
The applied method is a simple means to estimate the potential rate of heat release bound in carbon monoxide and carbon using standard equipment present in most rate of heat release measurement apparatuses. Application of this method to measurements in cabinet fire experiments presented in Paper IV shows that a considerable amount of potential rate of heat release is bound in carbon monoxide and carbon, between 10% and 50% of actual rate of heat release during intense burning. It is also clearly noted that the potential rate of heat release bound in carbon monoxide and carbon increases when the actual rate of heat release increases in the experiments as in experiment 4, where the door locking mechanism failed leading to increased air supply to the fire. This indicates that the incomplete combustion is a consequence not only of the oxygen-limited fire caused by the small vent openings but also of the combustion properties of polyvinyl chloride and other plastic material in cables and electric devices in the cabinets.
Ignition
One of the objectives with the real cabinet experiments was to get information about the lowest ignition power needed to ensure established burning in the cabinet. The real cabinets were ignited in two different ways, beneath a vertical cable bundle at the right wall in experiment 1 and 3 to 6 and beneath a horizontal

46
bundle of wiring near the relays in experiment 2. The ignition burner power output was chosen on the basis of small-scale tests on cable and wiring (Keski-Rahkonen et al. 1999).
A burner power output of 500 W and energy output of 150 kJ ignited a cable bundle, about 50 mm thick and 170 mm in width in experiment 3, where fire developed to flashover in the cabinet. In experiments 4 and 5, an average burner power output of 1 kW and average energy output of 300 kJ was sufficient to ignite 60 and 110 mm thick and 160180 mm wide cable bundles. The same power was insufficient to ignite a bigger cable bundle 180 mm in thickness. Ignition required an average power output of 2.5 kW and energy output of 1.2 MJ, and the cables above the burner were additionally spread out. The horizontal bundle of wiring in experiment 2B went out after turning the propane burner off, with power output 1.5 kW and energy output 470 kJ. A burner power output of 3.2 kW and energy output 1.9 MJ ignited the wiring and fire spread to flashover.
In this short series a minimum burner power output of 500 W was sufficient to ignite a vertical bundle of cables with polyvinyl chloride jacket and insulation. For configurations using thicker and especially tightly bundled cables higher ignition powers and energies are needed for established burning. The statistical scatter in determining experimentally the limits where a cabinet may ignite or not can be considerable, and large series of experiments are needed to obtain high accuracy. The results presented here are still at least approximate. Other cable materials may need different ignition power and energy.
Spread of fire inside the cabinet
In 5 out of 6 real cabinet experiments, the fire spread to the rest of the cabinet igniting all combustible material after established burning around the point of ignition. In experiment 5 only the ignited cable bundle was consumed, as the fire did not spread to the rest of the fire load.
After burning was established, the development of the fire in the cabinet was controlled by several factors. One of the most important of them was the fire load around the seat of the fire. In most of the experiments the size of the first ignited cable or wiring bundle was enough to heat the cabinet so far (Figure 9 of Paper IV) that hot gases in the upper part ignited other combustible contents.

47
In experiment 5 the peak heat release remained at 50 kW level (Figure 9) only about 3 min. Only two gas thermocouples near the edge of the exit opening exceeded for the same period of time a temperature of 300 oC. Other temperatures were much lower, and below ignition temperatures. The hot gases from the burning cable bundle flowed along the wall of the cabinet and out of the ceiling opening without touching much of the other combustible fire load. Therefore the fire remained local and went out when the initial cable bundle was consumed. In experiments 7 to 10, the fire spread easily to all parts of the cable bundle due to the chimney-like structure of the cabinet. Contents and design of the cabinet may thus have considerable influence on the fire development and the rate of heat release.
The fire growth rate of the first ignited cable or wiring bundle was determined by fitting a parabola (Equation (14)) with reference heat release rate 0Q& = 1 MW on the initial part of the rate of heat release curve. Growth times in the range 7506000 s were obtained. Fire growth is classified in ISO/TR 13387-2 (1999) according to the growth time tg in four categories, where fire growth with tg greater than 600 seconds is denoted "slow". The fitting of the t2 curves is not unique, because a parabola does not reproduce all features of the fire growth curve. Despite these inaccuracies, the fire development in the cabinet fire experiments was slow according to the ISO/TR 13387-2 classification.
An exponential function (Equation (15)) was fitted to the rate of heat release curves where a clear exponential decay could be distinguished. In experiment 3 where the rate of heat release curve shows several peaks, and in experiment 4 where the decaying rate of heat release curve indicates a superposition of two exponential functions, one exponential function was fitted to the last part of the rate of heat release curve. The decay time constants from the fitting of exponential functions were in the range 1323 min for real electronic cabinets and 69 min for reduced scale cabinets.
Influence of fire on neighbouring cabinets
The influence of the cabinet fire on the adjoining and opposite cabinets can be estimated from the behaviour of the vertical cable specimens located in the upper parts of the cabinets. The cables were provided with thermocouples for surface temperature monitoring, and approximate times to ignition of cables are obtained from the measured surface temperatures, assuming that the cables ignite at
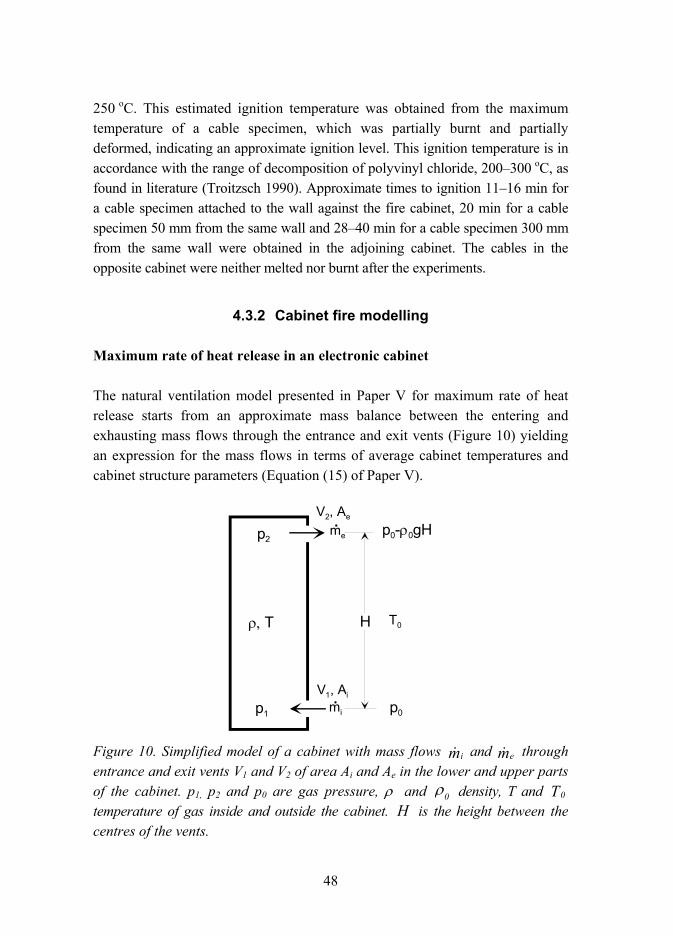
48
250 oC. This estimated ignition temperature was obtained from the maximum temperature of a cable specimen, which was partially burnt and partially deformed, indicating an approximate ignition level. This ignition temperature is in accordance with the range of decomposition of polyvinyl chloride, 200300 oC, as found in literature (Troitzsch 1990). Approximate times to ignition 1116 min for a cable specimen attached to the wall against the fire cabinet, 20 min for a cable specimen 50 mm from the same wall and 2840 min for a cable specimen 300 mm from the same wall were obtained in the adjoining cabinet. The cables in the opposite cabinet were neither melted nor burnt after the experiments.
4.3.2 Cabinet fire modelling
Maximum rate of heat release in an electronic cabinet
The natural ventilation model presented in Paper V for maximum rate of heat release starts from an approximate mass balance between the entering and exhausting mass flows through the entrance and exit vents (Figure 10) yielding an expression for the mass flows in terms of average cabinet temperatures and cabinet structure parameters (Equation (15) of Paper V).
H T0
V2, Ae
V1, Ai
mi
me p0-ρ0gH
p0
ρ, T
p1
p2
Figure 10. Simplified model of a cabinet with mass flows mi& and m e& through entrance and exit vents V1 and V2 of area Ai and Ae in the lower and upper parts of the cabinet. p1, p2 and p0 are gas pressure, ρ and 0ρ density, T and 0T temperature of gas inside and outside the cabinet. H is the height between the centres of the vents.

49
If there is enough fuel in the cabinet, the fire is ventilation controlled and all air entering the cabinet is consumed. From the air inflow and the oxygen consumption principle, the maximum rate of heat release Q & max
in an electronic cabinet fire is (cf. Equation (1))
22
max 1/112
e
e
i
cairc, 0
AA
gHC H = Q ττ
ρχ+
−∆& (21)
∆Hc,air = 3.0 MJ/kg is the heat of combustion per consumed air according to the oxygen consumption principle, g the acceleration of gravity, C discharge coefficient assumed to be the same for entrance and exit vents, and cτ and eτ dimensionless average cabinet and exit vent temperatures. Equation (21) was applied on the cabinet experiments presented in Paper IV where flashover in the cabinet occurred with well-defined ventilation conditions. The model rate of heat release curve exceeds the experimental curve during all experiments (Figure 11), except for two peaks in experiment 7, which arise from flames emerging out from the exit vent. The peaks are outside the validity range of the model, which considers only burning inside the cabinet. Comparing the model curves to the experimental curves it is noted that the latter are 5998% of the model assuming complete combustion (Table 2 of Paper V). The proposed model seems thus to be a feasible approximation for the maximum rate of heat release in a burning electronic cabinet.

50
0
20
40
60
80
100
120
140
RH
R (k
W)
0 50 100 150 200 Time (min)
Experiment
Model
Experiment 3
0
50
100
150
200
250
300
350
RH
R (k
W)
0 50 100 150 200 Time (min)
Experiment 6B
Model
Experiment
0
10
20
30
40
50
RH
R (k
W)
0 10 20 30 40 50 Time (min)
Experiment 7
Model
Experiment
0
10
20
30
40
50
RH
R (k
W)
0 10 20 30 40 50 Time (min)
Experiment 8
Model
Experiment
0
10
20
30
40
50
RH
R (k
W)
0 10 20 30 40 Time (min)
Experiment 9
Model
Experiment0
10
20
30
40
50
RH
R (k
W)
0 10 20 30 40 50 Time (min)
Experiment 10
Model
Experiment
Figure 11. Experimental RHR curves and maximum RHR curves predicted by model (equation (21)). 3 and 6B are real cabinet and 7 to 10 are mock-up cabinet experiments. Time intervals chosen for comparison of maximum experimental RHR with model (Table 2 of Paper V) are indicated with vertical dashed lines.
The temperature dependence of Equation (21) was found to be weak (Figure 2 of Paper V), allowing use of average temperatures. Substituting constants and average temperatures from experiments (Table 2 of Paper V), assuming orifice discharge coefficient C = 0.6 (Emmons 1988) for both entrance and exit vents,
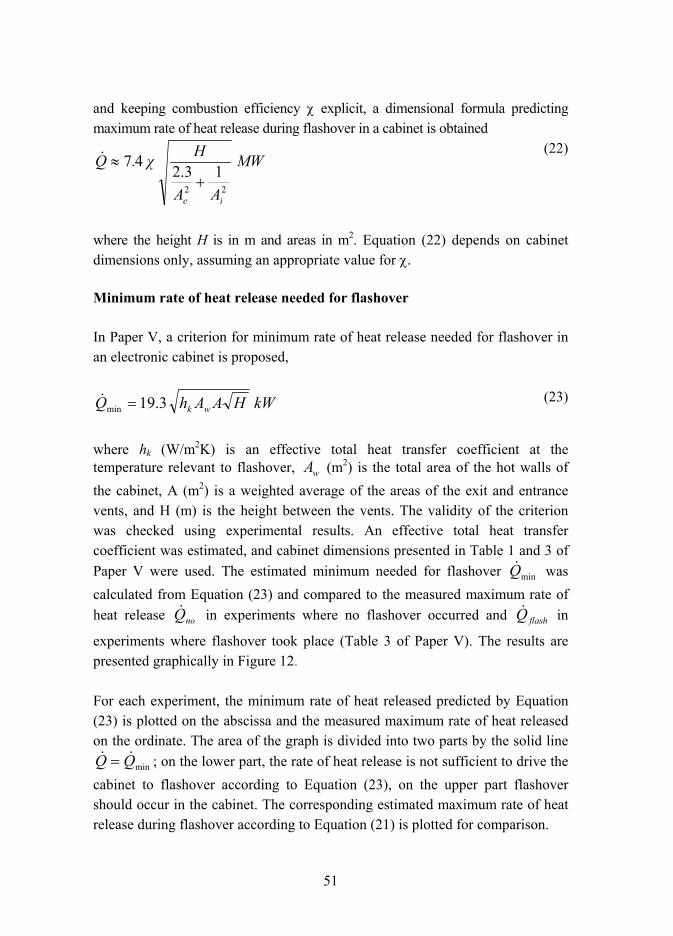
51
and keeping combustion efficiency χ explicit, a dimensional formula predicting maximum rate of heat release during flashover in a cabinet is obtained
MW
AA
Hχ.Q
ie22
13.247
+≈&
(22)
where the height H is in m and areas in m2. Equation (22) depends on cabinet dimensions only, assuming an appropriate value for χ.
Minimum rate of heat release needed for flashover
In Paper V, a criterion for minimum rate of heat release needed for flashover in an electronic cabinet is proposed,
kWHAAhQ wk3.19min =& (23)
where hk (W/m2K) is an effective total heat transfer coefficient at the temperature relevant to flashover, Aw (m2) is the total area of the hot walls of the cabinet, A (m2) is a weighted average of the areas of the exit and entrance vents, and H (m) is the height between the vents. The validity of the criterion was checked using experimental results. An effective total heat transfer coefficient was estimated, and cabinet dimensions presented in Table 1 and 3 of Paper V were used. The estimated minimum needed for flashover minQ& was calculated from Equation (23) and compared to the measured maximum rate of heat release noQ& in experiments where no flashover occurred and flashQ& in
experiments where flashover took place (Table 3 of Paper V). The results are presented graphically in Figure 12.
For each experiment, the minimum rate of heat released predicted by Equation (23) is plotted on the abscissa and the measured maximum rate of heat released on the ordinate. The area of the graph is divided into two parts by the solid line
minQQ && = ; on the lower part, the rate of heat release is not sufficient to drive the cabinet to flashover according to Equation (23), on the upper part flashover should occur in the cabinet. The corresponding estimated maximum rate of heat release during flashover according to Equation (21) is plotted for comparison.

52
Figure 12. Check of flashover criterion (Equation (23)) using experimental data, calculated minQ& on horizontal, and measured maximum rate of heat releaseQ& on vertical axis. The solid line divides the chart into two; the lower area corresponds to predictions of no flashover and the upper area to predictions of flashover. Experimental results for flashover flashQ& and no flashover noQ& are
plotted together with estimated maximum rate of heat release maxQ& (Equation
(21)).
All data presented in Figure 12 fulfil the condition for flashover proposed by Equation (23). The amount of cabinet data is however small, and the range considered here is not extensive enough to draw final conclusions. The most approximate parameters in Equation (23) are the temperature dependent heat transfer coefficients in hk. Choosing appropriate heat transfer coefficients valid on the average for the wall, Equation (23) gives an estimate for the minimum rate of heat release sufficient for flashover in an electric cabinet.
53
5. Conclusions This thesis considers the fire behaviour of passenger cars, electronic cabinets, and electrical ignition sources. Full-scale experiments have been carried out on passenger cars and electronic cabinets, producing new information on the fire development of the present subject. Models have been proposed to describe fire behaviour and the validity of the models has been checked against experimental results.
Rate of heat release and other quantities as a function of time have been measured in car fire experiments. A car burning in an open environment can be characterised as a local fire with distinct fire plumes coming out from the openings of the car. This has been utilised in parametrisation of the rate of heat release curves, represented by superposition of one Boltzmann curve and three symmetrical Gaussian curves. The car fire is modelled with two fire plumes emerging from the centre of the windscreen and from the centre of the rear window. Alpert's equations for maximum ceiling jet temperatures are applied on the model plume rate of heat release to calculate gas temperatures above the burning car. The resulted gas temperatures are consistent with the corresponding measured temperatures from the car fire experiments. The proposed model can be used in design calculations for open car parks.
Cars differing in materials or construction also differ in fire behaviour, as shown in section 4.1. Applying the principles presented here, up-to-date information related to changes in car manufacturing can be obtained. The parametrisation presented provides the possibility to take this into account by adjusting the positions, heights and widths of the curves to make the integral of the model rate of heat release curve equal to the fire load of the car.
Electrical ignition phenomena are described using fire statistics, modelling and experimental methods. Generally, short circuits, ground shorts and arcing in cables, as well as loose connections leading to overheating are common causes of electrical ignitions. A rough indication is found, that power cables in nuclear power plants have eight times higher ignition probability per plant, and 40 times higher probability per cable length than control cables. Models for temperature rise in a loose contact, and in an overheated cable are proposed, and concluded that of these two, the loose contact is more likely a source of electrical ignition.
54
Experiments on electrical components heavily overloaded indicate that generally, the overload did not lead to ignition of the component or adjacent material. Power transistors mounted on printed circuit boards were the only components able to ignite the board.
Full and reduced scale fire experiments on electronic cabinets with different contents have been performed, giving measured information about rate of heat release, mass loss and rate of mass loss, smoke (carbon), carbon monoxide and carbon dioxide production rate, and gas and wall temperatures as a function of time. Maximum rate of heat release for real cabinets was 100350 kW when flashover occurred in the cabinet and 50 kW when the fire remained local in the cabinet. The potential rate of heat release bound in carbon (smoke) and carbon monoxide production as a result of incomplete combustion was determined from measured production rates and reaction equations. It was found to be considerable, 1050% of the actual rate of heat release during the intense phase of the fire.
The key role of ventilation conditions was evident. The mechanical properties of the cabinet, such as door locking mechanism, seem to be important for prevention of spread of fire. To reduce the intensity of fire, designing the cabinet to be robust enough to prevent additional openings, e.g. gaps in the walls due to thermal stresses is important.
The minimum power and energy needed for igniting a vertical bundle of cables with polyvinyl chloride jacket and insulation were 500 W and 150 kJ, which was sufficient to achieve sustained burning leading to flashover in the cabinet. For thicker and tightly bundled cables higher ignition powers and energies were needed, 2.5 kW and 1.2 MJ.
Parameters for parabolic fire growth and exponential fire decay of an electronic cabinet have been determined for fits on measured rate of heat release curves. The fire development was slow after ignition according to ISO/TR 13387-2 (1999) classification.
Fire spread to adjacent cabinets is possible, as the separating walls will heat. Times for fire spread to an adjoining cabinet was determined to be 1116 min, and the first item to ignite was a cable attached to the separating wall. If gaps or

55
openings occur in the cabinet structure, flames coming out from the openings may ignite nearby combustible material. Cables in a cabinet at 1 m distance did not ignite, and flame spread across a corridor is unlikely as a direct heat transfer process. Ignition is possible via the hot gas layer beneath the ceiling when the fire has grown big enough, or through molten plastic flowing across the corridor.
A model for maximum rate of heat release in an electronic cabinet fire has been proposed, and checked against measured data. It seems to describe the main features of a burning cabinet, and to be insensitive to changes in many parameters relating to the cabinet. A dimensional formula is thus presented for maximum rate of heat release, depending on cabinet dimensions only. An analytical criterion for estimating minimum rate of heat release needed to flashover in a cabinet is proposed and checked against available experimental data, showing the criterion to be usable.
The results of the cabinet study can be used in safety assessment of fires originating in an electronic cabinet, e.g. estimating fire size, or as energy release input data in fire development calculations on control rooms in process plants and other spaces containing electronic cabinets. Care should still be taken in evaluation of fire behaviour of cabinets differing in ventilation conditions, cabinet structure and contents.
Altogether, the research presented in this thesis gives new information concerning the fire behaviour of passenger cars, electronic cabinets and electrical ignition sources, essential for estimating fire safety of these subjects and structures containing them.

56
References Ahonen, A.I., Holmlund, C. & Kokkala, M.A. 1987. Effects of ignition source in room fire tests. Fire Science & Technology, Vol. 7, No. 1, pp. 113.
Alpert, R.L. 1972. Calculation of response time of ceiling-mounted detectors. Fire Technology, Vol. 8, No. 3, pp. 181195.
ANSI/MC96.1-1982. 1982. Temperature measurement thermocouples. Research Triangle Park: Instrument Society of America. 47 p. + app. 41 p.
Atkins, P.W. 1982. Physical chemistry. Second Edition. Oxford: Oxford University Press. 1095 p.
Axelsson, J., Andersson, P., Lönnermark, A., Van Hees, P. & Wetterlund, I. 2001. Uncertainties in measuring heat and smoke release rates in the Room/Corner test and the SBI. Borås: Swedish National Testing and Research Institute. 41 p. (SP report 2001:04).
Babrauskas, V. 1992. Related quantities (a) Heat of combustion and potential heat. In: Babrauskas, V. & Grayson, S.J. Heat release in fires. London: Elsevier Applied Science. Pp. 207223.
Babrauskas, V. 2001. How do electrical wiring faults lead to structure ignitions? Proceedings of Fire and Materials 2001, 7th International Conference and Exhibition, January 2224, 2001. Interscience Communications Limited. Pp. 3951.
Babrauskas, V. & Peacock, R.D. 1992. Heat release rate: The single most important variable in fire hazard. Fire Safety Journal, Vol. 18, No. 3, pp. 255272.
Bennetts, I.D., Proe, D.J., Lewins, R. & Thomas, I.R. 1985. Open-Deck Car Park Fire Tests. BHP Melb. Res. Lab. Rep. No. MRL/PS69/85/001. 24 p.

57
Beyler, C.L. & Hirschler, M.M. 1995. Thermal decomposition of polymers. In: DiNenno, P.J., Beyler, C.L., Custer, R.L.P., Walton, W.D., Watts, J.M. Jr., Drysdale, D. & Hall, J.R. Jr. (eds.). SFPE Handbook of Fire Protection Engineering. Second Edition. Quincy: National Fire Protection Association. Pp. 1-991-119.
Butcher, E. G., Langdon-Thomas, G. J. & Bedford, G. K. 1968. Fire and car-park buildings. Fire Note No 10. London: HMSO. 24 p.
Chavez, J.M. 1987. An experimental investigation of internally ignited fires in nuclear power plant control cabinets: Part 1: Cabinet effects tests. Albuquerque: Sandia National Laboratories. 104 p. (NUREG/CR-4527, SAND86-0336)
Cox, G. 1995. Compartment fire modelling. In: Cox, G. (ed.). Combustion fundamentals of fire. London: Academic Press. Pp. 329404.
Dahlberg, M. 1994. Error analysis for rate of heat release rate measurement with the SP industry calorimeter. Borås: Swedish National Testing and Research Institute. 21 p. + app. 10 p. (SP report 1994:29).
DiNenno, P.J., Beyler, C.L., Custer, R.L.P., Walton, W.D., Watts, J.M. Jr., Drysdale, D. & Hall, J.R. Jr. (eds.). 1995. SFPE Handbook of Fire Protection Engineering. Second Edition. Quincy, Mass: National Fire Protection Association. 1193 p.
Dobbins, R.A., Mulholland, G.W. & Bryner, N.P. 1994. Comparison of fractal smoke optics model with light extinction measurements. Atmospheric Environment, Vol. 28, No. 5, pp. 889897.
Drysdale, D. 1999. An introduction to fire dynamics. Second edition. Chichester: Wiley. 451 p.
ECCS. 1993. European Convention for Constructional Steelwork, Technical Committee 3. Fire Safety in Open Car Parks Modern fire engineering. Technical Note No 75. Brussel: ECCS. 99 p.
58
Emmons, H.W. 1988. Vent flows. In: DiNenno, P.J., Beyler, C.L., Walton, W.D., Custer, R.L.P. & Watts, J.M. Jr. (eds.). SFPE Handbook of Fire Protection Engineering, First Edition. Quincy: National Fire Protection Association. Pp. 1-1301-137.
EN 13823. 2002. Reaction to fire tests for building products − Building products excluding floorings exposed to the thermal attack by a single burning item. Brussels: European Committee for Standarization. 95 p.
Evans, D.D. 1995. Ceiling jet flows. In: DiNenno, P.J., Beyler, C.L., Custer, R.L.P., Walton, W.D., Watts, J.M. Jr., Drysdale, D. & Hall, J.R. Jr. (eds.). SFPE Handbook of Fire Protection Engineering. Second Edition. Quincy: National Fire Protection Association. Pp. 2-322-39.
Gewain, R.G. 1973. Fire experience and fire tests in automobile parking structures. Fire Journal, Vol. 67, No. 4, pp. 5054.
Heskestad, G. & Delichatsios, M.A. 1978. The initial convective flow in fire. 17th Symposium on Combustion. Pittsburgh: The Combustion Institute. Pp. 11131124.
Huggett, C. 1980. Estimation of heat release by means of oxygen consumption measurements. Fire and Materials, Vol. 4, No. 2, pp. 6165.
IAEA. 1997. Advanced Incident Reporting System (AIRS) Database, October 1997 release of version 1.1. Vienna: International Atomic Energy Agency IAEA. CD-ROM.
ISO 5660-1. 2002. Reaction-to-fire tests − Heat release, smoke production and mass loss rate − Part 1: Heat release rate (cone calorimeter method). Geneva: International Organization for Standardization. 39 p.
ISO 9705. 1993. Fire tests − Full-scale room test for surface products. Geneva: International Organization for Standardization. 31 p.
ISO 13943. 2000. Fire safety Vocabulary. Geneva: International Organization for Standardization. 45 p.

59
ISO/TR 13387-2. 1999. Fire safety engineering Part 2: Design fire scenarios and design fires. Geneva: International Organization for Standardisation. 17 p.
Janssens, M.L. 1991. Measuring rate of heat release by oxygen consumption. Fire Technology, Vol. 27, No. 3, pp. 234249.
Keski-Rahkonen, O. 1993. Design fire construction for individual assessment. In: Twilt, L. (ed.). 3rd CIB/W14 Workshop "Modelling", 2526 January 1993, Proceedings. Rijswijk: TNO Building and Construction Research. Pp. 4348.
Keski-Rahkonen, O., Björkman, J. & Farin, J. 1997. Derating of cables at high temperatures. Espoo: Technical Research Centre of Finland. 57 p. + app. 2 p. (VTT Publications 302.)
Keski-Rahkonen, O. & Hostikka, S. 1999. Theory versus experiment Did you forget design of experiment and data reduction? In: Structural Mechanics in Reactor Technology 15, Post Conference Seminar No. 6, Fire Safety in Nuclear Power Plants and Installations, MunichGarching, Germany, 67 September, 1999. [CD-ROM]. MunichGarching: Gesellschaft für Anlagen- und Reaktor-sicherheit. 21 p.
Keski-Rahkonen, O., Mangs, J. & Turtola, A. 1999. Ignition of and fire spread on cables and electronic components. Espoo: Technical Research Centre of Finland. 102 p. + app. 10 p. (VTT Publications 387.)
Kitano, T., Sugawa, O., Masuda, H., Ave, T. & Uesugi, H. 2000. Large scale fire tests of 4-story type car park. Part 1. The behavior of structural frame exposed to the fire at the deepest part of the first floor. In: Yamada, T. (ed.). Proceedings of the 4th AsiaOceania Symposium on Fire Science and Technology. Co-Organized by May 2426, 2000, Tokyo, Japan. Tokyo: AsiaOceania Association for Fire Science and Technology and Japan Association for Fire Science and Engineering. Pp. 527538.
Krause, R.F. Jr. & Gann, R.G. 1980. Rate of heat release measurements using oxygen consumption. J. Fire and Flammability, Vol. 12, No. 2, pp. 117130.

60
Krishnan, S.S., Farias, T.L., Wu, J.-S., Köylü, Ü.Ö. & Faeth, G.M. 1999. Mixing and radiation properties of buoyant luminous flame environments. Part 2. Structure and optical properties of soot. Gaithersburg: National Institute of Standards and Technology. 119 p. (NIST GCR 99-770.)
Kruppa, J., Joyeux, D. & Zhao, B. 1998. Evaluation of the fire resistance of a car park structure based on experimental evidences. In: Proceedings of Second International Conference on Fire Research and Engineering (ICFRE2). Gaithersburg, MD, 38, August 1997. Beteshda, MD: Society of Fire Protection Engineers. Pp. 416426.
Medtherm Bulletin 118. 1992. 64 Series heat flux transducers for the direct measurement of heat transfer rates. Medtherm Corporation. Bulletin 118. 4 p.
Moffat, R.J. 1962. Gas temperature measurements. In: Dahl, A.I. (ed.). Temperature. Its measurement and control in science and industry. Vol. 3, Part 2. New York: Reinhold. Pp. 553571.
Mulholland, G.W. 1995. Smoke production and properties. In: DiNenno, P.J., Beyler, C.L., Custer, R.L.P., Walton, W.D., Watts, J.M. Jr., Drysdale, D. & Hall, J.R. Jr. (eds.). SFPE Handbook of Fire Protection Engineering. Second Edition. Quincy: National Fire Protection Association. Pp. 2-2172-227.
Mulholland, G.W. & Croarkin, C. 2000. Specific extinction coefficient of flame generated smoke. Fire and Materials, Vol. 24, No. 5, pp. 227230.
National Building Code of Finland E4. 1997. Suomen rakentamismääräys-kokoelma E4 Autosuojien paloturvallisuus, ohjeet (Fire safety of car shelters, instructions). Helsinki: Ministry of the Environment. 5 p. (In Finnish.)
OECD/NEA. 2000. State-of-the-art-report: Fire risk analysis, fire simulation, fire spreading and impact of smoke and heat on instrumentation electronics. Le Seine St-Germain: OECD Nuclear Energy Agency, NEA/CSNI/R(99)27. 99 p.
Parker, W.J. 1982. Calculations of the heat release rate by oxygen consumption for various applications. Gaithersburg: National Bureau of Standards. 41 p. (NBSIR 81-2427.)

61
Parker, W.J. 1984 Calculations of the heat release rate by oxygen consumption for various applications. J. Fire Sci., Vol. 2, No. 5, pp. 380395.
Peacock, R.P. & Babrauskas, V. 1991. Analysis of large-scale fire test data. Fire Safety Journal, Vol. 17, No. 5, pp. 387414.
Quintiere, J.G. 1995. Compartment fire modeling. In: DiNenno, P.J., Beyler, C.L., Custer, R.L.P., Walton, W.D., Watts, J.M. Jr., Drysdale, D. & Hall, J.R. Jr. (eds.). SFPE Handbook of Fire Protection Engineering. Second Edition. Quincy: National Fire Protection Association. Pp. 3-1253-133.
Shipp, M. & Spearpoint, M. 1995. Measurements of the severity of fires involving private motor vehicles. Fire and Materials, Vol. 19, No. 3, pp. 143151.
Steinert, C. 1999. Feuerübersprung und Abbrandverhalten von Personen-kraftwagen Tl. 1. Stuttgart: Fraunhofer IRB Verlag. 82 p. + app. 110 p. (Bauforschung Heft T2876)
Steinert, C. 2000a. Feuerübersprung und Abbrandverhalten von Personen-kraftwagen Tl. 2. Stuttgart: Fraunhofer IRB Verlag. 95 p. + app. 172 p. (Bauforschung Heft T2934)
Steinert, C. 2000b. Experimentelle Untersuchungen zum Abbrand- und Feuerübersprungsverhalten von Personenkraftwagen. vfbd-Zeitschrift, Vol. 49, No. 4, pp. 163172.
Tanaka, T. 1983. A model of multiroom fire spread. Fire Science and Technology, Vol. 3, No. 2, pp. 105121.
Tewarson, A. 1980. Heat release in fires. Fire and Materials, Vol. 4, No. 4, pp. 185191.
Tewarson, A. 1995. Generation of heat and chemical compunds in fires. In: DiNenno, P.J., Beyler, C.L., Custer, R.L.P., Walton, W.D., Watts, J.M. Jr., Drysdale, D. & Hall, J.R. Jr. (eds.). SFPE Handbook of Fire Protection Engineering. Second Edition. Quincy: National Fire Protection Association. Pp. 3-533-124.

62
Tewarson, A., Abu-Isa, I.A., Cummings, D.R. & LaDue, D.E. 2000. Characterization of the ignition behavior of polymers commonly used in the automotive industry. In: Curtat, M. (ed.). Fire Safety Science Proceedings of the sixth International Symposium. Poitiers, France, 59 July 1999. Poitiers: Aubin Imprimeur. Pp. 9911002.
Thornton, W.M. 1917. The relation of oxygen to the heat of combustion of organic compounds. Philosophical Magazine and Journal of Science, Vol. 33, No. 194, pp. 196203.
Troitzsch, J. 1990. International plastics flammability handbook: principles-regulations-testing and approval. 2nd ed. Munich: Hanser Publishers. 517 p. ISBN 3-446-15156-7
Wu, J.-S., Krishnan, S.S. & Faeth, G.M. 1997. Refractive indices at visible wavelengths of soot emitted from buoyant turbulent diffusion flames. Transactions of the ASME, Vol. 119, pp. 230237.
Yeager, R.W. 1986. Uncertainty analysis of energy release rate measurement for room fires. J. Fire Sciences, Vol. 4, No. 4, pp. 276296.
Zhao, B. 2001. Numerical modelling of structural behavior of open car parks under natural fire. In: Interflam '2001. Proceedings of the 9th international conference, volume 1. Edinburgh, Scotland, 1719 September 2001. London: Interscience Communications Ltd. Pp. 383393.
Appendices of this publication are not included in the PDF version. Please order the printed version to get the complete publication (http://www.vtt.fi/inf/pdf/)

Published by
Vuorimiehentie 5, P.O.Box 2000, FIN02044 VTT, Finland Phone internat. +358 9 4561 Fax +358 9 456 4374
Series title, number and report code of publication
VTT Publications 521 VTTPUBS521
Author(s) Mangs, Johan
Title
On the fire dynamics of vehicles and electrical equipment
Abstract The fire behaviour of passenger cars, electronic cabinets, and electrical ignition sources has been studied by experimental, modelling and statistical methods. Full-scale fire experiments on ordinary medium-size passenger cars, and full and reduced scale experiments on electronic cabinets are presented. Rate of heat release, mass loss and rate of mass loss, heat flux, carbon monoxide, carbon dioxide and smoke production rates, gas and surface temperatures were determined as a function of time. The experimental rate of heat release curves from the cars were parametrised, and the car fire was modelled by two fire plumes. Ignition power and energy sufficient for sustained burning, and fire growth rate after ignition in an electronic cabinet were determined. The effect of the cabinet fire on an adjacent cabinet and a cabinet 1 m apart was studied, and times to ignition of cables in the adjacent cabinet were estimated. The potential rate of heat release bound in carbon (smoke) and carbon monoxide production due to incomplete combustion was determined. A model for estimating the maximum rate of heat release in an electronic cabinet is proposed. An analytic formula is suggested to estimate the minimum rate of heat release needed for flashover in an electronic cabinet. Electrical ignitions of fires were studied by analysing statistical information from incident reports, by modelling the most frequent physical ignition mechanisms, and by experiments on some scenarios. The research presented gives new quantitative information on variables essential for estimating fire safety of these subjects and structures relating to them.
Keywords fire safety, fire experiments, fire development, ignition, fire growth, car fires, electronic cabinets, electric devices, cables, energy release, fire effluents, incomplete combustion
Activity unit VTT Building and Transport, Kivimiehentie 4, P.O. Box 1803, FIN-02044 VTT, Finland
ISBN Project number 9513862739 (soft back ed.) 9513862747 (URL:http://www.vtt.fi/inf/pdf/ )
Date Language Pages Price April 2004 English 62 p. + app. 101 p. D
Name of project Commissioned by
Series title and ISSN Sold by VTT Publications 12350621 (soft back ed.) 14550849 (URL: http://www.vtt.fi/inf/pdf/)
VTT Information Service P.O.Box 2000, FIN02044 VTT, Finland Phone internat. +358 9 456 4404 Fax +358 9 456 4374

VTT PU
BLICATIO
NS 521
On the fire dynam
ics of vehicles and electrical equipment
Johan Mangs
Tätä julkaisua myy Denna publikation säljs av This publication is available from
VTT TIETOPALVELU VTT INFORMATIONSTJÄNST VTT INFORMATION SERVICEPL 2000 PB 2000 P.O.Box 2000
02044 VTT 02044 VTT FIN–02044 VTT, FinlandPuh. (09) 456 4404 Tel. (09) 456 4404 Phone internat. +358 9 456 4404Faksi (09) 456 4374 Fax (09) 456 4374 Fax +358 9 456 4374
ISBN 951–38–6273–9 (soft back ed.) ISBN 951–38–6274–7 (URL: http://www.vtt.fi/inf/pdf/)ISSN 1235–0621 (soft back ed.) ISSN 1455–0849 (URL: http://www.vtt.fi/inf/pdf/)
ESPOO 2004ESPOO 2004ESPOO 2004ESPOO 2004ESPOO 2004 VTT PUBLICATIONS 521
Johan Mangs
On the fire dynamics of vehiclesand electrical equipment
The fire behaviour of passenger cars, electronic cabinets, and electricalignition sources has been studied by experimental, modelling and statisticalmethods. Full-scale fire experiments on ordinary medium-size passengercars, and full and reduced scale experiments on electronic cabinets arepresented. Rate of heat release, mass loss and rate of mass loss, heat flux,carbon monoxide, carbon dioxide and smoke production rates, gas andsurface temperatures were determined as a function of time. The experimen-tal rate of heat release curves from the cars were parametrised, and the carfire was modelled by two fire plumes. Ignition power and energy sufficientfor sustained burning, and fire growth rate after ignition in an electroniccabinet were determined. The effect of the cabinet fire on an adjacent cabinetand a cabinet 1 m apart was studied, and times to ignition of cables in theadjacent cabinet were estimated. The potential rate of heat release bound incarbon (smoke) and carbon monoxide production due to incompletecombustion was determined. A model for estimating the maximum rate ofheat release in an electronic cabinet is proposed. An analytic formula issuggested to estimate the minimum rate of heat release needed for flashoverin an electronic cabinet. Electrical ignitions of fires were studied byanalysing statistical information from incident reports, by modelling themost frequent physical ignition mechanisms, and by experiments on somescenarios. The research presented gives new quantitative information onvariables essential for estimating fire safety of these subjects and structuresrelating to them.