on the fairness of return channel capacity allocation in dvb-rcs...
TRANSCRIPT

INTERNATIONAL JOURNAL OF SATELLITE COMMUNICATIONS AND NETWORKING
Int. J. Satell. Commun. Network. 2011; 29:163–184Published online 9 April 2010 in Wiley Online Library (wileyonlinelibrary.com). DOI: 10.1002/sat.959
On the fairness of return channel capacity allocationin DVB-RCS-based satellite networks
P. Chatziparaskevas�,y, G. Koltsidas and F.-N. Pavlidou
Department of Electrical and Computer Engineering, Aristotle University of Thessaloniki, Panepistimioupolis,54124 Thessaloniki, Greece
SUMMARY
Broadband satellite access (BSA) systems can form an alternative path for the provision of Internet accessin areas with poor network infrastructure. The DVB-RCS standard introduced the specifications of aninteraction channel for two-way BSA networks. In this study, a new dynamic scheduling strategy for theinteraction channel of GEO satellite networks is proposed, evaluated and compared with a typical RoundRobin scheme. The main idea of the proposed strategy is to change, prior to each allocation, the sequenceaccording to which bandwidth is assigned to the satellite terminals. The new sequence is fully specified by aset of fairness indices, each one related to a unique terminal and updated after each allocation. Along withthe examined scheduling strategies, two capacity request calculation techniques found in the literature arealso evaluated and compared through a series of simulations. Copyright r 2010 John Wiley & Sons, Ltd.
Received 10 July 2008; Revised 1 October 2009; Accepted 2 October 2009
KEY WORDS: DVB-RCS; DCA; QoS; capacity allocation; capacity requests; fairness
1. INTRODUCTION
Interactivity is a key issue in modern telecommunication networks even in traditionaldistribution services like TV or radio [1]. Modern satellite services require two-way interactiveconnections. The DVB-RCS (Digital Video Broadcasting–Return Channel via Satellite)standard [2], published by the European Telecommunications Standards Institute, defines theair interface specification of the interaction channel of two-way broadband satellite access(BSA) systems. The standard defines the mechanisms for the provision of a full range of modernapplications such as Internet browsing, e-mail, VoIP and video conference via satellite. The BSAnetwork gives also the possibility of integrating satellite networks into the traditional terrestrialtelecommunications infrastructure where the IP protocol is dominant. Moreover, as real timeand multimedia applications are gaining popularity, it must be capable of providing end-to-endquality of service (QoS) for traffic with strict demands on jitter, delay and packet loss rate [3].The DVB-RCS standard also defines specific mechanisms for QoS provision that can cooperatewith the respective QoS architecture of IP networks.
Furthermore, given a limited return channel capacity, the link utilization must be optimizedto serve as many users as possible. Dynamic capacity allocation (DCA) mechanisms defined inthe DVB-RCS standard can ensure QoS provision for bursty traffic generated by the Return
*Correspondence to: P. Chatziparaskeyas, Department of Electrical and Computer Engineering, Aristotle University ofThessaloniki, Panepistimioupolis, 54124 Thessaloniki, Greece.yE-mail: [email protected]
Contract/grant sponsor: European Satellite Communications Network of Excellence (SatNEx II)
Copyright r 2010 John Wiley & Sons, Ltd.
Channel Satellite Terminals (RCSTs). In this study, we consider the CF-DAMA (CombinedFree–Demand Assignment Multiple Access) protocol as the DCA mechanism that regulatesreturn channel access. According to CF-DAMA, capacity is allocated primarily on a requestbasis and afterwards freely among the terminals. Forward channel traffic (towards the RCSTs),which tends to be smooth, is served by a static TDM scheme according to the DVB-S2 standard[4]. In order for the system to perform, capacity must be fairly allocated so that no end user isfavoured, unless it has paid for extra fixed capacity. Moreover, capacity requests must beaccurate to maximize link utilization and minimize the unused capacity.
This study therefore focuses on two issues. The first is the fairness of the capacity allocationprocess. We propose a new allocation algorithm that treats terminal capacity requests in anintuitively fair way. The criterion for a terminal to receive priority in bandwidth allocation ishow well its requests were satisfied during the previous allocation process. Terminals with smallrequest satisfaction degree should receive priority at the next allocation. The objective is toassign each time the maximum possible amount of the requested capacity without havingterminals that monopolize the channel. To evaluate the performance of the proposed scheme, itis compared with the static round robin (RR) scheme used in [5] in terms of fairness and queuingdelay. The second issue addressed is the capacity request calculation technique, which isimportant for the allocation process to perform. Two request schemes found in the literature areevaluated for both the allocation algorithms.
The rest of the article is organized as follows: in Section 2, we describe the basic BSA networkarchitecture along with the MF-TDMA (Multi Frequency–Time Division Multiple Access)scheme, the CF-DAMA protocol and the network Differentiated Services (DiffServ)mechanisms. In Section 3, we present the satellite terminal architecture that was employedfor the simulation of the BSA network. Section 4 focuses on the capacity request calculationmethods, while Section 5 is dedicated to the proposed DCA algorithm and its mechanisms. InSection 6, we discuss details regarding the simulation, such as the traffic models used and thetraffic Scenarios simulated. In addition, simulation results for the performance metrics areillustrated and analysed. Finally, we state some general conclusions on the issues investigated aswell as some ideas about future work in this field.
2. BSA SYSTEM
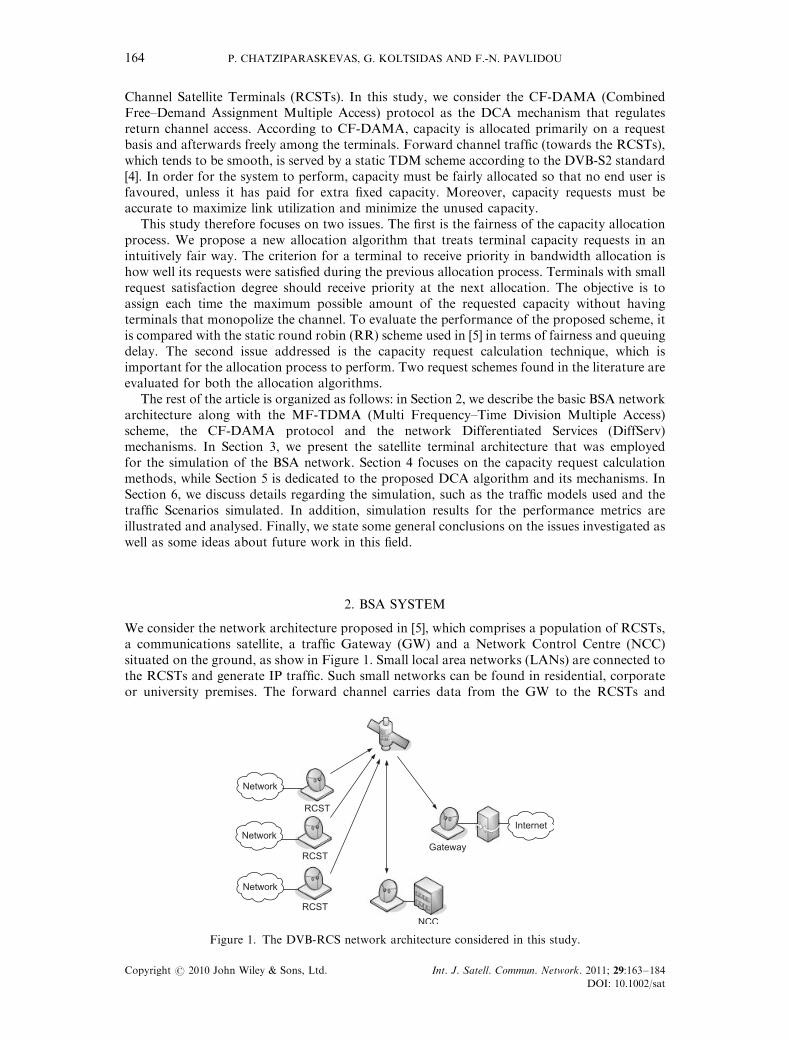
We consider the network architecture proposed in [5], which comprises a population of RCSTs,a communications satellite, a traffic Gateway (GW) and a Network Control Centre (NCC)situated on the ground, as show in Figure 1. Small local area networks (LANs) are connected tothe RCSTs and generate IP traffic. Such small networks can be found in residential, corporateor university premises. The forward channel carries data from the GW to the RCSTs and
Figure 1. The DVB-RCS network architecture considered in this study.
P. CHATZIPARASKEVAS, G. KOLTSIDAS AND F.-N. PAVLIDOU164
Copyright r 2010 John Wiley & Sons, Ltd. Int. J. Satell. Commun. Network. 2011; 29:163–184
DOI: 10.1002/sat

signalling information from the NCC to the RCSTs. The traffic from the RCSTs to the GW istransmitted through the return channel.
The DVB-RCS standard defines the MF-TDMA as the multiple access scheme. Thiscombined-access scheme is a variant of TDMA that allows a group of RCSTs to communicatewith a GW using a set of carrier frequencies. Capacity is organized in frames consisting of anumber of time slots on a number of carriers. A number of consecutive frames make up asuperframe, the duration of which equals to the capacity allocation period. Frames may be fixedor dynamic, i.e. their composition varies over time. Examples of fixed frame compositions areprovided in the DVB-RCS guidelines document [6]. In this study, we consider the case of fixedframes with eight carriers and a duration of 26.5ms. Each carrier is divided into 26 traffic slotdurations, 24 of which are used for transmitting traffic (TRF) bursts that carry useful data, andthe remaining 2 can be used for transmitting 4 synchronization (SYNC) bursts that carry controlinformation. Each burst is surrounded by a guard time that allows for RCST power switch-offtransient and system timing errors. Each TRF burst carries one ATM cell (53 bytes) resulting in amaximum transmission rate per carrier of 384 kbits/s and a total uplink capacity of 3072kbits/s.
The CF-DAMA protocol specifies that return channel capacity is assigned to the RCSTs inresponse to capacity requests sent periodically in SYNC bursts. If all requests are satisfied andthere is still capacity left, it is allocated freely among the RCSTs. The request–allocation processis subject to a delay called scheduling lag. The scheduling lag (Equation (1)) includes thepropagation times on the forward link (Tpfwd) and return link (Tprtn), the processing times inthe RCSTs and the NCC as well as a latency introduced to ensure that all the RCSTs haveproperly received the Terminal Burst Time Plan (TBTP).
Scheduling lag ¼ Tpfwd1Tprtn1Processing time1Safe frame period ð1Þ
The TBTP message is the NCC response to the terminal requests. It contains the allocationplan of frame slots to the RCSTs for the next superframe and is periodically transmitted everysuperframe via the forward channel. The TBTP transmission is subject to the same propagationdelay (Tpfwd 5Tprtn) experienced by capacity requests on their way to the NCC.
The DVB-RCS standard defines five capacity categories that can serve traffic with variousrequirements:
� Continuous rate assignment (CRA) is the rate capacity negotiated directly between theterminal and the NCC at the beginning of a connection and assigned in full throughoutthe entire connection.
� Rate-based dynamic capacity (RBDC) is the rate capacity assigned after explicit requestsin terms of slots per frame. Each request overrides all the previous requests from the sameterminal and is subject to a maximum guaranteed rate limit negotiated between theterminal and the NCC. In this study, the maximum number of RBDC slots is consideredequal for all the RCSTs and calculated by Equation (2):
RBDCmax ¼nTRF � nCRA
N
j kð2Þ
where nTRF is the number of traffic slots per frame, nCRA the number of CRA slots perframe and N the number of terminals logged in the system. In case a terminal requestexceeds the value of RBDCmax, it is assigned RBDCmax slots, while the amount in excess isadded to the volume-based dynamic capacity (VBDC) capacity required. RBDC requestsare valid for a certain period of time. If this time elapses without any new requesttransmitted by the corresponding RCST, it is no longer assigned RBDC slots.
� VBDC is the volume capacity assigned after explicit requests, which are cumulative,meaning that new requests are added to the old ones. The cumulated capacity isdecremented by the amount of VBDC slots assigned during each allocation process.
� Absolute volume-based dynamic capacity (AVBDC) is also volume capacity and differsfrom VBDC in that new AVBDC requests override the previous ones that come from thesame terminal. This capacity category was not used in this study.
FAIR RESOURCE ALLOCATION IN DVB-RCS NETWORKS 165
Copyright r 2010 John Wiley & Sons, Ltd. Int. J. Satell. Commun. Network. 2011; 29:163–184
DOI: 10.1002/sat
� Free capacity assignment (FCA) involves the remaining capacity after the satisfaction ofall the terminal requests. No traffic should be exclusively mapped to FCA, as itsavailability is highly variable. Typically, it is bonus capacity granted to the terminals andcan be used as supplement to improve traffic delay and jitter.
CRA and maximum RBDC capacity are guaranteed for every RCST. Thus, Relation (3)should be satisfied during every capacity allocation round:X
CRA1RBDCmaxpTotal return channel capacity ð3Þ
To provide QoS for IP traffic, the BSA network needs to be compatible with the DiffServarchitecture. The DiffServ architecture [7] defines mechanisms that classify and mark packetsbelonging to a specific class of traffic. Packets are then forwarded according to priority policiescalled per-hop behaviours (PHBs) that define the packet forwarding properties associated withits class of traffic. There are three main PHBs:
� Default PHB (DE) which is typically best-effort traffic.� Expedited forwarding (EF) PHB which is used for low-loss, low-latency and low-jitter
traffic generated mainly by real-time services.� Assured forwarding (AF) behaviour group which defines four separate AF classes. Within
each class, packets are given a-drop precedence (high, medium or low). The AF PHBgroup is suitable for TCA (traffic conditioning agreement) compliant traffic with verysmall drop probability.
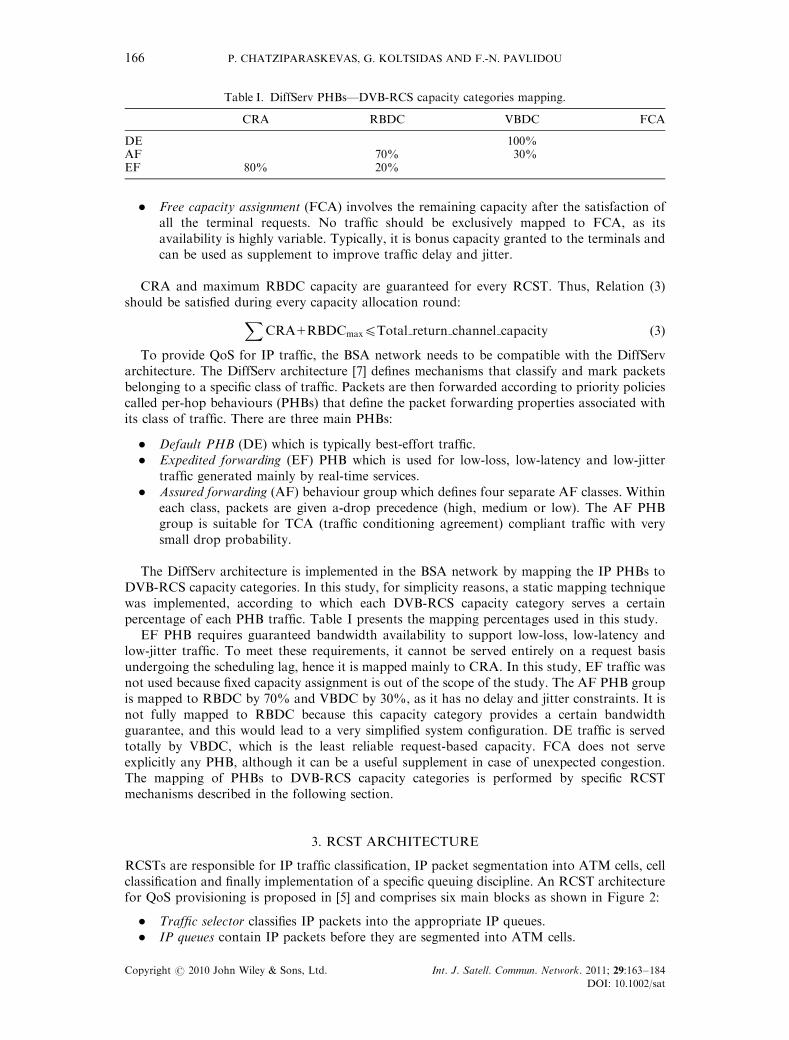
The DiffServ architecture is implemented in the BSA network by mapping the IP PHBs toDVB-RCS capacity categories. In this study, for simplicity reasons, a static mapping techniquewas implemented, according to which each DVB-RCS capacity category serves a certainpercentage of each PHB traffic. Table I presents the mapping percentages used in this study.
EF PHB requires guaranteed bandwidth availability to support low-loss, low-latency andlow-jitter traffic. To meet these requirements, it cannot be served entirely on a request basisundergoing the scheduling lag, hence it is mapped mainly to CRA. In this study, EF traffic wasnot used because fixed capacity assignment is out of the scope of the study. The AF PHB groupis mapped to RBDC by 70% and VBDC by 30%, as it has no delay and jitter constraints. It isnot fully mapped to RBDC because this capacity category provides a certain bandwidthguarantee, and this would lead to a very simplified system configuration. DE traffic is servedtotally by VBDC, which is the least reliable request-based capacity. FCA does not serveexplicitly any PHB, although it can be a useful supplement in case of unexpected congestion.The mapping of PHBs to DVB-RCS capacity categories is performed by specific RCSTmechanisms described in the following section.
3. RCST ARCHITECTURE
RCSTs are responsible for IP traffic classification, IP packet segmentation into ATM cells, cellclassification and finally implementation of a specific queuing discipline. An RCST architecturefor QoS provisioning is proposed in [5] and comprises six main blocks as shown in Figure 2:
� Traffic selector classifies IP packets into the appropriate IP queues.� IP queues contain IP packets before they are segmented into ATM cells.
Table I. DiffServ PHBs—DVB-RCS capacity categories mapping.
CRA RBDC VBDC FCA
DE 100%AF 70% 30%EF 80% 20%
P. CHATZIPARASKEVAS, G. KOLTSIDAS AND F.-N. PAVLIDOU166
Copyright r 2010 John Wiley & Sons, Ltd. Int. J. Satell. Commun. Network. 2011; 29:163–184
DOI: 10.1002/sat

� IP queue manager segments IP packets into fixed-sized ATM cells according to the AAL5layer (ATM Adaptation Layer 5) [8], and classifies them into the appropriate mediumaccess control (MAC) queue.
� MAC queues contain ATM cells prior to their transmission in the return link. In thisstudy, only one MAC queue was used for the AF PHB group, as AF traffic wasconsidered homogeneous with no further distinction in precedence levels.
� MAC management module computes capacity requests based on buffer size and employs aqueuing policy to determine which MAC queue will transmit next. In this study, we usedthe priority queuing discipline, according to which higher priority queues transmit next,unless they are empty.
� Predictor estimates future traffic according to incoming rate and queue size measurementstaken regularly. Prediction is necessary in request calculation to estimate the amount oftraffic that will arrive from the time the request is sent until the requested capacity isallocated, i.e. during the scheduling lag.
The following section focuses on how capacity requests are calculated based onmeasurements of the MAC queue size and taking into account the QoS requirements of thetraffic served by each queue.
4. CAPACITY REQUEST CALCULATION
Capacity requests issued by the terminals to the NCC need to be accurate to avoid requestingexcess capacity and thus wasting network resources. They also need to be predictive so that theassigned capacity can serve the traffic received during the scheduling lag, as stated in theprevious section. Henceforth, we describe the two capacity request mechanisms examined in thisstudy.
4.1. Capacity requests based on mapping IP service classes to DVB-RCS capacity categories
In the first request scheme (RS1), capacity needed for each PHB is initially mapped to the DVB-RCS capacity categories. The amount of capacity needed for each category is then transmittedto the NCC. In RS1, only RBDC and VBDC capacity is assigned in response to terminalrequests.
Figure 2. RCSTs’ DiffServ architecture and DCA mechanisms.
FAIR RESOURCE ALLOCATION IN DVB-RCS NETWORKS 167
Copyright r 2010 John Wiley & Sons, Ltd. Int. J. Satell. Commun. Network. 2011; 29:163–184
DOI: 10.1002/sat
According to Table I, RBDC capacity serves 70% of AF and 20% of EF traffic. The requiredAF capacity can be calculated by Equation (4) in slots per frame [9].
CAFðtÞ ¼ RAFðtÞ1QAFðtÞ
Tsð4Þ
where RAF is the average rate of incoming AF traffic, QAF(t) the current AF MAC queue size incells and Ts a constant time period. The concept of Formula (4) is that the required AF capacityequals the current average incoming AF traffic rate (RAF) plus the capacity needed to empty theAF buffer in time Ts. RAF is calculated via a sliding window technique and equals the number ofcell arrivals during the window period divided by the period itself. In this study, we used asliding window with a length of 0.265 s (10 frames), which in [10] was considered the optimallength. The time period Ts is equal to the request submission period so that the term QAF(t)/Ts
represents the transmission rate required to empty the AF buffer till the next request calculation.According to Table I, the requested RBDC slots per frame will be:
RBDCreq ¼ ð0:7CAF10:2CEFÞ � Frame duration ð5Þ
VBDC requests serve 30% of AF traffic and all DE traffic. The required VBDC slots for thenext allocation period are calculated by the following formula:
VBDCreq ¼QDEðnÞ � QDEðn� 1Þ10:3CAF �AP if QDEðnÞ4QDEðn� 1Þ
0:3CAF �AP if QDEðnÞpQDEðn� 1Þ
(ð6Þ
where QDE(n) is the current size of the DE MAC queue, QDE(n�1) the DE MAC queue size atthe previous request calculation and AP the capacity allocation period. Typically, the VBDCslots required by an RCST are equal to the increase in the DE buffer size since the last request,plus 30% of the required AF rate. AF rate capacity (in slots/s) is transformed into volumecapacity (slots) by multiplying CAF with AP. This product yields the number of slots that needto be assigned during the next AP to reach the required AF rate. The NCC keeps a counter ofthe VBDC slots requested by each terminal. Each time a VBDC slot is assigned, the counter isdecremented, whereas each time a new VBDC request is received, it is incremented by theamount of slots requested. Apart from RBDC and VBDC, one CRA slot per frame is assignedto each terminal to ensure at least one transmission during a frame.
4.2. Capacity requests directly for each IP service class
In the second request scheme (RS2), terminals explicitly request capacity for each IP serviceclass (in our case AF and DE) rather than mapping the traffic to the DVB-RCS capacitycategories. These requests are based on incoming rate and queue size measurements, along withthe QoS requirements of the traffic each queue serves. The amount of the requested capacityensures that the probability of the queue length Q exceeding a specified threshold n (PrfQ4ng)remains under a certain value. This value is called outage or QoS violation probability (Pout)and is determined by the QoS requirements of the corresponding traffic.
As MMPP (Markov-modulated Poisson process) and PMPP (Pareto-modulated Poissonprocess) traffic sources are used in the simulations (Section 6.1), each RCST forms an MMPP/G/1 or PMPP/G/1 queuing system, respectively. Assuming that each source remains in the samestate during the request–allocation cycle, the system can be considered as M/G/1 [10].Moreover, if a constant queue service rate is assumed, the M/G/1 becomes M/D/1. In this case,the requested rate capacity for each queue is given by the following equation:
C ¼ leg � 1
gð7Þ
where
g ¼ �lnðPrfQ4ngÞ
n11
Q is the queue size and l the average incoming traffic rate in slots/s, calculated using the slidingwindow technique described in Section 4.1. According to [10], the outage probability is set to
P. CHATZIPARASKEVAS, G. KOLTSIDAS AND F.-N. PAVLIDOU168
Copyright r 2010 John Wiley & Sons, Ltd. Int. J. Satell. Commun. Network. 2011; 29:163–184
DOI: 10.1002/sat

10�3, and the threshold buffer sizes are nAF 5 115 cells and nDE 5 150 cells. Apart fromrequesting capacity for each service class, RS2 does not specify any fixed capacity assignment.
5. CAPACITY ALLOCATION
5.1. RCST data list and its update algorithm
The capacity allocation procedure, which is performed in the NCC, comprises two steps: first,the capacity requests that arrived at the NCC during the previous allocation period areprocessed. Then the NCC assigns time slots on the available carriers to the terminals accordingto the amount of slots they requested.
To fulfil the first step, the NCC keeps an incoming request queue where new capacity requestsare pushed. It also keeps a record of each terminal logged in the system in a list called RCSTdata list. Each list entry contains several fields depending on the request scheme used. For theRS1 scheme, an RCST entry may contain the following fields:
� Terminal id� Request satisfaction ratio (RSR), Equation (8)� CRA slots per frame� RBDC slots per frame requested� Cumulated VBDC slots requested� RBDC request expiration timer� Maximum RBDC slots� RBDC request validity period
For the RS2 scheme, an RCST entry should contain at least the following information:
� Terminal id� RSR, Equation (9)� EF slots requested� AF slots requested� DE slots requested
During the first step of the allocation procedure, an algorithm checks all the new requeststhat have arrived in the request queue and accordingly updates the RCST data list. Thisalgorithm is different for each request scheme. The algorithm pseudocode [5] adapted for theRS1 request scheme is illustrated bellow:
For each request in the incoming request queueGet the RCST that sent this request
if(there is no entry for this RCST in the RCST data list)Create a new entry in the list for this RCST and initialize it
elseSearch through the RCST data list and find this RCST’s entry
If(RBDC slots requested)Reset the RBDC request expiration timer for this RCST to the RBDCrequest validity periodif(RBDC request amount p Maximum RBDC)
Overwrite the previous RBDC request amount for this RCST withthe new amount
elseOverwrite the previous RBDC request amount for this RCST withthe Maximum RBDCAdd the portion of RBDC request amount in excess of the MaximumRBDC to the cumulated VBDC request amount
FAIR RESOURCE ALLOCATION IN DVB-RCS NETWORKS 169
Copyright r 2010 John Wiley & Sons, Ltd. Int. J. Satell. Commun. Network. 2011; 29:163–184
DOI: 10.1002/sat
If(VBDC slots requested)Add the VBDC request amount to the cumulated VBDC request amount
For the RS2 request scheme, the algorithm simply updates the values of the requested EF,AF and DE capacities for each RCST entry:
For each request in the incoming request queueGet the RCST that sent this request
if(there is no entry for this RCST in the RCST data list)Create a new entry in the list for this RCST and initialize it
elseSearch through the RCST data list and find this RCST’s entry
if(EF slots requested)Update EF slots requested by this RCST
if (AF slots requested)Update AF slots requested by this RCST
if (DE slots requested)Update DE slots requested by this RCST
5.2. Slot allocation algorithm
The second step of the allocation procedure involves the algorithm that assigns frame slotsto the terminals according to the updated RCST data list. Iuoras et al. [5] used an RR allocationscheme wherein slots are assigned consecutively to each RCST entry. The first RCSTs toreceive slots tend to have their requests satisfied better than those that receive capacity in the endand get the remaining slots. To eliminate this event, we propose a new algorithm which requiresthat, prior to slot assignment, the RCST data list would be sorted according to a value whichshows how well each terminal requests were satisfied during the previous allocation. This valueis called RSR and can be defined in various ways, depending on the class of traffic forwhich the algorithm is desired to perform fairer. In our simulations, the RSR is computed byEquations (8) and (9) for the request schemes RS1 and RS2, respectively.
RSRRS1 ¼VBDC slots assigned
Total slots requestedð8Þ
RSRRS2 ¼DE slots assigned
Total slots requestedð9Þ
The numerators in Equations (8) and (9) are the number of VBDC and DE slots assigned,whereas the denominators represent the sum of all slots requested by the terminal. VBDC andDE capacity was chosen to affect mostly the value of RSR, because it is the capacity ofinterest that receives the least priority. The RCST data list is sorted each time in ascendingRSR order. In this way, the RCSTs with large RSR values in the previous slot allocationbecome the last ones to obtain capacity at the new allocation round. As a result, the occurrenceof terminals, which constantly request large amounts of slots, being favoured is diminished.Thus, terminals are treated in a more balanced way. The RSR field of each RCST data listentry is updated after each capacity assignment so that the list would be properly sorted for thenext allocation process. The proposed algorithm pseudocode for both the request schemesis as follows.
Sort RCST data list in ascending RSR order
// CRA and RBDC/AF capacity assignmentFor each RCST data list entry
Go to the carrier with the largest number of free slots
P. CHATZIPARASKEVAS, G. KOLTSIDAS AND F.-N. PAVLIDOU170
Copyright r 2010 John Wiley & Sons, Ltd. Int. J. Satell. Commun. Network. 2011; 29:163–184
DOI: 10.1002/sat

Assign to the corresponding RCST the amount of CRA and RBDC/AF slotsdefined in this entry
// VBDC/DE capacity assignmentFor each RCST data list entry
If (the RCST corresponding to the current entryhas already received slots)
Go to the carrier containing these slotsElse
Go to the carrier with the largest number of free slots
Assign to the corresponding RCST the amount of VBDC/DE slots definedin this entry up to the amount requested or up to the end of the carrier
For each RCST data list entryUpdate RSR
The same algorithm, yet without sorting the RCST data list, is used for the RR scheme.Henceforth, the proposed algorithm will be referred to as Fair Slot Allocation (FSA).
6. PERFORMANCE EVALUATION
6.1. Simulation setup
To evaluate the proposed allocation scheme, we implemented a simulator of the BSA networkshown in Figure 1 in accordance with the DVB-RCS standard [2, 6]. We consider 16 RCSTs andone NCC situated on the ground. A capacity request needs 260ms [11] to reach the NCC,whereas another 260ms is needed by the TBTP message to travel back to the RCSTs, resultingin a 520-ms scheduling lag due to propagation delay. The scheduling lag also includes the safeframe period at the RCST, which is required to ensure that all the RCSTs have received theTBTP on time. According to [2], the safe frame period shall not exceed 90ms. In this study, weconsider a scheduling lag equal to 800ms that includes 520ms of round-trip propagation delayplus 280ms of processing times and safe frame time. Capacity allocation is performed every26.5ms (frame duration), whereas capacity requests are transmitted every 800ms. The capacityrequest period was chosen equal to the scheduling lag so that each request reserves capacity untilthe next request takes effect. RCST signalling information and capacity request messages aretransmitted in the SYNC slots at the beginning of each frame. The duration of each simulationwas set to 20 000 s; since during this period, it was observed that the system reaches a steadystate combined with reasonable computing times.
Aggregate traffic in each queue is modelled by MMPP [12] and PMPP [13, 14] sources.MMPP sources generate short-range-dependent (SRD) traffic, while PMPP sources generatelong-range-dependent (LRD) and self-similar traffic [15]. Aggregate traffic in both the cases ismodelled as a switched Poisson process alternating between the two states with rate parametersl1 and l2. The sojourn times of these states are exponentially distributed in case of MMPP andPareto distributed in case of PMPP. The packet arrival process during each state is Poisson witharrival rates l1 and l2, respectively. For the MMPP model, the state sojourn times are computedby an exponentially distributed random number generator with parameter l1 5 1/Ti, where Ti isthe average duration of state i.
In case of PMPP sources, the Pareto distribution is used for the computation of the stateintervals. The Pareto distribution is described by two parameters: Shape parameter a, whichdefines the shape of the distribution and scale parameter b, which affects the magnitude of thenumbers generated. For LRD traffic generation, a should be bounded on (1,2) [13]. In thisstudy, the shape parameter was set to 1.5, a typical value for rather bursty traffic, while the scaleparameter is determined by the average state duration desired. This is achieved as follows: The
FAIR RESOURCE ALLOCATION IN DVB-RCS NETWORKS 171
Copyright r 2010 John Wiley & Sons, Ltd. Int. J. Satell. Commun. Network. 2011; 29:163–184
DOI: 10.1002/sat

Pareto distribution has a mean of bða=a� 1Þ; hence, if the desired average sojourn time is T, thescale parameter is computed by the equation b ¼ T ða� 1=aÞ.
Table II shows the traffic Scenarios simulated along with the rate parameters l1 and l2 usedto produce the corresponding load and AF/DE traffic mix. The traffic Scenarios were performedfor slow switching (SS) traffic with average state sojourn times T1 5T2 5 3.25 s and fastswitching (FS) traffic with T1 5T2 5 0.5 s, using the same rate parameters in both the cases.
Table II. Simulation scenarios and state rates for slow and fast switching traffic.
ScenarioLoad(%)
AF(%)
DE(%)
AF l1(slots/s)
AF l2(slots/s)
DE l1(slots/s)
DE l2(slots/s)
1 90 50 50 259.4 148.1 259.4 148.12 90 20 80 104.1 59.0 424.5 227.53 90 80 20 424.5 227.5 104.1 59.04 75 50 50 224.1 115.6 224.1 115.65 75 20 80 78.1 57.8 342.0 201.46 75 80 20 342.0 201.4 78.1 57.8
Table III. Fairness index for SS traffic.
Fairness index
RS1 RS2
Scenario Model Load (%) AF (%) DE (%) FSA RR FSA RR
1 MMPP 90 50 50 0.404574 0.349441 0.960757 0.9603382 MMPP 90 20 80 0.836493 0.80037 0.957286 0.9502363 MMPP 90 80 20 9.69� 10�5 9.76� 10�5 0.976448 0.9719124 PMPP 90 50 50 0.37839 0.335836 0.961602 0.9611045 PMPP 90 20 80 0.574728 0.683395 0.95679 0.9497246 PMPP 90 80 20 10.08� 10�5 9.79� 10�5 0.978372 0.9737487 MMPP 75 50 50 0.875553 0.829879 0.984749 0.9818238 MMPP 75 20 80 0.911335 0.901719 0.985353 0.9782339 MMPP 75 80 20 0.0496947 0.0482574 0.993457 0.98945210 PMPP 75 50 50 0.870645 0.824181 0.984507 0.98164411 PMPP 75 20 80 0.912277 0.903189 0.985771 0.97881712 PMPP 75 80 20 0.0735685 0.0943659 0.993918 0.989968
Table IV. Fairness index for FS traffic.
Fairness index
RS1 RS2
Scenario Model Load (%) AF (%) DE (%) FSA RR FSA RR
1 MMPP 90 50 50 0.575177 0.505914 0.965627 0.9644442 MMPP 90 20 80 0.83892 0.809427 0.961643 0.9544343 MMPP 90 80 20 1.258� 10�4 1.197� 10�4 0.978853 0.9748154 PMPP 90 50 50 0.632034 0.553329 0.965889 0.9645385 PMPP 90 20 80 0.791252 0.781069 0.960129 0.9528476 PMPP 90 80 20 0.004536 0.004415 0.980136 0.9759947 MMPP 75 50 50 0.895138 0.86132 0.988397 0.985298 MMPP 75 20 80 0.911744 0.903368 0.987347 0.9806879 MMPP 75 80 20 0.0999238 0.095506 0.99426 0.99075610 PMPP 75 50 50 0.897051 0.864173 0.988135 0.98499211 PMPP 75 20 80 0.912279 0.904182 0.987518 0.98091312 PMPP 75 80 20 0.25615 0.247668 0.99436 0.990885
P. CHATZIPARASKEVAS, G. KOLTSIDAS AND F.-N. PAVLIDOU172
Copyright r 2010 John Wiley & Sons, Ltd. Int. J. Satell. Commun. Network. 2011; 29:163–184
DOI: 10.1002/sat
Each Scenario was performed twice for each allocation algorithm (FSA and RR), once for RS1and once for RS2. Simulation results are discussed in the following section.
6.2. Discussion of simulation results
The simulator implemented computes the queuing delay experienced by each packet in theterminal buffers. The fairness of the allocation process is measured using Jain’s FairnessIndex (FI) [16]:
f ðxÞ ¼
Pi xi
� �2nP
i x2ið10Þ
where n is the number of samples checked for fairness.In our simulations, after each capacity allocation i, the number of total slots assigned to a
terminal j (ASNi;j) divided by the total requested number of slots (REQi;j) is recorded. Thisvalue is called Request Satisfaction Index, RSIi;j and is calculated by Equation (11). ASNi;j doesnot comprise the FCA slots assigned to the terminal, thus 0pRSIi;jp1.
RSIi;j ¼
ASNi;j
REQi;jif REQi;j 6¼ 0
1 if REQi;j ¼ 0
8<: ð11Þ
By substituting xi with RSIi;j, Equation (10) becomes:
f ðRSIÞ ¼
Pi
Pj RSIi;j
h i2NaNRCST
Pi
Pj RSI2i;j
ð12Þ
where Na is the number of capacity allocations performed during the simulation and NRCST thenumber of active terminals.
We consider that capacity allocation is fair, if the amount of slots assigned per slots requested(RSI) for each RCST is close to one another resulting in a FI (Equation (12)) close to 1. Valuesof the index computed in the simulations are greater for the proposed FSA than the RR schemein all except for three simulation Scenarios. More specifically, as shown in Table IV, the FSAyielded greater FI in all the simulations with smooth FS traffic for both request schemes. For themore demanding SS traffic and RS1 requests, the proposed allocation scheme performed betterin terms of fairness in almost all the Scenarios apart from 3, 5 and 12 (Table III). As far as thecapacity request calculation methods are concerned, the RS2 scheme generally yielded greaterand more uniform FI values. The fairness gap between the two request schemes is more obviousfor 80% AF–20% DE traffic mix. Under these circumstances, most of the capacity is allocatedto the high-priority AF traffic, leaving a small amount of slots for DE traffic. In periods withlight DE traffic, terminals are more or less assigned the requested VBDC/DE slots, resulting inreasonable values of RSI close to 1 (Equation (11)). However, in periods with heavy DE traffic,the cumulated VBDC/DE slots increase dramatically causing the RSI to plummet. This largefluctuation of the RSI results in very small FIs calculated in such Scenarios. On the contrary, thenon-cumulative-rate-based requests of RS2 result in more uniform values of RSI, thus achievinga FI closer to unity. Consequently, in terms of FI, the capacity allocation algorithm becomesmore effective using the RS2 scheme than using RS1. Moreover, considering the number ofScenarios in which FSA achieved greater FI, it can be concluded that FSA is more fair than RR.
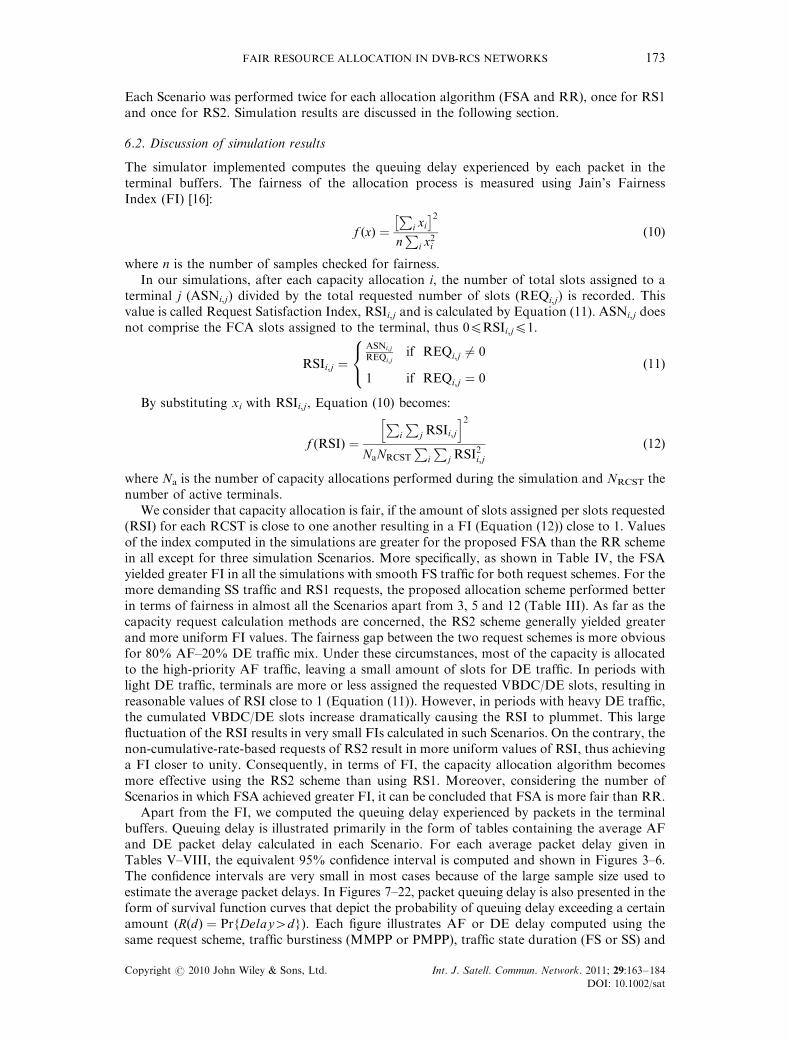
Apart from the FI, we computed the queuing delay experienced by packets in the terminalbuffers. Queuing delay is illustrated primarily in the form of tables containing the average AFand DE packet delay calculated in each Scenario. For each average packet delay given inTables V–VIII, the equivalent 95% confidence interval is computed and shown in Figures 3–6.The confidence intervals are very small in most cases because of the large sample size used toestimate the average packet delays. In Figures 7–22, packet queuing delay is also presented in theform of survival function curves that depict the probability of queuing delay exceeding a certainamount (RðdÞ ¼ PrfDelay4dg). Each figure illustrates AF or DE delay computed using thesame request scheme, traffic burstiness (MMPP or PMPP), traffic state duration (FS or SS) and
FAIR RESOURCE ALLOCATION IN DVB-RCS NETWORKS 173
Copyright r 2010 John Wiley & Sons, Ltd. Int. J. Satell. Commun. Network. 2011; 29:163–184
DOI: 10.1002/sat

Table VI. Average AF packet queuing delay in seconds for FS traffic.
AF delay (s)
RS1 RS2
Scenario Model Load (%) AF (%) DE (%) FSA RR FSA RR
1 MMPP 90 50 50 0.0696254 0.0700454 0.0760077 0.0756262 MMPP 90 20 80 0.0407015 0.0431827 0.0436575 0.04407883 MMPP 90 80 20 0.154563 0.155492 0.186044 0.1842324 PMPP 90 50 50 0.0629674 0.0640221 0.0680238 0.0681575 PMPP 90 20 80 0.041184 0.0433937 0.043531 0.04407346 PMPP 90 80 20 0.123863 0.125446 0.144229 0.1437657 MMPP 75 50 50 0.0599448 0.0614694 0.0673545 0.06624928 MMPP 75 20 80 0.038154 0.0398114 0.0417437 0.04124499 MMPP 75 80 20 0.0925793 0.0936361 0.11473 0.11413510 PMPP 75 50 50 0.055804 0.0574285 0.0619395 0.061207311 PMPP 75 20 80 0.0381127 0.0397573 0.04161 0.041105112 PMPP 75 80 20 0.0863011 0.0877967 0.096777 0.0966009
Table VII. Average DE packet queuing delay in seconds for SS traffic.
DE delay (s)
RS1 RS2
Scenario Model Load (%) AF (%) DE (%) FSA RR FSA RR
1 MMPP 90 50 50 1.29049 1.35589 0.87663 0.8779312 MMPP 90 20 80 2.67716 2.29455 0.712725 0.9030243 MMPP 90 80 20 1.66464 1.74403 1.14403 1.242044 PMPP 90 50 50 6.52442 7.30912 2.7639 2.603875 PMPP 90 20 80 13.8319 11.8643 1.97366 2.767866 PMPP 90 80 20 4.67244 4.98677 0.988249 1.098087 MMPP 75 50 50 0.325161 0.327867 0.294123 0.3070978 MMPP 75 20 80 0.333029 0.3232 0.207659 0.2390949 MMPP 75 80 20 0.36983 0.374738 0.394901 0.40836210 PMPP 75 50 50 0.718662 0.603924 0.306406 0.31880511 PMPP 75 20 80 0.477051 0.440568 0.218599 0.24434412 PMPP 75 80 20 0.36058 0.369221 0.391445 0.402444
Table V. Average AF packet queuing delay in seconds for SS traffic.
AF delay (s)
RS1 RS2
Scenario Model Load (%) AF (%) DE (%) FSA RR FSA RR
1 MMPP 90 50 50 0.0621568 0.0636954 0.0698701 0.07003472 MMPP 90 20 80 0.0406758 0.0432653 0.0442215 0.04481453 MMPP 90 80 20 0.161652 0.165232 0.171073 0.1718154 PMPP 90 50 50 0.0644102 0.0657732 0.0745263 0.07433455 PMPP 90 20 80 0.041006 0.0449141 0.0442934 0.04490886 PMPP 90 80 20 0.168798 0.171638 0.180985 0.1803877 MMPP 75 50 50 0.0559638 0.0576826 0.061988 0.06137578 MMPP 75 20 80 0.0381604 0.0398369 0.0421233 0.04161739 MMPP 75 80 20 0.086424 0.0871381 0.102164 0.10210910 PMPP 75 50 50 0.0583803 0.0601071 0.0651996 0.064276111 PMPP 75 20 80 0.0381416 0.0398188 0.0421452 0.041594112 PMPP 75 80 20 0.0889705 0.0902187 0.109244 0.108721
P. CHATZIPARASKEVAS, G. KOLTSIDAS AND F.-N. PAVLIDOU174
Copyright r 2010 John Wiley & Sons, Ltd. Int. J. Satell. Commun. Network. 2011; 29:163–184
DOI: 10.1002/sat

load. There are three pairs of curves in each figure, one for each AF-DE traffic mix examined(50–50, 20–80 or 80–20). In each pair, one curve corresponds to FSA and the other to RR.
First, we examine packet delay for the FSA and RR algorithms using the RS1 request scheme.Results in Tables V and VI show that the FSA algorithm achieves slightly smaller AF packet delaysin all the Scenarios for both SS and FS traffic, which is also confirmed by Figures 7, 9, 11 and 13.On average, AF delays are improved by 3.29% for SS and 2.62% for FS traffic compared with RR.For the same request scheme, the average DE packet delays computed are enhanced with the FSA
Table VIII. Average DE packet queuing delay in seconds for FS traffic.
DE delay (s)
RS1 RS2
Scenario Model Load (%) AF (%) DE (%) FSA RR FSA RR
1 MMPP 90 50 50 0.568602 0.572447 0.51622 0.5389772 MMPP 90 20 80 0.607996 0.557506 0.417393 0.4864993 MMPP 90 80 20 0.862561 0.88049 0.864173 0.9083034 PMPP 90 50 50 1.8533 1.8292 0.857113 0.9129925 PMPP 90 20 80 7.67664 5.10562 0.674323 1.049676 PMPP 90 80 20 4.21898 4.07357 0.771498 0.8469537 MMPP 75 50 50 0.267032 0.270206 0.282332 0.2886418 MMPP 75 20 80 0.196243 0.199611 0.211167 0.2213289 MMPP 75 80 20 0.343635 0.349088 0.392324 0.40278910 PMPP 75 50 50 0.278378 0.265823 0.254407 0.26220611 PMPP 75 20 80 0.28122 0.265576 0.186012 0.20105912 PMPP 75 80 20 0.333285 0.336318 0.350548 0.361265
1 2 3 4 5 6
Scenario
0.02
0.04
0.06
0.08
0.1
0.12
0.14
0.16
0.18
Ave
rage
pac
ket d
elay
(se
c)
FSA
RR
7 8 9 10 1112
Scenario
0.03
0.04
0.05
0.06
0.07
0.08
0.09
0.1
FSA
RR
1 2 3 4 5 6
Scenario
0.04
0.06
0.08
0.1
0.12
0.14
0.16
0.18
0.2
FSA
RR
7 8 9 10 1112
Scenario
0.04
0.05
0.06
0.07
0.08
0.09
0.1
0.11
FSA
RR
(a) (b) (c) (d)
Figure 3. Estimated average AF packet queuing delays for SS traffic (Table V) along with their 95%confidence intervals: (a) RS1 90% load; (b) RS1 75% load; (c) RS2 90% load; and (d) RS2 75% load.
FAIR RESOURCE ALLOCATION IN DVB-RCS NETWORKS 175
Copyright r 2010 John Wiley & Sons, Ltd. Int. J. Satell. Commun. Network. 2011; 29:163–184
DOI: 10.1002/sat
1 2 3 4 5 6
Scenario
0.02
0.04
0.06
0.08
0.1
0.12
0.14
0.16
Ave
rage
pac
ket d
elay
(se
c)
FSARR
7 8 9 10 1112
Scenario
0.03
0.04
0.05
0.06
0.07
0.08
0.09
0.1
FSARR
1 2 3 4 5 6
Scenario
0.02
0.04
0.06
0.08
0.1
0.12
0.14
0.16
0.18
0.2
FSARR
7 8 9 10 1112
Scenario
0.02
0.03
0.04
0.05
0.06
0.07
0.08
0.09
0.1
0.11
0.12
FSARR
(a) (b) (c) (d)
Figure 4. Estimated average AF packet queuing delays for FS traffic (Table VI) along with their 95%confidence intervals: (a) RS1 90% load; (b) RS1 75% load; (c) RS2 90% load; and (d) RS2 75% load.
1 2 3 4 5 6
Scenario
1
2
3
4
5
6
7
8
9
10
11
12
13
14
Ave
rage
pac
ket d
elay
(se
c)
FSARR
7 8 9 10 1112
Scenario
0.3
0.35
0.4
0.45
0.5
0.55
0.6
0.65
0.7
0.75
FSARR
1 2 3 4 5 6
Scenario
0.6
0.8
1
1.2
1.4
1.6
1.8
2
2.2
2.4
2.6
2.8
FSARR
7 8 9 10 1112
Scenario
0.2
0.22
0.24
0.26
0.28
0.3
0.32
0.34
0.36
0.38
0.4
0.42
FSARR
(a) (b) (c) (d)
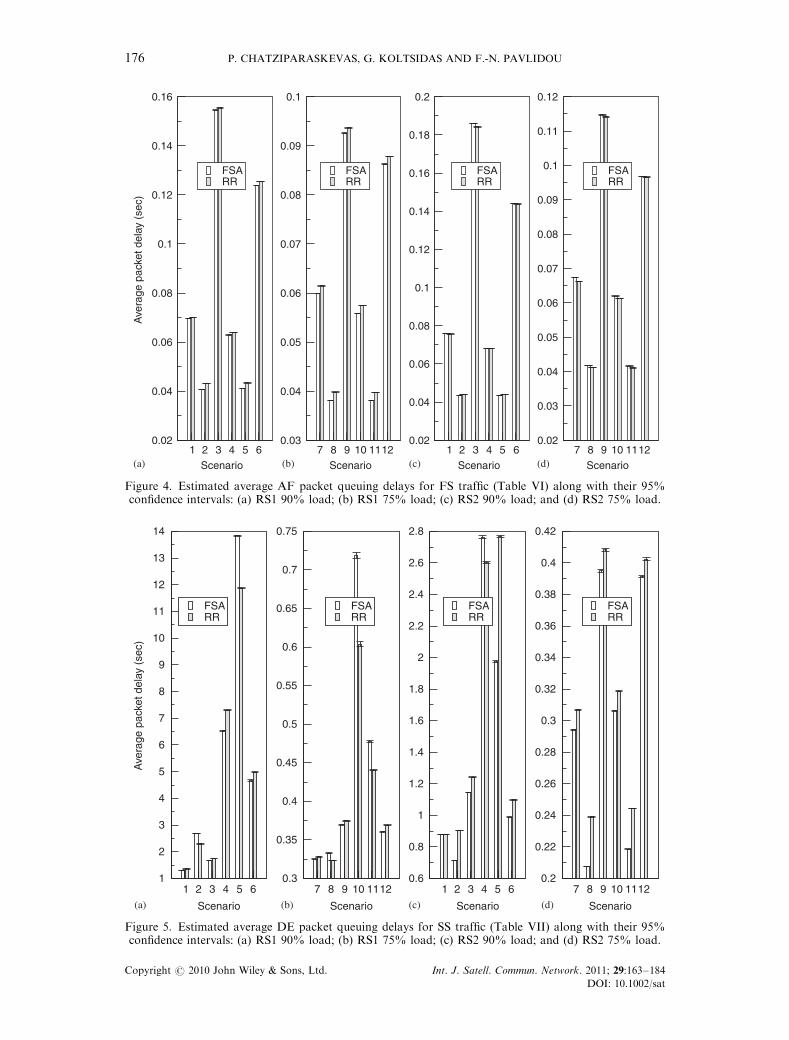
Figure 5. Estimated average DE packet queuing delays for SS traffic (Table VII) along with their 95%confidence intervals: (a) RS1 90% load; (b) RS1 75% load; (c) RS2 90% load; and (d) RS2 75% load.
P. CHATZIPARASKEVAS, G. KOLTSIDAS AND F.-N. PAVLIDOU176
Copyright r 2010 John Wiley & Sons, Ltd. Int. J. Satell. Commun. Network. 2011; 29:163–184
DOI: 10.1002/sat
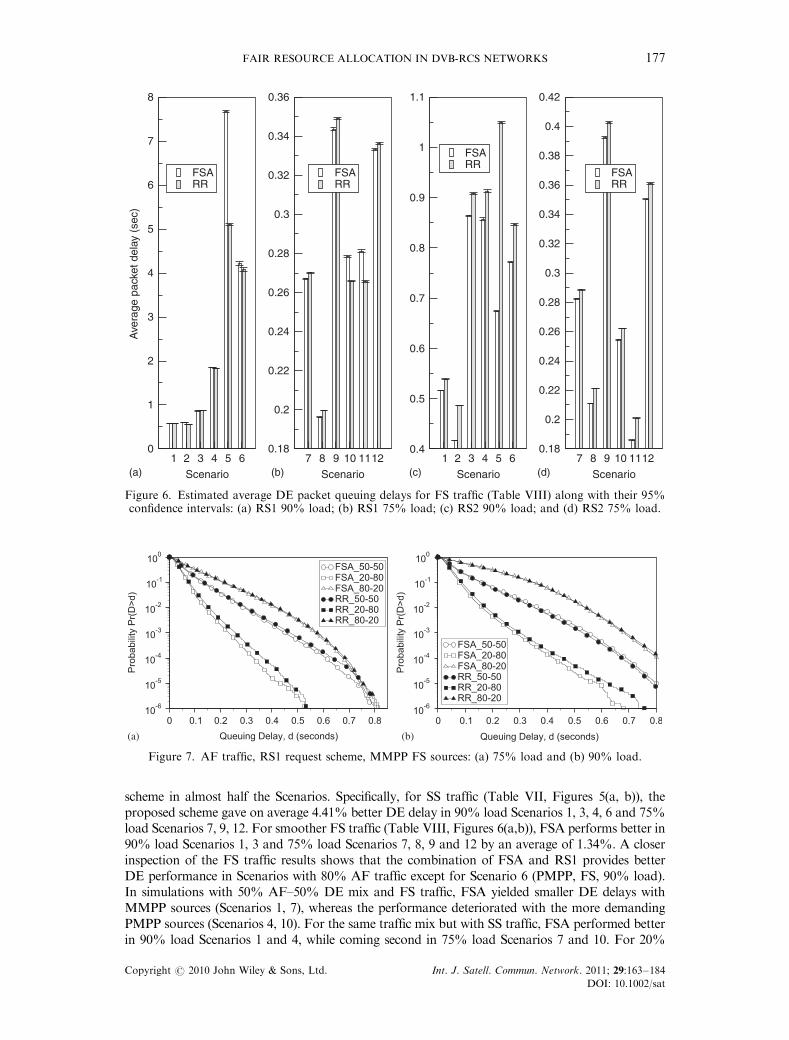
scheme in almost half the Scenarios. Specifically, for SS traffic (Table VII, Figures 5(a, b)), theproposed scheme gave on average 4.41% better DE delay in 90% load Scenarios 1, 3, 4, 6 and 75%load Scenarios 7, 9, 12. For smoother FS traffic (Table VIII, Figures 6(a,b)), FSA performs better in90% load Scenarios 1, 3 and 75% load Scenarios 7, 8, 9 and 12 by an average of 1.34%. A closerinspection of the FS traffic results shows that the combination of FSA and RS1 provides betterDE performance in Scenarios with 80% AF traffic except for Scenario 6 (PMPP, FS, 90% load).In simulations with 50% AF–50% DE mix and FS traffic, FSA yielded smaller DE delays withMMPP sources (Scenarios 1, 7), whereas the performance deteriorated with the more demandingPMPP sources (Scenarios 4, 10). For the same traffic mix but with SS traffic, FSA performed betterin 90% load Scenarios 1 and 4, while coming second in 75% load Scenarios 7 and 10. For 20%
1 2 3 4 5 6
Scenario
0
1
2
3
4
5
6
7
8
Ave
rage
pac
ket d
elay
(se
c)
FSARR
7 8 9 10 1112
Scenario
0.18
0.2
0.22
0.24
0.26
0.28
0.3
0.32
0.34
0.36
FSARR
1 2 3 4 5 6
Scenario
0.4
0.5
0.6
0.7
0.8
0.9
1
1.1
FSARR
7 8 9 10 1112
Scenario
0.18
0.2
0.22
0.24
0.26
0.28
0.3
0.32
0.34
0.36
0.38
0.4
0.42
FSARR
(a) (b) (c) (d)
Figure 6. Estimated average DE packet queuing delays for FS traffic (Table VIII) along with their 95%confidence intervals: (a) RS1 90% load; (b) RS1 75% load; (c) RS2 90% load; and (d) RS2 75% load.
(a) (b)
Figure 7. AF traffic, RS1 request scheme, MMPP FS sources: (a) 75% load and (b) 90% load.
FAIR RESOURCE ALLOCATION IN DVB-RCS NETWORKS 177
Copyright r 2010 John Wiley & Sons, Ltd. Int. J. Satell. Commun. Network. 2011; 29:163–184
DOI: 10.1002/sat

AF–80% DE mix, FSA was inferior in all the SS Scenarios (2, 5, 8 and 11) and all but one(6, MMPP, 75% load) FS Scenarios. The same remarks can be carried out examining Figures 12and 14 for SS traffic and Figures 8 and 10 for FS traffic. In general, using the RS1 capacity requests,FSA provides better AF performance than RR, whereas in terms of DE traffic, its performanceworsens as DE traffic gradually increases.
Simulations of the two allocation schemes with RS2 capacity requests show that, contrary toRS1, FSA provides better DE performance while being slightly inferior in terms of AF delay. The
(a) (b)
Figure 8. DE traffic, RS1 request scheme, MMPP FS sources: (a) 75% load and (b) 90% load.
(a) (b)
Figure 9. AF traffic, RS1 request scheme, PMPP FS sources: (a) 75% load and (b) 90% load.
(a) (b)
Figure 10. DE traffic, RS1 request scheme, PMPP FS sources: (a) 75% load and (b) 90% load.
P. CHATZIPARASKEVAS, G. KOLTSIDAS AND F.-N. PAVLIDOU178
Copyright r 2010 John Wiley & Sons, Ltd. Int. J. Satell. Commun. Network. 2011; 29:163–184
DOI: 10.1002/sat

respective simulation results concerning DE traffic are provided in Tables VII and VIII as well as inFigures 16, 18, 20 and 22. Packet delays computed for the FSA scheme indicate an average of 9.6%decrease in DE delay for SS and 8.07% for FS traffic with respect to RR except for one case. Thiscase is Scenario 4 with 90% load, 50% AF–50% DE mix and SS traffic generated by PMPPsources (Table VII, Figure 22(b)). In terms of AF delay, the proposed allocation scheme performedslightly better in 90% load SS and SRD traffic Scenarios 1, 2, 3 and LRD traffic Scenario 5(Table V, Figures 19(b) and 21(b)). In the remaining Scenarios, FSA AF performance was inferior
(a) (b)
Figure 11. AF traffic, RS1 request scheme, MMPP SS sources: (a) 75% load and (b) 90% load.
(a) (b)
Figure 12. DE traffic, RS1 request scheme, MMPP SS sources: (a) 75% load and (b) 90% load.
(a) (b)
Figure 13. AF traffic, RS1 request scheme, PMPP SS sources: (a) 75% load and (b) 90% load.
FAIR RESOURCE ALLOCATION IN DVB-RCS NETWORKS 179
Copyright r 2010 John Wiley & Sons, Ltd. Int. J. Satell. Commun. Network. 2011; 29:163–184
DOI: 10.1002/sat

by an average of 0.76%. For smoother FS traffic (Table VI), improvement was once more achievedin high load Scenarios 2, 4, 5, while in the rest, AF packet delays were on average 0.87% greaterthan those of RR. Although in some Scenarios, FSA provided better AF performance than RRand vice versa, the difference in AF delay between the two schemes is millisecond order with amaximum value of 1.812ms in FS traffic Scenario 3 (Table VI, Figure 15(b)). This fact shows thatAF performance is almost the same for both the schemes. Hence, FSA improvement inperformance for RS2 requests concerns DE traffic with a minor negative impact on AF delay.
(a) (b)
Figure 14. DE traffic, RS1 request scheme, PMPP SS sources: (a) 75% load and (b) 90% load.
(a) (b)
Figure 15. AF traffic, RS2 request scheme, MMPP FS sources: (a) 75% load and (b) 90% load.
(a) (b)
Figure 16. DE traffic, RS2 request scheme, MMPP FS sources: (a) 75% load and (b) 90% load.
P. CHATZIPARASKEVAS, G. KOLTSIDAS AND F.-N. PAVLIDOU180
Copyright r 2010 John Wiley & Sons, Ltd. Int. J. Satell. Commun. Network. 2011; 29:163–184
DOI: 10.1002/sat

Comparing the two request schemes in terms of packet delay, it is obvious that in RS1, a slightimprovement in AF delay comes at the cost of poor DE performance especially in Scenarios 4, 5, 6(Figure 5(a)) with SS and bursty LRD traffic. In these Scenarios, the extended DE delays arecaused by the inability of RS1 to represent effectively the capacity needed each time by theRCSTs. In this way, low priority DE traffic is suspended, while the performance of higher priorityAF traffic is not increased dramatically. On the contrary, RS2 requests proved to be moreaccurate and predictive, as DE performance is drastically improved in the same heavy traffic
(a) (b)
Figure 17. AF traffic, RS2 request scheme, PMPP FS sources: (a) 75% load and (b) 90% load.
(a) (b)
Figure 18. DE traffic, RS2 request scheme, PMPP FS sources: (a) 75% load and (b) 90% load.
(a) (b)
Figure 19. AF traffic, RS2 request scheme, MMPP SS sources: (a) 75% load and (b) 90% load.
FAIR RESOURCE ALLOCATION IN DVB-RCS NETWORKS 181
Copyright r 2010 John Wiley & Sons, Ltd. Int. J. Satell. Commun. Network. 2011; 29:163–184
DOI: 10.1002/sat
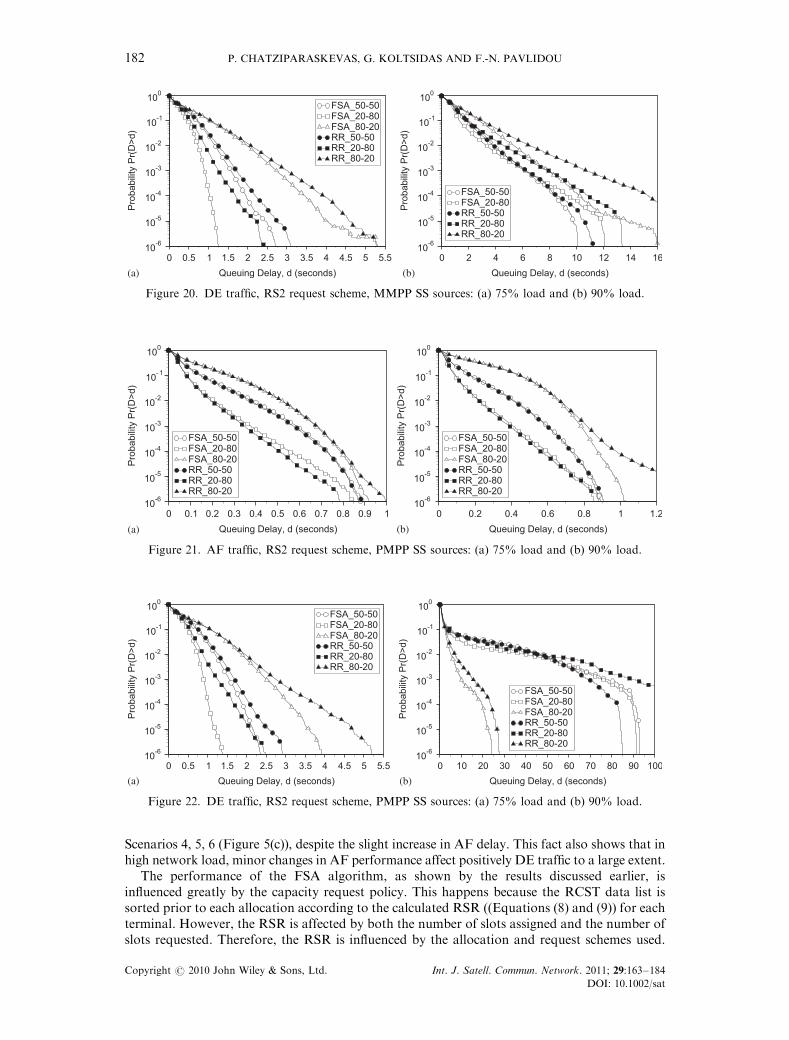
Scenarios 4, 5, 6 (Figure 5(c)), despite the slight increase in AF delay. This fact also shows that inhigh network load, minor changes in AF performance affect positively DE traffic to a large extent.
The performance of the FSA algorithm, as shown by the results discussed earlier, isinfluenced greatly by the capacity request policy. This happens because the RCST data list issorted prior to each allocation according to the calculated RSR ((Equations (8) and (9)) for eachterminal. However, the RSR is affected by both the number of slots assigned and the number ofslots requested. Therefore, the RSR is influenced by the allocation and request schemes used.
(a) (b)
Figure 20. DE traffic, RS2 request scheme, MMPP SS sources: (a) 75% load and (b) 90% load.
(a) (b)
Figure 21. AF traffic, RS2 request scheme, PMPP SS sources: (a) 75% load and (b) 90% load.
(a) (b)
Figure 22. DE traffic, RS2 request scheme, PMPP SS sources: (a) 75% load and (b) 90% load.
P. CHATZIPARASKEVAS, G. KOLTSIDAS AND F.-N. PAVLIDOU182
Copyright r 2010 John Wiley & Sons, Ltd. Int. J. Satell. Commun. Network. 2011; 29:163–184
DOI: 10.1002/sat

As a result, it is the combination of the selected allocation and request schemes that determinethe network performance.
7. CONCLUSIONS AND FUTURE WORK
In this article, we introduced an algorithm that regulates capacity allocation in the return channel of aDVB-RCS compliant satellite network. The proposed allocation scheme adjusts each time the orderby which the terminals receive capacity according to a fairness criterion introduced. In this way, wemanaged to improve AF and DE traffic performance in the majority of the Scenarios simulated. Wehave also investigated the performance of two capacity request calculation schemes. The first one(RS1) yielded better results for AF traffic, whereas the second (RS2) provided better DEperformance. Ultimately, simulation results showed that the proposed allocation scheme can improveboth AF and DE traffic performance in many cases compared with RR allocation. However, acompromise between AF and DE traffic performance is needed, as the results show that they cannotbe improved simultaneously. In our case, the combination of the proposed FSA algorithm with RS2request mechanism [10] seems more capable of providing QoS along with high link utilization.
Possible issues of future study in this area could be the enhancement of the allocation schemewith CRA capacity assignment mechanisms and more complex fairness criteria. To be moreprecise, the link quality could also be considered an additional factor for giving priority incapacity assignment to the terminals. Capacity request calculation can also be improved withtraffic prediction techniques to counteract the problems caused by the scheduling lag.
ACKNOWLEDGEMENTS
This study was performed within the framework of the SatNEx project.
REFERENCES
1. Liang X, Ong FLC, Pillai P, Chan PML, Mancuso V, Koltsidas G, Pavlidou FN, Caviglione L, Ferro E, Gotta A,et al. Fusion of digital television, broadband Internet and mobile communications-part ii: future service Scenarios.International Journal of Satellite Communications and Networking 2007; 25(4):409–440. DOI: http://dx.doi.org/10.1002/sat.880.
2. ETSI EN 301 790 V151 (2009-01). Digital Video Broadcasting (DVB); Interaction channel for satellite distributionsystems. Technical Report, ETSI, January 2009.
3. ITU-T G1010. End user multimedia QoS categories. Technical Report, International Telecommunication Union,November 2001.
4. ETSI EN 302 307 V112. Digital Video Broadcasting (DVB); Second generation framing structure, channel codingand modulation systems for Broadcasting, Interactive Services, News Gathering and other broadband satelliteapplications. Technical Report, ETSI, June 2006.
5. Iuoras N, Tho Le-Ngoc MA, Elshabrawy T. An IP-based satellite communications system architecture forinteractive multimedia services. International Journal of Satellite Communications and Networking 2003;21(4–5):401–426. DOI:10.1002/sat.758.
6. ETSI TR 101 790 V131 (2006-09). Digital Video Broadcasting (DVB); Interaction channel for Satellite DistributionSystems; Guidelines for the use of EN 301 790. Technical Report, ETSI, September 2006.
7. Blake S, Black D, Carlson M, Davies E, Wang Z, Weiss W. An Architecture for Differentiated Service. RFC 2475(Informational) Dec 1998. Available from: http://www.ietf.org/rfc/rfc2475.txt (updated by RFC 3260).
8. Grossman D, Heinanen J. Multiprotocol Encapsulation over ATM Adaptation Layer 5. RFC 2684 (ProposedStandard) September 1999. Available from: http://www.ietf.org/rfc/rfc2684.txt.
9. Gotta A, Potortı̀ F, Secchi R. Simulating dynamic bandwidth allocation on satellite links. WNS2 ’06: Proceedingfrom the 2006 Workshop on ns-2: The IP Network Simulator, ACM: New York, NY, USA, 2006; 8. DOI: http://doi.acm.org/10.1145/1190455.1190462.
10. Iuoras N, Le-Ngoc T. Dynamic capacity allocation for quality-of-service support in IP-based satellite networks.IEEE Wireless Communications 2005; 12(5):14–20. DOI: 10.1109/MWC.2005.1522099.
11. ITU-T G114. One way transmission time. Technical Report, International Telecommunication Union, May 2003.12. Fischer W, Meier-Hellstern K. The Markov-modulated Poisson process (MMPP) cookbook. Performance
Evaluation 1993; 18(2):149–171. DOI: http://dx.doi.org/10.1016/0166-5316(93)90035-S.13. Le-Ngoc T, Subramanian SN. A Pareto-modulated Poisson process (PMPP) model for long-range dependent
traffic. Computer Communications 2000; 23(2):123–132. DOI: 10.1016/S0140-3664(99)00166-8.14. Shah-Heydari S, Le-Ngoc T. Parameter estimation of switched Poisson process models for short- and long-range
dependent traffic. 2003; 2:1035–1038. DOI: 10.1109/CCECE.2003.1226072.
FAIR RESOURCE ALLOCATION IN DVB-RCS NETWORKS 183
Copyright r 2010 John Wiley & Sons, Ltd. Int. J. Satell. Commun. Network. 2011; 29:163–184
DOI: 10.1002/sat
15. Liu SG, Wang PJ, Qu LJ. Modeling and simulation of self-similar data traffic. Proceedings of the InternationalConference on Machine Learning and Cybernetics (ICMLC ), vol. 7, Guangzhou, China, 2005; 3921–3925. DOI:10.1109/ICMLC.2005.1527623.
16. Jain R, Chiu D, Hawe W. A quantitative measure of fairness and discrimination for resource allocation inshared computer systems. DEC Research Report TR-301, Digital Equipment Corporation, Maynard, MA, U.S.A.,September 1984.
AUTHORS’ BIOGRAPHIES
Panagiotis Chatziparaskevas received his Diploma in Electrical and ComputerEngineering from Aristotle University of Thessaloniki, Greece, in 2008. He hasattended one-semester courses in the Department of Industrial Informatics andInstrumentation in the Polytechnic School of Grenoble, France, as an exchangestudent. His research interests are in resource allocation techniques, medium accesscontrol (MAC) protocols and in wireless terrestrial, satellite and vehicular networks.He has been involved in national and European research projects.
Georgios Koltsidas received his PhD degree and Diploma in Electrical andComputer Engineering from the Aristotle University of Thessaloniki, Greece, in2009 and 2003, respectively. His major research interests are in routing protocols formobile ad hoc and sensor networks. He is also interested in resource managementtechniques in wireless terrestrial and satellite networks. He has been engaged inlectures and laboratory courses and he has been involved in many national andEuropean research projects.
Fotini-Niovi Pavlidou (S86, M87, SM00) received the PhD degree and the Diplomain Electrical Engineering from the Aristotle University of Thessaloniki (AUTh),Greece, in 1988 and 1979, respectively. She is with the Department of Electrical andComputer Engineering at AUTh engaged in teaching in the areas of mobilecommunications and telecommunications networks. Her research interests are in thefield of mobile and personal communications, satellite communications, multipleaccess systems, routing and traffic flow in networks and QoS studies for multimediaapplications over the Internet. She is participating in many national andinternational projects (Tempus, COST, Telematics, IST), and she has beenchairing the European COST262 Action on Spread Spectrum Systems andTechniques for Wired and Wireless Communications. She has served as memberof the TPC in many IEEE/IEE conferences and she has organized/chaired some
conferences like the ‘IST Mobile Summit2002’, the 6th ‘International Symposium on Power LinesCommunications-ISPLC2002’, the ‘International Conference on Communications-ICT1998’, etc. She is apermanent reviewer for many IEEE/IEE journals. She has published more than 100 papers in refereedjournals and conferences. She has served as guest-editor for special issues in many journals. She is a seniormember of IEEE, currently chairing the joint IEEE VT&AES Chapter in Greece.
P. CHATZIPARASKEVAS, G. KOLTSIDAS AND F.-N. PAVLIDOU184
Copyright r 2010 John Wiley & Sons, Ltd. Int. J. Satell. Commun. Network. 2011; 29:163–184
DOI: 10.1002/sat