on the factors influencing the development of sporadic
TRANSCRIPT

On the factors influencing the development of sporadic upwelling inthe Leeuwin Current system
Vincent Rossi,1 Ming Feng,2 Charitha Pattiaratchi,3 Moninya Roughan,1 and Anya M. Waite3
Received 28 November 2012; revised 16 April 2013; accepted 15 May 2013; published 23 July 2013.
[1] While there is no persistent upwelling along the West-Australian (WA) coastline,sporadic upwelling events have been documented primarily in summer. By analyzingcomparatively the variability of both Ekman and geostrophic cross-shore transports over aseasonal cycle, we show that the situation is more contrasted. Based on a composite indexcomputed from satellite data over a 15 year period, calibrated with well documented events,we investigate the factors influencing the development of sporadic upwelling in the region.Overall, the occurrence of transient upwelling events lasting 3–10 days varies largely inspace and time. Shelf regions at 31.5 and 34�S are favored with up to 12 upwelling days permonth during the austral spring/summer. Although being generally favored from Septemberto April, sporadic upwelling events can also occur at any time of the year at certainlocations north of 30�S. On average over 1995–2010, the Ningaloo region (22.5�S)cumulates the highest number of upwelling (�140 days per year) and is characterized bylonger events. The intensity of intermittent upwelling is influenced by the upwelling-favorable winds, the characteristics of the Leeuwin Current (e.g., onshore geostrophic flow,mesoscale eddies and meanders, stratification and nitracline) and the local topography. Thissuggests that short-living nutrient enrichment of variable magnitude may occur at any timeof the year at many locations along the WA coast.
Citation: Rossi, V., M. Feng, C. Pattiaratchi, M. Roughan, and A. M. Waite (2013), On the factors influencing the development ofsporadic upwelling in the Leeuwin Current system, J. Geophys. Res. Oceans, 118, 3608–3621, doi:10.1002/jgrc.20242.
1. Introduction
[2] Oceanic primary production is essentially limited bythe availability of dissolved macronutrients in the usuallydepleted surface layers. Vertical movements bringing deeprich-nutrient waters to the euphotic zone, such as upwell-ing, are, therefore, of tremendous importance as they pro-vide an essential nutritional input enhancing primaryproduction, which eventually benefits the whole oceanicfood web [Pauly and Christensen, 1995]. In the worldocean, one can distinguish (quasi) permanent upwellingsystems driven by persistent winds (the four eastern-boundary upwelling systems and the equatorial upwelling),whereas other upwelling processes can be referred to assporadic coastal upwelling, being restricted in space andtime. Assessing the upwelling activity over continental
margins has been the subject of numerous studies mainlyfocussed on the permanent eastern-boundary upwellingsystems [e.g., Bakun, 1990; Nykjaer and Van Camp, 1994;Alvarez et al., 2008]. This paper aims at studying the vari-able occurrence of sporadic upwelling events over theentire WA continental shelf.
[3] Surface circulation off the WA coast is dominated bythe Leeuwin Current (LC) system that consists of a near-surface flow, the southward LC, the deeper northward flowof the Leeuwin Undercurrent, and transient coastal counter-currents [Cresswell and Golding, 1980; Thompson, 1987;Woo et al., 2008; Pattiaratchi and Woo, 2009] (see alsoFigure 1). The LC forms off the Gascoyne shelf (20–23�S)and then consists of a relatively narrow, shallow (upper250 m) but intense poleward warm current [Thompson,1987, Smith et al., 1991; Feng et al., 2003]. With its coreusually located between the shelf break and about 100 kmoffshore, it flows along the WA coast until Cape Leeuwin(35�S) and eventually extending eastward along the south-ern Australian coastline in winter [Ridgway and Condie,2004]. In addition, due to a complex topography associatedwith current/frontal instabilities, meanders, and eddies spinup everywhere along the WA coast all year long, intensifiedduring the autumn/winter period [Rennie et al., 2007;Meuleners et al., 2007]. The absence of large-scale upwell-ing and equatorward flow in the atypical LC system, as isthe case in other eastern-boundary currents, has been attrib-uted to the presence of a strong anomalous pressure gradi-ent that drives the LC [Cresswell and Golding, 1980;
1The University of New South Wales, School of Mathematics and Sta-tistics, Sydney, New South Wales, Australia.
2CSIRO Marine and Atmospheric Research, Floreat, Western Australia,Australia.
3The University of Western Australia, School of Environmental Sys-tems Engineering and The Oceans Institute, Crawley, Western Australia,Australia.
Corresponding author: V. Rossi, IFISC (Institute for Cross-DisciplinaryPhysics and Complex Systems), UIB-CSIC, E-07122 Palma de Mallorca,Spain. ([email protected]; [email protected])
©2013. American Geophysical Union. All Rights Reserved.2169-9275/13/10.1002/jgrc.20242
3608
JOURNAL OF GEOPHYSICAL RESEARCH: OCEANS, VOL. 118, 3608–3621, doi:10.1002/jgrc.20242, 2013

Thompson, 1987; Weaver and Middleton, 1989]. Thisalongshore pressure gradient is set up by the Indonesianthroughflow delivering warm/less saline waters from thePacific to the Indian Ocean and by the strong surface heatloss at higher latitudes [Smith et al., 1991]. Despite the sea-sonal variation of the LC poleward transport (between �1and 6 Sv at 32�S), reaching its maximum during the australautumn-winter (May-July) [Feng et al., 2003], the seasonalvariability of the alongshore pressure gradient is unknownand is often assumed constant [Smith et al., 1991].
[4] Although persistent upwelling does not occur in theLC system, sporadic and localized wind-driven upwelling
events have been documented primarily during the australsummer (December-March), coinciding with the minimumtransport of the LC and the prominence of the upwelling-favorable (northward) winds [Thompson, 1987; Weaverand Middleton, 1989]. They have been associated with thesystem of equatorward coastal countercurrents inshore ofthe LC, the Capes Current (CC) extending along the southWA coast [Pearce and Pattiaratchi, 1999; Gersbach et al.,1999], whereas the Ningaloo Current (NC) flows intermit-tently along the northwest coast [Taylor and Pearce, 1999;Hanson et al., 2005; Woo et al., 2008]. The combination ofthese intermittent wind-driven coastal currents and upwell-ing during summer drives with localized enrichment of theusually nitrate-depleted surface waters [Lourey et al.,2006], enhancing primary production [Hanson et al., 2005;Hanson and McKinnon, 2009]. Clearly, the study of inter-mittent/localized upwelling in this oligotrophic regionbecomes critical to understand the links between boundarycurrent physics and biological productivity. These sporadicupwelling events have been observed along the WA coastfrom the southwest region [Gersbach et al., 1999] to theGascoyne shelf [Hanson et al., 2005; Woo et al., 2006].
[5] However, their transient character, their moderate in-tensity (leading often to subsurface expression only), andthe presence of the LC itself offshore prevent the effectiveuse of satellite sea-surface temperature (SST) as an upwell-ing proxy [Pearce and Pattiaratchi, 1999; Furnas, 2007].Moreover, even when coastal SST measurements vary as aresult of upwelling intensity, SST itself only indirectlyreflects this intensity since strong wind, for example, resultsin mixing of upwelled waters and warmer surroundingwaters at the sea surface. As such, previous work concen-trated on developing analytical models to predict the occur-rence of upwelling on this unique coast. Thompson [1987]proposed a simple analytical model considering the balanceof forces between the alongshore steric pressure gradient,the wind and bottom stress in the alongshore direction, sug-gesting the existence of a specific isobath acting as thecross-shore limit of the circulation driven by the wind(inner shelf) and of the circulation driven by the large-scalepressure gradient (outer shelf). Gersbach et al. [1999]extended this approach to investigate the Ekman transportand its impacts on the local inner shelf flushing rates offsouth WA coast, predicting that upwelling occurs when thetransition depth is at the 50 m isobath for a threshold pe-riod, occurring 5–9 times in summer. The local nature ofthis study and its simple parameterization (e.g., constantpressure gradient and simple shelf topography) limits itsuse along the entire WA coast. Recently, moored time se-ries off the Ningaloo region studied by Lowe et al. [2012]revealed that there is in fact no consistent summer wind-driven countercurrent (NC) and that upwelling was not lim-ited to summer periods. Another new study documentedunambiguous observational evidence of an intermittentupwelling event occurring in autumn [Rossi et al., 2013].To our knowledge, the probability of occurrence of thesesporadic wind-driven events, their spatiotemporal variabili-ty, frequency and duration, remain largely unknown alongthe WA coast.
[6] Using satellite and climatological data sets, this pa-per investigates the seasonal variations of the main driversof upwelling over the WA shelf, namely the alongshore
Figure 1. Map of the study area, the WA region. Thinblack contours represent the bathymetry (isobaths 50, 200,1000, and 3000 m). Note the variable width of the shelf (0–200 m). The colored annotations show the main feature ofthe surface circulation in the region: Red arrows are for theLeeuwin Current (LC), blue arrows are for the coastalcountercurrent (Ningaloo Current, NC and Capes Current,CC), red schematic vortex represent the areas favoringmesoscale eddies formation, and green arrows are for themean surface winds (averaged SSW within a 2� coastalband from 21� to 28�S and from 28� to 35�S, see also sec-tion 3.1).
ROSSI ET AL.: SPORADIC UPWELLING OFF WESTERN AUSTRALIA
3609

wind stress and pressure gradient. Based on a compositeupwelling index, which takes into account both local andsynoptic factors in a realistic setting adapted to the LC sys-tem, we then examine the spatiotemporal variability ofthese intermittent processes. In addition, we use previouslypublished evidence of upwelling events to calibrate ourupwelling index and to study the probability of occurrenceof sporadic upwelling events along the entire WA coast.Finally, we discuss the formulation of the index, the impactof each factor taken independently and the far-reachingimplications of our results.
2. Data and Methods
2.1. Remotely Sensed Data
[7] Multiple years long archives of remote sensing prod-ucts, including sea-surface height (SSH) and sea-surfacewind (SSW), covering the whole WA coast, are used to an-alyze the factors influencing the development of upwelling,namely the alongshore wind stress and the cross-shoregeostrophic velocities.
[8] We used a composite SSW gridded product whichconsists of high-resolution ocean surface vector winds andwind stresses on a global 0.25� grid, at a daily temporal re-solution from 1995 to 2010. The wind speeds were gener-ated by blending observations from multiple satellites (upto six satellites since June 2002), while the wind directionscame from the NCEP Reanalysis 2 and were interpolatedonto the blended speed grids. The blending of multiple-satellite observations fills in the data gaps (in both time andspace) of the individual satellite measurements reducingaliasing and random errors [Zhang et al., 2006]. As somenear-coastal regions exhibited contamination due to theinterpolation scheme, spurious values have been disre-garded from our analysis (see also www.ncdc.noaa.gov/oa/rsad/air-sea/seawinds.html).
[9] We also compare the previous blended product to thewind field derived from the widely used QuikSCAT scatter-ometer (daily product at 0.25� resolution, covering only theperiod 1999–2009).
[10] We selected an SSH field calculated from mappedaltimetric sea level anomalies combined with a meandynamic topography to derive the geostrophic surface cur-rents. The mapped sea level anomaly merging measure-ments from several altimeter missions are combined withthe mean dynamic topography (due to the permanent oceancirculation, with the marine geoid removed) of Rio et al.[2009] to obtain a time-variable SSH product. To match theother satellite products, the original weekly SSH data on a1/3� Mercator grid were converted to daily data onto a0.25� regular grid using a standard bilinear interpolationalgorithm. More details on the computation of the geostro-phic velocities are given by Sudre et al. [2013].
2.2. Climatological Data Sets
[11] The surface zonal transport due to the alongshorepressure gradient which drives the LC can also be assessedby vertical integration of the thermal wind law using thedensity gradient derived from climatological data sets. Cli-matological density fields along the WA shelf are extractedfrom the objectively analyzed fields of temperature [Locar-nini et al., 2010] and salinity [Antonov et al., 2010] from
the World Ocean Atlas 2009 (WOA09) as well as from theClimatological Atlas of Regional Seas (CARS09) [Condieand Dunn, 2006]. Note that these gridded data sets havedifferent resolution: CARS09 has a 1=2� spatial horizontalresolution, up to 79 vertical levels and a daily temporal re-solution, whereas WOA09 has a 1� spatial horizontal reso-lution, only 24 vertical levels and a monthly temporalresolution.
[12] From these climatological data sets, differentmethods can be applied to estimate the zonal velocities.On one hand, the upward integration of the thermal windlaw requires the definition of the surface layer of interest,the top 100 m (�mean depth of the mixed layer depth(MLD)) and of a deep reference level, 1000 m, where nomotion is assumed [Woo et al., 2008]. The cross-shoregeostrophic velocities can then be computed locally fromthe alongshore geopotential anomaly along the 1000 misobaths, using a 1� (2�, respectively) moving windowbased on CARS09 (WOA09, respectively), resulting in afinal resolution of 1=2� (1�, respectively). However, zonalvelocities calculated this way (not shown) do not neces-sarily represent the surface dynamics well as they inte-grate hydrological information (alongshore densitygradient) from much deeper water. Moreover, because the‘‘no motion’’ assumption might not be true and since suchclimatological data set usually lacks accuracy/resolutionin the deep ocean, this calculation was not retained. Onthe other hand, to reconcile geostrophy at the surface andthermal wind law within the water column, one can applya downward integration of the thermal wind law from thesurface to the depth of interest (�100 m) in addition ofthe SSH gradient (surface slope) to infer the total zonalgeostrophic velocities within the surface layer.
2.3. A Composite Upwelling Index
[13] To investigate sporadic upwelling over the WAcoast, we used an approach developed by Marchesiello andEstrade [2010] who derived an improved dynamicalupwelling index that accounts for the role of alongshorepressure gradients counteracting the coastal Ekman diver-gence within a realistic innershelf configuration. Theirnovel analytical model is particularly well adapted for theWA region since it takes into account the effect of onshoregeostrophic flow on the structure of upwelling, thus addingcrucial information to the classical wind-based upwellingindex [e.g., Bakun, 1990; Alvarez et al., 2008]. The Ekmanupwelling index (EUI, related to Ekman ‘‘divergence’’) andthe geostrophic upwelling index (GUI, due to the coastalgeostrophic ‘‘convergence’’) combine to form the compos-ite upwelling index (CUI):
CUI � EUI þ GUI � �A
�fLUþ uGD
2LUð1Þ
where �A is the alongshore wind stress (positive whenupwelling favorable, that is, alongshore equatorward), uG isthe geostrophic cross-shore velocity (positive offshore), �is the water density, and f is the coriolis parameter. LU is ascaling factor calculated as the larger of the ratio of the ver-tical Ekman layer scaled by shelf topography and the hori-zontal Ekman layer LE :
ROSSI ET AL.: SPORADIC UPWELLING OFF WESTERN AUSTRALIA
3610
LU ¼ max0:75D
S; LE ¼ �
ffiffiffiffiffiffiffiffiffiffiffiffiffiffiffiffi2AH=jf j
p� �ð2Þ
where D is the vertical Ekman layer, considered equivalentto the MLD in this work, calculated as
D ¼ �ffiffiffiffiffiffiffiffiffiffiffiffiffiffiffiffi2AV=jf j
pð3Þ
[14] S is the shelf slope (ratio of the maximum depth ver-sus the shelf width, oscillating between 10�3 and 10�2). Asprescribed by Marchesiello and Estrade [2010], a maxi-mum value of 20 km is imposed for LU to avoid countingdouble-cell structures for extended shelves. AV is the verti-cal viscosity (AV � 0.01 m2 s�1) and AH is the horizontalviscosity (AH � 100 m2 s�1), chosen following Marche-siello and Estrade [2010]. Our results are insensitive to theslight latitudinal changes of density within surface watersand we have thus retained a constant density of � ¼ 1023kg m�3.
[15] All indexes EUI, GUI, and CUI are in m/day andrepresent the theoretical vertical velocities due to: TheEkman divergence, the coastal geostrophic convergence,and their combination, respectively. The main direction ofthe coastline along the WA coast is particularly variable;hence, we compute the indexes in the shore-normal, ratherthan zonal, direction to optimize our interpretations. To dothis, it requires localizing the coastline and estimating itsorientation on a scale consistent with the forcing parame-ters (�25 km, i.e., 1=4�). The isobath 50 m is used in orderto ‘‘close’’ the large embayment such as Shark Bay and totake into account the extended shallow lagoons observed atsome locations along the WA coast (e.g., AbrolhosIslands). A smoothing procedure is then applied to the highresolution (1 arc min) topographic data set to remove
small-scale variability of the coastline. All forcing parame-ters (wind, bathymetry, and currents) were thus projectedalong the main coastline orientation and only the cross-shore and alongshore projections (rotated appropriately)were used for further calculations.
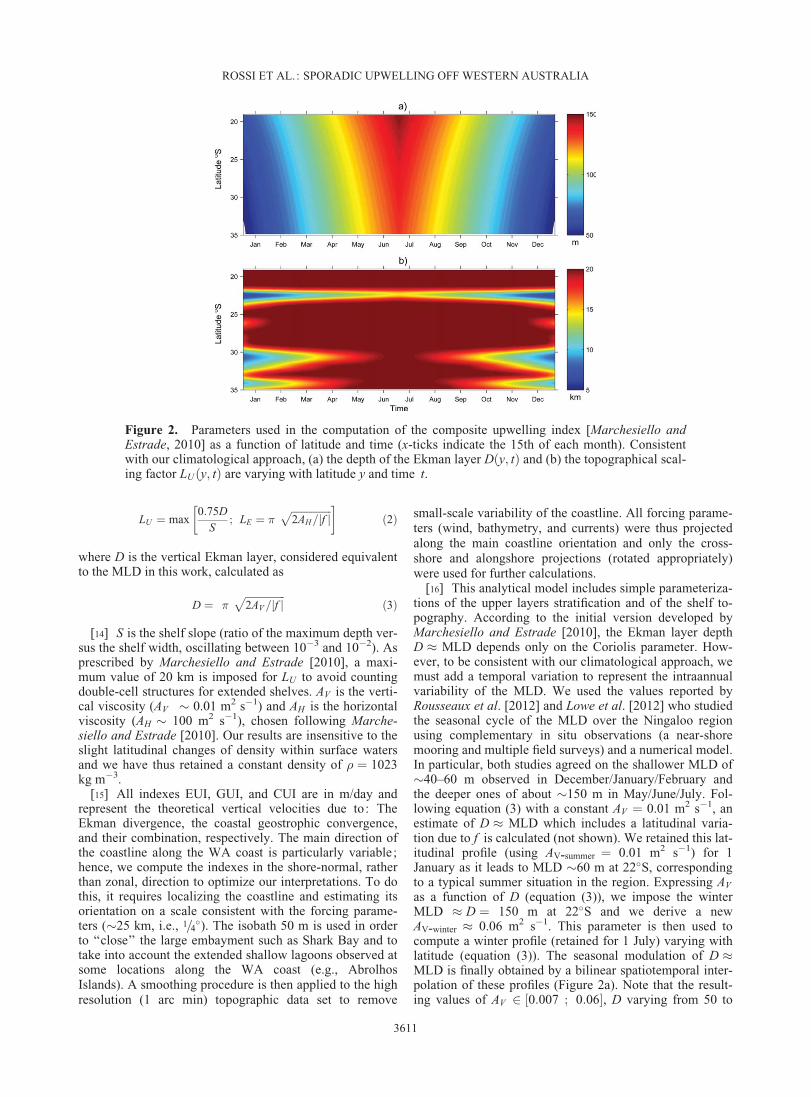
[16] This analytical model includes simple parameteriza-tions of the upper layers stratification and of the shelf to-pography. According to the initial version developed byMarchesiello and Estrade [2010], the Ekman layer depthD � MLD depends only on the Coriolis parameter. How-ever, to be consistent with our climatological approach, wemust add a temporal variation to represent the intraannualvariability of the MLD. We used the values reported byRousseaux et al. [2012] and Lowe et al. [2012] who studiedthe seasonal cycle of the MLD over the Ningaloo regionusing complementary in situ observations (a near-shoremooring and multiple field surveys) and a numerical model.In particular, both studies agreed on the shallower MLD of�40–60 m observed in December/January/February andthe deeper ones of about �150 m in May/June/July. Fol-lowing equation (3) with a constant AV ¼ 0.01 m2 s�1, anestimate of D � MLD which includes a latitudinal varia-tion due to f is calculated (not shown). We retained this lat-itudinal profile (using AV-summer ¼ 0.01 m2 s�1) for 1January as it leads to MLD �60 m at 22�S, correspondingto a typical summer situation in the region. Expressing AV
as a function of D (equation (3)), we impose the winterMLD � D ¼ 150 m at 22�S and we derive a newAV-winter � 0.06 m2 s�1. This parameter is then used tocompute a winter profile (retained for 1 July) varying withlatitude (equation (3)). The seasonal modulation of D �MLD is finally obtained by a bilinear spatiotemporal inter-polation of these profiles (Figure 2a). Note that the result-ing values of AV 2 0:007 ; 0:06½ �, D varying from 50 to
Figure 2. Parameters used in the computation of the composite upwelling index [Marchesiello andEstrade, 2010] as a function of latitude and time (x-ticks indicate the 15th of each month). Consistentwith our climatological approach, (a) the depth of the Ekman layer D y; tð Þ and (b) the topographical scal-ing factor LU y; tð Þ are varying with latitude y and time t.
ROSSI ET AL.: SPORADIC UPWELLING OFF WESTERN AUSTRALIA
3611
150 m, are consistent with the theoretical value prescribedby Marchesiello and Estrade [2010], the winter periodsbeing associated with higher vertical eddy viscosity. Thereare important seasonal variations of D � MLD, consider-ably deepening in autumn/winter, as compared to summerperiods.
[17] The continental shelf width (defined from 0 to 200m isobaths) and its slope change remarkably along the WAcoast (see Figure 1). The continental shelf is very wide(>150 km) north of 21.5�S and then extremely narrow(�20 km) off the Exmouth peninsula (22.5�S). South ofPoint Cloates, it widens gradually with a 40 km wide shelfat 23�S, increasing to 85–100 km around Shark Bay (25–28�S). Note that the orientation of the coastline changessharply at 25.5�S. To the south of Shark Bay, the continen-tal shelf width decreases to reach a local minimum of �40km at 31�S, and then widens again offshore Fremantle andBunbury (�60–80 km at 32–33�S). A noticeable narrowshelf of �45 km is present at 34�S, between Cape Natural-ist and Cape Leeuwin. To take into account, the influenceof the changing width of the continental shelf on theupwelling process, a parameterization LU is included in theanalytical model following equation (2). When deep winterMLD increases the term 0:75D
S , LU becomes essentially lim-ited by the imposed value of 20 km since very large shelvesare not found in this area. The shallow MLD in summerdecreases the term 0:75D
S which may reach values lower thanLE (itself ranging from 4.5 to 6.5 km over WA coast). Inparticular, LU ¼ LE only at the narrow shelf of Ningalooduring summer and LU ¼ min 0:75D
S ; 20 km� �
otherwisebecause of the maximum value imposed by Marchesielloand Estrade [2010]. Note that the effect of the narrow con-tinental shelves at 22.5�S, 31�S, and 34�S appears to bemaximal in summer when the MLD is relatively shallow(Figure 2b).
[18] Marchesiello and Estrade [2010] derived and vali-dated the index against the solution of a primitive equationmodel from the New-Caledonia region, that is, at similarlatitudes as this study. Additionally, focussing on theworld’s four largest eastern-boundary upwelling regions,their composite index presented a better fit to an independ-ent upwelling index based on SST, as compared to the clas-sical wind-based Bakun’s index [Bakun, 1990].
2.4. Climatological Analysis
[19] To compute the CUI in a cross-shore direction, weused high resolution satellite products of SSH and SSW tocompute the GUI and EUI, respectively. More specifically,the projected alongshore wind stress (upwelling favorable,parallel to the coastline and positive equatorward) is com-puted from the SSW and is then combined with the scalingfactors to derive the EUI. From the SSH field, the geostro-phic currents are computed as given by Sudre et al. [2013]and the projected cross-shore geostrophic velocities (posi-tive offshore) are extracted to derive the GUI in associationwith the scaling factors described previously. The compos-ite index CUI (positive in the offshore direction) is finallycalculated as the sum of the two former components (equa-tion (1)). To better understand the physical interactions, thevariability of both Ekman divergence and geostrophic con-vergence are first analyzed separately, and then after theircombination into the CUI, in a climatological setting. A
two-dimensional smoothing procedure is applied todecrease the impact of intense small-scale coastal featuresof moderate reliability (at the limit of validity of satellitedata), without removing the mesoscale signals (such aseddies and meanders). All climatologies were built by aver-aging 15 years of data (1995–2010) over 5 day windowswithin a coastal band of 2� width (zonal extension), every1=4� (meridional extension), in accord with the resolution ofthe satellite product. Several sensitivity analyses were per-formed using different widths for the coastal band and apartfrom diminishing the general amplitude, the main patternsremain relatively unchanged.
3. Results
[20] The alongshore pressure gradient driving the LC isresponsible for an onshore geostrophic transport counter-acting the wind-driven Ekman transport. In the following,we first analyzed both terms taken independently, namelythe offshore Ekman transport (section 3.1) and the onshoregeostrophic surface velocities (section 3.2). Then, we usethe analytical model of Marchesiello and Estrade [2010] toexamine the main factors involved in the upwelling processin this region (section 3.3). Finally, we used well-documented event to calibrate our indexes and to study theoccurrence of sporadic upwelling events over the WA coast(section 3.4).
3.1. Variability of the Upwelling-Favorable Winds
[21] Following Alvarez et al. [2008], we analyzed thetheoretical offshore Ekman transport perpendicular to thecoastline Q? (positive offshore) as the main variable forwind-driven upwelling by means of:
Q? ¼ cos �ð ÞQx � sin �ð ÞQy ð4Þ
where � is the angle between the unity vector pointingwestward and the normal vector to the coastline pointingoffshore (positive in a clockwise direction), Qx; Qy
�) being
the zonal and meridional component of the Ekmantransport.
[22] Different latitudinal regimes of upwelling favorablewinds are observed along the WA coast (Figure 3).Although it shows a maximum (1500–2500 m3 s�1 km�1)during the austral spring/summer (August–April), thewinds are upwelling favorable all year long from 21.5� to26.5�S with moderate offshore Ekman transport duringwinter (500–1000 m3 s�1 km�1). Further south from 26.5�
to 31�S, the wind stress is upwelling favorable duringspring/summer with similar offshore Ekman transport tothe northern area (1500–2500 m3 s�1 km�1). However, it isvery weak or slightly negative (�500 to 500 m3 s�1 km�1)from May to September. South of 31�S, there is upwellingfavorable Ekman transport (1000–2000 m3 s�1 km�1) fromlate October to March, whereas it is negative (�1500 to�500 m3 s�1 km�1), corresponding to onshore transportand downwelling from April to September. A particularpattern is observed at 33–34�S, where a weak positiveEkman transport (0–500 m3 s�1 km�1) prevails during win-ter months due to the meridional coastline. Note that northof 21.5�S, the signal is weak or negative all year long dueto the sharp change in the coast orientation.
ROSSI ET AL.: SPORADIC UPWELLING OFF WESTERN AUSTRALIA
3612

[23] Overall, the southern regions are affected by slightlydifferent wind regimes than the northern areas. In average,coastal winds of 7.2 m s�1 directed to the north/northeast(wind vector azimuth þ15�, with respect to true north)occur in the southern regions (28–35�S), while the northernones (21–28�S) see winds of 8.3 m s�1 blowing to thenorth/northwest (wind vector azimuth �5� ; see also theannotations in Figure 1). The northern areas are thus mostconsistently forced by upwelling favorable winds, whilethe varying coastline orientation explains most of thesmaller scale variability of the offshore Ekman transport.
[24] These general wind patterns and their amplitude arevery consistent in both wind products (see black contoursin Figure 3), thus strengthening our results. These productshave been validated for both open and coastal ocean appli-cation [Pickett et al., 2003; Zhang et al., 2006]. In addition,a good consistency is found between the theoretical off-shore Ekman transport computed from the blended productand from the wind data simultaneously collected during afield survey off Ningaloo Peninsula [Rossi et al., 2013] (notshown). Due to its extended temporal coverage (1995–2010), the blended product was retained for the computa-tion of the indexes.
3.2. Seasonal Variation of the Geostrophic Flow
[25] We now analyzed the zonal geostrophic velocitiesuG acting as a limiting factor for upwelling along the WAcoast. Although Smith et al. [1991] suggested that thelarge-scale alongshore geopotential gradient driving the LCis almost constant all year long, there is growing evidencethat it is not the case [Godfrey and Ridgway, 1985], espe-cially at smaller scales [Lowe et al., 2012].
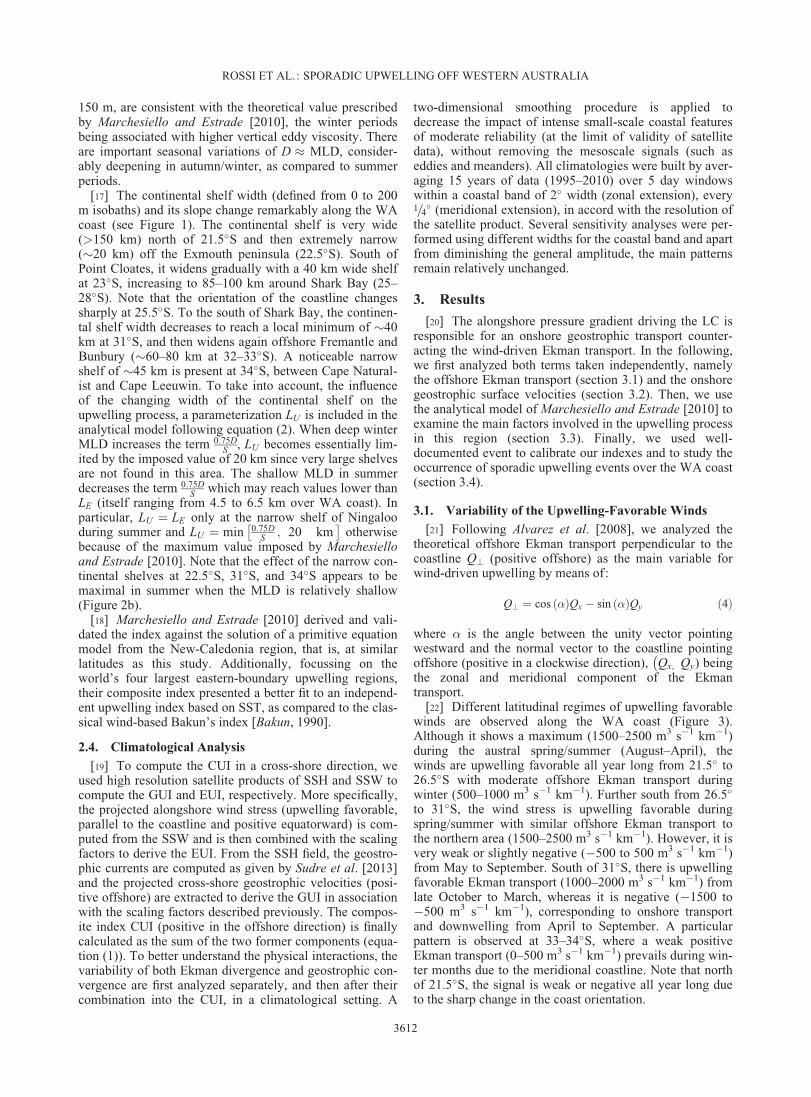
[26] Estimates of the zonal geostrophic velocities (posi-tive westward) computed from the SSH archive alone andfrom its combination with climatological data sets(WOA09 and CARS09) are comparatively analyzed (Fig-
ure 4). Overall, the different estimates of uG, all represen-tative of the flow in the surface mixed layer (�100 m),are in relatively good agreement with similar amplitudes(60.05 m/s). The main patterns obtained from the remotesensing analysis (Figure 4a) are essentially conservedwhen combined with the climatological data sets (Figures4b and 4c) as the SSH dominates the signal. Note, how-ever, that the onshore (negative) velocities are attenuated,while the patchy offshore (positive) velocities are slightlyreinforced. This seems due to the subsurface density field(positive poleward, see also Woo et al. [2008]) that tendsto counteract the strong geostrophic convergence at thesurface. The zonal geostrophic velocities are generallyonshore (negative values), with an intensification (up to�0.1 m/s) during the autumn/winter months. This intensi-fication occurs primarily in the northern regions (at 21–24�S from April to July) and propagates further southslightly later (at 31–34�S from June to September). Theintense permanent onshore flow observed consistently at26.5�S seems to be a robust feature of the area. The pres-ence of offshore geostrophic flow is also observed simi-larly in all three computations. Although both theiroccurrence and amplitude are slightly variable betweenthe different data sets, they are found at similar latitudes(22.5�, 25.5�, 28�, and 34�S) essentially from March toAugust (autumn/winter).
[27] Still, some discrepancies exist such as the magni-tude of the offshore flows. These discrepancies, potentiallyimpacting the computation of the GUI (and thus of theCUI), can be attributed to different factors: (i) hydrographyclimatologies may be affected by interpolation schemeclose to the shelf topography, (ii) mesoscale meanders/eddies are resolved by the satellite but less likely byWOA09/CARS09, (iii) CARS09, WOA09, and the satelliteSSH have different spatial and temporal resolution, and (iv)interannual/interdecadal variability is important in this
Figure 3. Hovmöller diagram (latitude versus time) of the theoretical offshore Ekman transport Q? (inm3 s�1 km�1 of coastline) based on the blended SSW product (1995–2010). Black contours represent thesame variable computed from the QuikSCAT archive (1999–2009).
ROSSI ET AL.: SPORADIC UPWELLING OFF WESTERN AUSTRALIA
3613
system [Feng et al., 2008, 2013] and so is the temporal pe-riod used to build the climatology.
[28] To reduce the uncertainties inherent to the CUIformulation and to the data sets used for its computation,we used only satellite data sets with uG derived from SSHand �A calculated from the blended SSW. For consis-tency, EUI and GUI are computed on similar remote-sensed archives with the same temporal/spatial resolution(resolving mesoscale meandering and eddies of the LC),which can be easily projected against the orientation ofthe coastline (both zonal and meridional componentsbeing available) and having the same temporal coverage(1995–2010).
3.3. Spatiotemporal Variability of Sporadic UpwellingOver the West-Australian Coast
3.3.1. Climatological Analysis of the Mean EUI[29] The analysis of the EUI, calculated as the offshore
Ekman transport divided by the scaling factor LU (Figure5a), reflects that of the offshore Ekman transport alone(section 3.1). However, the overall effect of the division byLU is a decrease in strength of the wind-driven upwellingin winter due to the thicker MLD, and the indirect effect of
the narrow shelves (in particular at 22.5� and 31�S) thatstrengthen the latitudinal variation of the offshore wind-driven Ekman transport, resulting in three latitudinal max-ima in EUI (22.5�, 31�, and 34�S).3.3.2. Climatological Analysis of the Mean GUI
[30] Following equation (1), the horizontal cross-shoregeostrophic velocities uG (derived from SSH) are combinedwith previously described scaling factors to obtain the GUI(Figure 5b). As predicted by the theory, a negative (posi-tive) GUI corresponds to an onshore (offshore) geostrophicflow, associated to downward (upward) theoretical verticalvelocities, thus driving downwelling (upwelling) process[Marchesiello and Estrade, 2010]. The GUI is mainly neg-ative everywhere due to the onshore geostrophic flowdriven by the large-scale alongshore pressure gradient re-sponsible for the downwelling signal commonly observedin the LC system [Woo et al., 2008; Pattiaratchi and Woo,2009; Rossi et al., 2013]. However, some spatiotemporalvariations of the geostrophic limitation are observed alongthe WA coastline. The GUI is clearly negative from Aprilto September, which is consistent with the period of maxi-mum transport in the LC [Feng et al., 2003]. For the rest ofthe year (September to the end of March), the GUI is less
Figure 4. Hovmöller diagrams (latitude versus time) of the surface geostrophic cross-shore velocitiesuG (positive values correspond to an offshore/westward current). Climatology of uG as deduced (a) fromthe whole SSH archive (1995-2010) alone and from its combination with a downward integration (0-100m) of the thermal wind law based (b) on CARS09 and (c) on WOA09 (see also section 2.2).
ROSSI ET AL.: SPORADIC UPWELLING OFF WESTERN AUSTRALIA
3614

intense, partly due to a shallow MLD and weaker LC (itselfinfluenced by the variable alongshore pressure gradient andthe opposing winds). There are also some specific periods/locations, where the geostrophic limitation is particularlystrong: Negative GUI (i.e., downwelling) is found duringthe late autumn period (May–July) between 21� and 24�Sand slightly later (June–September) further south around31–34�S (Figure 5b). At about 26.5�S, there is a band ofstrongly negative GUI almost all year long, diminishingonly for December/January. In contrast, at 25.5�S (April-July), at 28.5�S (April-November), and at 34�S (February-April) the GUI is null or even positive, resulting in no limi-tation or even offshore geostrophic transport, thus strength-ening the wind-driven upwelling.3.3.3. Climatological Analysis of the Mean CUI
[31] By summing up the individual components EUI þGUI ¼ CUI (Figure 5c), we can examine together thecombined variability of Ekman and geostrophic forcing.Overall, the CUI ranges from 630 m/day in our climatol-
ogy and decreases down to 610 m/day when annuallyaveraged. The extreme and mean values for the Leeuwinsystem are lower but consistent with the annual meanspresented in the four major upwelling systems wherestrong persistent upwelling occurs, reaching up to 25 m/day (Table 1). The negative average CUI (�2.3 m/day)and the complex patterns observed in the climatologyconfirm that upwelling is not a persistent feature butshows strong seasonality over the WA coast. In general,our results show that the upwelling season along the WAcoast is slightly longer than previously thought, goingfrom mid-August to mid-April along almost the wholewest coast. After the winter relaxation period, the upwell-ing favorable season starts earlier in the north, beginningfrom early August onward, whereas it starts only frommid-September in the south. The southern regions (30–35�S) appear almost equally favored but only during theupwelling season, whereas the situation is more con-trasted in the north. Upwelling is favored all year long at
Figure 5. Hovmöller diagrams (latitude versus time) of (a) the Ekman upwelling index (m/day, equiva-lent to vertical velocities), (b) the geostrophic upwelling index (m/day, equivalent to vertical velocities),and (c) composite upwelling index (in m/day of vertical velocities, a combination of the two previouscomponents). Red colors represent a balance of forces favoring upwelling events.
ROSSI ET AL.: SPORADIC UPWELLING OFF WESTERN AUSTRALIA
3615

some locations, probably due to the stronger alongshorewind stress than in the south, while there are other areasin which upwelling inhibited. There are indeed latitudinalbands, where the balance is particularly favorable for thedevelopment of upwelling: 22–23�S (Ningaloo reef)/25.5�S/28.5�S (Gelvink channel)/31.5�S and 34�S (CC).Surprisingly, there is a marked positive index from Aprilto August at 25.5�S and 28.5�S during the wind relaxa-tion period, probably due to the offshore geostrophiccomponent at this temporal/latitudinal window. On thecontrary, a negative balance favoring downwelling isobserved all year long south of Shark Bay (26.5�S),mainly due to the strong geostrophic limitation.
3.4. Occurrence of Sporadic Upwelling Events Overthe West-Australian Coast
[32] Based on this climatological analysis, and in accordwith previous studies [e.g., Pattiaratchi and Woo, 2009],sporadic upwelling should not be favored during autumn/early winter in the Ningaloo Peninsula region. However,the climatology of CUI is potentially underestimating theoccurrence of these processes due to their highly sporadicnature. Indeed, the averaging procedure to obtain our cli-matological indexes results in subsequent smoothing oftheir magnitude due to highly variable (positive and nega-tive) values. This is the reason why complementary infor-mation can be obtained through statistical analyses ofupwelling events based on a threshold of CUI (rather thansimple time averages).
[33] In order to test the reliability of the CUI and todefine a threshold index favoring upwelling, one can recordits evolution for specific upwelling events that have beenpreviously identified and thoroughly studied. In particular,Hanson et al. [2005] and Woo et al. [2006] have docu-mented a sporadic upwelling event based on a field surveyoff WA coast (including the Ningaloo Peninsula) duringNovember 2000. In addition, Lowe et al. [2012] presentedan outstanding remote-sensed evidence (SST, their Figure1) of a localized upwelling along the Ningaloo Peninsula inJanuary 2007. More recently, Rossi et al. [2013] clearlyshowed the occurrence of a localized upwelling and associ-ated countercoastal current (NC) over the southern Ninga-loo shelf in May 2010. We thus extracted the temporalevolution of a spatial mean of the CUI over the Ningalooregion during these three periods that have been previouslyidentified as ‘‘upwelling’’ (Figure 6). During these specificevents occurring, respectively, in late spring, early summer,and midautumn, the CUI increases from negative or weaklypositive values to strongly positive (>15 m/day). In partic-ular, concerning the event of May 2010, a clear raise of theindex (reaching 15 m/day or more) is observed from the 19
May till the end of May, coinciding with the observationalevidence of localized upwelling and current-reversal (NC)[Rossi et al., 2013]. Indeed, their observations tend to indi-cate that 3 days or more of upwelling favorable forcinggenerated coastal upwelling in this area. Based on the pre-vious observations (Figure 6), a CUI greater than 15 m/dayduring at least 3 days would be associated to coastalupwelling, independently of the season concerned.Although this threshold might potentially disregard theweak upwelling, all events of less than 3 days (and/or char-acterized by 0<CUI< 15) are ignored to focus only on thesignificant upwelling that are very likely to drive an oce-anic response.
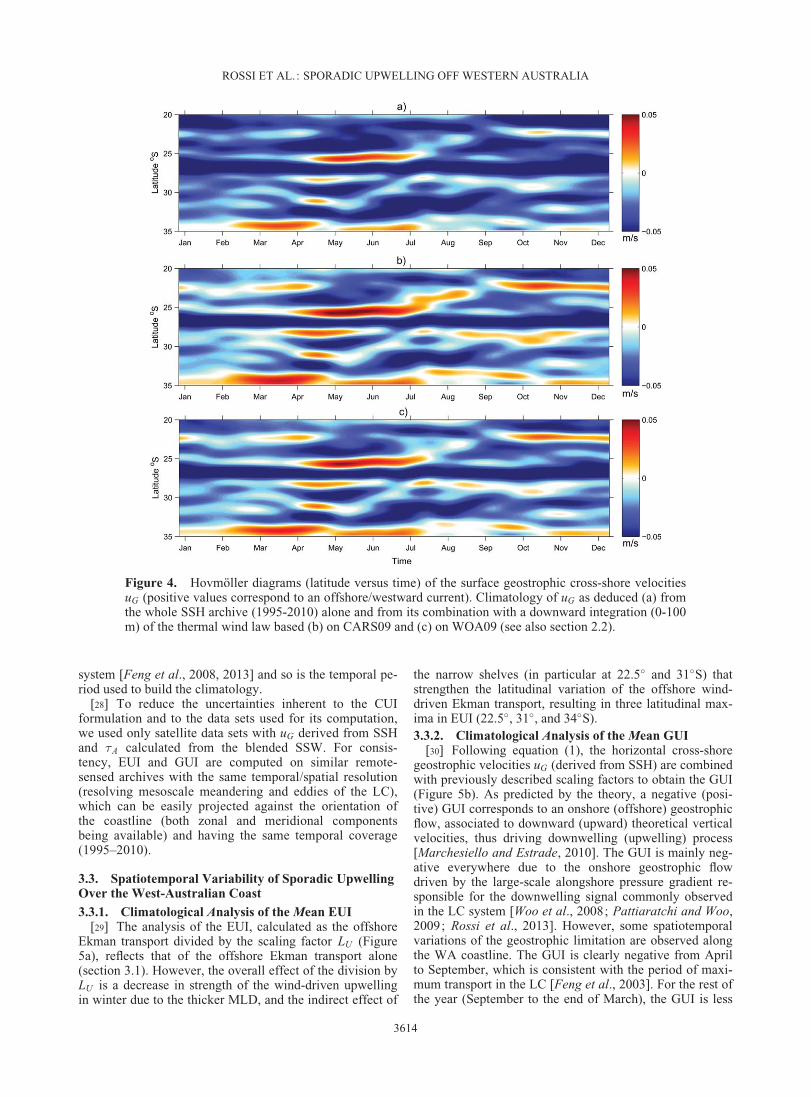
[34] Using a threshold of CUI� 15 m/s for a minimumperiod of 3 days, we monitor the number of events match-ing these criteria over the last 15 years (1995–2010). Theevents are counted over the period 1995–2010 by averagingthe CUI over an area of 2� in longitude and 0.25� in latitudealong the entire WA coast. Based on a climatological anal-ysis of 15 years of satellite data, the results show the meannumbers of upwelling favorable days per month (Figure7a) and per year (Figure 7b).
[35] The mean number of upwelling days per monthoscillates between 0 and 18 days, depending on the seasonand the location. The strong seasonality in the occurrenceof upwelling events is evidenced by a range of 8–18 daysof upwelling during the season (spring/summer, maximizedat certain latitudes), whereas it never exceeds 10 days dur-ing autumn/winter, except at the most favorable location.Whilst the upwelling season in the south is confined to thespring/summer months (October to mid-March), it is gener-ally longer further north since sporadic upwelling eventsstill occurs during the autumn/winter months. From Marchto September, there are between 5 and 11 days at 22.5�S,25.5�S, and 28.5�S, mainly due to the almost constantfavorable wind stress and the weak or even reverse onshoregeostrophic limitation during this period. Overall, based onthe mean number of favorable days per year for upwelling,the preferential latitudinal bands for upwelling are con-firmed: 22.5�S (�140 days/year), 28.5�S (�125 days/year), 31.5�S (�90 days/year), and 34�S (�70 days/year)(Figures 7a and 7b).
[36] A brief analysis of the duration of the events (notshown) reveals that about 90% of the total events moni-tored are comprised of 10 or less consecutive upwellingfavorable days (CUI> 15 m/day), whereas less than 10%of the events are longer than 10 days. Note there is onlyone location (22.5�S) where the duration of upwellingfavorable forcing is significantly higher, that is, �20% ofthe events monitored are longer than 10 days. Althoughstatistically occurring more in spring/summer, it is seenthat the latitude of Ningaloo reef (22.5�S) is in fact oneof the unique locations along the WA coast benefitingfrom upwelling events all year round (between 5 and 18days). Another interesting observation is the presence ofupwelling events during autumn/winter, between 4 and 10days per months, south of the Ningaloo peninsula(25.5�S). The model estimates that in the Ningalooregion, an average alongshore wind speed of �14 m/s isrequired for the CUI to reach a threshold of 15 m/day inwinter (June), whereas only speeds �9 m/s are needed insummer (December).
Table 1. Comparison of Annually Averaged CUI Between theWorld’s Eastern Boundary Current Systems (as Given by Marche-siello and Estrade [2010])
Mean CUI(m/day)
Leeuwin(20–35�S)
Humboldt(10–40�S)
Benguela(15–35�S)
Canary(20–40�N)
California(25–45�N)
Minimum 215 1 2 1 2Average 22.3 8.5 12 8 7Maximum 9 17 25 18 20
ROSSI ET AL.: SPORADIC UPWELLING OFF WESTERN AUSTRALIA
3616

4. Discussion
4.1. Index Formulation
[37] The occurrence of upwelling was investigated bystudying simultaneously Ekman divergence and geostrophicconvergence along the whole WA coast using density clima-tologies and remotely sensed wind and SSH data sets.Results from a recent modeling study (J. Xu, personal com-munication, 2012) indicated that the alongshore pressure gra-dient had a strong influence on the alongshore currents, butless so on the cross-shelf transport, itself well characterizedby simple Ekman theory. However, it is suggested thatEkman theory could not accurately predict the structure ofthe cross-shore transport along this coast as it is influencedby transient mesoscale features, the stratification and theshelf topography. Our approach derived from Marchesielloand Estrade [2010] is indeed particularly adapted since ittakes into account all the important parameters identifiedabove, including persistent mesoscale features and their dy-namical signatures. Additional effects could be included inour analytical model such as a parameterization of the under-current, of the wind-curl effect, of the bottom Ekman layerand the three dimensionality. Nevertheless, we believe ourindex is robust in the first order as it includes all the majorfactors operating in this region, allowing its future applica-tion to study the interannual/interdecadal variability, knownto strongly impact the WA shelves [Feng et al., 2013].
4.2. Variability of Ekman and GeostrophicCross-Shore Transports
[38] Supported by two complementary data sets, weshowed consistently that the alongshore wind stress is
upwelling-favorable almost all year long at various loca-tions along the coast (Figure 3). Strong to moderate theoret-ical offshore Ekman transport is obtained between 21.5�
and 26.5�S all year round, although intensified for the aus-tral spring and summer. From 26.5� to 31�S, the alongshorewind stress is strongly upwelling favorable during thespring and summer months and remains weak during lateautumn and winter. South of 31�S, the theoretical Ekmantransport is offshore from late spring to the end of thesummer, maximized at 34�S, in very good agreement withGersbach et al. [1999], while it shows neutral to reversedownwelling conditions during autumn/winter months. Thegeneral wind patterns are also in good agreement with thewind roses computed from land-based measurements byPattiaratchi and Woo [2009].
[39] Conversely to Smith et al. [1991]’s suggestion of aconstant alongshore geopotential gradient responsible fordriving the LC, we found that it shows important spatio-temporal variations (Figure 4), in accord with Godfrey andRidgway [1985]. However, the important variability of thegeostrophic limitation suggests a strong influence of meso-scale structures such as eddies and meanders of the LC, ingood agreement with the geostrophic inflow estimates ofWeller et al. [2011]. Based on both in situ and modeleddata, they showed that mesoscale variability generated dis-tinct zones of enhanced onshore/offshore transport alongthe shelf break. The latter statement is supported by theobservational study of Lowe et al. [2012] which evokesthat the alongshore geopotential gradient is not constantthroughout the year since there is no consistent phasingbetween the poleward flow and the alongshore wind stress.It also suggests that the circulation may sometimes be
Figure 6. Calibration of the composite upwelling index. CUI (m/day) time series off Ningaloo (a) dur-ing May 2010 [Rossi et al., 2013], (b) from mid-December 2006 to January 2007 [Lowe et al., 2012],and (c) from late October to early December 2000 [Hanson et al., 2005; Woo et al., 2006]. The upwell-ing periods, when CUI> 15 m/day (threshold symbolized by the black dotted line) are shaded in gray.
ROSSI ET AL.: SPORADIC UPWELLING OFF WESTERN AUSTRALIA
3617
strongly influenced by eddies, current meandering, andother mesoscale features that complicate the cross-shoreflow. Whether the seasonal variations of the LC intensityare modulated by the variations in the magnitude of theopposing seasonal wind stress, by the alongshore pressuregradient itself, or by a combination of both, is still subjectto debate.
[40] Alternating geostrophic flows were indeed found ataround 25–27�S, possibly related to the sharp change in theorientation of the coastline (see Figure 1), creating an off-shoot of the LC and favoring meandering and mesoscaleeddy formation [Rennie et al., 2007]. Marchesiello andEstrade [2010] also found that offshore flows usually occurdownstream of the major promontories in eastern-boundaryupwellings. Another hypothesis would be the influence ofthe Shark Bay outflow potentially driving density currentsoriginating from the inner shelf [Pattiaratchi et al., 2011].South of 28�S, we also observed transient weak onshoregeostrophic flow that can be associated with permanenteddy-like features forming around the Abrolhos archipel-ago, [Rennie et al., 2007; Meuleners et al., 2007].
[41] Seasonal variations in the source waters of the LCcould also help explain the variability of the geostrophicinflow. It is well known that the LC accelerates down thewest coast of Australia, with at least some of its watersourced from onshore geostrophic flow between 23� and30�S [Domingues et al., 2007; Meuleners et al., 2007].Smith et al. [1991] speculated that there may also be someseasonal variations in these source waters, with moreonshore entrainment of subtropical waters south of 23�Sduring late winter and conversely a more tropical water
source from the North West Shelf during autumn. This isconsistent with the measurements of Lowe et al. [2012],which showed that the LC peaks in autumn at 22�S, some-how earlier than further south. Our results also revealed astronger onshore geostrophic limitation in April-June northof 25�S, whereas it is translated later in June-August southof 30�S (see Figure 5b). Domingues et al. [2007] and Meul-eners et al. [2007] speculated that the late intensification ofthe LC south of 28�S is caused by onshore flow in late win-ter providing additional sources to the LC, leading tochange in its temperature and salinity signature by entrain-ment of cooler, more saline oceanic subtropical waters[Weller et al., 2011].
4.3. Factors Influencing the Ekman/GeostrophyBalance
[42] Overall, the CUI is positive during spring/summer,as a combined effect of the strong alongshore wind stressduring the austral spring/summer associated with a thinnerMLD, and weak or negative during autumn/winter months(Figure 5). Indeed, when resolving EUI þ GUI ¼ 0 (fol-lowing equation (1)) as a function of D for a given along-shore wind stress �a, we find that :
UG ¼ 2�a= �fDð Þ ð5Þ
[43] UG being inversely proportional to D, it indicatesthat for thicker D � MLDs, a weaker onshore geostrophiclimitation is needed to counteract the favorable wind forc-ing. However, the MLD effect is more puzzling since italso affects the source of the upwelled water. Indeed, Lowe
Figure 7. Climatological analysis of sporadic upwelling events. (a) Hovmöller (latitude versus time)diagram of the mean number of ‘‘upwelling days’’ (CUI> 15 m/day during 3 days or more) per monthand (b) mean number of ‘‘upwelling days’’ per year, recorded over the period 1995–2010.
ROSSI ET AL.: SPORADIC UPWELLING OFF WESTERN AUSTRALIA
3618

et al. [2012] suggested that the deeper MLD in autumn/winter is transferring the onshore Ekman return flow deeperbelow the MLD, favoring deeper origins of the upwelledwaters against a shallower source during the periods ofstrong summer stratification. This is also consistent withthe observations of Rossi et al. [2013] who estimate the ori-gin of upwelled waters up to 150 m in autumn, whereas itwas documented at only 100 m in the austral summer [Han-son et al., 2005].
[44] Another general observation is the higher CUI in thenorthern coastal areas of West Australia as compared to thesouthern ones. This can be related to the effect of a strongerwind stress in the lower latitudes overcoming the negativeinfluence of a thicker MLD. In addition, higher latitudeupwelling should be more affected by the geostrophic limi-tation. With D ¼ �
ffiffiffiffiffiffiffiffiffiffiffiffiffiffiffiffi2AV=jf j
p, equation (5) can be rewritten
as
UG ¼ 2�a= ��ffiffiffiffiffiffiffiffiffiffiffiffiffi2AV jf j
p� ð6Þ
which indicates that for a given wind stress �a, the oppos-ing geostrophic current required to compensate the Ekmantransport is larger at lower latitudes than at higher ones[Marchesiello and Estrade, 2010].
[45] Looking at equation (1), an extended shelf width(large LU ) will enhance the geostrophic onshore velocitiesand dampen the offshore Ekman transport equally. It is,however, necessary to include the continental shelf struc-ture in the model to account for the difference between theintense upwelling observed over narrow continental shelves(such as in the Humboldt system) and the weaker upwellingobserved over large and shallow shelves (such as in south-ern Morocco, as discussed by Marchesiello and Estrade[2010]). Note there is also the indirect effect of a widershelf on the mean position of the LC. Since the LC core ismore or less aligned with the shelf break [Pattiaratchi andWoo, 2009], its mean position and associated onshore geo-strophic limitation will be concentrated further from thecoast, thus providing a wider innershelf region for theEkman divergence to take place.
[46] The sensitivity of CUI to different values of parame-ters AV and AH has been tested and the analysis (not shown)revealed that LU (and thus CUI) is almost insensitive tosmall changes in the horizontal viscosity AH . However,CUI is significantly affected by the choices of AV . In partic-ular, a larger vertical viscosity results in deeper D � MLDand larger LU , which thus leads to a negative effect onupwelling development. Conversely, a lower vertical vis-cosity results in shallower D � MLD and smaller LU , thusenhancing the upwelling development.
4.4. Occurrence of Sporadic Upwelling Over the West-Australian Coast
[47] We have shown that contrary to prior belief sporadicupwelling along the WA coast is favored not only insummer months, but also roughly from mid-August to mid-April (Figure 7), extending the conclusions of Lowe et al.[2012] at the Ningaloo Peninsula. About 90% of therecorded events last between 3 and 10 days, thus coincidingwith the dominant timescale of wind forcing, within thesynoptic band of weather patterns (1–2 weeks) in the West-
ern Australia region [Cresswell et al., 1989; Pattiaratchiand Woo, 2009]. The transient upwelling events are indeedperiodically established because of the variations in theequatorward winds on a weekly timescale.
[48] Due to a combination of factors already mentioned(strong alongshore wind stress, limited onshore geostrophicflow and narrow continental shelves mainly), the latitudes22.5�, 28.5�, 31.5�, and 34�S benefit preferentially from anupwelling favorable balance. Sporadic upwelling eventshave been previously documented off the Ningaloo penin-sula [Hanson et al., 2005; Woo et al., 2006; Lowe et al.,2012], in the Geelvink Channel [Cresswell et al., 1989;Pattiaratchi and Woo, 2009], and in the southwest region[Pearce and Pattiaratchi, 1999; Gersbach et al., 1999] butnot yet over the narrow shelf north of Perth (31.5�S).
[49] When counting individual events, there are between8 and 18 upwelling favorable days per month duringspring/summer, whereas it is between 0 and 5 days inautumn/winter, except at specifically favored areas. Com-paring two of these locations along the WA coast, there arebetween 8 and 10 days favorable for upwelling per monthat 34�S almost exclusively during summer (November–April), whereas it is between 0 and 3 days for the rest ofthe year. At 22.5�S, both the timing and the amplitude ofthe events are different with upwelling favorable conditionsalmost all year long, characterized by 11–18 days in theupwelling season (September–March) and 6–8 days fromMay to July. Moreover, we found that in the Ningalooregion (22.5�S), the upwelling events are significantly lon-ger than anywhere on the coast, with about 20% of theevents lasting more than 15 days. Therefore, the steep con-tinental shelf offshore of the Ningaloo Peninsula, combinedwith the strong near-persistent alongshore wind and lowgeostrophic limitation appear to maximize the occurrenceand the duration of upwelling events there.
4.5. General Discussion
[50] These transient upwelling events are in general notable to directly feed the offshore waters through filamentformation and Ekman drift as in other typical eastern-boundary currents because of the presence of the LC.Hence, productive upwelled waters are likely to be con-fined inshore and advected northward in the coastal coun-tercurrent systems [e.g., Rossi et al., 2013], possiblycompensating for the localized character of these events.This might have important implications for the coastaloceanography of shelf and lagoon ecosystems as suggestedby Wyatt et al. [2012] who showed a strong link betweenthe activity of the fringing coral reef at Ningaloo (21.5–23�S) and the surrounding oceanographic conditions. Wehypothesize that Ningaloo reef and its associated fauna andflora benefit from enriched waters all year long because (i)during spring/summer, numerous sporadic upwellingevents happen locally and are associated with moderate nu-trient enrichment (shallow MLD) and (ii) during winter/autumn, transient upwelling events still occur locally, whilethe northward advection of upwelled waters further southadds a contribution, all being characterized by elevated nu-trient concentration (deep MLD and shallow low dissolvedoxygen/high nitrate (LDOHN) layer) [Rossi et al., 2013].These complex biophysical processes impacting the coastalproductivity of the world heritage listed Ningaloo peninsula
ROSSI ET AL.: SPORADIC UPWELLING OFF WESTERN AUSTRALIA
3619
provide new mechanisms to meet the nutritional require-ment from both shallow benthic communities of the reef[Wyatt et al., 2012] and their associated pelagic mega fauna[Taylor and Pearce, 1999].
[51] Finally, Moore et al. [2007] observed that only anti-cyclonic eddies carry elevated levels of inorganic nutrientsand biomass in the LC system. Dietze et al. [2009] sug-gested that this is due to the injection of enriched shelfwaters starting with the formation of eddies in April–May.It coincides with the presence of a shallow source ofnutrients [Rossi et al., 2013] and with the occurrence ofsporadic upwelling events. We speculate that anticycloniceddies, forming at preferential periods/locations, couldmatch sporadic upwelling events in space and time andthus entrain shelf enriched waters offshore. This associativemechanism might extend the influence of the coastal spo-radic upwelling events several hundred kilometers offshore.
5. Conclusions
[52] While the LC does not allow persistent upwellingalong the Western Australian coastline, sporadic upwellingevents were documented. In this work, we investigatedtheir occurrence along the entire coast over the seasonalcycle using high-resolution remotely sensed data. Transientevents lasting 3–10 days are likely to occur preferentiallyfrom September to April at specific latitudes, with 8–10upwelling days per month at 31.5�S and 34�S and up to 18days per month at 22.5�S for a longer period. Althoughgenerally favored during the spring/summer season, wehave shown that sporadic upwelling events do happen allyear long north of 30�S. At these locations (22.5�, 25.5�,and 28.5�S), the sparse winter/autumn events (2–8 upwell-ing days per month) are likely to provide higher nutrientinputs due to a deeper source beneath the MLD. However,it takes stronger wind forcing to uplift the deep nutrients inwinter. Overall, the Ningaloo region (22.5�S) cumulatesthe highest total number of upwelling days over 15 year pe-riod and is characterized by longer events.
[53] This high variability is mainly due to a combinationof: Near-consistent favorable wind stress in lower latitudes,important variations of the geostrophic limitation, seasonalchanges of the MLD, and local topographic factors. Toexplain the variability of the geostrophic limitation, severalhypotheses have been discussed such as a modification ofthe LC through subtropical geostrophic injection and theflow instabilities associated with meandering and meso-scale eddy formation.
[54] Overall, the biological impact of localized upwell-ing over the WA coast is a function of (a) the strength andduration of upwelling-favorable winds, (b) the intensity ofthe onshore limitation (driven by the LC and its associatedmesoscale structures), (c) the physical characteristicswithin the LC (e.g., MLD and nitracline, itself influencedby the presence of the LDOHN), and (d) the local topogra-phy. It suggests that nutrient enrichment might occur at anytime of the year at many locations on the WA coast whilebeing relatively short lived (�10 days) and of variablemagnitude.
[55] Acknowledgments. This research was supported under Austra-lian Research Council’s Discovery Project funding scheme (DP1093510)
which also supports V.R. acknowledges support from MICINN andFEDER through project ESCOLA (CTM2012-39025-C02-01) while revi-sing this paper. M.F. is supported by the CSIRO Wealth from OceansFlagship. The authors acknowledge J. Sudre who provided the satellite ar-chives. QuikSCAT and SeaWinds data are produced by Remote SensingSystems and sponsored by the NASA Ocean Vector Winds Science Team.The authors would like to thank the anonymous reviewers for their valua-ble comments that have substantially improved this manuscript.
ReferencesAntonov, J. I., D. Seidov, T. P. Boyer, R. A. Locarnini, A. V. Mishonov, H.
E. Garcia, O. K. Baranova, M. M. Zweng, and D. R. Johnson (2010),World Ocean Atlas 2009, vol. 2, Salinity, edited by S. Levitus, 184 pp.,NOAA Atlas NESDIS 69, U.S. Gov. Print. Off., Wash., D. C.
Alvarez, I., M. Gomez-Gesteira, M. deCastro, and J. M. Dias (2008), Spa-tio-temporal evolution of upwelling regime along the western coast ofthe Iberian Peninsula, J. Geophys. Res., 113, C07020, doi:10.1029/2008JC004744.
Bakun, A. (1990), Global climate change and intensification of coastalupwelling, Science, 247, 198–201, doi:10.1126/science.247.4939.198.
Cresswell, G. R., and T. J. Golding (1980), Observations of a south flowing cur-rent in the southeastern Indian Ocean, Deep Sea Res. Part A, 27, 449–466.
Cresswell, G. R., F. M. Boland, J. L. Peterson, and G. S. Wells (1989), Con-tinental shelf currents near the Abrolhos Islands, Western Australia,Aust. J. Mar. Freshwater Res., 40, 113–128.
Condie, S. A., and J. R. Dunn (2006), Seasonal characteristics of thesurface mixed layer in the Australasian region: Implications for pri-mary production regimes and biogeography, Mar. Freshwater Res.,57, 569–550.
Dietze, H., R. Matear, and T. Moore (2009), Nutrient supply to anticyclonicmeso-scale eddies off Western Australia estimated with artificial tracersreleased in a circulation model, Deep Sea Res. Part I, 56, 1440–1448.
Domingues, C. M., M. E. Maltrud, S. E. Wijffels, J. A. Church, and M.Tomczak (2007), Simulated Lagrangian pathways between the LeeuwinCurrent System and the upper-ocean circulation of the southeast IndianOcean, Deep Sea Res. Part II, 54(8–10), 797–817.
Feng, M., G. Meyers, A. F. Pearce, and S. Wijffels (2003), Annual andinterannual variations of the Leeuwin Current at 32�S, J. Geophys. Res.,108, 3355, doi:10.1029/2002JC001763.
Feng, M., A. Biastoch, C. Boning, N. Caputi, and G. Meyers (2008), Sea-sonal and interannual variations of upper ocean heat balance off the westcoast of Australia, J. Geophys. Res., 113, C12025, doi:10.1029/2008JC004908.
Feng, M., M. J. McPhaden, S.-P. Xie, and J. Hafner (2013), La Ni~na forcesunprecedented Leeuwin Current warming in 2011, Nat. Sci. Rep., 3,1277, doi:10.1038/srep01277.
Furnas, M. (2007), Intra-seasonal and inter-annual variations in phyto-plankton biomass, primary production and bacterial production at NorthWest Cape, Western Australia: Links to the 1997–1998 El Ni~no event,Cont. Shelf Res., 27, 958–980.
Gersbach, G. H., C. B. Pattiaratchi, G. N. Ivey, and G. R. Cresswell (1999),Upwelling on the south-west coast of Australia—Source of the Capescurrent?, Cont. Shelf Res., 19, 363–400.
Godfrey, J. S., and K. R. Ridgway (1985), The large-scale environment ofthe poleward-flowing Leeuwin Current, Western Australia: Longshoresteric height gradients, wind stresses and geostrophic flow, J. Phys. Oce-anogr., 15(5), 481–495.
Hanson, C. E., and A. D. McKinnon (2009), Pelagic ecology of the Ninga-loo region, Western Australia: Influence of the Leeuwin Current, J. R.Soc. West. Aust., 92, 129–137.
Hanson, C. E., C. B. Pattiaratchi, and A. M. Waite (2005), Sporadic upwell-ing on a downwelling coast: Phytoplankton responses to spatially vari-able nutrient dynamics off the Gascoyne region of Western Australia,Cont. Shelf Res., 25, 1561–1582.
Locarnini, R. A., A. V. Mishonov, J. I. Antonov, T. P. Boyer, H. E. Garcia,O. K. Baranova, M. M. Zweng, and D. R. Johnson, (2010), World OceanAtlas 2009, vol. 1, Temperature, edited by S. Levitus, 184 pp., NOAAAtlas NESDIS 68, U.S. Gov. Print. Off., Wash., D. C.
Lourey, M. J., J. R. Dunn, and J. Waring (2006), A mixed-layer nutrient cli-matology of Leeuwin Current and Western Australian shelf waters: Sea-sonal nutrient dynamics and biomass, J. Mar. Syst., 59, 25–51.
Lowe, R. J., G. N. Ivey, R. M. Brinkman, and N. L. Jones (2012), Seasonalcirculation and temperature variability near the North West Cape of Aus-tralia, J. Geophys. Res., 117, C04010, doi:10.1029/2011JC007653.
ROSSI ET AL.: SPORADIC UPWELLING OFF WESTERN AUSTRALIA
3620
Marchesiello, P., and P. Estrade (2010), Upwelling limitation by onshoregeostrophic flow, J. Mar. Res., 68, 37–62.
Meuleners, M. J., C. B. Pattiaratchi, and G. N. Ivey (2007), Numericalmodelling of the mean flow characteristics of the Leeuwin current sys-tem, Deep Sea Res. Part II, 54, 837–858.
Moore, T. S., S. Thomas, R. J. Matear, J. Marra, and L. Clementson (2007),Phytoplankton variability off the Western Australian Coast: Mesoscaleeddies and their role in cross-shelf exchange, Deep Sea Res. Part II, 54,943–960.
Nykjaer, L., and L. Van Camp (1994), Seasonal and interannual variabilityof coastal upwelling along northwest Africa and Portugal from 1981 to1991, J. Geophys. Res., 99, 14,197–14,208.
Pattiaratchi, C., and M. Woo (2009), The mean state of the Leeuwin Cur-rent system between North West Cape and Cape Leeuwin, J. R. Soc.West. Aust., 92, 221–241.
Pattiaratchi, C., B. Hollings, M. Woo, and T. Welhena (2011), Dense shelfwater formation along the south-west Australian inner shelf, Geophys.Res. Lett., 38, L10609, doi:10.1029/2011GL046816.
Pauly, D., and V. Christensen (1995), Primary production required to sus-tain global fisheries, Nature, 374, 255–257.
Pearce, A., and C. Pattiaratchi (1999), The Capes Current: A summer coun-tercurrent flowing past Cape Leeuwin and Cape Naturaliste, WesternAustralia, Cont. Shelf Res., 19(3), 401–420.
Pickett, M. H., W. Tang, L. K. Rosenfeld, and C. H. Wash (2003), QuikS-CAT satellite comparison with nearshore buoy wind data off the U.S.west coast, J. Atmos. Oceanic Technol., 20, 1869–1879.
Rennie, S. J., C. Pattiaratchi, and R. D. McCauley (2007), Eddy formationthrough the interaction between the Leeuwin Current, Leeuwin Under-current and topography, Deep Sea Res. Part II, 54, 818–836.
Ridgway, K. R., and S. A. Condie (2004), The 5500-km-long boundaryflow off western and southern Australia, J. Geophys. Res., 109, C04017,doi:10.1029/2003JC001921.
Rio, M.-H., P. Schaeffer, G. Moreaux, J.-M. Lemoine, and E. Bronner(2009), A new mean dynamic topography computed over the globalocean from GRACE data, altimetry and in-situ measurements, paperpresented at OceanObs’09 Symposium, Venice, Italy, IOC/UNESCOand ESA.
Rossi, V., M. Feng, C. Pattiaratchi, M. Roughan, and A. M. Waite (2013),Linking synoptic forcing and local mesoscale processes with biologicaldynamics off Ningaloo Reef, J. Geophys. Res. Oceans, 118,doi:10.1002/jgrc.20110.
Rousseaux, C. S. G., R. Lowe, M. Feng, A. M. Waite, and P. A. Thompson(2012), The role of the Leeuwin Current and mixed layer depth on theautumn phytoplankton bloom off Ningaloo Reef, Western Australia,Cont. Shelf Res., 32, 22–35.
Smith, R. L., A. Huyer, J. S. Godfrey, and J. A. Church (1991), The Leeu-win current off Western Australia, 1986–1987, J. Phys. Oceanogr., 21,323–345.
Sudre, J., C. Maes, and V. Garcon (2013), On the global estimates of geo-strophic and Ekman surface currents, Limnol. Oceanogr. Fluids Envi-ron., 3, 1–20.
Taylor, J. G., and A. F. Pearce, (1999), Ningaloo Reef currents: Implica-tions for coral spawn dispersal, zooplankton and whale shark abundance,J. R. Soc. West. Aust., 82, 57–65.
Thompson, R. O. R. Y. (1987), Continental shelf—Scale model of theLeeuwin current, J. Mar. Res., 45, 813–827.
Weaver, A. J., and J. H. Middleton (1989), On the dynamics of the Leeuwincurrent, J. Phys. Oceanogr., 19, 626–648.
Weller, E., D. Holliday, M. Feng, L. Beckley, and P. A. Thompson (2011),A continental shelf scale examination of the Leeuwin Current off West-ern Australia during the austral autumn-winter, Cont. Shelf Res., 31,1858–1868.
Woo, M., and C. B. Pattiaratchi (2008), Hydrography and watersmasses off the Western Australian coast, Deep Sea Res. Part I, 55,1090–1104.
Woo, M., C. B. Pattiaratchi, and W. Schroeder (2006), Summer surface cir-culation along the Gascoyne continental shelf, Western Australia, Cont.Shelf Res., 26, 132–152.
Wyatt, A. S. J., J. L. Falter, R. J. Lowe, S. Humphries, and A. M. Waite(2012), Oceanographic forcing of nutrient uptake and release over afringing coral reef, Limnol. Oceanogr., 57(2), 401–419.
Zhang, H.-M., J. J. Bates, and R. W. Reynolds (2006), Assessment of com-posite global sampling: Sea surface wind speed, Geophys. Res. Lett., 33,L17714, doi:10.1029/2006GL027086.
ROSSI ET AL.: SPORADIC UPWELLING OFF WESTERN AUSTRALIA
3621