on the evolution of the water ocean in the plate-mantle system
TRANSCRIPT

RESEARCH ARTICLE Open Access
On the evolution of the water ocean in theplate-mantle systemTakashi Nakagawa1,2* , Hikaru Iwamori3,5, Ryunosuke Yanagi4 and Atsushi Nakao5
Abstract
Here, we investigate a possible scenario of surface seawater evolution in the numerical simulations of surface platemotion driven by mantle dynamics, including thermo-chemical convection and water migration, from the early topresent-day Earth to constrain the total amount of water in the planetary system. To assess the validity of two hypothesesof the total amount of water inferred from early planetary formation processes and mineral physics, weexamine the model sensitivity to the total water in the planetary system (both surface and deep interior) up to 15ocean masses. To explain the current size of the reservoir of surface seawater, the predictions based on the numericalsimulations of hydrous mantle convection suggest that the total amount of water should range from 9 to 12 oceanmasses. Incorporating the dense hydrous magnesium silicate (DHMS) with a recently discovered hydrous mineral atlower mantle pressures (phase H) indicates that the physical mechanism of the mantle water cycle would not besignificantly influenced, but the water storage region would be expanded in addition to the mantle transition zone.The DHMS solubility field may have a limited impact on the partitioning of water in the Earth’s deep mantle.
Keywords: Ocean mass, Water solubility, Dense hydrous magnesium sillicate (DHMS), Plate motion, Mantle dynamics
IntroductionUnderstanding the water ocean on the Earth’s surface isessential for understanding the habitability of Earth-likeplanets (Maruyama et al. 2013). Geological records sug-gest that the Earth’s surface seawater likely formed be-tween 3.8 Ga and 4.5 Ga based on the appearance ofmetamorphic rocks derived from sedimentary rocks (oneline of evidence that water was present on the Earth’ssurface) and the initiation of plate tectonics, as sug-gested by zircon dating (Appel et al. 1998; Maruyamaand Komiya 2011; Mojzsis et al. 2001; Valley et al. 2014).However, although constraining the initiation of platetectonics is very important for determining when waterstarted to be transported into the deep planetary interior,this timing remains debated, with estimates rangingfrom 2.5 to 4.3 Ga (Condie 2016; Hopkins et al. 2008).To reconcile such geological evidence related to the sur-vival of the water ocean over a period of ~ 4 billion
years, it is crucial to understand the size of the surfaceseawater reservoir. There are two hypotheses regardingthe size of the reservoir that influences the evolution ofthe water ocean from the early to present-day Earth: (1)estimates based on cosmochemical and geochemicalanalyses of chondritic material and the modeling of theformation of a water ocean as a result of the solidifica-tion of a surface magma ocean (Marty 2012; Hamano etal. 2013) and (2) petrological estimates of the actualwater content of the mantle (e.g., Hirschmann 2006). Inthe early planetary formation hypothesis, the totalamount of water in the planetary system after the com-pletion of early planetary formation or the solidificationof the surface magma ocean ranges from 5 to 15 oceanmasses, which means that a very large amount of wateris expected to reside in the mantle (Marty et al. 2012;Hamano et al. 2013). Petrological estimates suggest thatthe mantle water content may range from 0.2 to 2.3ocean masses. By adding seawater on the surface, even-tually, it turns out that the total present amount of waterin the planetary system should be approximately 1.2 to3.3 ocean masses (Hirschmann 2006).During the evolution of surface seawater over time,
surface plate motions may play an important role, as has
* Correspondence: [email protected] of Mathematical Science and Advanced Technology, JapanAgency for Marine-Earth Science and Technology, 3173-25, Showa-machi,Yokohama 236-0001, Japan2Department of Earth Sciences, University of Hong Kong, Pokfulam Road,Hong Kong, Hong KongFull list of author information is available at the end of the article
Progress in Earth and Planetary Science
© The Author(s). 2018 Open Access This article is distributed under the terms of the Creative Commons Attribution 4.0International License (http://creativecommons.org/licenses/by/4.0/), which permits unrestricted use, distribution, andreproduction in any medium, provided you give appropriate credit to the original author(s) and the source, provide a link tothe Creative Commons license, and indicate if changes were made.
Nakagawa et al. Progress in Earth and Planetary Science (2018) 5:51 https://doi.org/10.1186/s40645-018-0209-2
been implied by geological records (e.g., Maruyama andOkamoto 2007) and numerical modeling (e.g., Rüpke etal. 2004; Iwamori 2007). The evolution of surfaceseawater in the plate-mantle system has also been com-puted in semi-analytical models (Crowley et al. 2011;Sandu et al. 2011; Korenaga 2011). In such models, thepartitioning of water between the surface and the deepmantle is determined by the flux balance of water uptake(regassing) by plate subduction and degassing beneathmid-ocean ridges. This modeling results in an estimateof the total water mass in the planetary system of ~2 to3 ocean masses and consistent with petrological mea-surements (Hirschmann 2006).However, our previous studies have indicated that
the evolution of the mantle water mass cannot be de-termined with a simple regassing-degassing balance,which essentially incorporates the excess watertransport associated with the dehydration reaction(Nakagawa et al. 2015; Nakagawa and Spiegelman2017; Nakagawa and Iwamori 2017). Hence, the watersolubility limit of each mantle mineral should be in-cluded to compute the excess water in the dehydra-tion reaction. By considering this effect, our previousstudies have indicated that the mantle water evolutionmay be strongly regulated by the water solubilitylimits of upper mantle minerals. In addition, therheological properties of hydrous mantle rocks mayaffect the behavior of surface plate motion, with hy-drous mantle conditions allowing for more vigoroussurface plate motion and a much larger friction coef-ficient than dry mantle conditions (Nakagawa andIwamori 2017). Such vigorous surface plate motioninduced by a pseudo-plastic rheology may transportlarge amounts of water (i.e., several ocean masses)into the deep mantle over geologic timescales (ap-proximately 2 billion years), and the mantle transitionzone can absorb this amount of water over geologictimescales (Nakagawa and Iwamori 2017). Therefore,the total reservoir size of water at the surface and inthe deep interior should be resolved in a plate-mantlesystem using numerical mantle convection simulationsthat include the water solubility limits of mantleminerals.The issues identified in our previous studies include
three model assumptions: (1) The boundary condition ofmantle water transport is assumed to be an infinite res-ervoir of water, which is not a realistic situation. To im-prove the boundary condition of the mantle watertransport, the lifetime and amount of water ocean in theplanetary system associated with surface plate motionsshould be evaluated. (2) Defining the water solubilitylimits of mantle minerals, we only assume those of theupper mantle minerals and assign a constant value tothose of the lower mantle minerals. In the lower mantle,
the existence of dense hydrous magnesium silicate(DHMS) has previously been established (e.g., Ohtaniet al. 2001), and according to recent mineral physicsmeasurements, a new hydrous phase that is stableunder lower mantle conditions has been found, whichis a DHMS phase called “phase H.” This DHMS mayaffect the evolution of the mantle water mass because,for instance, the solubility limit of phase H is veryhigh (~ 12 wt.%; Nishi et al. 2014; Ohtani et al. 2014;Ohira et al. 2014). (3) Moreover, the pseudo-plasticyielding associated with hydrous mantle rocks isaddressed as a reduction in the bulk value of theyield strength of oceanic lithosphere. More realistic-ally, the water-weakening effect on hydrous mantlerocks likely only influences the friction coefficient,not the bulk yield strength of the oceanic lithosphere(Gerya et al. 2008).The aim of this study is to resolve the issues that arose
from our previous study and thereby reveal a possiblescenario of the evolution of surface seawater in aplate-mantle system via numerical mantle convectionsimulations with water migration processes, includingthe computation of a finite amount of water at the sur-face, the water solubility limit of DHMS (including phaseH), and the improved pseudo-plastic yielding of theoceanic lithosphere associated with hydrous mantlerocks. Using this modeling approach, we can resolvewhich hypothesis is preferable for understanding the sur-vival time of surface seawater.
Methods/ExperimentalMantle convection simulationsThe numerical modeling of global-scale mantle dy-namics with water migration has been described byNakagawa et al. (2015) and Nakagawa and Spiegelman(2017). This process is briefly described here. Weassume the thermo-chemical multiphase mantleconvection of a compressible and truncated anelasticapproximation in a 2D spherical annulus geometry(Hernlund and Tackley 2008). The modeled mantlecan be decomposed into depleted harzburgite andenriched basaltic material composed of two-phasetransition systems, i.e., olivine-spinel-bridgmanite-post-perovskite and pyroxene-garnet-bridgmanite-post-perovskite, which are associated with changes in thebasaltic material. A reference state for each phasetransition system is computed as in Tackley (1996).All phase transition parameters can be found inNakagawa and Tackley (2011). A partial melting effectis included to create an oceanic crust and to allow itssegregation. The viscosity of the modeled mantle isdependent on temperature, pressure, water content,and yield strength and is determined via the followingequations:
Nakagawa et al. Progress in Earth and Planetary Science (2018) 5:51 Page 2 of 16

ηd ¼ Ad
Xnphase¼3;4
i; j¼1Δη
Γij fij exp
Ed þ pVd
RT
� �ð1Þ
ηw ¼ AwCw
Cw;ref
� �−1Xnphase¼3;4
i; j¼1Δη
Γij f j
ij expEw þ pVw
RT
� �
ð2Þ
ηY ¼ σY p;Cwð Þ2_e
ð3Þ
η ¼ 1ηd
þ 1ηw
þ 1ηY
� �−1
ð4Þ
where Ad,w is the prefactor determined by T = 1600 Kand the ambient pressure at the surface (the subscripts dand w indicate dry and hydrous mantle, respectively),Ed,w is the activation energy; Vd,w is the activation vol-ume; Cw is the water content in the mantle; Cw,ref is thereference water content and is assumed to be 620 ppm(Arcey et al. 2005); the exponent of the prefactor, whichis dependent on the water content, is based on the re-sults of deformation experiments (Mei and Kohlstedt2000) and is assumed to be 1; Γij is the phase function; fis the basaltic composition (varying from 0 to 1); R isthe gas constant (8.314 J K mol−1); T is the temperature;p is the pressure; σY(p,Cw) is the yield strength of theoceanic lithosphere, which is a function of pressure andwater content; _e is the second invariant of the strain ratetensor; and Δηij is the viscosity jump associated with thephase transition, which is assumed to increase by 30times during the phase transition from ringwoodite orgarnet to bridgmanite.The yield strength of oceanic lithosphere is dependent
on pressure and the mantle water content and is deter-mined as follows:
σY p;Cwð Þ ¼ CY þ μ Cwð Þp; μ Cwð Þ ¼ min 1;Cw
Cw;ref
� �−1" #
μ0
ð5Þwhere μ0 is the Byerlee-type friction coefficient. We in-clude only the water-weakening effect caused by hy-drated rocks (Gerya et al. 2008).Another important influence of hydrated mantle rocks
is the variation in density caused by hydrated mantleminerals, as noted by Nakagawa et al. (2015):
ρ Tad; p;C;Cwð Þ ¼ ρ Tad;C; pð Þ 1−α Tad;C; pð Þ T−Tadð Þð Þ−ΔρwCw
ð6Þwhere ρ(Tad,C, z) is the combined reference density be-tween harzburgite and mid-ocean ridge basalt (MORB)compositions, with a 2.7% density difference, as shown inFig. 1 (and a 3.6% density difference between olivine- andpyroxene-related phases); Tad is the adiabatic temperature
in the mantle; Δρw is the density variation due to the watercontent; and Cw is the water content. Generally, the dens-ities of hydrous minerals are less than those of dry minerals,but the value of Δρw is less constrained by high-pressure/high-temperature (high P-T) experiments; the densities ofhydrous minerals are generally 0.1 to 1.0% less than thoseof dry mantle minerals (Richard and Iwamori 2010).To solve the equations of thermo-chemical mantle
convection and to model the chemical composition, weuse the numerical code of a finite-volume multigrid flowsolver with tracer particles (StagYY; Tackley 2008). Todetermine the water migration processes, the tracer par-ticle approach is used for the water advection processand degassing process via volcanic eruptions, and a nu-merical scheme involving a discrete migration velocityapproximation is used for the dehydration process (Iwa-mori and Nakakuki 2013; Nakagawa et al. 2015; Nakaoet al. 2016; Nakagawa and Spiegelman 2017). The dehy-dration process is modeled as the upward migration ofexcess water, which is defined as the difference betweenthe actual water content and the water solubility at acertain temperature and pressure in a grid (see Fig. 2 inNakagawa et al. 2015); this upward migration may havea velocity comparable to that of fluid movement in fullytwo-phase flow modeling (Wilson et al. 2014), whichranges from 0.5 to 50 m/year. Although this may affectthe numerical resolution of the model, it should nothave a significant influence on the results based on anassessment of the Appendix of Nakagawa and Iwamori(2017). Note that our model of water migration allowsfor migration only in the vertical direction, whereas inWilson et al. (2014), the fluid component may migrateappreciably in the horizontal direction over several tensof kilometers near the corner of a mantle wedge. Thisconventional scheme seems to be valid for global-scalewater circulation in a convecting mantle. In addition, wealso assume the water partitioning of partially moltenmaterial, as in Nakagawa et al. (2015) and Nakagawaand Spiegelman (2017). The partition coefficient ofwater between solid mantle material and melt is set to0.01 (Aubaud et al. 2008). In the numerical scheme ofmaterial transportation in Nakagawa and Iwamori(2017), two distinct compositional types of tracers areassumed, which can track the water migration for eachcomposition separately; however, here, the chemicalcomposition assigned to each tracer continuously varieswith arbitrary melting (see Rozel et al. 2017; Lourenço etal. 2018). Hence, the water migration should be trackedusing a bulk composition, which is given as:
S T ; P;Cð Þ ¼ SPeridotite T ; Pð Þ 1−Cð Þ þ SBasalt T ; Pð ÞCð7Þ
where Speridotite and Sbasalt are the water solubilities of
Nakagawa et al. Progress in Earth and Planetary Science (2018) 5:51 Page 3 of 16

mantle peridotite and oceanic crust as functions oftemperature and pressure, respectively, and C is the bas-altic fraction. This represents a major difference betweenthis study and Nakagawa and Iwamori (2017). The dif-ference between the two different melting approaches isdiscussed in Appendix.The numerical setup used in this study is described as
follows: 1024 (azimuthal) × 128 (radial) grid points withfour million tracers are used to track the chemical com-position, melt fraction, and mantle water content. Theboundary conditions for temperature are fixed tempera-tures at the surface (300 K) and the core-mantle boundary(CMB; 4000 K). The initial conditions include an adiabatictemperature of 2000 K at the surface plus a thin thermalboundary layer (to explain the thermal boundary condi-tions at the surface and CMB), a basaltic composition of20%, and a dry mantle (zero water content). The compos-ition of the mantle is assumed to be uniform so that par-tial melting can create heterogeneous features in themantle. The mantle can become hydrated up to theboundary conditions of the mantle water content
(described in the “Computing the water ocean mass”) viasurface plate motion.
Water solubility mapsFigure 1 shows the maximum H2O content of themantle peridotite system based on the work of Iwamori(2004, 2007) and Nakagawa et al. (2015) (Fig. 1a) and in-cludes the stability fields of hydrous phases that arestable at lower mantle conditions (Fig. 1b). These dataare used to compute the excess water migration in theconvecting mantle. At the lower mantle condition, with-out DHMS solubility, the water solubility of the lowermantle minerals is set as 100 wt. ppm. With DHMSsolubility, in addition to the existing DHMS (phases Ato D), because a new hydrous mineral phase has recentlybeen discovered to exist at lower mantle pressures, i.e.,“phase H” (Komabayashi and Omori 2006; Nishi et al.2014; Ohira et al. 2014; Walter et al. 2015; Ohtani 2015),we have added the stability field of DHMS includingphase H to the water solubility map of the mantle peri-dotite system (Fig. 1c). Compared to the water solubility
Fig. 1 a Water solubility maps of the mantle. Upper mantle only (Iwamori 2007). b The full range of mantle temperatures and pressures. Linesindicate cold (blue), average (green), and hot (red) mantle geotherms for cases of 12 ocean masses of total water without (a) or with (b) DHMS effects.c Fitting for determining the water solubility of phase H included in b (Nishi et al. 2014; Ohtani et al. 2014; Ohira et al. 2014; Ohira et al. 2016)
Nakagawa et al. Progress in Earth and Planetary Science (2018) 5:51 Page 4 of 16

map for pressures of less than 28 GPa (Iwamori 2004,2007), few experimental results are available for pres-sures of greater than 28 GPa to constrain the exactphase boundaries and the maximum amount of H2O inthe peridotite system. The effect of aluminum on thestability of DHMS including phase H depends on thepartitioning of Al among mantle minerals, includingDHMS, phase H, and δ-AlOOH, which is currentlypoorly constrained. For instance, we assume that the sta-bility of phase H in the natural peridotite system is simi-lar to that of the pure MgSiO4H2 phase H (Ohira et al.2016), which can be used to establish a minimum P-Tstability range. Considering the bulk peridotite compos-ition and the maximum modal amount of phase H inthe peridotite system, we estimate that the maximumH2O content in the phase H-bearing P-T range is8 wt.%. At pressures and temperatures higher than thestability field of DHMS with phase H, we set a max-imum H2O content of 100 ppm below the solidus (e.g.,Panero et al. 2015) and 0 ppm above the solidus, as inNakagawa et al. (2015).
Computing the water ocean massIn a previous study (Nakagawa and Iwamori 2017), weassumed a fixed boundary condition for mantle watermigration in terms of the water ocean mass, such as afixed value of 1.4 × 10²¹ kg (one ocean mass). This isnot very realistic for understanding geologic records ofthe evolution of the water ocean associated with surfaceplate motion (e.g., Maruyama et al. 2013). To formulatea finite reservoir of surface seawater with a box modelassumption, the mass of the water reservoir can be com-puted as:
Xw;s ¼ Xw;total−Xw;m FR; FH ; FGð Þ ð8Þwhere Xw, s is the mass of the water ocean, Xw, total is themass of the total amount of water in the system, and Xw,
m is the mass of mantle water as a function of regassing(FR), dehydration (FH), and degassing (FG). The bound-ary condition of mantle water migration at the surface isdescribed as follows:
Cw surfaceð Þ ¼ Cw;sol 300 K ; surfaceð Þ if Xw;s > 00 if Xw;s ¼ 0
�
ð9Þwhere Cw, sol(300K, surface) is the water solubility ofmantle rocks at the surface.
ResultsAll physical parameters used in this study are listed inTable 1. This study examines a total of 20 cases that varywith the total amount of water in the planetary system(3 to 15 ocean masses) and the strength of the oceanic
lithosphere. The parameters used in each case are listedin Table 2. First, we examine the effect of DHMS in con-junction with a large reservoir of surface seawater. Sec-ond, we examine the two hypotheses of the total amountof water in the planetary system. Third, the strength ofthe oceanic lithosphere is investigated by varying thefriction coefficient (μ0) from 0.1 to 0.6. This range repre-sents the suggested range of lithospheric strength in-ferred from island loading (0.2–0.75; Zhong and Watts2013). The minimum friction coefficient is based on thevalue associated with stable plate-like behavior in a drymantle convection model (~ 0.13; Moresi and Solomatov1998). All numerical simulations are performed for ap-proximately 4.6 billion years.
Chemical-hydrous structure with effects of DHMSFigure 2 shows the chemical-hydrous structure of themantle with and without the water solubility effects ofDHMS at t = 4.6 billion years and for μ0 = 0.2, with anassumed total water volume of 12 ocean masses in theplanetary system (exosphere plus interior). In both cases,extremely high-viscosity structures are found in the
Table 1 Physical parameters
Symbol Meaning Value
η0 Reference viscosity 1021 (Pa s)
Δη Viscosity jump 30
ρ0 Reference density 3300 (kg m−3)
Δρw Density anomalies due tomantle water content
4.125 (kg m−3)
g0 Gravity 9.8 (m s−2)
α0 Reference thermal expansivity 5 × 10⁻⁵ (K−1)
κ0 Reference thermal diffusivity 7 × 10⁻⁷ (m2 s−1)
ΔTsa Temperature scale 2500 (K)
Ts Surface temperature 300 (K)
TCMB Temperature at the CMB 4000 (K)
Cp Heat capacity 1250 (J kg−1 K−1)
Lm Latent heat 6.25 × 10⁵ (J kg−1)
H Internal heating rate 5.2 × 10⁻¹² (W kg−1)
CY Cohesion stress 10 (MPa)
Ed Activation energy of dry mantle 290 (kJ mol−1)
Vd Activation volume of dry mantle 2.4 × 10⁻⁶ (m3 mol−1)
Ew Activation energy of wet mantle 380 (kJ mol−1)
Vw Activation volume of wet mantle 4 × 10⁻⁶ (m3 mol−1)
R Gas constant 8.134 (J K−1 mol−1)
D Thickness of mantle 2890 (km)
The Rayleigh number is computed as ρ0g0α0ΔTsaD3/κ0η0~1.4 × 108 with values
listed in Table 1. Activation energy and volume for dry mantle are taken fromYamazaki and Karato (2001) and for wet mantle are taken from Korenaga andKarato (2008). Results are not changed with rheological parameters taken fromKarato and Wu (1993) for wet mantle. The latent heat shown here is used fortemperature feedback caused by partial melting (Xie and Tackley 2004)
Nakagawa et al. Progress in Earth and Planetary Science (2018) 5:51 Page 5 of 16
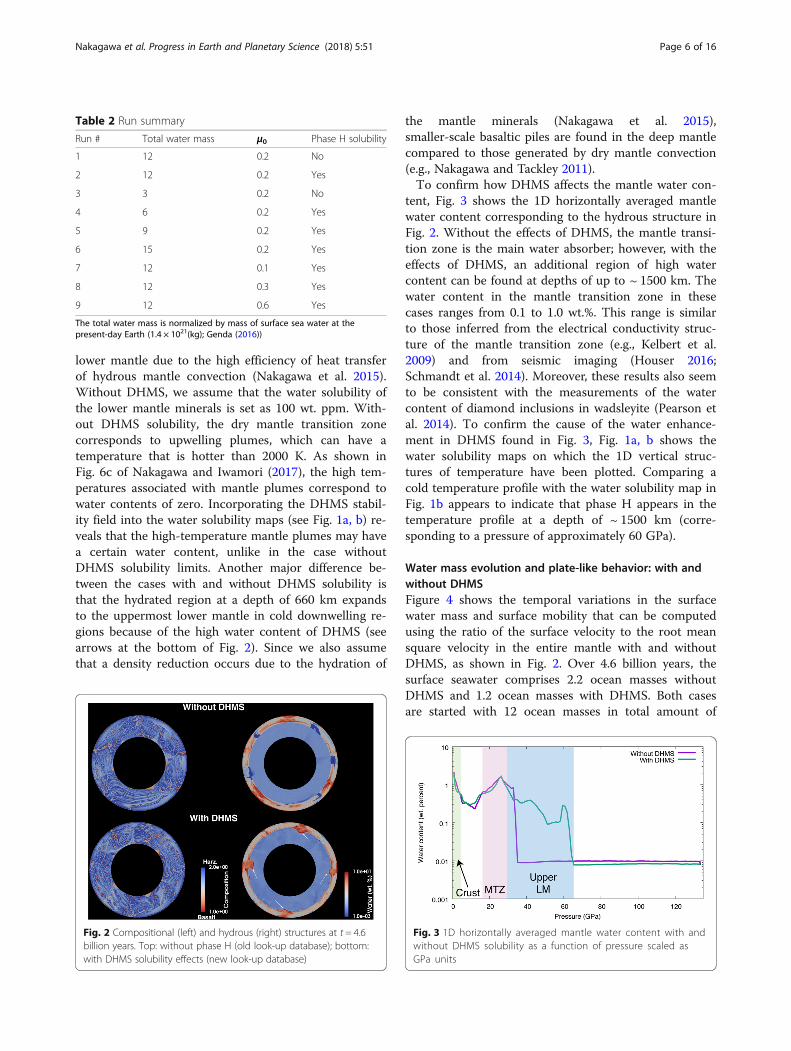
lower mantle due to the high efficiency of heat transferof hydrous mantle convection (Nakagawa et al. 2015).Without DHMS, we assume that the water solubility ofthe lower mantle minerals is set as 100 wt. ppm. With-out DHMS solubility, the dry mantle transition zonecorresponds to upwelling plumes, which can have atemperature that is hotter than 2000 K. As shown inFig. 6c of Nakagawa and Iwamori (2017), the high tem-peratures associated with mantle plumes correspond towater contents of zero. Incorporating the DHMS stabil-ity field into the water solubility maps (see Fig. 1a, b) re-veals that the high-temperature mantle plumes may havea certain water content, unlike in the case withoutDHMS solubility limits. Another major difference be-tween the cases with and without DHMS solubility isthat the hydrated region at a depth of 660 km expandsto the uppermost lower mantle in cold downwelling re-gions because of the high water content of DHMS (seearrows at the bottom of Fig. 2). Since we also assumethat a density reduction occurs due to the hydration of
the mantle minerals (Nakagawa et al. 2015),smaller-scale basaltic piles are found in the deep mantlecompared to those generated by dry mantle convection(e.g., Nakagawa and Tackley 2011).To confirm how DHMS affects the mantle water con-
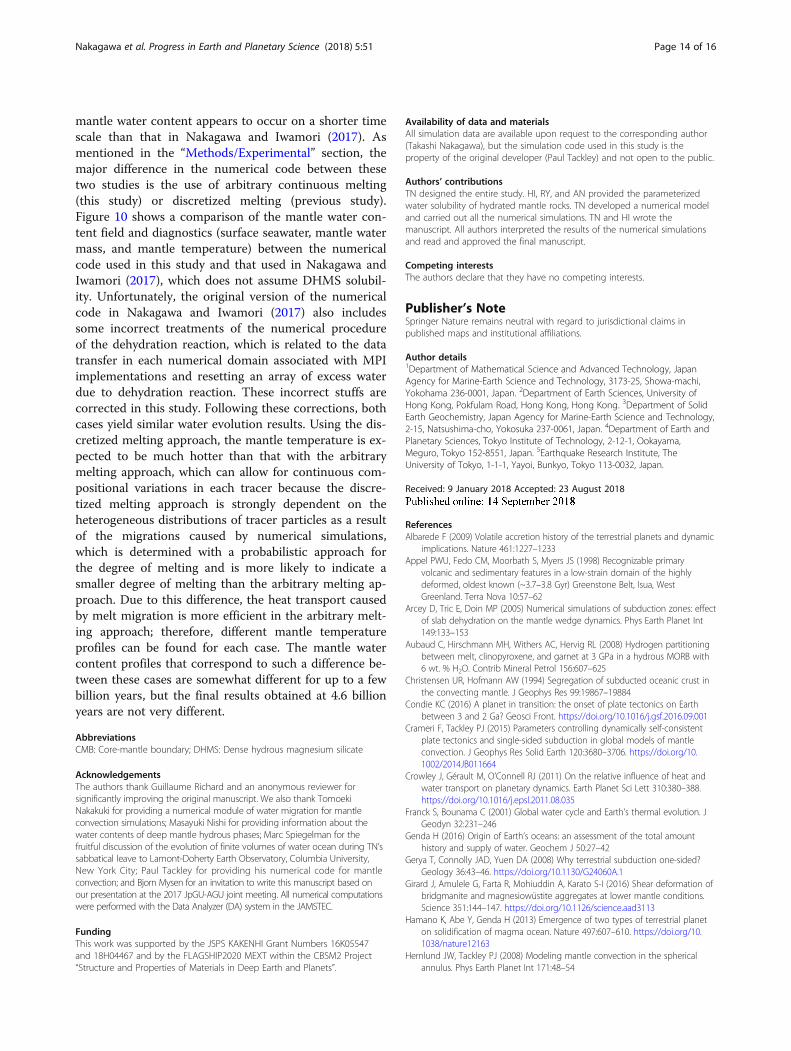
tent, Fig. 3 shows the 1D horizontally averaged mantlewater content corresponding to the hydrous structure inFig. 2. Without the effects of DHMS, the mantle transi-tion zone is the main water absorber; however, with theeffects of DHMS, an additional region of high watercontent can be found at depths of up to ~ 1500 km. Thewater content in the mantle transition zone in thesecases ranges from 0.1 to 1.0 wt.%. This range is similarto those inferred from the electrical conductivity struc-ture of the mantle transition zone (e.g., Kelbert et al.2009) and from seismic imaging (Houser 2016;Schmandt et al. 2014). Moreover, these results also seemto be consistent with the measurements of the watercontent of diamond inclusions in wadsleyite (Pearson etal. 2014). To confirm the cause of the water enhance-ment in DHMS found in Fig. 3, Fig. 1a, b shows thewater solubility maps on which the 1D vertical struc-tures of temperature have been plotted. Comparing acold temperature profile with the water solubility map inFig. 1b appears to indicate that phase H appears in thetemperature profile at a depth of ~ 1500 km (corre-sponding to a pressure of approximately 60 GPa).
Water mass evolution and plate-like behavior: with andwithout DHMSFigure 4 shows the temporal variations in the surfacewater mass and surface mobility that can be computedusing the ratio of the surface velocity to the root meansquare velocity in the entire mantle with and withoutDHMS, as shown in Fig. 2. Over 4.6 billion years, thesurface seawater comprises 2.2 ocean masses withoutDHMS and 1.2 ocean masses with DHMS. Both casesare started with 12 ocean masses in total amount of
Table 2 Run summary
Run # Total water mass μ0 Phase H solubility
1 12 0.2 No
2 12 0.2 Yes
3 3 0.2 No
4 6 0.2 Yes
5 9 0.2 Yes
6 15 0.2 Yes
7 12 0.1 Yes
8 12 0.3 Yes
9 12 0.6 Yes
The total water mass is normalized by mass of surface sea water at thepresent-day Earth (1.4 × 10²¹(kg); Genda (2016))
Fig. 2 Compositional (left) and hydrous (right) structures at t = 4.6billion years. Top: without phase H (old look-up database); bottom:with DHMS solubility effects (new look-up database)
Fig. 3 1D horizontally averaged mantle water content with andwithout DHMS solubility as a function of pressure scaled asGPa units
Nakagawa et al. Progress in Earth and Planetary Science (2018) 5:51 Page 6 of 16

water. This means that, for the mantle water mass, 9.8ocean masses without DHMS and 10.8 ocean masseswith DHMS are absorbed in the mantle. Therefore,when the DHMS effect is included, this water is morelikely to be partitioned into the deep mantle to matchthe constraint on the present-day Earth’s ocean mass. InFigs. 1b and 3, with DHMS, more water can be absorbedin the upper lower mantle compared to a case withoutDHMS, which is caused by phase D and/or phase H.However, as shown in Table 3 of Iwamori (2007), themaximum amount of water that can be stored is 9 to 11ocean masses, assuming that the maximum H2O contentin the lower mantle is 100 ppm and assuming an averagegeotherm corresponding to that beneath 60 Ma oceanic
lithosphere with a mantle potential temperature of1300 °C (Iwamori 2007). This may suggest that theDHMS plays a minor role in the mantle water mass,which contributes at most to ~ 1 ocean mass of watermass in the whole mantle because the effects of DHMSonly appeared in the cold subducting regions.Figure 5 shows the mantle water fluxes (ingassing, de-
hydration, and degassing) as a function of time with andwithout DHMS. The procedures for computing thesewater fluxes can be found in Nakagawa and Iwamori(2017) and Nakagawa and Spiegelman (2017). They aregiven as follows:
FR ¼
ZS
ρmuzCwdS if uz < 0ð Þ
0 if uz ≥0ð Þ
8><>: ð10Þ
FG ¼ _MeruptCw;erupt ð11Þ
FE ¼ZS
ρmCw;exuf dS ð12Þ
where ρm is the mantle density; _Merupt is the total massof erupted material; Cw is the water content; uz is the ra-dial velocity; Cw,erupt is the water content of the eruptedmaterial, which is equivalent to the water content of themolten material; Cw, ex is the excess water content rela-tive to the water solubility; and uf is the conventionalform of fluid migration velocity expressed numerically,
Fig. 4 Temporal variations in the mass of surface seawater with andwithout DHMS effects
Fig. 5 Water flux diagnostics with and without DHMS solubility as function of time. a Ingassing. b Dehydration. c Degassing
Nakagawa et al. Progress in Earth and Planetary Science (2018) 5:51 Page 7 of 16

which is computed as the ratio of the radial grid spacingto the time step size but is not very sensitive to the gridspacing shown in the Appendix of Nakagawa and Iwa-mori (2017), and the subscripts of those fluxes are R =ingassing, G = degassing, and E = dehydration. Basically,the uptake of water from the surface reservoir by platesubduction is the dominant flux process, with a magni-tude on the order of 1013 kg/year, with the two otherfluxes involving the release of water at the surface of ap-proximately an order of magnitude lower than that in-volved in the uptake process. Thus, the surface seawateris gradually reduced by the ingassing process with sur-face plate motion. These profiles of water fluxes withoutDHMS are not very different from those in a case withthe DHMS solubility field because the effective depth ofthe mantle water cycle associated with those fluxes is ap-proximately 150 to 200 km (Nakagawa and Spiegelman2017). This means that the DHMS solubility field is lesssensitive to the physical processes of the mantle watercycle.To assess the model sensitivities to the total amount
of water in the planetary system, Fig. 6 shows the tem-poral variations in the surface seawater, mantle mass,and surface mobility with DHMS, which indicate thatthe surface seawater completely dries up before reachingthe age of the Earth for a total amount of water of lessthan nine ocean masses. This implies that the totalamount of water in the planetary system should be
preferably in about 12 ocean masses, for the surface sea-water to be consistent with the surface seawater on thepresent-day Earth. This preferred amount of water coin-cides with the storage capacity of the silicate mantle, asmentioned above (Iwamori 2007), although the mantletemperature reproduced in this study (e.g., Fig. 1) islower than the 60 Ma geotherm assumed by Iwamori(2007). This indicates that (1) DHMS in the lowermantle, which was ignored in Iwamori (2007), plays aminor role, and (2) the present-day mantle could containa maximum amount of water due to continuous hydra-tion (Fig. 6). As discussed in the the “Introduction,” thetotal amount of water in the Earth system has been esti-mated to be 1.2 to 3.3 ocean masses, which is based onthe water contents of oceanic basalts (mid-ocean ridgebasalts (MORB) and ocean island basalts (OIB)) and as-sumes that the entire mantle is sampled by MORB andOIB (Hirschmann 2006). While the upper mantle com-prises the MORB source, OIB likely represents only apart of the crust-mantle cycling system (e.g., White andHofmann 1982; Christensen and Hofmann 1994). Theapparent difference in the estimated amount of water(i.e., 10–12 vs. 1.2–3.3 ocean masses) could be due tothe regions that are not sampled by either MORB orOIB.Regarding the surface mobility, which is one diagnostic
for assessing the occurrence of plate-like behavior and iscomputed as the ratio of surface velocity to the root
Fig. 6 Temporal variations in the mass of a surface seawater, b mantle temperature, and c surface mobility varying with the total amount ofwater in the entire planetary system. For cases with 12 and 15 ocean masses, the mantle behaviors (water content and surface mobility) are thesame due to the remaining surface seawater
Nakagawa et al. Progress in Earth and Planetary Science (2018) 5:51 Page 8 of 16

mean square of the convective velocity of the entiremantle (bottom of Fig. 6), it appears to not change verymuch after all the surface seawater is absorbed into thedeep mantle. This suggests that the surface seawaterfound on the Earth’s surface is not strongly correlatedwith the occurrence of surface plate motion. To confirmthis hypothesis, Fig. 7 shows the sensitivity of the totalamount of water to water fluxes, which indicates thatthe degassing flux is still active when the surface sea-water is exhausted. This suggests that the surface sea-water could be regenerated with mantle degassing, andthe water-weakening effect is still valid but that it is im-mediately returned to the deep mantle via plate subduc-tion. Therefore, surface plate motion will still be veryactive even if all surface seawater is exhausted.
Water mass evolution: model sensitivity to the strengthof the oceanic lithosphereFigure 8 shows the temporal variations in both the sur-face and mantle water masses over 4.6 billion years fordifferent friction coefficients (0.1, 0.2, 0.3, and 0.6) corre-sponding to different strengths of oceanic lithosphere.All of the cases shown here include the solubility effectsof DHMS. For weaker oceanic lithosphere (μ0 = 0.1 and0.2), the surface seawater can be partitioned with a simi-lar value as the present-day Earth’s ocean mass over 4billion years. On the other hand, for stronger oceaniclithosphere (μ0 = 0.3 and 0.6), the amount of surface
seawater still remains at approximately five oceanmasses. This mechanism can be explained by themass-averaged temperature profile as a function of timeas shown in Fig. 7b, c. In weaker oceanic lithosphere,heat transport is more efficient due to the vigorous sur-face plate motion and large number of plate boundaries(Nakagawa and Iwamori 2017). The mantle temperatureis cold enough to pass into the water solubility field ofDHMS with phase H. However, stronger oceanic litho-sphere cases indicate higher mantle temperatures, sothat the mantle temperature does not pass into the watersolubility field of DHMS. To confirm this implication,Fig. 9 shows the 1D horizontally averaged mantle watercontent as a function of pressure. For weaker oceaniclithosphere, a high water content region can be found atboth the mantle transition zone and upper lower mantlecorresponding to DHMS solubility. In contrast, forstronger oceanic lithosphere, water enhancement is onlyfound in the mantle transition zone. This is caused bythe difference in mantle temperatures shown in Fig. 7band the heat transfer efficiency of plate-mantledynamics.
DiscussionFindingsThe findings from this study are described as follows:
1. The presence of DHMS may have a limited impact
Fig. 7 Water flux diagnostics as a function of time varying with the total amount of water in the entire system as a function of time. a Ingassing.b Dehydration. c Degassing
Nakagawa et al. Progress in Earth and Planetary Science (2018) 5:51 Page 9 of 16

on the evolution of surface seawater but is not verydifferent from that of the physical processes of themantle water cycle. The physical mechanism of themantle water cycle is strongly regulated by the chokepoint of the water solubility of the mantle minerals(Nakagawa and Spiegelman 2017). However, theDHMS may play some role in expanding the storageregion of water transported by plate subduction.Quantitatively, a water reservoir with a water contentof 0.1 wt.% is located in the upper lower mantle dueto DHMS solubility. To discuss the consistency be-tween this amount and the realistic hydrous
conditions of the Earth, more observational and ex-perimental measurements are required.
2. The survival time of surface seawater is dependenton the total amount of water in the entire planetarysystem and the strength of the oceanic lithosphere.To partition water into the surface reservoir with thepresent-day mass of the surface seawater on theEarth’s surface, the entire planetary system shouldcontain ten ocean masses or more, although moreaccurate knowledge about mantle hydrous phases isrequired. However, the total amount of water in theplanetary system would be reduced if the strength ofthe oceanic lithosphere was slightly stronger but alarge amount of water (~ 7 ocean masses) wasabsorbed in the deep mantle. This finding, i.e., that alarge amount of water is required for the early Earth,is consistent with an estimate derived from the ex-perimental measurements of chondritic material andinferences based on the solidification of the surfacemagma ocean during early planetary formation(Marty 2012; Hamano et al. 2013). The totalabsorbed amount of water in the mantle is also con-sistent with the estimate obtained based on the ma-terial properties of mantle rocks along the realisticgeotherm (Iwamori 2007). These results are consist-ent because the water budget in the mantle is pri-marily controlled by the water released bydehydration reactions rather than that released by
Fig. 8 Temporal variations in the mass of a surface seawater, b mantle temperature, and c surface mobility varying with the friction coefficient ofthe yield strength of the oceanic lithosphere. The total amount of water is fixed as 12 ocean masses
Fig. 9 1D horizontally averaged mantle water content varying withthe friction coefficient of the yield strength of the oceaniclithosphere as a function of pressure scaled as GPa units
Nakagawa et al. Progress in Earth and Planetary Science (2018) 5:51 Page 10 of 16

degassing effects, which has been the main focus ofsimplified models of hydrous mantle evolution (Franckand Bounama 2001; Rüpke et al. 2004; Crowley et al.2011; Sandu et al. 2011; Korenaga 2011)
DHMS and other potential mechanisms of water transportinto the deep mantleFirst, the stability fields of DHMS including phase Hthat are stable under lower mantle pressure conditionsare poorly constrained, as was described earlier in the“Water solubility map” section. In this study, our stabil-ity field of phase H corresponds to that of Ohira et al.(2016) and features a minimum stability field of 70 to80 GPa. If the stability field is raised to more than100 GPa and higher temperatures, more water can betransported via plate subduction, which may shorten thelifetime of surface seawater; to achieve an Earth-likeplanet, more water is required in the system.Second, other potential host minerals of water exist in
the deep mantle, such as δ-AlOOH (Ohira et al. 2014)or pyrite-type FeOOH (Nishi et al. 2017). These min-erals appear to be stable at typical lower mantle temper-atures and pressures. However, the amount of water thatthese minerals can retain in the deep mantle remainsunclear. The possible water solubilities of the lowermantle minerals, including phase H, δ-AlOOH, andpyrite-type FeOOH, which could potentially be accur-ately determined via experiments, could greatly influencethe survival time of surface seawater. The inclusion of add-itional lower mantle minerals could result in a much shorterseawater survival time than that observed in the cases exam-ined in this study. Note that the volume-averaged watercontent of the lower mantle is be expected to be ~ 100 ppmor less (Karato 2011; Panero et al. 2015), but these estimatesremain highly controversial and are dependent on identify-ing the possible host minerals of water in the deep lowermantle. Therefore, these estimates should be determinedmore quantitatively to resolve this issue.Third, a hydrogen diffusion mechanism is also a sig-
nificant process in the mantle water cycle (Richard et al.2002, 2006) and is still unresolved in this study. Numer-ical modeling results suggest that hydrogen diffusionseems to saturate the mantle with water on a muchshorter timescale than that without incorporating hydro-gen diffusion (Nakagawa 2017). The incorporation of awater-saturated mantle leads to a steady state in the evo-lution of surface seawater induced by the mantle watercycle. As a result, the lifetime of surface seawater can beexpected to be longer in this study.Moreover, the rheological properties of the hydrous
lower mantle are highly uncertain because of the diffi-culty of experimental determination, even for dry mantleconditions (e.g., Girard et al. 2016). Under dry mantle
conditions, the lower mantle minerals are expected toexhibit the shear localization mechanism with diffusioncreep deformation (Girard et al. 2016). However, it is un-clear whether this type of deformation mechanism oc-curs under hydrous lower mantle conditions. If therheological properties of the lower mantle are similar tothose of the upper mantle, more water could be trans-ported into the deep mantle, and the lifetime of surfaceseawater may be shorter due to the more vigorous con-vective dynamics in the lower mantle.
Strength of the oceanic lithosphereAs indicated in Fig. 7, the friction coefficient has a greatinfluence on the partitioning of water between the sur-face and deep mantle reservoir; more surface seawater isabsorbed in conjunction with smaller friction coefficients(weaker oceanic lithosphere) because the mantletemperature is sufficiently cold so that both the mantletransition zone and upper lower mantle may be workedas large water reservoirs (see Fig. 8). Hence, a largeamount of water should be required when the strengthof oceanic lithosphere is very weak; however, using therange of friction coefficients suggested by observationaldata analysis (up to 0.7; Zhong and Watts 2013), thetotal amount of water in the entire system could be re-duced but still be larger than those of the suggested bysimple parameterized convection models (e.g., Sandu et al.2011). However, it should be noted that a weaker oceaniclithosphere is preferable for understanding the plate-likebehavior in a dry mantle convection system (μ0 < 0.1;Moresi and Solomatov 1998; Crameri and Tackley 2015).Moreover, in this study, we incorporate the effect of“water weakening” to reduce the yield strength of theoceanic lithosphere under a water-saturated situation.
Total amount of water in the planetary systemIn most geodynamic models with water circulation, thepartitioning of water between surface seawater and thedeep mantle at the present is assumed to range from 1:1to 1:2 (Franck and Bounama 2001; Rüpke et al. 2004;Sandu et al. 2011; Korenaga 2011), which is consistentwith the results of the mineral physics experiments(Hirschmann 2006). In particular, Franck and Bounama(2001) also suggested that the lifetime of surface sea-water may be dependent on the efficiency of regassingcaused by plate subduction. However, in this study, theregassing flux is automatically regulated by the watersolubility map, including the “choke point” observed at adepth of 150 to 200 km, which is reduced by up to a feworders of magnitude for the regassing flux at this depth.The most important issue in those geodynamic modelsis that it is difficult to account for the water solubility ofmantle minerals, and the water cycle is assumed to in-volve only degassing for the water release from the deep
Nakagawa et al. Progress in Earth and Planetary Science (2018) 5:51 Page 11 of 16

interior to the exosphere and water uptake by the regas-sing process from the surface to the deep mantle. Inaddition, degassing is assumed to occur only alongmid-ocean ridges but should also occur along islandarcs. Furthermore, the scaling relationship is based onlyon heat transfer in steady-state mantle convection,which is only applicable for cases with less vigorousmantle convection. Therefore, simplified mantle dynam-ics models with water circulation underestimate boththe regassing flux and the degassing flux and thereforerequire a smaller amount of total water in the entireplanetary system (~ 3 ocean masses) than the amountinferred from early planetary formation estimates (5 to15 ocean masses). To avoid these underestimates causedby the assumption of scaling relationships inplate-mantle dynamics, we conducted a series of fullmantle convection simulations with water migration, in-cluding actual water solubility maps for deep mantleminerals. The results indicate that a large amount ofwater is needed in the planetary system to achieve a con-sistent lifetime of surface seawater in the plate-mantlesystem. This finding is consistent with the estimates ofthe total amount of water in the entire planetary systeminferred from early planetary formation processes.However, this argument leads to issues related to the
sources of the volatile components in the early Earthand their initial amounts (e.g., Albarede 2009). In Naka-gawa and Spiegelman (2017), these issues did not affectthe initial amount of water in the deep mantle, but thedeep mantle should contain a certain amount of water,as illustrated in the water solubility maps of the mantleminerals. These issues remain in models of the earlythermal and chemical state of the planetary mantle thatdo not start from a full magma ocean condition (a fullymolten mantle is expected to have been present in theearly Earth). To further resolve these issues, the initialstate of mantle convection should be seriously examinedin a future study that assumes initially fully moltenmantle conditions (Lourenço et al. 2016) and thenchecks the consistency of these conditions with the the-oretical estimates of the size of the water reservoir at thesurface (Hamano et al. 2013).Finally, the following evolution of surface seawater as-
sociated with a plate-mantle system is proposed; a cer-tain amount of water (volatiles) is delivered to the planetbefore or after the magma ocean forms (potentially by agiant impact or late veneer accretion, see review byGenda (2016)). After the magma ocean solidifies, surfaceseawater forms. The partition ratio of water between thesurface and the deep mantle is dependent on the watersolubility of the deep mantle, which is in turn dependenton the temperature and composition of the early Earth’smantle. Vigorous surface plate motion can transport sur-face water into the deep mantle; however, because of the
high temperatures in the deep mantle, relatively littlewater stays in the deep mantle. When the mantle is suf-ficiently cooled by mantle convection, the water trans-ported via plate subduction can be stored in the mantletransition zone and the uppermost lower mantle, therebygradually reducing the volume of surface water to thepresent-day amount. Although this conceptual modelwould be slightly modified by a better understanding ofthe global-scale mantle water circulation and more ac-curate water solubility limits of lower mantle mineral as-semblage, it is overall a robust model.
ConclusionsIn this study, the evolution of surface seawater in theplate-mantle system with the effects of deep mantlewater solubility (e.g., DHMS) is investigated to resolvethe controversial issue of the total amount of water inthe entire planetary system. The conclusions are as fol-lows:
1. The DHMS solubility field may have a small im-pact on the evolution of surface seawater but is notvery sensitive to the physical mechanism of themantle water cycle because the mantle water cycle iseffective up to a depth of 150~200 km, which ismuch shallower than the DHMS solubility field.
2. In numerical simulations, the total amount ofwater in the entire planetary system should begreater than at least 7 to 12 ocean masses, which isconsistent with the water mass estimate based onearly planetary formation (Marty 2012; Hamano etal. 2013) and a petrological estimate that includes arealistic maximum H2O solubility of mantle materialalong the slab geotherm (after Iwamori 2007). Themain mechanism of the large amount of water re-quired in the entire system is the incorporation ofwater solubility maps so that the dehydration processcan be addressed in numerical mantle convectionsimulations.
3. DHMS including phase H may represent an add-itional water reservoir in the deep mantle and mayaffect the evolution of surface seawater on the pre-sent-day Earth. To better estimate the seawater evolu-tion, more accurate constraints on the stability andamount of water stored in DHMS, phase H, and otherhydrous minerals (e.g., δ-AlOOH and pyrite-typeFeOOH) in the actual mantle are required.
In this study, we successfully computed the evolutionof surface seawater in the plate-mantle system caused byhydrous mantle convection and incorporate the solubil-ity fields of hydrous mineral phases in the deep mantle,such as the DHMS. However, it must be noted that dueto the global scale of the model, it is very difficult to
Nakagawa et al. Progress in Earth and Planetary Science (2018) 5:51 Page 12 of 16

resolve the detailed physical and chemical processes oc-curring in the mantle wedge as in Nakao et al. (2016,2018) and van Keken et al. (2011); therefore, some sig-nificant improvements are required to reveal the geo-logical and petrological constraints on mantle waterevolution, which requires future investigation.
Appendix AComparison between Nakagawa and Iwamori (2017) andthe current studyAll of the results in this study are very different fromthose presented in Nakagawa and Iwamori (2017). Inparticular, as shown in Fig. 6, the sudden change in the
Fig. 10 a Mantle water content taken at 3.1 billion years computed from two different numerical codes without assuming DHMS solubility (left:current version of numerical code; right: the version used in Nakagawa and Iwamori (2017) but corrected for significant issues with the dehydrationreaction) and their diagnostics (b evolution of surface seawater, c mantle water mass, and d mantle temperature) as a function of time. On the legendof diagnostics plots, new represents a result from the numerical code used in this study and old represents a result from the numerical code used inNakagawa and Iwamori (2017)
Nakagawa et al. Progress in Earth and Planetary Science (2018) 5:51 Page 13 of 16
mantle water content appears to occur on a shorter timescale than that in Nakagawa and Iwamori (2017). Asmentioned in the “Methods/Experimental” section, themajor difference in the numerical code between thesetwo studies is the use of arbitrary continuous melting(this study) or discretized melting (previous study).Figure 10 shows a comparison of the mantle water con-tent field and diagnostics (surface seawater, mantle watermass, and mantle temperature) between the numericalcode used in this study and that used in Nakagawa andIwamori (2017), which does not assume DHMS solubil-ity. Unfortunately, the original version of the numericalcode in Nakagawa and Iwamori (2017) also includessome incorrect treatments of the numerical procedureof the dehydration reaction, which is related to the datatransfer in each numerical domain associated with MPIimplementations and resetting an array of excess waterdue to dehydration reaction. These incorrect stuffs arecorrected in this study. Following these corrections, bothcases yield similar water evolution results. Using the dis-cretized melting approach, the mantle temperature is ex-pected to be much hotter than that with the arbitrarymelting approach, which can allow for continuous com-positional variations in each tracer because the discre-tized melting approach is strongly dependent on theheterogeneous distributions of tracer particles as a resultof the migrations caused by numerical simulations,which is determined with a probabilistic approach forthe degree of melting and is more likely to indicate asmaller degree of melting than the arbitrary melting ap-proach. Due to this difference, the heat transport causedby melt migration is more efficient in the arbitrary melt-ing approach; therefore, different mantle temperatureprofiles can be found for each case. The mantle watercontent profiles that correspond to such a difference be-tween these cases are somewhat different for up to a fewbillion years, but the final results obtained at 4.6 billionyears are not very different.
AbbreviationsCMB: Core-mantle boundary; DHMS: Dense hydrous magnesium silicate
AcknowledgementsThe authors thank Guillaume Richard and an anonymous reviewer forsignificantly improving the original manuscript. We also thank TomoekiNakakuki for providing a numerical module of water migration for mantleconvection simulations; Masayuki Nishi for providing information about thewater contents of deep mantle hydrous phases; Marc Spiegelman for thefruitful discussion of the evolution of finite volumes of water ocean during TN’ssabbatical leave to Lamont-Doherty Earth Observatory, Columbia University,New York City; Paul Tackley for providing his numerical code for mantleconvection; and Bjorn Mysen for an invitation to write this manuscript based onour presentation at the 2017 JpGU-AGU joint meeting. All numerical computationswere performed with the Data Analyzer (DA) system in the JAMSTEC.
FundingThis work was supported by the JSPS KAKENHI Grant Numbers 16K05547and 18H04467 and by the FLAGSHIP2020 MEXT within the CBSM2 Project“Structure and Properties of Materials in Deep Earth and Planets”.
Availability of data and materialsAll simulation data are available upon request to the corresponding author(Takashi Nakagawa), but the simulation code used in this study is theproperty of the original developer (Paul Tackley) and not open to the public.
Authors’ contributionsTN designed the entire study. HI, RY, and AN provided the parameterizedwater solubility of hydrated mantle rocks. TN developed a numerical modeland carried out all the numerical simulations. TN and HI wrote themanuscript. All authors interpreted the results of the numerical simulationsand read and approved the final manuscript.
Competing interestsThe authors declare that they have no competing interests.
Publisher’s NoteSpringer Nature remains neutral with regard to jurisdictional claims inpublished maps and institutional affiliations.
Author details1Department of Mathematical Science and Advanced Technology, JapanAgency for Marine-Earth Science and Technology, 3173-25, Showa-machi,Yokohama 236-0001, Japan. 2Department of Earth Sciences, University ofHong Kong, Pokfulam Road, Hong Kong, Hong Kong. 3Department of SolidEarth Geochemistry, Japan Agency for Marine-Earth Science and Technology,2-15, Natsushima-cho, Yokosuka 237-0061, Japan. 4Department of Earth andPlanetary Sciences, Tokyo Institute of Technology, 2-12-1, Ookayama,Meguro, Tokyo 152-8551, Japan. 5Earthquake Research Institute, TheUniversity of Tokyo, 1-1-1, Yayoi, Bunkyo, Tokyo 113-0032, Japan.
Received: 9 January 2018 Accepted: 23 August 2018
ReferencesAlbarede F (2009) Volatile accretion history of the terrestrial planets and dynamic
implications. Nature 461:1227–1233Appel PWU, Fedo CM, Moorbath S, Myers JS (1998) Recognizable primary
volcanic and sedimentary features in a low-strain domain of the highlydeformed, oldest known (~3.7–3.8 Gyr) Greenstone Belt, Isua, WestGreenland. Terra Nova 10:57–62
Arcey D, Tric E, Doin MP (2005) Numerical simulations of subduction zones: effectof slab dehydration on the mantle wedge dynamics. Phys Earth Planet Int149:133–153
Aubaud C, Hirschmann MH, Withers AC, Hervig RL (2008) Hydrogen partitioningbetween melt, clinopyroxene, and garnet at 3 GPa in a hydrous MORB with6 wt. % H2O. Contrib Mineral Petrol 156:607–625
Christensen UR, Hofmann AW (1994) Segregation of subducted oceanic crust inthe convecting mantle. J Geophys Res 99:19867–19884
Condie KC (2016) A planet in transition: the onset of plate tectonics on Earthbetween 3 and 2 Ga? Geosci Front. https://doi.org/10.1016/j.gsf.2016.09.001
Crameri F, Tackley PJ (2015) Parameters controlling dynamically self-consistentplate tectonics and single-sided subduction in global models of mantleconvection. J Geophys Res Solid Earth 120:3680–3706. https://doi.org/10.1002/2014JB011664
Crowley J, Gérault M, O’Connell RJ (2011) On the relative influence of heat andwater transport on planetary dynamics. Earth Planet Sci Lett 310:380–388.https://doi.org/10.1016/j.epsl.2011.08.035
Franck S, Bounama C (2001) Global water cycle and Earth’s thermal evolution. JGeodyn 32:231–246
Genda H (2016) Origin of Earth’s oceans: an assessment of the total amounthistory and supply of water. Geochem J 50:27–42
Gerya T, Connolly JAD, Yuen DA (2008) Why terrestrial subduction one-sided?Geology 36:43–46. https://doi.org/10.1130/G24060A.1
Girard J, Amulele G, Farta R, Mohiuddin A, Karato S-I (2016) Shear deformation ofbridgmanite and magnesiowüstite aggregates at lower mantle conditions.Science 351:144–147. https://doi.org/10.1126/science.aad3113
Hamano K, Abe Y, Genda H (2013) Emergence of two types of terrestrial planeton solidification of magma ocean. Nature 497:607–610. https://doi.org/10.1038/nature12163
Hernlund JW, Tackley PJ (2008) Modeling mantle convection in the sphericalannulus. Phys Earth Planet Int 171:48–54
Nakagawa et al. Progress in Earth and Planetary Science (2018) 5:51 Page 14 of 16
Hirschmann MH (2006) Water, melting, and the deep Earth H2O cycle. Annu Rev EarthPlanet Sci 34:629–653. https://doi.org/10.1146/annurev.earth.34.031405.125211
Hopkins M, Harrison TM, Manning CE (2008) Low heat flow inferred from >4Gyrzircon suggests Hadean plate boundary interaction. Nature 456:493–496.https://doi.org/10.1038/nature07465
Houser C (2016) Global seismic data reveal little water in the mantle transition zone.Earth Planet Sci Lett 448:94–101. https://doi.org/10.1016/j.epsl.2016.04.018
Iwamori H (2004) Phase relations of peridotites under H2O saturated conditionsand ability of subducting plates for transportation of H2O. Earth Planet SciLett 227:57–71. https://doi.org/10.1016/j.epsl.08.013
Iwamori H (2007) Transportation of H2O beneath the Japan arcs and itsimplications for global water circulation. Chem Geol 239:182–198. https://doi.org/10.1016/j.chemgeo.2006.08.011
Iwamori H, Nakakuki T (2013) Fluid processes in subduction zones and watertransport to the deep mantle. In: Karato S-i (ed) Physics and chemistry of thedeep mantle. John Wiley & Sons, Ltd., Oxford, pp 372–391
Karato S, Wu P (1993) Rheology of the upper mantle: a synthesis. Science 260:771–778
Karato S-i (2011) Water distribution across the mantle transition zone and itsimplications for global material circulation. Earth Planet Sci Lett 301:413–423.https://doi.org/10.1016/j.epsl.2010.11.038
Kelbert A, Schultz A, Egbert G (2009) Global electromagnetic inductionconstraints on transition-zone water content variations. Nature 460:1003–1006. https://doi.org/10.1038/nature08257
Komabayashi T, Omori S (2006) Internally consistent thermodynamics data set fordense hydrous magnesium silicates up to 35 GPa, 1600C: implications forwater circulation in the Earth’s deep mantle. Phys Earth Planet Int 156:89–107. https://doi.org/10.1016/j.pepi.2006.02.002
Korenaga J (2011) Thermal evolution with a hydrating mantle and the initiationof plate tectonics in the early Earth. J Geophys Res 116:B12403. https://doi.org/10.1029/2011JB008410
Korenaga J, Karato S-I (2008) A new analysis of experimental data on olivinerheology. J Geophys Res 113:B02403. https://doi.org/10.1029/2007JB005100
Lourenço D, Rozel A, Tackley PJ (2016) Melting and crustal production helpsplate tectonics on Earth-like planets. Earth Planet Sci Lett 439:18–28. https://doi.org/10.1016/j.epsl.2016.01.024
Lourenço DL, Rozel A, Gerya TV, Tackley PJ (2018) Efficient cooling of rockyplanets by intrusive magmatism. Nat Geosci 11:322–327. https://doi.org/10.1038/s41561-018-0094-8
Marty B (2012) The origins and concentrations of water, carbon, nitrogen andnoble gases on Earth. Earth Planet Sci Lett 313-314:56–66. https://doi.org/10.1016/j.epsl.2011.10.040
Maruyama S, Ikoma M, Genda H, Hirose K, Yokoyama T, Santosh M (2013) Thenaked planet Earth: most essential pre-requisite for the origin and evolutionof life. Geosci Front 4:141–165
Maruyama S, Komiya T (2011) The oldest pillow lavas, 3.8–3.7 Ga from the Isuasupracrustal belt, SW Greenland: plate tectonics already begun by 3.8 Ga. JGeogr 120:869–876
Maruyama S, Okamoto K (2007) Water transportation from the subducting slabinto the mantle transition zone. Gonwana Res 11:148–165. https://doi.org/10.1016/j.gr.2006.06.001
Mei S, Kohlstedt DL (2000) Influence of water on plastic deformation of olivineaggregates 1. Diffusion creep regime. J Geophys Res 105:21457–31469
Mojzsis SJ, Harrison TM, Pidgeon RT (2001) Oxygen-isotope evidence from ancientzircons from liquid qater at the Earth’s surface 4,300 Myr ago. Nature 409:178–81
Moresi L, Solomatov V (1998) Mantle convection with a brittle lithosphere: thoughtson the global tectonic styles of the Earth and Venus. Geophys J Int 133:669–682
Nakagawa T (2017) On the numerical modeling of the deep mantle water cyclein global-scale mantle dynamics: the effects of the water solubility limit oflower mantle minerals. J Earth Sci 28:563–577. https://doi.org/10.1007/s12583-017-0755-3
Nakagawa T, Iwamori H (2017) Long-term stability of plate-like behavior causedby hydrous mantle convection and water absorption in the deep mantle. JGeophys Res Solid Earth 122. https://doi.org/10.1002/2017JB014052
Nakagawa T, Nakakuki T, Iwamori H (2015) Water circulation and global mantledynamics: insight from numerical modeling. Geochem Geophys Geosyst 16:1449–1464. https://doi.org/10.1002/GC005071
Nakagawa T, Spiegelman MW (2017) Global-scale water circulation in theEarth’s mantle: implications for the mantle water budget in the earlyearth. Earth Planet Sci Lett 464:189–199. https://doi.org/10.1016/j.epsl.2017.02.010
Nakagawa T, Tackley PJ (2011) Effects of low-viscosity post-perovskite onthermos-chemical mantle convection in a 3-D spherical shell. Geophys ResLett 38:L04309. https://doi.org/10.1029/2010GL046494
Nakao A, Iwamori H, Nakakuki T (2016) Effects of water transportation onsubduction dynamics: roles of viscosity and density reduction. Earth PlanetSci Lett 454:178–191. https://doi.org/10.1016/j.epsl.2016.08.016
Nakao A, Iwamori H, Nakakuki T, Suzuki YJ, Nakamura H (2018) Role of hydrouslithospheric mantle in deep water transportation and subduction dynamics.Geophys Res Lett. https://doi.org/10.1029/2017GL076953
Nishi M, Irifune T, Tsuchiya J, Tange Y, Nishihara Y, Fujino K, Higo Y (2014)Stability of hydrous silicate at high pressures and water transport to thedeep lower mantle. Nat Geosci:224–227. https://doi.org/10.1038/NGEO2074
Nishi M, Kuwayama Y, Tsuchiya J, Tsuchiya T (2017) The pyrite-type high-pressureform of FeOOH. Nature 547:205–208. https://doi.org/10.1038/nature22823
Ohira I, Ohtani E., Kamada S., Hirao N (2016) Formation of phase H-δ-AlOOH solidsolution in the lower mantle, Goldschmidt Conference Abstract, 2346
Ohira I, Ohtani E, Sakai T, Miyahara M, Hirao N, Ohishi Y, Nishijima M (2014)Stability of a hydrous δ-phase, AlOOH-MgSiO2(OH)2, and a mechanism forwater transport into the base of lower mantle. Earth Planet Sci Lett 401:12–17. https://doi.org/10.1016/j.epsl.05.059
Ohtani E (2015) Hydrous minerals and the storage of water in the deep mantle.Chem Geol 418:6–15. https://doi.org/10.1016/j.chemgeo.2015.05.005
Ohtani E, Amaike Y, Kamada S, Sakamaki T, Hirao N (2014) Stability of hydrousphase H MgSiO4 under lower mantle conditions. Geophys Res Lett. https://doi.org/10.1002/2014GL061690
Ohtani E, Toma M, Litasov K, Kubo T, Suzuki A (2001) Stability of dense hydrousmagnesium silicate phases and water storage capacity in the transition zoneand lower mantle. Phys Earth Planet Int 124:105–117. https://doi.org/10.1016/S0031-9201(01)00192-03
Panero WR, Pigott JS, Reaman DM, Kabbes JE, Liu Z (2015) Dry (Mg,Fe)SiO3
perovskite in the Earth’s lower mantle. J Geophys Res Solid Earth 120. https://doi.org/10.1002/2014JB011397
Pearson DG, Brenker FE, Nestola F, McNeill J, Nasdala L, Hutchison MT, Mateev S,Mather K, Silversmit G, Schmitz S, Vekemans B, Vincze L (2014) Hydrousmantle transition zone indicated by ringwoodite included within diamond.Nature 507:221–224. https://doi.org/10.1038/nature13080
Richard G, Bercovici D, Karato S-I (2006) Slab dehydration in the Earth’s mantletransition zone. Earth Planet Sci Lett 251:156–167. https://doi.org/10.1016/j.epsl.2006.09.006
Richard G, Monneraeu M, Ingrin J (2002) Is the transition zone an empty waterreservoir? Influence from numerical model of mantle dynamics. Earth PlanetSci Lett 205:37–51
Richard GC, Iwamori H (2010) Stagnant slab, wet plumes and Cenozoic volcanismin East Asia. Phys Earth Planet Int 183:280–287. https://doi.org/10.1016/j.pepi.2010.02.009
Rozel A B, Golabek G J, Jain C, Tackley P J, Gerya T V (2017) Continental crustformation on early Earth controlled by intrusive magmatism. Nature 545:332–335. doi: https://doi.org/10.1038/nature22042
Rüpke LH, Morgan JP, Hort M, Connolly JAD (2004) Serpentine and thesubduction zone water cycle. Earth Planet Sci Lett 223:17–34
Sandu C, Lenardic A, McGovern P (2011) The effects of deep water cycling onplanetary thermal evolution. J Geophys Res 116:B12404. https://doi.org/10.1029/2011JB008405
Schmandt B, Jacobsen SD, Becker TW, Liu Z, Dueker KG (2014) Dehydrationmelting at the top of the lower mantle. Science 344:1265–1268. https://doi.org/10.1126/sciecnce.1253358
Tackley PJ (1996) Effects of strongly variable viscosity on three-dimensionalcompressible convection in planetary mantles. J Geophys Res Solid Earth101:3311–3322
Tackley PJ (2008) Modelling compressible mantle convection with large viscositycontrast in a three-dimensional spherical shell using the yin-yang grid. PhysEarth Planet Int 171:7–18
Valley JW, Cavosie AJ, Ushikubo T, Reinhard DA, Lawrence DF, Larson DJ, CliftonPH, Kelly TF, Wilde SA, Moser DE, Spicuzza MJ (2014) Hedean age for a post-magma-ocean zircon confirmed by atom-probe tomography. Nat Geosci 7:219–223
van Keken PE, Hacker BR, Syracuse EM, Abers GA (2011) Subduction factory: 4.Depth-dependent flux of H2O from subducting slabs worldwide. J GeophysRes 116:B01401. https://doi.org/10.1029/2010jb007922
Walter MJ, Thomson AR, Wang W, Lord OT, Ross J, McMahon SC, Baron MA,Melekhova E, Kleppe AK, Kohn SC (2015) The stability of hydrous silicates in
Nakagawa et al. Progress in Earth and Planetary Science (2018) 5:51 Page 15 of 16

Earth's lower mantle: Experimental constraints from the systems MgO–SiO2–H2O and MgO–Al2O3–SiO2–H2O. Chem Geol 418:16–29. https://doi.org/10.1016/j.chemgeo.2015.05.001
White WM, Hofmann AW (1982) Sr and Nd isotope geochemistry of oceanicbasalt and mantle evolution. NAature 296:821–825
Wilson CR, Spiegelman M, van Keken PE, Hacker BR (2014) Fluid flow insubduction zones: the role of solid rheology and compaction pressure. EarthPlanet Sci Lett 401:261–274. https://doi.org/10.1016/j.epsl.2014.05.052
Xie S, Tackley PJ (2004) Evolution of U–Pb and Sm–Nd systems in numericalmodels of mantle convection. J Geophys Res 109:B11204. https://doi.org/10.1029/2004JB003176
Yamazaki D, Karato S (2001) Some mineral physics constraints on the rheologyand geothermal structure of Earth’s lower mantle. Am Mineral 86:385–301
Zhong S, Watts AB (2013) Lithospheric deformation induced by loading of theHawaiian Islands and its implications for mantle rheology. J Geophys ResSolid Earth 118:6025–6048. https://doi.org/10.1002/2013JB010408
Nakagawa et al. Progress in Earth and Planetary Science (2018) 5:51 Page 16 of 16