on the effectiveness of candlestick chart analysis for the ... · candlestick charts have patterns...
TRANSCRIPT
Procedia Computer Science 22 ( 2013 ) 1136 – 1145
1877-0509 © 2013 The Authors. Published by Elsevier B.V.Selection and peer-review under responsibility of KES Internationaldoi: 10.1016/j.procs.2013.09.200
ScienceDirectAvailable online at www.sciencedirect.com
17th International Conference in Knowledge Based and Intelligent Information and Engineering Systems -
KES2013
On the effectiveness of candlestick chart analysis for the Brazilian stock market
Hércules A. do Pradoa,*, Edilson Fernedaa, Luis C. R. Moraisa, Alfredo J. B. Luizb, Eduardo Matsurac
a Catholic University of Brasília, SGAN 916, Módulo B, Sala A-115, 70.970-160 Brasília - DF, Brazil b Embrapa Meio Ambiente, Rodovia SP 340 - Km 127,5 Caixa Postal 69, 13.820-000 Jaguariúna, SP – Brazil
c Corretora Souza Barros, Rua Libero Badaró, 293 - 23º andar, 01.009-907 São Paulo, SP - Brazil
Abstract
Several techniques have been developed in pursuit of understanding the behavior of the financial market, in an attempt to predict the asset pricing behavior. The candlestick chart created in the 18th century is one of these techniques. In 2006, Greg Morris conducted a study on the effectiveness of this technique for the U.S. capital market. However, no similar work was done for the Brazilian market. In this paper, the behavior of part of the Brazilian capital market was studied using sixteen candlestick patterns. We considered the data series of ten stocks between 2005 and 2009, totaling approximately 40% of Ibovespa (São Paulo Stock Exchange Index) turnover. The frequency of confirmation of each pattern was measured along seven exchange sessions after occurrence of such pattern, and results were compared to those presented by Morris. Additionally, adjustments of the observed proportions of hits were tested for their statistical significance. Results found in the frequential analysis showed a discrepancy in relation to Morris’s study. Likewise, in statistical analysis few patterns have confirmed the behavior expected of them. In at least one case the trend expressed by data, although significant, was contrary to the original interpretation of the pattern. Therefore, direct application of patterns developed for other markets, times or actions is not recommended. Such results do not allow for an affirmation that candlestick patterns have the power to predict future behavior of stocks traded in the Ibovespa stock market. However, we found statistically significant evidence of the predictive ability of some patterns, which may indicate that the technique must be adapted to the market where it is intended to be used. The main contributions of this paper are a partial replication of Morris’ study for a set of stocks traded in the Brazilian market, and a statistical analysis of the effectiveness of candlestick patterns as predictors of the behavior of those stocks.Click here and insert your abstract text. © 2013 The Authors. Published by Elsevier B.V. Selection and peer-review under responsibility of KES International.
* Corresponding author. Tel.: +55-61-9325-8326 E-mail address: [email protected].
Available online at www.sciencedirect.com
© 2013 The Authors. Published by Elsevier B.V.Selection and peer-review under responsibility of KES International
Open access under CC BY-NC-ND license.
Open access under CC BY-NC-ND license.
1137 Hércules A. do Prado et al. / Procedia Computer Science 22 ( 2013 ) 1136 – 1145
Keywords: Stock Market; Candlestick; Prediction.
1. Introduction
There are two major currents of thought in the capital market. One of them is based on the fundamentalist analysis (FA) that arises from premises about the economical-financial fundamentals of organizations, involving their business structures, balances, financial health, among other criteria. The other one is based on technical analysis (TA), also known as graphic analysis, and it arises from the belief that: (i) all information that is relevant for the selection of a given asset is already included in its price, (ii) the price contains information that has not been used in the price's calculation, (iii) history repeats itself, and (iv) prices move according to a trend. The second current avails itself abundantly of graphic representations used to represent an asset’s behavior and assist investors’ decisions. These two currents of thought are not mutually excluding, and they may both give simultaneous support to one same investor in his process of decision.
The use of candlestick graphs was started in Japan by Munehisa Homma around 1750, as an alternative way of representing the behavior of prices in the rice market, trying to anticipate their tendency for subsequent days [9]. This type of representation has spread as an instrument to support investors’ decisions in stock markets. Candlestick charts have patterns that are usually associated with certain expectations as for stock’s behavior. Nonetheless, there are few studies about their effectiveness in terms of predicting trends in the Brazilian stock market. There is a study conducted by Morris [8] for the U.S. market; however, it presents methodological weaknesses because it makes illations based on plain frequency analysis. Thus, we have defined as focal points for the present work: (i) conduct a study similar to Morris’s for the Brazilian market, comparing results of both studies, and (ii) analyze statistically the predictive ability of candlesticks for the Brazilian market, comparing their results with results of the frequential analysis that was also made as part of this work. Studies were based upon a set of stocks negotiated in Bovespa (São Paulo Stock Exchange) in the period from 2005 to 2009.
The main results found in this work were: (i) some evidences against the candlesticks prediction ability for Brazilian stock market; (ii) behavior of candlesticks in the Brazilian market agrees with findings of Horton [3] for the US market; and (iii) evidences against the effectiveness of the frequential analysis presented by Morris [8] for the US market.
2. Candlesticks as a graph analysis technique
Nison [9] was one of the Western pioneers in bringing candlesticks graph analysis to TA. Candlesticks can represent several situations that are useful in price analyses. A certain combination of patterns in those graphs can indicate a period of market consolidation (and consequently a decrease in volatility), while another combination will suggest a vigorous movement of prices (and therefore an increase in volatility).
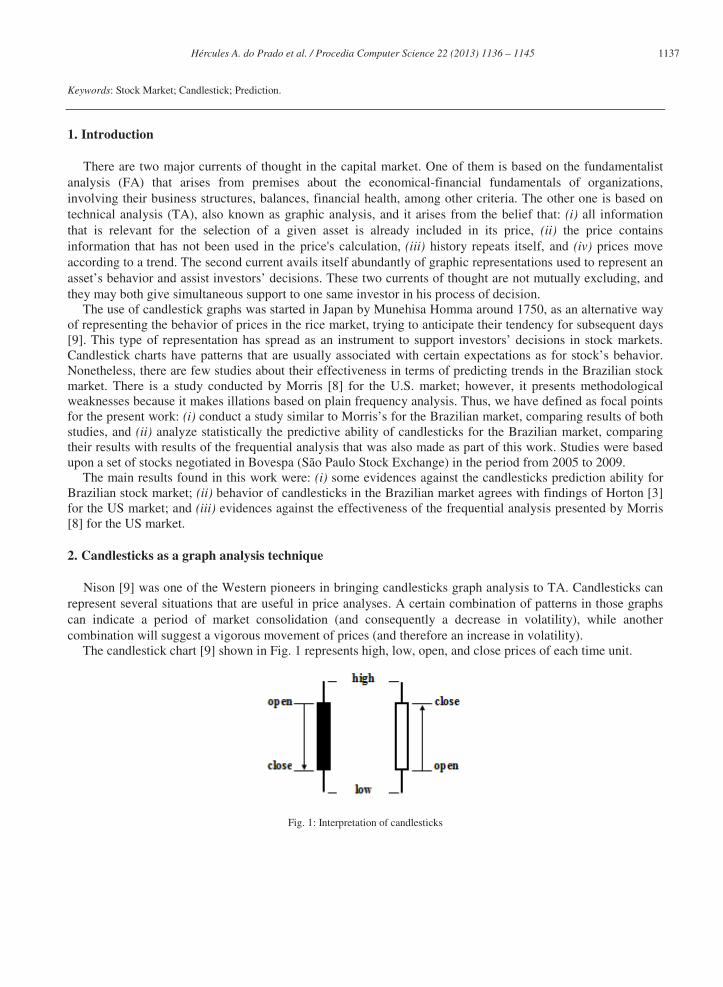
The candlestick chart [9] shown in Fig. 1 represents high, low, open, and close prices of each time unit.
Fig. 1: Interpretation of candlesticks
1138 Hércules A. do Prado et al. / Procedia Computer Science 22 ( 2013 ) 1136 – 1145
The thick part of the candlestick is called the real body; it shows the interval between opening and closing prices, and is presented as an empty or full shape. A full shape means that closing price was lower than the opening one, while the empty shape means that closing price was higher than the opening one. In some cases, the behavior expected when a pattern is present is indifferent to whether the candlestick body is full or empty. In such cases, it may take the grey color. Lines going up and down from the body are called shadows, and they represent price extremes, or the high and low of the day.
The fact that prices are influenced by investors’ feelings of fear and hope cannot be ignored. Morris [8] affirms that market psychology as a whole cannot be measured statistically. The Japanese candlestick graph represents changes in investors’ interpretation of value that are mirrored in price movements. Further than being a method of pattern recognition, candlestick charting shows interactions between buyers and sellers, thus providing a clear interpretation of the financial market.
Morris [8] studied the effectiveness of candlestick patterns when analyzing the U.S. stock market, indicating the efficiency of each pattern for a set of stocks listed in that country’s stock exchange. His objective was to offer to investors a tool that could guide them when defining strategies of asset negotiation in the stock market. As mentioned earlier, his study presents methodological limitations that weaken arguments in favor of candlestick charting as predictors of behavior in this type of market. As Morris, many authors (e.g., [2,4,10]) have applied a variety of approaches to support their arguments on the power of candlestick as predictors for the stock’s price movement. However, they only find local evidences in favor of specific patterns instead of the generality of the technique.
As a matter of fact, the fragility of candlestick as a technique to be used solely has been exposed by strongly grounded studies [3,5,6,7]. The first paper found “that candlesticks trading strategies do not have value for Dow Jones Industrial (DJIA) Average stocks”, from 1992 to 2002, by applying an extension of the bootstrap methodology. The second one presents a study in which candlestick techniques in the U.S. equity market are investigated for profitability; no evidence in favor of the effectiveness of candlestick analysis is found, although the author admit the possibility that the technique be complimentary for other approaches. Marshall, Young and Cahan [5] investigated the profitability of candlestick charting for the Japanese equity market over the period of 1975-2004, concluding that this form of TA is not profitable in those conditions. Horton [3] performed a statistical analysis upon 8 candlestick patterns for a group of 349 stocks of the U.S. market, concluding that the method is inadequate to serve as support for decision in the negotiation of individual stocks.
In face of this discussion, it seems to be an interesting opportunity to analyze how effective is the candlesticks technique for the Brazilian stock market. To cover this gap is our aim with this work.
3. Material and methods
3.1. Data used
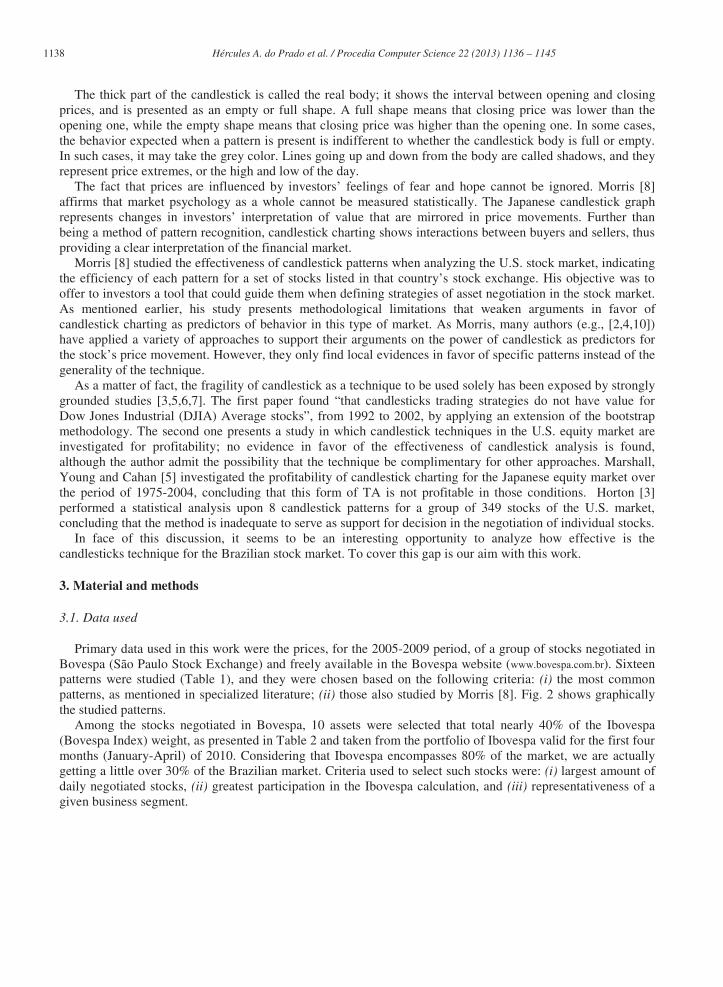
Primary data used in this work were the prices, for the 2005-2009 period, of a group of stocks negotiated in Bovespa (São Paulo Stock Exchange) and freely available in the Bovespa website (www.bovespa.com.br). Sixteen patterns were studied (Table 1), and they were chosen based on the following criteria: (i) the most common patterns, as mentioned in specialized literature; (ii) those also studied by Morris [8]. Fig. 2 shows graphically the studied patterns.
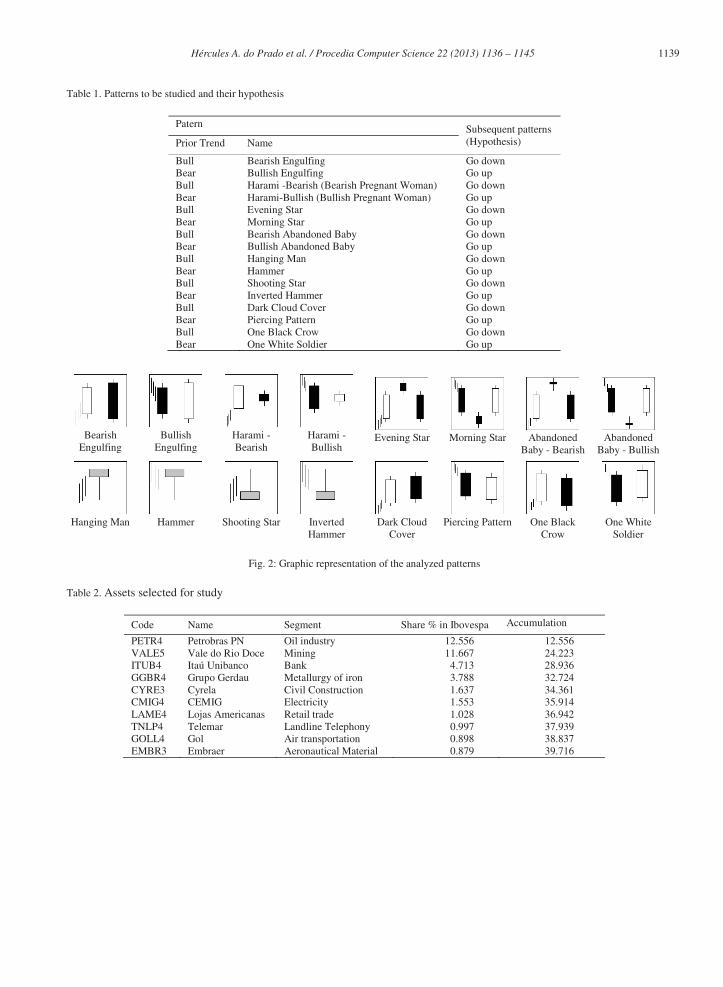
Among the stocks negotiated in Bovespa, 10 assets were selected that total nearly 40% of the Ibovespa (Bovespa Index) weight, as presented in Table 2 and taken from the portfolio of Ibovespa valid for the first four months (January-April) of 2010. Considering that Ibovespa encompasses 80% of the market, we are actually getting a little over 30% of the Brazilian market. Criteria used to select such stocks were: (i) largest amount of daily negotiated stocks, (ii) greatest participation in the Ibovespa calculation, and (iii) representativeness of a given business segment.
1139 Hércules A. do Prado et al. / Procedia Computer Science 22 ( 2013 ) 1136 – 1145
Table 1. Patterns to be studied and their hypothesis
Patern Subsequent patterns (Hypothesis) Prior Trend Name
Bull Bearish Engulfing Go down Bear Bullish Engulfing Go up Bull Harami -Bearish (Bearish Pregnant Woman) Go down Bear Harami-Bullish (Bullish Pregnant Woman) Go up Bull Evening Star Go down Bear Morning Star Go up Bull Bearish Abandoned Baby Go down Bear Bullish Abandoned Baby Go up Bull Hanging Man Go down Bear Hammer Go up Bull Shooting Star Go down Bear Inverted Hammer Go up Bull Dark Cloud Cover Go down Bear Piercing Pattern Go up Bull One Black Crow Go down Bear One White Soldier Go up
Bearish
Engulfing
Bullish
Engulfing
Harami - Bearish
Harami - Bullish
Evening Star
Morning Star
Abandoned
Baby - Bearish
Abandoned
Baby - Bullish
Hanging Man
Hammer
Shooting Star
Inverted Hammer
Dark Cloud
Cover
Piercing Pattern
One Black
Crow
One White
Soldier
Fig. 2: Graphic representation of the analyzed patterns
Table 2. Assets selected for study
Code Name Segment Share % in Ibovespa Accumulation
PETR4 Petrobras PN Oil industry 12.556 12.556 VALE5 Vale do Rio Doce Mining 11.667 24.223 ITUB4 Itaú Unibanco Bank 4.713 28.936 GGBR4 Grupo Gerdau Metallurgy of iron 3.788 32.724 CYRE3 Cyrela Civil Construction 1.637 34.361 CMIG4 CEMIG Electricity 1.553 35.914 LAME4 Lojas Americanas Retail trade 1.028 36.942 TNLP4 Telemar Landline Telephony 0.997 37.939 GOLL4 Gol Air transportation 0.898 38.837 EMBR3 Embraer Aeronautical Material 0.879 39.716
1140 Hércules A. do Prado et al. / Procedia Computer Science 22 ( 2013 ) 1136 – 1145
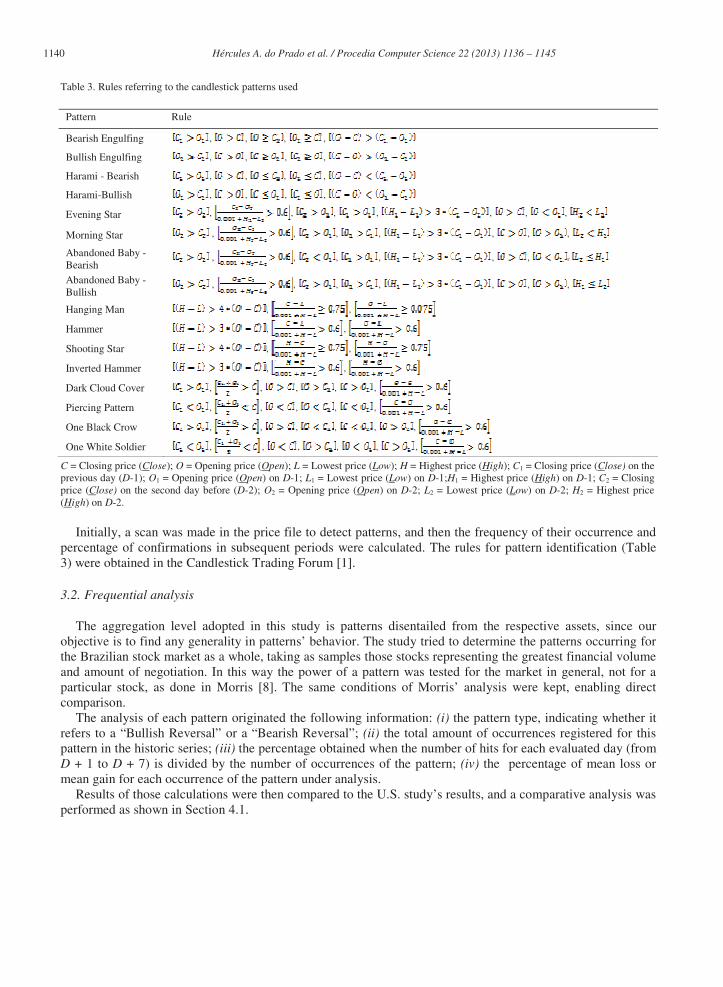
Table 3. Rules referring to the candlestick patterns used
Pattern Rule
Bearish Engulfing , , , ,
Bullish Engulfing , , , ,
Harami - Bearish , , , ,
Harami-Bullish , , , ,
Evening Star , , , , , , ,
Morning Star , , , , , , ,
Abandoned Baby - Bearish
, , , , , ,
Abandoned Baby - Bullish
, , , , , , ,
Hanging Man , ,
Hammer , ,
Shooting Star , ,
Inverted Hammer , ,
Dark Cloud Cover , , , , ,
Piercing Pattern , , , , ,
One Black Crow , , , , , ,
One White Soldier , , , , , ,
C = Closing price (Close); O = Opening price (Open); L = Lowest price (Low); H = Highest price (High); C1 = Closing price (Close) on the previous day (D-1); O1 = Opening price (Open) on D-1; L1 = Lowest price (Low) on D-1;H1 = Highest price (High) on D-1; C2 = Closing price (Close) on the second day before (D-2); O2 = Opening price (Open) on D-2; L2 = Lowest price (Low) on D-2; H2 = Highest price (High) on D-2.
Initially, a scan was made in the price file to detect patterns, and then the frequency of their occurrence and percentage of confirmations in subsequent periods were calculated. The rules for pattern identification (Table 3) were obtained in the Candlestick Trading Forum [1].
3.2. Frequential analysis
The aggregation level adopted in this study is patterns disentailed from the respective assets, since our objective is to find any generality in patterns’ behavior. The study tried to determine the patterns occurring for the Brazilian stock market as a whole, taking as samples those stocks representing the greatest financial volume and amount of negotiation. In this way the power of a pattern was tested for the market in general, not for a particular stock, as done in Morris [8]. The same conditions of Morris’ analysis were kept, enabling direct comparison.
The analysis of each pattern originated the following information: (i) the pattern type, indicating whether it refers to a “Bullish Reversal” or a “Bearish Reversal”; (ii) the total amount of occurrences registered for this pattern in the historic series; (iii) the percentage obtained when the number of hits for each evaluated day (from D + 1 to D + 7) is divided by the number of occurrences of the pattern; (iv) the percentage of mean loss or mean gain for each occurrence of the pattern under analysis.
Results of those calculations were then compared to the U.S. study’s results, and a comparative analysis was performed as shown in Section 4.1.
1141 Hércules A. do Prado et al. / Procedia Computer Science 22 ( 2013 ) 1136 – 1145
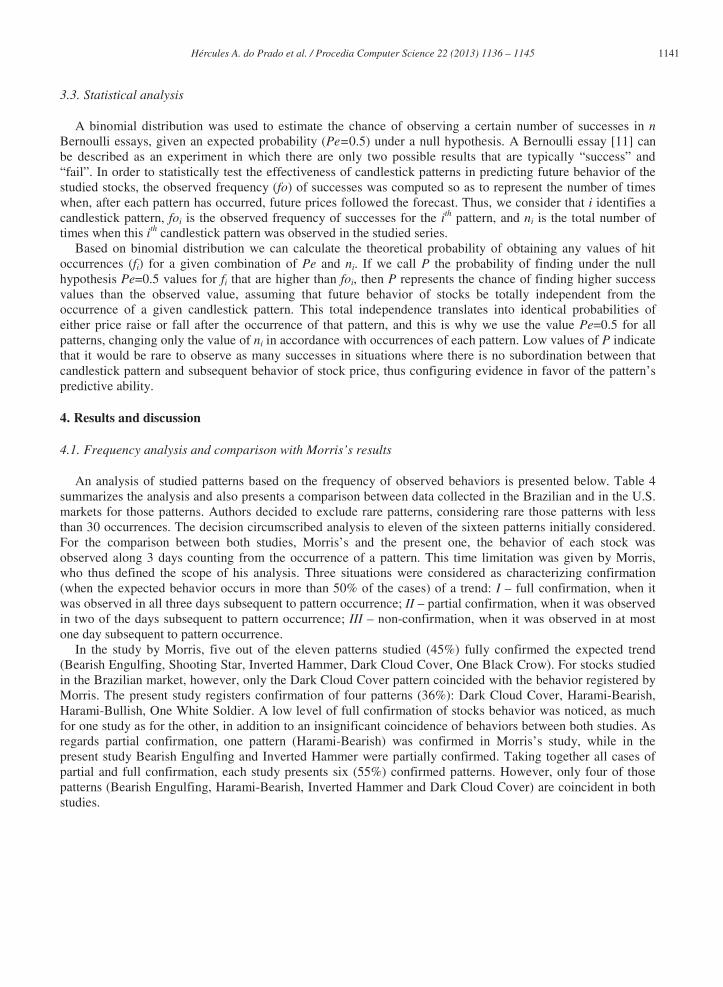
3.3. Statistical analysis
A binomial distribution was used to estimate the chance of observing a certain number of successes in n Bernoulli essays, given an expected probability (Pe=0.5) under a null hypothesis. A Bernoulli essay [11] can be described as an experiment in which there are only two possible results that are typically “success” and “fail”. In order to statistically test the effectiveness of candlestick patterns in predicting future behavior of the studied stocks, the observed frequency (fo) of successes was computed so as to represent the number of times when, after each pattern has occurred, future prices followed the forecast. Thus, we consider that i identifies a candlestick pattern, foi is the observed frequency of successes for the ith pattern, and ni is the total number of times when this ith candlestick pattern was observed in the studied series.
Based on binomial distribution we can calculate the theoretical probability of obtaining any values of hit occurrences (fi) for a given combination of Pe and ni. If we call P the probability of finding under the null hypothesis Pe=0.5 values for fi that are higher than foi, then P represents the chance of finding higher success values than the observed value, assuming that future behavior of stocks be totally independent from the occurrence of a given candlestick pattern. This total independence translates into identical probabilities of either price raise or fall after the occurrence of that pattern, and this is why we use the value Pe=0.5 for all patterns, changing only the value of ni in accordance with occurrences of each pattern. Low values of P indicate that it would be rare to observe as many successes in situations where there is no subordination between that candlestick pattern and subsequent behavior of stock price, thus configuring evidence in favor of the pattern’s predictive ability.
4. Results and discussion
4.1. Frequency analysis and comparison with Morris’s results
An analysis of studied patterns based on the frequency of observed behaviors is presented below. Table 4 summarizes the analysis and also presents a comparison between data collected in the Brazilian and in the U.S. markets for those patterns. Authors decided to exclude rare patterns, considering rare those patterns with less than 30 occurrences. The decision circumscribed analysis to eleven of the sixteen patterns initially considered. For the comparison between both studies, Morris’s and the present one, the behavior of each stock was observed along 3 days counting from the occurrence of a pattern. This time limitation was given by Morris, who thus defined the scope of his analysis. Three situations were considered as characterizing confirmation (when the expected behavior occurs in more than 50% of the cases) of a trend: I – full confirmation, when it was observed in all three days subsequent to pattern occurrence; II – partial confirmation, when it was observed in two of the days subsequent to pattern occurrence; III – non-confirmation, when it was observed in at most one day subsequent to pattern occurrence.
In the study by Morris, five out of the eleven patterns studied (45%) fully confirmed the expected trend (Bearish Engulfing, Shooting Star, Inverted Hammer, Dark Cloud Cover, One Black Crow). For stocks studied in the Brazilian market, however, only the Dark Cloud Cover pattern coincided with the behavior registered by Morris. The present study registers confirmation of four patterns (36%): Dark Cloud Cover, Harami-Bearish, Harami-Bullish, One White Soldier. A low level of full confirmation of stocks behavior was noticed, as much for one study as for the other, in addition to an insignificant coincidence of behaviors between both studies. As regards partial confirmation, one pattern (Harami-Bearish) was confirmed in Morris’s study, while in the present study Bearish Engulfing and Inverted Hammer were partially confirmed. Taking together all cases of partial and full confirmation, each study presents six (55%) confirmed patterns. However, only four of those patterns (Bearish Engulfing, Harami-Bearish, Inverted Hammer and Dark Cloud Cover) are coincident in both studies.
1142 Hércules A. do Prado et al. / Procedia Computer Science 22 ( 2013 ) 1136 – 1145
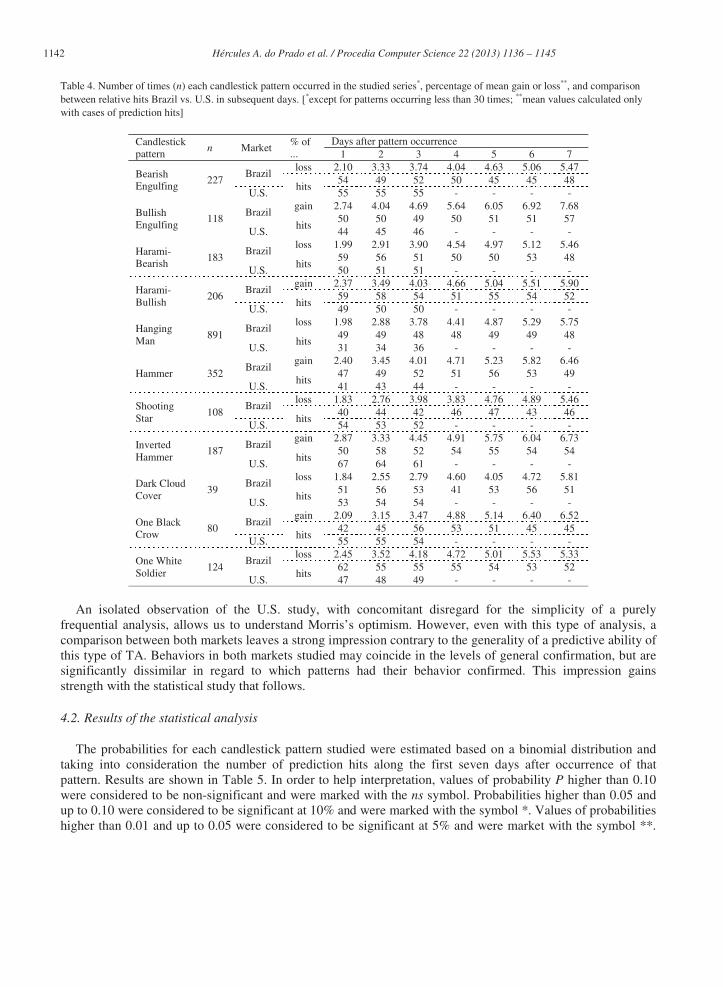
Table 4. Number of times (n) each candlestick pattern occurred in the studied series*, percentage of mean gain or loss**, and comparison between relative hits Brazil vs. U.S. in subsequent days. [*except for patterns occurring less than 30 times; **mean values calculated only with cases of prediction hits]
Candlestick pattern
n Market % of ...
Days after pattern occurrence 1 2 3 4 5 6 7
Bearish Engulfing
227 Brazil
loss 2.10 3.33 3.74 4.04 4.63 5.06 5.47
hits 54 49 52 50 45 45 48
U.S. 55 55 55 - - - -
Bullish Engulfing
118 Brazil
gain 2.74 4.04 4.69 5.64 6.05 6.92 7.68
hits 50 50 49 50 51 51 57
U.S. 44 45 46 - - - -
Harami-Bearish
183 Brazil
loss 1.99 2.91 3.90 4.54 4.97 5.12 5.46
hits 59 56 51 50 50 53 48
U.S. 50 51 51 - - - -
Harami-Bullish
206 Brazil
gain 2.37 3.49 4.03 4.66 5.04 5.51 5.90
hits 59 58 54 51 55 54 52
U.S. 49 50 50 - - - -
Hanging Man
891 Brazil
loss 1.98 2.88 3.78 4.41 4.87 5.29 5.75
hits 49 49 48 48 49 49 48
U.S. 31 34 36 - - - -
Hammer 352 Brazil
gain 2.40 3.45 4.01 4.71 5.23 5.82 6.46
hits 47 49 52 51 56 53 49
U.S. 41 43 44 - - - -
Shooting Star
108 Brazil
loss 1.83 2.76 3.98 3.83 4.76 4.89 5.46
hits 40 44 42 46 47 43 46
U.S. 54 53 52 - - - -
Inverted Hammer
187 Brazil
gain 2.87 3.33 4.45 4.91 5.75 6.04 6.73
hits 50 58 52 54 55 54 54
U.S. 67 64 61 - - - -
Dark Cloud Cover
39 Brazil
loss 1.84 2.55 2.79 4.60 4.05 4.72 5.81
hits 51 56 53 41 53 56 51
U.S. 53 54 54 - - - -
One Black Crow
80 Brazil
gain 2.09 3.15 3.47 4.88 5.14 6.40 6.52
hits 42 45 56 53 51 45 45
U.S. 55 55 54 - - - -
One White Soldier
124 Brazil
loss 2.45 3.52 4.18 4.72 5.01 5.53 5.33
hits 62 55 55 55 54 53 52
U.S. 47 48 49 - - - - An isolated observation of the U.S. study, with concomitant disregard for the simplicity of a purely
frequential analysis, allows us to understand Morris’s optimism. However, even with this type of analysis, a comparison between both markets leaves a strong impression contrary to the generality of a predictive ability of this type of TA. Behaviors in both markets studied may coincide in the levels of general confirmation, but are significantly dissimilar in regard to which patterns had their behavior confirmed. This impression gains strength with the statistical study that follows.
4.2. Results of the statistical analysis
The probabilities for each candlestick pattern studied were estimated based on a binomial distribution and taking into consideration the number of prediction hits along the first seven days after occurrence of that pattern. Results are shown in Table 5. In order to help interpretation, values of probability P higher than 0.10 were considered to be non-significant and were marked with the ns symbol. Probabilities higher than 0.05 and up to 0.10 were considered to be significant at 10% and were marked with the symbol *. Values of probabilities higher than 0.01 and up to 0.05 were considered to be significant at 5% and were market with the symbol **.
1143 Hércules A. do Prado et al. / Procedia Computer Science 22 ( 2013 ) 1136 – 1145
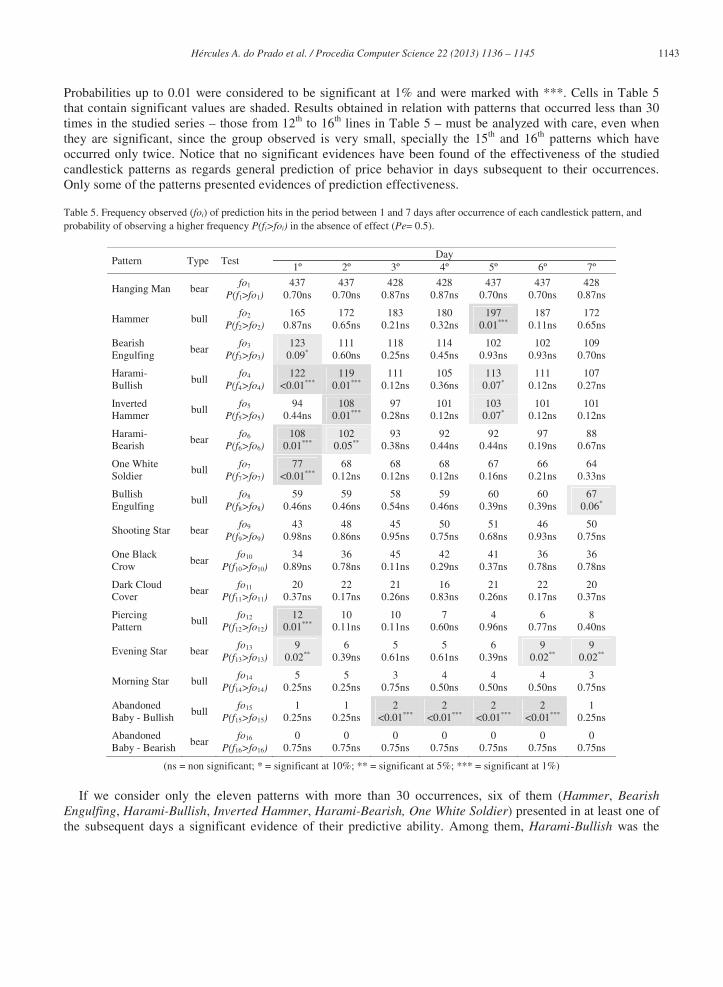
Probabilities up to 0.01 were considered to be significant at 1% and were marked with ***. Cells in Table 5 that contain significant values are shaded. Results obtained in relation with patterns that occurred less than 30 times in the studied series – those from 12th to 16th lines in Table 5 – must be analyzed with care, even when they are significant, since the group observed is very small, specially the 15th and 16th patterns which have occurred only twice. Notice that no significant evidences have been found of the effectiveness of the studied candlestick patterns as regards general prediction of price behavior in days subsequent to their occurrences. Only some of the patterns presented evidences of prediction effectiveness.
Table 5. Frequency observed (foi) of prediction hits in the period between 1 and 7 days after occurrence of each candlestick pattern, and probability of observing a higher frequency P(fi>foi) in the absence of effect (Pe= 0.5).
Pattern Type Test Day
1º 2º 3º 4º 5º 6º 7º
Hanging Man bear fo1
P(f1>fo1) 437
0.70ns 437
0.70ns 428
0.87ns 428
0.87ns 437
0.70ns 437
0.70ns 428
0.87ns
Hammer bull fo2
P(f2>fo2) 165
0.87ns 172
0.65ns 183
0.21ns 180
0.32ns 197
0.01*** 187
0.11ns 172
0.65ns
Bearish Engulfing
bear fo3
P(f3>fo3) 123
0.09* 111
0.60ns 118
0.25ns 114
0.45ns 102
0.93ns 102
0.93ns 109
0.70ns
Harami-Bullish
bull fo4
P(f4>fo4) 122
<0.01*** 119
0.01*** 111
0.12ns 105
0.36ns 113
0.07* 111
0.12ns 107
0.27ns
Inverted Hammer
bull fo5
P(f5>fo5) 94
0.44ns 108
0.01*** 97
0.28ns 101
0.12ns 103
0.07* 101
0.12ns 101
0.12ns
Harami-Bearish
bear fo6
P(f6>fo6) 108
0.01*** 102
0.05** 93
0.38ns 92
0.44ns 92
0.44ns 97
0.19ns 88
0.67ns
One White Soldier
bull fo7
P(f7>fo7) 77
<0.01*** 68
0.12ns 68
0.12ns 68
0.12ns 67
0.16ns 66
0.21ns 64
0.33ns
Bullish Engulfing
bull fo8
P(f8>fo8) 59
0.46ns 59
0.46ns 58
0.54ns 59
0.46ns 60
0.39ns 60
0.39ns 67
0.06*
Shooting Star bear fo9
P(f9>fo9) 43
0.98ns 48
0.86ns 45
0.95ns 50
0.75ns 51
0.68ns 46
0.93ns 50
0.75ns
One Black Crow
bear fo10
P(f10>fo10) 34
0.89ns 36
0.78ns 45
0.11ns 42
0.29ns 41
0.37ns 36
0.78ns 36
0.78ns
Dark Cloud Cover
bear fo11
P(f11>fo11) 20
0.37ns 22
0.17ns 21
0.26ns 16
0.83ns 21
0.26ns 22
0.17ns 20
0.37ns
Piercing Pattern
bull fo12
P(f12>fo12) 12
0.01*** 10
0.11ns 10
0.11ns 7
0.60ns 4
0.96ns 6
0.77ns 8
0.40ns
Evening Star bear fo13
P(f13>fo13) 9
0.02** 6
0.39ns 5
0.61ns 5
0.61ns 6
0.39ns 9
0.02** 9
0.02**
Morning Star bull fo14
P(f14>fo14) 5
0.25ns 5
0.25ns 3
0.75ns 4
0.50ns 4
0.50ns 4
0.50ns 3
0.75ns
Abandoned Baby - Bullish
bull fo15
P(f15>fo15) 1
0.25ns 1
0.25ns 2
<0.01*** 2
<0.01*** 2
<0.01*** 2
<0.01*** 1
0.25ns
Abandoned Baby - Bearish
bear fo16
P(f16>fo16) 0
0.75ns 0
0.75ns 0
0.75ns 0
0.75ns 0
0.75ns 0
0.75ns 0
0.75ns
(ns = non significant; * = significant at 10%; ** = significant at 5%; *** = significant at 1%)
If we consider only the eleven patterns with more than 30 occurrences, six of them (Hammer, Bearish Engulfing, Harami-Bullish, Inverted Hammer, Harami-Bearish, One White Soldier) presented in at least one of the subsequent days a significant evidence of their predictive ability. Among them, Harami-Bullish was the
1144 Hércules A. do Prado et al. / Procedia Computer Science 22 ( 2013 ) 1136 – 1145
pattern that most presented significant results – at 1% in the first two days and at 10% in the fifth day. As regards the periods when most significant results were obtained, these were: the first day after occurrence of patterns, followed by the second and fifth days. It is worth observing that the fifth working day after occurrence of a pattern will be usually the same weekday as the occurrence. The non-uniformity of predictive behaviors of the tested patterns, both in regard to significance level and to the period of most hits, indicates that candlestick patterns cannot be directly applied to other situations. On the other hand, the existence of statistically significant evidences of the predictive ability of some patterns for some periods seems to indicate that greater efforts will be necessary to adapt existing patterns or to create new specific patterns for the Brazilian market. For example, if one just inverts the direction of prediction for some patterns for which no significant evidences were found, a change in results can be observed. In the case of the Shooting Star pattern, if the observed frequency is tested as a bullish trend, and not a bearish one as established, the pattern’s predictive power becomes significant at 5% in the first day and at 10% in the third and sixth days. The Bearish Engulfing pattern has shown to have a significant predictive ability at 10% for the first day after pattern occurrence; nonetheless, it could also be considered to have significance at 10% for the fifth and sixth days if prediction be bullish instead of bearish.
Observe that 11,153 price records were analyzed in total, and among them 2,556 occurrences of the studied patterns were identified. The nine most frequent patterns, occurring with a relative frequency equal or higher than 1% in the period under analysis, represented 21.5% of the total number of records. The most frequent pattern was the Hanging Man, which represented alone 8% of all records.
5. Conclusions and further works
Even though the legitimacy of Morris’s belief, namely that “market psychology cannot be measured by Statistics”, can be hypothetically admitted, the effectiveness of a predictive technique can and should be evaluated quantitatively. Out of the 16 patterns studied for a group of 10 stocks that are representative of Bovespa, with a history of 5 years of Brazilian stocks prices, 9 patterns can be considered relatively frequent since they appeared with a frequency higher than 1%.
The comparison between results of this study and results by Morris [8] leaves a strong contrary impression of granting generality to the predictive ability of candlestick patterns, because behaviors in the Brazilian market were considerably different from those in U.S. Statistical analysis makes it evident that candlestick charting analysis has no predictive power that could be generalized for the negotiation of individual stocks in the Brazilian stock market. It agrees with results found by Horton [3]. Nonetheless, some of the studied candlestick patterns did show a local ability of prediction as preconized for other markets, and other patterns showed a significant predictive ability though for a behavior that is opposite to preconized, which indicates that the technique has potential, but it probably must be developed specifically for each market and time. The pattern with greatest predictive ability was Harami-Bullish for the first, second and fifth days. The pattern appearing most frequently, but showing no effectiveness in prediction, was the Hanging Man. In summary, the main results found in this work were: (i) evidences against the candlesticks prediction ability for Brazilian stock market; (ii) the behavior of candlesticks in the Brazilian market agrees with findings of Horton for the US market; and (iii) evidences against the results of the frequential analysis of Morris [8].
One could argue that may be different sources of the variation between our study and the one from Morris. For example, the different results could be due to seasonal influences like the subprime crisis in EUA that had consequences for the global economy and happened during the period considered in our analysis. This argument does not hold, since we are analyzing the power of TA based on candlesticks for prediction of variations in pricing in a overall sense and, so, it cannot depend on contingencies like the subprime crisis.
An interesting study for the near future is to compare the use of candlestick analysis with other TA approaches adopted by Bovespa traders.
1145 Hércules A. do Prado et al. / Procedia Computer Science 22 ( 2013 ) 1136 – 1145
References
[1] Candlestick Trading Forum. PCF (Personal Criteria Formulas) For TeleChart Software. Available at: <http://www.candlestickforum.com/PPF/ Parameters/16_263_/candlestick.asp>.
[2] Goo, Y-J, Chen, D-H; Chang, Y-W. The application of japanese candlestick trading strategies in Taiwan. Investment Management and Financial Innovations 2007, 4(4):49-79.
[3] Horton, MJ,. Stars, crows, and doji: The use of candlesticks in stock selection. The Quarterly Review of Economics and Finance 2009, 49:283-294.
[4] Lu, T-H, Shiu, Y-M; Liu, T-C. Profitable candlestick trading strategies - The evidence from a new perspective. Review of Financial Economics 2012, 21(2):63–68,.
[5] Marshall, BR, Young, MR; Cahan, R. Are candlestick technical trading strategies profitable in the Japanese equity market? Review of Quantitative Finance and Accounting 2008, 31(2):191–207,.
[6] Marshall, BR, Young, MR, Rose, LC. Market timing candlestick technical analysis. Journal of Financial Transformation, Securities Issue 2007, 20:18–25.
[7] Marshall, BR, Young, MR, Rose, LC. Candlestick technical trading strategies: Can they create value for investors? Journal of Banking & Finance 2006, 30:2303–2323.
[8] Morris, GL, 2006. Candlestick charting explained: timeless techniques for trading and futures. third edition. New York: McGraw-Hill. [9] Nison, S, 2001. Japanese candlestick charting techniques, second edition, Upper Saddle River: Prentice Hall Press,. [10] Shiu, Y-M; Lu, T-H. Pinpoint and synergistic trading strategies of candlesticks. International Journal of Economics and Finance
2011, 3(1):234-244,. [11] Zwillinger, D; Kokoska, S, 2000. CRC Standard Probability and Statistics Tables and Formulae. Boca Raton: Chapman & Hall/CRC.