on the coupling mechanism between nonlinear solitary waves and slender beams
TRANSCRIPT
International Journal of Solids and Structures 50 (2013) 4173–4183
Contents lists available at ScienceDirect
International Journal of Solids and Structures
journal homepage: www.elsevier .com/locate / i jsols t r
On the coupling mechanism between nonlinear solitary wavesand slender beams
0020-7683/$ - see front matter � 2013 Elsevier Ltd. All rights reserved.http://dx.doi.org/10.1016/j.ijsolstr.2013.08.018
⇑ Corresponding author. Tel.: +1 412 624 9575; fax: +1 412 624 0135.E-mail address: [email protected] (P. Rizzo).
Luyao Cai a, Piervincenzo Rizzo a,⇑, Leith Al-Nazer b
a Laboratory for Nondestructive Evaluation and Structural Health Monitoring Studies, Department of Civil and Environmental Engineering, University of Pittsburgh, 3700O’Hara Street, Pittsburgh, PA 15261, USAb Office of Research and Development, Federal Railroad Administration, 1200 New Jersey Avenue, SE, Washington, DC 20590, USA
a r t i c l e i n f o a b s t r a c t
Article history:Received 30 April 2013Received in revised form 13 August 2013Available online 28 August 2013
Keywords:Highly nonlinear solitary wavesDiscrete particle modelNondestructive testingBuckling
This paper describes the coupling mechanism between highly nonlinear solitary waves propagating alonga granular system and slender beams in contact with the granular medium. Nonlinear solitary waves arecompact non-dispersive waves that can form and travel in nonlinear systems such as one-dimensionalchains of particles, where they are conventionally generated by the mechanical impact of a striker. Thesewaves have a constant spatial wavelength and their speed, amplitude, and duration can be tuned by mod-ifying the particles’ material or size, or the velocity of the striker. In the study presented in this article weinvestigated numerically the interaction between solitary waves propagating along a chain of granularparticles and a slender beam. Some of the numerical findings were validated experimentally. We foundthat the geometric and mechanical properties of the beam or thermal stress applied to the beam alter cer-tain features of the solitary waves. In the future, these findings may be used to develop a novel sensingsystem for the nondestructive assessment of beams.
� 2013 Elsevier Ltd. All rights reserved.
1. Introduction
In the last fifteen years, numerical and experimental studies onthe propagation of nonlinear solitary waves in one-dimensionalchains of spherical elastic beads have demonstrated that thesewaves can be used in several engineering applications, includingbut not limited to vibration absorbers (Fraternali et al., 2009),impurity detectors (Sen et al., 1998; Hong and Xu, 2002), acousticdiodes (Nesterenko et al., 2005; Boechler et al., 2011) and nonde-structive testing (Ni et al., 2012; Ni and Rizzo, 2012a, 2012b; Yanget al., 2012a). In chains of particles, the nonlinearity arises from aHertzian-type contact between two adjacent spheres subjected tocompressive force. When the compression is small compared tothe dynamic force associated with the propagation of the wave,highly nonlinear solitary waves (HNSWs) arise (Nesterenko,1983; Lazaridi and Nesterenko, 1985; Nesterenko et al., 1995; Cos-te et al., 1997; Coste and Gilles, 1999; Daraio et al., 2005, 2006; Jobet al., 2005, 2007; Nesterenko et al., 2005; Yang et al., 2011; Carre-tero-González et al., 2009; Ni et al., 2011a, 2011b). One peculiarcharacteristic of HNSWs is that their spatial wavelength is fixed(equal to approximately five particle diameters) and is indepen-dent of their amplitude. Moreover, the amplitude, speed and num-ber of pulses can be tuned by engineering the granular system; for
example, by changing the diameter of the beads or adding staticpre-compression to the chain.
In the study presented in this paper we coupled a chain of par-ticles to a prismatic beam to evaluate the effect of the beam’sgeometry and material as well as the effect of thermal stress, onthe characteristics of the solitary waves propagating along thechain. The objective of the study is to propose a novel tool forthe nondestructive assessment of beams and to investigate thehypothesis that HNSWs can predict the occurrence of thermalbuckling in slender beams. To the best of the authors’ knowledgethe coupling mechanism between chain of particles and slenderbeams was never reported. Job et al. (2005) studied the reflectionof solitary waves from walls having different mechanical proper-ties. Yang et al. (2011) investigated the interaction of a 1-D granu-lar system aligned with small cylinders of varying length andmaterials. The interaction between HNSW and thin plates was in-stead examined by Yang et al. (2012b) to evaluate the effect of theplate’s boundary conditions.
In this study, we investigated numerically and experimentallydifferent beam configurations. A discrete particle model was usedto derive the shape and amplitude of the force function at thechain–beam interface. A continuous beam theory was used to esti-mate the structural response of the beam subjected to the solitarypulse forcing function. The structural response served to predictthe characteristics of the solitary waves generated by the impactof the vibrating beam to the chain.

Initially compressed
Perturbed
F0
2R-δ0
ui-1
Fm
Fig. 2. Top: chain of spherical particles subjected to static pre-compression F0.Bottom: chain of spherical particles subjected to static pre-compression F0 andremoved from the equilibrium position due to the propagation of a solitary wave.The small circles represent the initial positions of beads’ center whereas thetriangles are the position of the beads’ center after perturbation. Fm denotes thetotal force, static plus dynamic, where the dynamic force is the force associatedwith the propagation of a solitary wave. (Figure adapted from Ni, 2011.)
4174 L. Cai et al. / International Journal of Solids and Structures 50 (2013) 4173–4183
The paper is organized as follows. The background and thenumerical model associated with the propagation of HNSWs arepresented in Sections 2 and 3, respectively. The response of thebeam subjected to the impact of a solitary wave is described in Sec-tion 4. Section 5 reports the numerical results associated with thesensitivity of the solitary wave to the beam’s properties. Section 6presents the results of a series of experiments. Finally, Section 7ends the paper with some conclusive remarks, the implicationsof our work, and the possible path for future research.
2. Background on HNSW
When two spheres are in contact and compressed by a staticforce F, as shown in Fig. 1, their interaction is governed by theHertz law (Landau and Lifshitz, 1986):
F ¼ 1D
R1R2
R1 þ R2
� �1=2
d3=2 ð1Þ
where R1 and R2 are the radius of the particles, d is the distance ofapproach of their centers, and D is a coefficient given by:
D ¼ 34
1� m21
E1þ 1� m2
2
E2
� �ð2Þ
where E and m are the Young’s modulus and the Poisson’s ratio ofthe material, respectively. Eq. (1) can be generalized as:
F ¼ A d3=2 ð3Þ
where
A ¼Ac ¼ E
ffiffiffiffi2Rp
3ð1�m2Þ
Aw ¼ 4ffiffiRp
31�v2
E þ1�v2
wEw
� ��1
8><>: ð4Þ
In Eq. (4) the stiffness constant Ac refers to the contact betweentwo identical spheres, whereas Aw refers to the contact between asphere and a semi-infinite wall. In this case, Ew and vw representthe Young’s modulus and the Poisson’s ratio of the wall material.
Fig. 2 shows the schematics of the portion of a 1-D chain madeof identical beads having radius R, mass m, subjected to a staticpre-compression force F0, and initial approach d0. When this sys-tem is subjected to the dynamic force Fm generated by the propa-gation of a solitary pulse, the second Newton’s law relative to the i-th particle can be written as (Nesterenko, 1983):
€ui ¼ gcðd0 � ui þ ui�1Þ3=2 � gcðd0 � uiþ1 þ uiÞ3=2; 2 6 i 6 N � 1
ð5Þ
where ui denotes the displacement of the i-th particle from its equi-librium position, and gc is one of the stiffness constants defined inEq. (4) normalized with respect to the mass m, namely gc = Ac/m.A chain of N beads subjected to the action of a striker in contact
uncompressed compressed
δ
(a) (b)
Fig. 1. Schematics of two spheres that are (a) in contact, and (b) in contact andsubjected to compression. The parameter d is the approach of the two spheres’centers. (Figure adapted from Ni, 2011.)
with a linear medium is shown in Fig. 3. For the particles locatedat the two ends of the chain, i.e. when i = 1 and i = N, Eq. (5)becomes:
€u1 ¼ gcd3=20 � gcðd0 � u2 þ u1Þ3=2 ð6aÞ
€uN ¼ gcðd0 � uN þ uN�1Þ3=2 � gwðdw0 � uw þ uNÞ3=2 ð6bÞ
where dw0 represents the initial approach between the last bead andthe wall, uw is the displacement of the contact point on the wall, andgw is the normalized stiffness constant gw = Aw/m.
When the chain is ‘‘weakly’’ compressed, the particles displace-ment associated with the propagation of the wave is larger thanthe corresponding closest approach, i.e.juiþ1 � uij
d0P 1 ð7Þ
The time increment of the generic particles displacement can beexpressed in terms of the Taylor series expansion as shown inChatterjee (1999):
uðt þ aÞ ¼ uðtÞ þ aduðtÞ
dtþ a2
2!
d2uðtÞdt2 þ a3
3!
d3uðtÞdt3 þ � � � ð8Þ
By substituting Eq. (8) into Eq. (5), the wave equation becomes:
€u ¼ c2 32ð�uxÞ1=2uxx þ
a2
8ð�uxÞ1=2uxxxx �
a2
8uxxuxxxx
ð�uxÞ1=2 �a2
64ðuxxÞ3
ð�uxÞ3=2
( )
ð9Þ
where the subscript x indicats spatial derivatives and
c2 ¼ 2Epqð1� m2Þ ; a ¼ 2R ð10Þ
In Eq. (9), ux represents the strain, considered positive when theparticle is compressed, and q is the density of the particle material(Nesterenko, 1983). The speed Vs of a solitary wave is (Nesterenko,2001):
Vs¼c
nm�n0
25ð3n5=2
0 þ2n5=2m �5n3=2
0 nm� �1=2
¼ c0
nr�14
15ð3þ2n5=2
r �5nr� �1=2
¼ 0:93144E2F0
a2q3ð1�m2Þ2
" #1=61
ðf 2=3r �1Þ
415ð3þ2n5=2
r �5nr� �1=2
ð11Þ
ui
ui+1
ui-1
uN-1
uN
u2u
1u0
i i+1
N
0
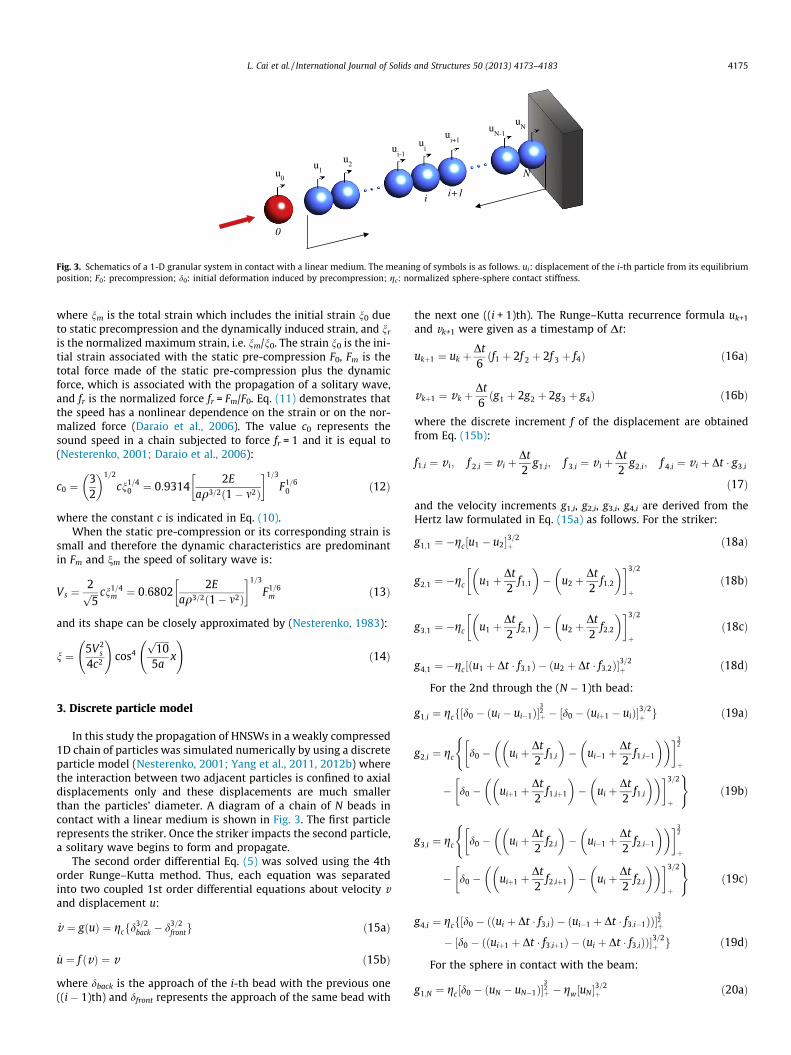
Fig. 3. Schematics of a 1-D granular system in contact with a linear medium. The meaning of symbols is as follows. ui: displacement of the i-th particle from its equilibriumposition; F0: precompression; d0: initial deformation induced by precompression; gc: normalized sphere-sphere contact stiffness.
L. Cai et al. / International Journal of Solids and Structures 50 (2013) 4173–4183 4175
where nm is the total strain which includes the initial strain n0 dueto static precompression and the dynamically induced strain, and nr
is the normalized maximum strain, i.e. nm/n0. The strain n0 is the ini-tial strain associated with the static pre-compression F0, Fm is thetotal force made of the static pre-compression plus the dynamicforce, which is associated with the propagation of a solitary wave,and fr is the normalized force fr = Fm/F0. Eq. (11) demonstrates thatthe speed has a nonlinear dependence on the strain or on the nor-malized force (Daraio et al., 2006). The value c0 represents thesound speed in a chain subjected to force fr = 1 and it is equal to(Nesterenko, 2001; Daraio et al., 2006):
c0 ¼32
� �1=2
cn1=40 ¼ 0:9314
2Eaq3=2ð1� m2Þ
� �1=3
F1=60 ð12Þ
where the constant c is indicated in Eq. (10).When the static pre-compression or its corresponding strain is
small and therefore the dynamic characteristics are predominantin Fm and nm the speed of solitary wave is:
Vs ¼2ffiffiffi5p cn1=4
m ¼ 0:68022E
aq3=2ð1� m2Þ
� �1=3
F1=6m ð13Þ
and its shape can be closely approximated by (Nesterenko, 1983):
n ¼ 5V2s
4c2
!cos4
ffiffiffiffiffiffi10p
5ax
!ð14Þ
3. Discrete particle model
In this study the propagation of HNSWs in a weakly compressed1D chain of particles was simulated numerically by using a discreteparticle model (Nesterenko, 2001; Yang et al., 2011, 2012b) wherethe interaction between two adjacent particles is confined to axialdisplacements only and these displacements are much smallerthan the particles’ diameter. A diagram of a chain of N beads incontact with a linear medium is shown in Fig. 3. The first particlerepresents the striker. Once the striker impacts the second particle,a solitary wave begins to form and propagate.
The second order differential Eq. (5) was solved using the 4thorder Runge–Kutta method. Thus, each equation was separatedinto two coupled 1st order differential equations about velocity vand displacement u:
_v ¼ gðuÞ ¼ gcfd3=2back � d3=2
frontg ð15aÞ
_u ¼ f ðvÞ ¼ v ð15bÞ
where dback is the approach of the i-th bead with the previous one((i � 1)th) and dfront represents the approach of the same bead with
the next one ((i + 1)th). The Runge–Kutta recurrence formula uk+1
and vk+1 were given as a timestamp of Dt:
ukþ1 ¼ uk þDt6ðf1 þ 2f 2 þ 2f 3 þ f4Þ ð16aÞ
vkþ1 ¼ vk þDt6ðg1 þ 2g2 þ 2g3 þ g4Þ ð16bÞ
where the discrete increment f of the displacement are obtainedfrom Eq. (15b):
f1;i ¼ v i; f 2;i ¼ v i þDt2
g1;i; f 3;i ¼ v i þDt2
g2;i; f 4;i ¼ v i þ Dt � g3;i
ð17Þ
and the velocity increments g1,i, g2,i, g3,i, g4,i are derived from theHertz law formulated in Eq. (15a) as follows. For the striker:
g1;1 ¼ �gc½u1 � u2�3=2þ ð18aÞ
g2;1 ¼ �gc u1 þDt2
f1;1
� �� u2 þ
Dt2
f1;2
� �� �3=2
þð18bÞ
g3;1 ¼ �gc u1 þDt2
f2;1
� �� u2 þ
Dt2
f2;2
� �� �3=2
þð18cÞ
g4;1 ¼ �gc u1 þ Dt � f3;1ð Þ � u2 þ Dt � f3;2ð Þ½ �3=2þ ð18dÞ
For the 2nd through the (N � 1)th bead:
g1;i ¼ gcf½d0 � ðui � ui�1Þ�32þ � ½d0 � ðuiþ1 � uiÞ�3=2
þ g ð19aÞ
g2;i ¼ gc d0 � ui þDt2
f1;i
� �� ui�1 þ
Dt2
f1;i�1
� �� �� �32
þ
(
� d0 � uiþ1 þDt2
f1;iþ1
� �� ui þ
Dt2
f1;i
� �� �� �3=2
þ
)ð19bÞ
g3;i ¼ gc d0 � ui þDt2
f2;i
� �� ui�1 þ
Dt2
f2;i�1
� �� �� �32
þ
(
� d0 � uiþ1 þDt2
f2;iþ1
� �� ui þ
Dt2
f2;i
� �� �� �3=2
þ
)ð19cÞ
g4;i ¼ gcf½d0 � ððui þ Dt � f3;iÞ � ðui�1 þ Dt � f3;i�1ÞÞ�32þ
� ½d0 � ððuiþ1 þ Dt � f3;iþ1Þ � ðui þ Dt � f3;iÞÞ�3=2þ g ð19dÞ
For the sphere in contact with the beam:
g1;N ¼ gc½d0 � ðuN � uN�1Þ�32þ � gw½uN �3=2
þ ð20aÞ
4176 L. Cai et al. / International Journal of Solids and Structures 50 (2013) 4173–4183
g2;N ¼gc
md0 � uN þ
Dt2
f1;N
� �� uN�1 þ
Dt2
f1;N�1
� �� �� �32
þ
� gw
muN þ
Dt2
f1;N
� �3=2
þð20bÞ
g3;N ¼gc
md0 � uN þ
Dt2
f2;N
� �� uN�1 þ
Dt2
f2;N�1
� �� �� �32
þ
� gw
muN þ
Dt2
f2;N
� �3=2
þð20cÞ
g4;N ¼gc
m½d0 � ððuN þ Dt � f3;NÞ � ðuN�1 þ Dt � f3;N�1ÞÞ�
32þ
� gw
m½uN þ Dt � f3;N�3=2
þ ð20dÞ
depth
width
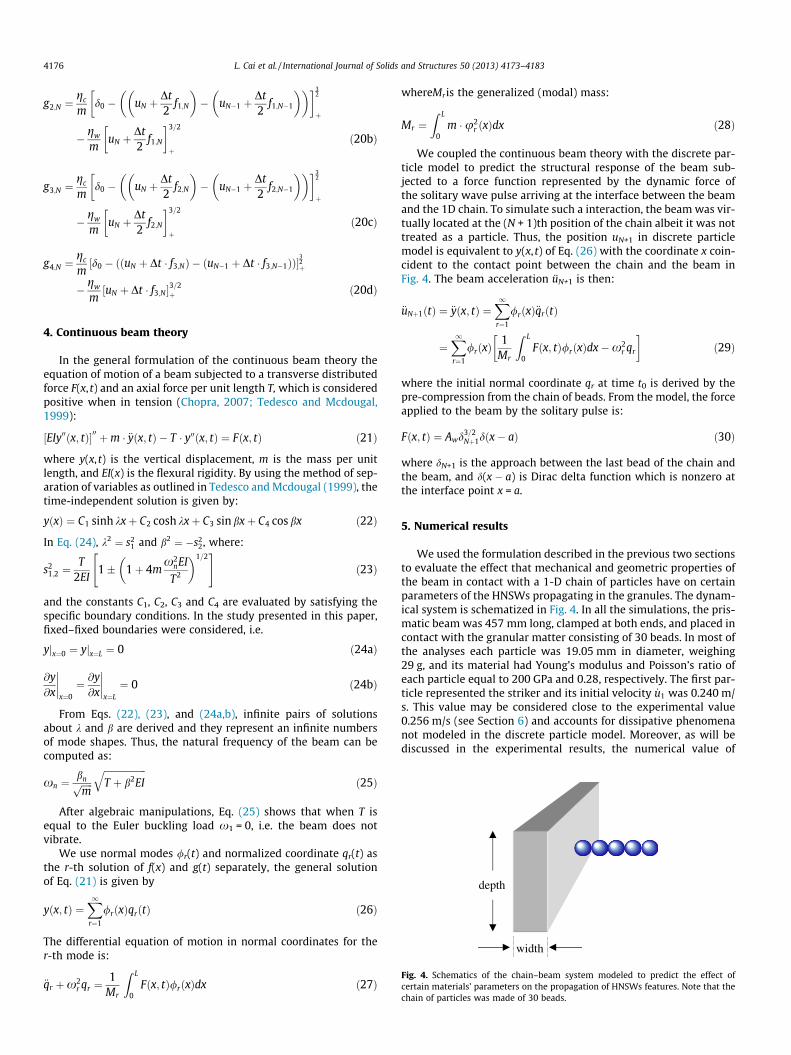
Fig. 4. Schematics of the chain–beam system modeled to predict the effect ofcertain materials’ parameters on the propagation of HNSWs features. Note that thechain of particles was made of 30 beads.
4. Continuous beam theory
In the general formulation of the continuous beam theory theequation of motion of a beam subjected to a transverse distributedforce F(x, t) and an axial force per unit length T, which is consideredpositive when in tension (Chopra, 2007; Tedesco and Mcdougal,1999):
½EIy00ðx; tÞ�00 þm � €yðx; tÞ � T � y00ðx; tÞ ¼ Fðx; tÞ ð21Þ
where y(x, t) is the vertical displacement, m is the mass per unitlength, and EI(x) is the flexural rigidity. By using the method of sep-aration of variables as outlined in Tedesco and Mcdougal (1999), thetime-independent solution is given by:
yðxÞ ¼ C1 sinh kxþ C2 cosh kxþ C3 sin bxþ C4 cos bx ð22Þ
In Eq. (24), k2 ¼ s21 and b2 ¼ �s2
2, where:
s21;2 ¼
T2EI
1� 1þ 4mx2
nEI
T2
� �1=2" #
ð23Þ
and the constants C1, C2, C3 and C4 are evaluated by satisfying thespecific boundary conditions. In the study presented in this paper,fixed–fixed boundaries were considered, i.e.
yjx¼0 ¼ yjx¼L ¼ 0 ð24aÞ
@y@x
x¼0¼ @y@x
x¼L
¼ 0 ð24bÞ
From Eqs. (22), (23), and (24a,b), infinite pairs of solutionsabout k and b are derived and they represent an infinite numbersof mode shapes. Thus, the natural frequency of the beam can becomputed as:
xn ¼bnffiffiffiffiffimp
ffiffiffiffiffiffiffiffiffiffiffiffiffiffiffiffiffiffiT þ b2EI
qð25Þ
After algebraic manipulations, Eq. (25) shows that when T isequal to the Euler buckling load x1 = 0, i.e. the beam does notvibrate.
We use normal modes /r(t) and normalized coordinate qr(t) asthe r-th solution of f(x) and g(t) separately, the general solutionof Eq. (21) is given by
yðx; tÞ ¼X1r¼1
/rðxÞqrðtÞ ð26Þ
The differential equation of motion in normal coordinates for ther-th mode is:
€qr þx2r qr ¼
1Mr
Z L
0Fðx; tÞ/rðxÞdx ð27Þ
whereMris the generalized (modal) mass:
Mr ¼Z L
0m �u2
r ðxÞdx ð28Þ
We coupled the continuous beam theory with the discrete par-ticle model to predict the structural response of the beam sub-jected to a force function represented by the dynamic force ofthe solitary wave pulse arriving at the interface between the beamand the 1D chain. To simulate such a interaction, the beam was vir-tually located at the (N + 1)th position of the chain albeit it was nottreated as a particle. Thus, the position uN+1 in discrete particlemodel is equivalent to y(x, t) of Eq. (26) with the coordinate x coin-cident to the contact point between the chain and the beam inFig. 4. The beam acceleration üN+1 is then:
€uNþ1ðtÞ ¼ €yðx; tÞ ¼X1r¼1
/rðxÞ€qrðtÞ
¼X1r¼1
/rðxÞ1
Mr
Z L
0Fðx; tÞ/rðxÞdx�x2
r qr
� �ð29Þ
where the initial normal coordinate qr at time t0 is derived by thepre-compression from the chain of beads. From the model, the forceapplied to the beam by the solitary pulse is:
Fðx; tÞ ¼ Awd3=2Nþ1dðx� aÞ ð30Þ
where dN+1 is the approach between the last bead of the chain andthe beam, and d(x � a) is Dirac delta function which is nonzero atthe interface point x = a.
5. Numerical results
We used the formulation described in the previous two sectionsto evaluate the effect that mechanical and geometric properties ofthe beam in contact with a 1-D chain of particles have on certainparameters of the HNSWs propagating in the granules. The dynam-ical system is schematized in Fig. 4. In all the simulations, the pris-matic beam was 457 mm long, clamped at both ends, and placed incontact with the granular matter consisting of 30 beads. In most ofthe analyses each particle was 19.05 mm in diameter, weighing29 g, and its material had Young’s modulus and Poisson’s ratio ofeach particle equal to 200 GPa and 0.28, respectively. The first par-ticle represented the striker and its initial velocity _u1 was 0.240 m/s. This value may be considered close to the experimental value0.256 m/s (see Section 6) and accounts for dissipative phenomenanot modeled in the discrete particle model. Moreover, as will bediscussed in the experimental results, the numerical value of
0
50
100
Forc
e (N
)
0
50
100
0 1 2 3 4 5 6
Forc
e (N
)
Time (msec)
Young's modulus=100 GPa
Young's modulus=220 GPa
IW
IW
PSW
PSW
SSW
SSW
(a)
(b)
L. Cai et al. / International Journal of Solids and Structures 50 (2013) 4173–4183 4177
0.24 m/s is such that the numerical and experimental amplitudesof the incident waves are very close.
The force profile associated with the propagation of the solitarypulse was measured at the center of the 5th and 10th particle awayfrom the interface. These particles are hereafter indicated as sensorbeads 2 (S2) and sensor bead 1 (S1), respectively. Four variableswere simulated by means of the models discussed in the previoustwo sections. We evaluated the effect of the beam’s Young’s mod-ulus and depth-to-width ratio, the effect of axial load applied tothe beam, and we observed the effect of the particles diameter.For each variable, a range of values were considered. Table 1 sum-marizes the settings used in the numerical analyses.
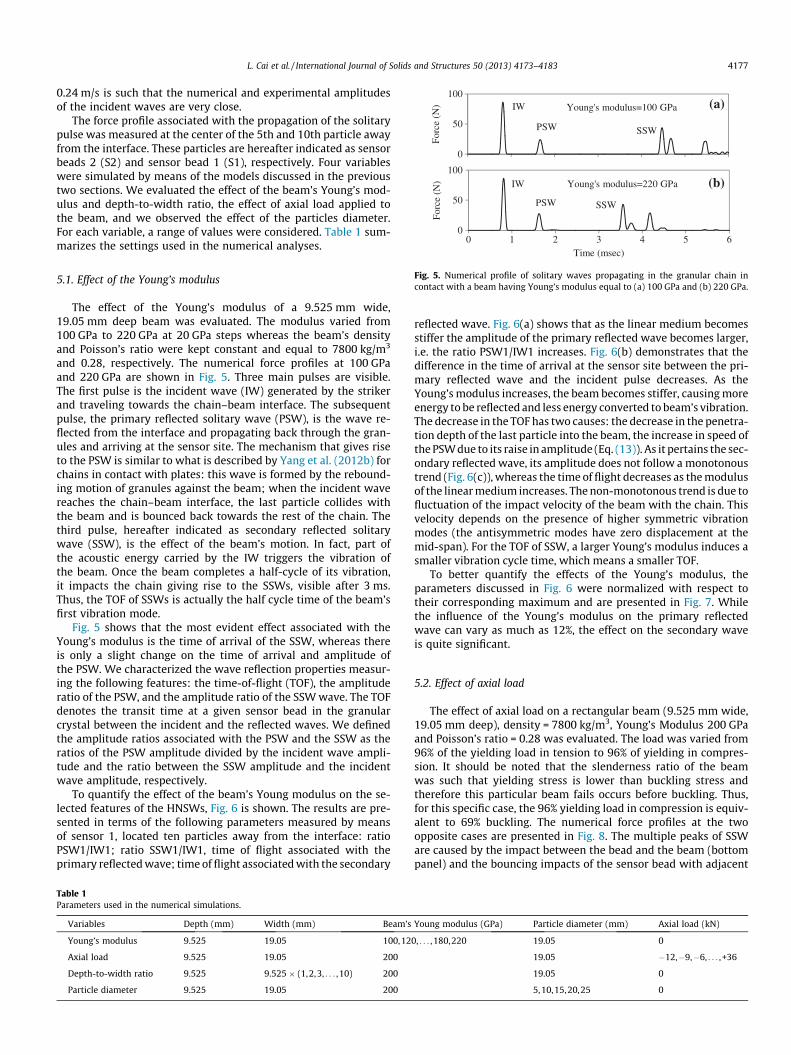
Fig. 5. Numerical profile of solitary waves propagating in the granular chain incontact with a beam having Young’s modulus equal to (a) 100 GPa and (b) 220 GPa.
5.1. Effect of the Young’s modulus
The effect of the Young’s modulus of a 9.525 mm wide,19.05 mm deep beam was evaluated. The modulus varied from100 GPa to 220 GPa at 20 GPa steps whereas the beam’s densityand Poisson’s ratio were kept constant and equal to 7800 kg/m3
and 0.28, respectively. The numerical force profiles at 100 GPaand 220 GPa are shown in Fig. 5. Three main pulses are visible.The first pulse is the incident wave (IW) generated by the strikerand traveling towards the chain–beam interface. The subsequentpulse, the primary reflected solitary wave (PSW), is the wave re-flected from the interface and propagating back through the gran-ules and arriving at the sensor site. The mechanism that gives riseto the PSW is similar to what is described by Yang et al. (2012b) forchains in contact with plates: this wave is formed by the rebound-ing motion of granules against the beam; when the incident wavereaches the chain–beam interface, the last particle collides withthe beam and is bounced back towards the rest of the chain. Thethird pulse, hereafter indicated as secondary reflected solitarywave (SSW), is the effect of the beam’s motion. In fact, part ofthe acoustic energy carried by the IW triggers the vibration ofthe beam. Once the beam completes a half-cycle of its vibration,it impacts the chain giving rise to the SSWs, visible after 3 ms.Thus, the TOF of SSWs is actually the half cycle time of the beam’sfirst vibration mode.
Fig. 5 shows that the most evident effect associated with theYoung’s modulus is the time of arrival of the SSW, whereas thereis only a slight change on the time of arrival and amplitude ofthe PSW. We characterized the wave reflection properties measur-ing the following features: the time-of-flight (TOF), the amplituderatio of the PSW, and the amplitude ratio of the SSW wave. The TOFdenotes the transit time at a given sensor bead in the granularcrystal between the incident and the reflected waves. We definedthe amplitude ratios associated with the PSW and the SSW as theratios of the PSW amplitude divided by the incident wave ampli-tude and the ratio between the SSW amplitude and the incidentwave amplitude, respectively.
To quantify the effect of the beam’s Young modulus on the se-lected features of the HNSWs, Fig. 6 is shown. The results are pre-sented in terms of the following parameters measured by meansof sensor 1, located ten particles away from the interface: ratioPSW1/IW1; ratio SSW1/IW1, time of flight associated with theprimary reflected wave; time of flight associated with the secondary
Table 1Parameters used in the numerical simulations.
Variables Depth (mm) Width (mm) Beam’s
Young’s modulus 9.525 19.05 100,12
Axial load 9.525 19.05 200
Depth-to-width ratio 9.525 9.525 � (1,2,3, . . . ,10) 200
Particle diameter 9.525 19.05 200
reflected wave. Fig. 6(a) shows that as the linear medium becomesstiffer the amplitude of the primary reflected wave becomes larger,i.e. the ratio PSW1/IW1 increases. Fig. 6(b) demonstrates that thedifference in the time of arrival at the sensor site between the pri-mary reflected wave and the incident pulse decreases. As theYoung’s modulus increases, the beam becomes stiffer, causing moreenergy to be reflected and less energy converted to beam’s vibration.The decrease in the TOF has two causes: the decrease in the penetra-tion depth of the last particle into the beam, the increase in speed ofthe PSW due to its raise in amplitude (Eq. (13)). As it pertains the sec-ondary reflected wave, its amplitude does not follow a monotonoustrend (Fig. 6(c)), whereas the time of flight decreases as the modulusof the linear medium increases. The non-monotonous trend is due tofluctuation of the impact velocity of the beam with the chain. Thisvelocity depends on the presence of higher symmetric vibrationmodes (the antisymmetric modes have zero displacement at themid-span). For the TOF of SSW, a larger Young’s modulus induces asmaller vibration cycle time, which means a smaller TOF.
To better quantify the effects of the Young’s modulus, theparameters discussed in Fig. 6 were normalized with respect totheir corresponding maximum and are presented in Fig. 7. Whilethe influence of the Young’s modulus on the primary reflectedwave can vary as much as 12%, the effect on the secondary waveis quite significant.
5.2. Effect of axial load
The effect of axial load on a rectangular beam (9.525 mm wide,19.05 mm deep), density = 7800 kg/m3, Young’s Modulus 200 GPaand Poisson’s ratio = 0.28 was evaluated. The load was varied from96% of the yielding load in tension to 96% of yielding in compres-sion. It should be noted that the slenderness ratio of the beamwas such that yielding stress is lower than buckling stress andtherefore this particular beam fails occurs before buckling. Thus,for this specific case, the 96% yielding load in compression is equiv-alent to 69% buckling. The numerical force profiles at the twoopposite cases are presented in Fig. 8. The multiple peaks of SSWare caused by the impact between the bead and the beam (bottompanel) and the bouncing impacts of the sensor bead with adjacent
Young modulus (GPa) Particle diameter (mm) Axial load (kN)
0, . . . ,180,220 19.05 0
19.05 �12,�9,�6, . . . , +36
19.05 0
5,10,15,20,25 0

y = -5E-13x5 + 4E-10x4 -2E-07x 3 + 4E-05x2 -0.0033x + 0.387R² = 1
0.26
0.28
0.30
0.32
100 125 150 175 200 225
Rat
io P
SW1
/ IW
1
y = 2E-13x5 + 4E-09x4 -3E-06x 3 + 0.0008x2 -0.0913x + 4.331R² = 0.9994
0.40
0.44
0.48
0.52
100 125 150 175 200 225
Rat
io S
SW1
/ IW
1
Young's modulus (GPa)
y = -4E-13x5 + 4E-10x4 -1E-07x 3 + 3E-05x2 -0.0032x + 1.0146R² = 1
0.81
0.82
0.83
0.84
0.85
0.86
100 125 150 175 200 225
TO
F PS
W1
(mse
c)
y = -2E-11x5 + 1E-08x4 -5E-06x 3 + 0.0009x2 -0.0926x + 7.5874R² = 1
2.6
2.8
3.0
3.2
3.4
3.6
3.8
100 125 150 175 200 225
TO
F SS
W1
(mse
c)
Young's modulus (GPa)
(c) (d)
(b)(a)
Fig. 6. Granular medium in contact with a beam made of different elastic modulus. Solitary wave features measured by sensor S1 as a function of the Young’s modulus. (a)Amplitude ratio of PSW. (b) Time of flight of PSW. (c) Amplitude ratio of SSW. (d) Time of flight of SSW.
70%
80%
90%
100%
100 125 150 175 200 225
Nor
mal
ized
am
plit
ude
rati
o
PSW1/IW1
SSW1/IW1
70%
80%
90%
100%
100 125 150 175 200 225
Nor
mal
ized
TO
F
Young's modulus (GPa)
PSW1
SSW1
(a)
(b)
Fig. 7. Granular medium in contact with a beam made of different elastic modulus.Solitary wave features relative to the primary and the secondary solitary wavesmeasured by sensor S1 as a function of the Young’s modulus. (a) Normalizedamplitude ratio. (b) Normalized time of flight.
4178 L. Cai et al. / International Journal of Solids and Structures 50 (2013) 4173–4183
beads (little flat peaks in the top panel). As for the effect of the axialload, the most evident difference between the force profiles is thetime of arrival of the secondary reflected wave.
Fig. 9 displays the HNSWs parameters as a function of the axialload. As it goes from compression to tension there is a change inthe slope of both the amplitude and the time of flight of the
0
50
100
Forc
e (N
)
0
50
100
0 2 4 6 8 10 12
Forc
e (N
)
Time (msec)
IW
IW
PSW
PSW
SSW
SSW
(a)
(b)
Fig. 8. Numerical profile of solitary waves propagating in the granular chain incontact with a beam subjected to: (a) 36 kN tensile load; (b) 36 kN compressiveload.
primary solitary waves whereas similar consideration can bedrawn for the time of flight of the secondary wave. The amplitudeof the secondary wave seems to increase overall, though there is nomonotonous trend. This is likely due to the disintegration of thesecondary pulse into many pulses whose propagation speed andattenuation are significantly affected by the mechanical propertiesof the bounding medium (Job et al., 2005; Yang et al., 2011, 2012b).
To better quantify the effects of the load, the parameters pre-sented above were normalized with respect to their correspondingmaximum value and they are displayed in Fig. 10. The effect of theaxial load on the amplitude of the primary reflected wave is in theorder of 10%. Given that the largest load simulated in this studygenerates a stress equal to 193 MPa, the sensitivity shown by thepropagation of HNSWs to the presence of axial load can beexploited in the future as a mean to evaluate the presence of stressin a linear medium in contact with the granular system.
It is interesting to compare qualitatively the sensitivity to ap-plied stress demonstrated by the HNSWs to the acoustoelastic phe-nomenon in which the speed of linear waves in a bulk medium or awaveguide depends upon the applied stress. For example, Rizzoand co-authors (Lanza di Scalea et al., 2003; Rizzo and Lanza di Sca-lea, 2003, 2004), found that the variation of the velocity of ultra-sonic wave propagating in cylindrical waveguides made of high-strength steel is in the order of 1% per GPa of stress. This impliesthat the sensitivity to the presence of stress visible on the engi-neering system modeled in this paper is about 50-fold.
As it pertains to the response associated with the secondarywave, the variation of its time of flight is even larger althoughnon-monotonic. Interestingly, the slope of the curve in the regionof positive load (beam in tension) is much smaller than the slopeof the curve in the region of negative load (beam in compression).This could be exploited to assess the transition from compressionto tension or vice versa. Finally, there is an apparent change intrend below �36 KN. We remark that an analysis at higher com-pression loads would be meaningless because the beam is not a lin-ear medium and therefore the formulations outlined in theprevious sections do not apply.
5.3. Effect of the depth-to-width ratio
The effect of the flexural stiffness on the 457 mm long beamhaving density = 7800 kg/m3, Young’s Modulus 200 GPa and Pois-son’s ratio = 0.28 was simulated. The flexural stiffness was variedby changing the moment of inertia of the beam. The width of the
y = 3E-10x5 - 2E-08x4 - 2E-07x3 + 3E-05x2 - 0.0007x + 0.312R² = 0.9998
0.28
0.30
0.32
0.34
-40 -30 -20 -10 0 10 20 30
Rat
io P
SW1
/ IW
1
y = -5E-09x5 + 5E-08x4 + 6E-06x3 - 0.0001x2 + 0.0017x + 0.4939R² = 0.8564
0
0.1
0.2
0.3
0.4
0.5
0.6
-40 -30 -20 -10 0 10 20 30
Rat
io S
SW1
/ IW
1
Axial load (kN)
y = -5E-11x5 + 3E-09x4 + 2E-08x3 - 5E-06x2 + 0.0001x + 0.8201R² = 0.9998
0.810
0.814
0.818
0.822
-40 -30 -20 -10 0 10 20 30
TO
F P
SW1
(mse
c)
y = -1E-08x5 + 1E-06x4 - 3E-05x3 + 0.0006x2 - 0.0279x + 2.8057R² = 0.999
0
2
4
6
8
10
-40 -30 -20 -10 0 10 20 30
TO
F SS
W1
(mse
c)
Axial load (kN)
(a) (b)
(c) (d)
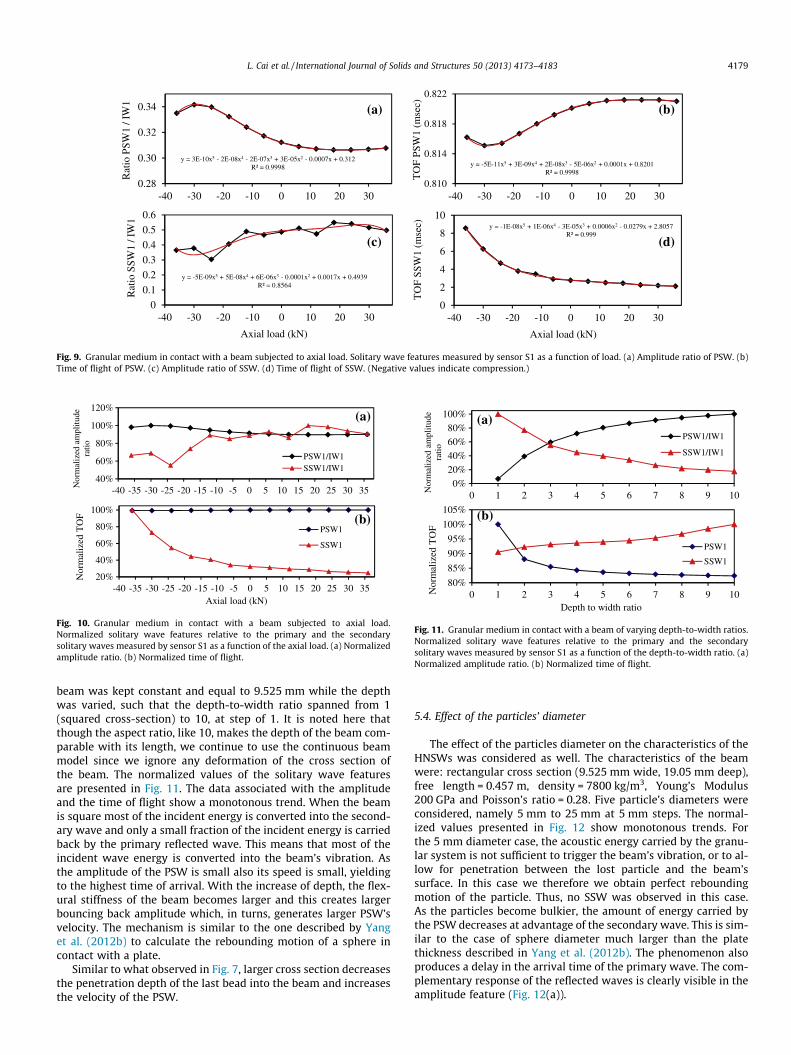
Fig. 9. Granular medium in contact with a beam subjected to axial load. Solitary wave features measured by sensor S1 as a function of load. (a) Amplitude ratio of PSW. (b)Time of flight of PSW. (c) Amplitude ratio of SSW. (d) Time of flight of SSW. (Negative values indicate compression.)
40%
60%
80%
100%
120%
-40 -35 -30 -25 -20 -15 -10 -5 0 5 10 15 20 25 30 35Nor
mal
ized
am
plit
ude
rati
o
PSW1/IW1SSW1/IW1
20%
40%
60%
80%
100%
-40 -35 -30 -25 -20 -15 -10 -5 0 5 10 15 20 25 30 35
Nor
mal
ized
TO
F
Axial load (kN)
PSW1
SSW1
(b)
(a)
Fig. 10. Granular medium in contact with a beam subjected to axial load.Normalized solitary wave features relative to the primary and the secondarysolitary waves measured by sensor S1 as a function of the axial load. (a) Normalizedamplitude ratio. (b) Normalized time of flight.
0%20%40%60%80%
100%
0 1 2 3 4 5 6 7 8 9 10
Nor
mal
ized
am
plit
ude
rati
oPSW1/IW1
SSW1/IW1
80%
85%
90%
95%
100%
105%
0 1 2 3 4 5 6 7 8 9 10Nor
mal
ized
TO
F
Depth to width ratio
PSW1
SSW1
(b)
(a)
Fig. 11. Granular medium in contact with a beam of varying depth-to-width ratios.Normalized solitary wave features relative to the primary and the secondarysolitary waves measured by sensor S1 as a function of the depth-to-width ratio. (a)Normalized amplitude ratio. (b) Normalized time of flight.
L. Cai et al. / International Journal of Solids and Structures 50 (2013) 4173–4183 4179
beam was kept constant and equal to 9.525 mm while the depthwas varied, such that the depth-to-width ratio spanned from 1(squared cross-section) to 10, at step of 1. It is noted here thatthough the aspect ratio, like 10, makes the depth of the beam com-parable with its length, we continue to use the continuous beammodel since we ignore any deformation of the cross section ofthe beam. The normalized values of the solitary wave featuresare presented in Fig. 11. The data associated with the amplitudeand the time of flight show a monotonous trend. When the beamis square most of the incident energy is converted into the second-ary wave and only a small fraction of the incident energy is carriedback by the primary reflected wave. This means that most of theincident wave energy is converted into the beam’s vibration. Asthe amplitude of the PSW is small also its speed is small, yieldingto the highest time of arrival. With the increase of depth, the flex-ural stiffness of the beam becomes larger and this creates largerbouncing back amplitude which, in turns, generates larger PSW’svelocity. The mechanism is similar to the one described by Yanget al. (2012b) to calculate the rebounding motion of a sphere incontact with a plate.
Similar to what observed in Fig. 7, larger cross section decreasesthe penetration depth of the last bead into the beam and increasesthe velocity of the PSW.
5.4. Effect of the particles’ diameter
The effect of the particles diameter on the characteristics of theHNSWs was considered as well. The characteristics of the beamwere: rectangular cross section (9.525 mm wide, 19.05 mm deep),free length = 0.457 m, density = 7800 kg/m3, Young’s Modulus200 GPa and Poisson’s ratio = 0.28. Five particle’s diameters wereconsidered, namely 5 mm to 25 mm at 5 mm steps. The normal-ized values presented in Fig. 12 show monotonous trends. Forthe 5 mm diameter case, the acoustic energy carried by the granu-lar system is not sufficient to trigger the beam’s vibration, or to al-low for penetration between the lost particle and the beam’ssurface. In this case we therefore we obtain perfect reboundingmotion of the particle. Thus, no SSW was observed in this case.As the particles become bulkier, the amount of energy carried bythe PSW decreases at advantage of the secondary wave. This is sim-ilar to the case of sphere diameter much larger than the platethickness described in Yang et al. (2012b). The phenomenon alsoproduces a delay in the arrival time of the primary wave. The com-plementary response of the reflected waves is clearly visible in theamplitude feature (Fig. 12(a)).

0%20%40%60%80%
100%
0 5 10 15 20 25Nor
mal
ized
am
plit
ude
ratio PSW1/IW1
SSW1/IW1
0%20%40%60%80%
100%
0 5 10 15 20 25
Nor
mal
ized
TO
F
Particle diameter (mm)
PSW1
SSW1
No SSW at d=5 mm
(a)
(b)
Fig. 12. Granular medium made of different particle diameters in contact with aslender beam. Normalized solitary wave features relative to the primary and thesecondary solitary waves measured by sensor S1 as a function of the granulesdimater. (a) Normalized amplitude ratio. (b) Normalized time of flight.
4180 L. Cai et al. / International Journal of Solids and Structures 50 (2013) 4173–4183
6. Experimental studies
6.1. Setup
Some of the numerical simulations discussed in Section 5 werevalidated by a series of experiments. The overall setup is presentedin Fig. 13. A chain of 30 beads (19.05 mm-diameter, 29 g, low car-bon steel beads, McMaster-Carr product number 9529K26) wasembedded into a horizontal channel made of structural fiber glasssquare tube (having sides 25.4 � 25.4 mm, and wall thickness3.175 mm, McMaster-Carr product number 8548K21). The firstbead acted as a striker by means of the system shown inFig. 13(b). The system consisted of an electromagnet made of amagnetic wire coil (AWG24) of about 1350 turns wrapped arounda 13 mm diameter and 33 mm long iron core. The electromagnetlifted the striker along a plastic slider. A DC power supply was usedto provide electrical current to the coil. To prevent the movementof the first particle of the chain toward the slider, a small plasticsleeve was glued to the bottom of the electromagnet. The electro-magnet was coupled to a switch circuit, driven by a NationalInstruments – PXI running in LabVIEW. Details of the control sys-tem are provided in (Ni and Rizzo, 2012b). A LabVIEW front panelwas designed to operate the actuator automatically. The solitarywaves were measured by using sensor beads located at 5th and10th position away from the beam. Each sensor particle containeda piezoelectric ceramic disk (circular plate with 0.3 mm thicknessand 19.05 mm diameter) with silver electrodes and micro-minia-ture wiring. The assembling and calibration procedures of the
L=304.8 or 609.6 mm (a)
Fig. 13. (a) Photos of the overall experimental setup. Granular system in contact with ametallic plates are secured to the beam by means of a clamp to simulate fixed support. Tthe beam and the optical table. (b) Close-up view of the actuator used to set the motion
instrumented particles were similar to those described in (Daraioet al., 2005; Ni et al., 2011b; Cai et al., 2013). The sensor particleswere connected to the same NI-PXI and the signals were digitizedat 10 MHz sampling rate. To assess repeatability, 50 measurementswere taken for each case and processed statistically in Matlab. Thisassembly was successfully used in a recent study (Cai et al., 2013).
The falling height of the striker was 4.7 mm. If rolling frictionwithout slipping is assumed, the striker velocity v = 0.256 m/swas derived from the conservation of energy:
mgh ¼ 12
mv2 þ 12
25
mr2� �
� vr
� �2ð31Þ
where (2/5) �mr2 is the moment of inertia of a sphere.
6.2. Effect of flexural stiffness and free-length: setup and results
The first experiment aimed at evaluating the effects related tomaterial type and geometry. In this series of tests, we examined:(1) the interaction between the HNSW transducer and two beamsmade of different materials, namely aluminum (McMaster-CARRproduct number 8975K794) and stainless steel (McMaster-CARRproduct number 8992K68); (2) the interaction between the gran-ules and beams made of the stainless steel having different free-lengths. Table 2 summarizes the properties of the two linearmedia.
Prior to discussing the experimental results, Fig. 14 presents thenumerical force profiles associated with the stainless steel beamand the aluminum beam. Fixed–fixed boundary conditions werehypothesized. To ease visualization, the forces are offset by 100N steps. Two interesting phenomena are observed. First, at theinterface with the aluminum (Fig. 14(b)), the PSW is not formed.The aluminum is much softer than the steel particles, and thereforemost of the pulse energy carried through the chain is convertedinto the kinetic energy associated with the vibration of the beam.Second, the length of the free span affects the time of arrival ofthe secondary solitary wave. As the span increases the time of ar-rival of the SSW increases. This is related to the beam’s natural fre-quency of vibration.
The experimental results are presented in Fig. 15. Each paneldisplays the results associated with four free lengths, and the val-ues of the dynamic forces measured by the bead sensors are offsetvertically with a step of 100 N. Moreover, to ease the comparisonwith the numerical results, the trigger time of the experimentalwaveforms was offset horizontally as well. Overall, the experimen-tal amplitudes of the reflected waves are smaller than the numer-ical predictions due to dissipative effects in the chain and in thebeams. Moreover, the arrival of the SSW at the sensor site is de-layed with respect to the numerical prediction. It is possible that
Electro-magnet
Plastic sleeve
Striker
Slider
(b)
beam made of different materials or different free-lengths. At each beam’s end, twohe free-span of the beam ‘‘sits’’ on two small supports to avoid any friction between
of the striker.
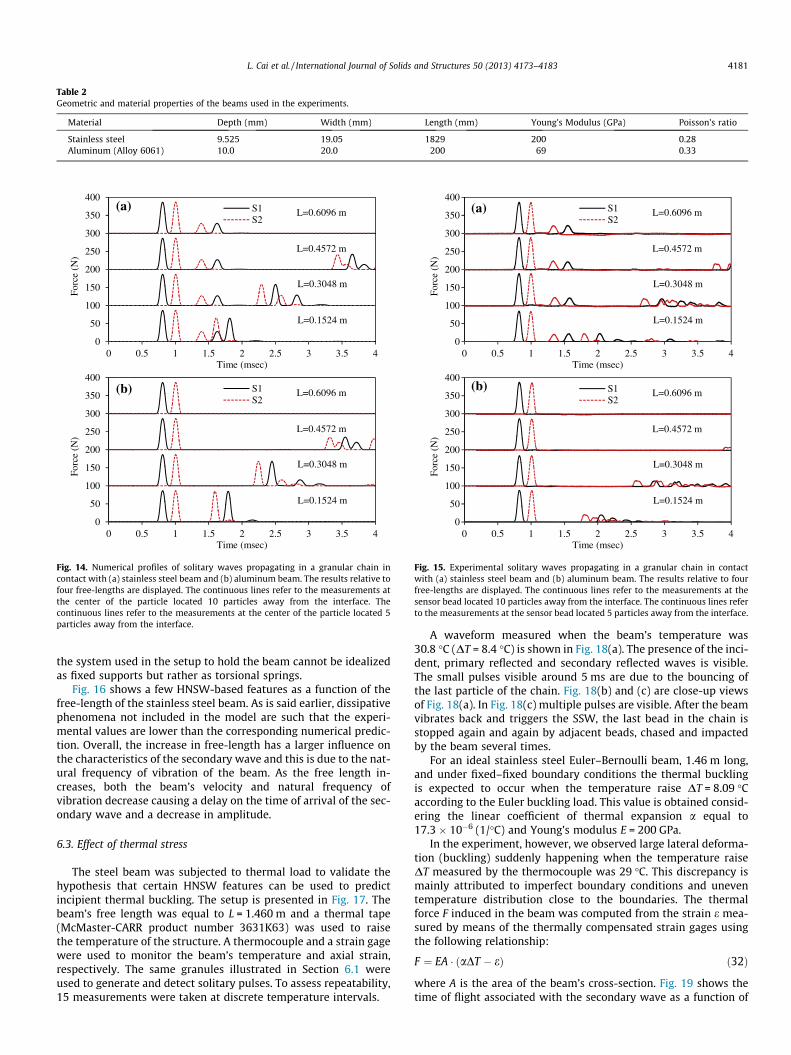
Table 2Geometric and material properties of the beams used in the experiments.
Material Depth (mm) Width (mm) Length (mm) Young’s Modulus (GPa) Poisson’s ratio
Stainless steel 9.525 19.05 1829 200 0.28Aluminum (Alloy 6061) 10.0 20.0 200 69 0.33
0
50
100
150
200
250
300
350
400
0 0.5 1 1.5 2 2.5 3 3.5 4
Forc
e (N
)
Time (msec)
S1S2
L=0.1524 m
L=0.3048 m
L=0.4572 m
L=0.6096 m
0
50
100
150
200
250
300
350
400
0 0.5 1 1.5 2 2.5 3 3.5 4
Forc
e (N
)
Time (msec)
S1S2
L=0.1524 m
L=0.3048 m
L=0.4572 m
L=0.6096 m
(a)
(b)
Fig. 14. Numerical profiles of solitary waves propagating in a granular chain incontact with (a) stainless steel beam and (b) aluminum beam. The results relative tofour free-lengths are displayed. The continuous lines refer to the measurements atthe center of the particle located 10 particles away from the interface. Thecontinuous lines refer to the measurements at the center of the particle located 5particles away from the interface.
0
50
100
150
200
250
300
350
400
0 0.5 1 1.5 2 2.5 3 3.5 4
Forc
e (N
)
Time (msec)
S1S2
L=0.1524 m
L=0.3048 m
L=0.4572 m
L=0.6096 m
0
50
100
150
200
250
300
350
400
0 0.5 1 1.5 2 2.5 3 3.5 4
Forc
e (N
)
Time (msec)
S1S2
L=0.1524 m
L=0.3048 m
L=0.4572 m
L=0.6096 m
(a)
(b)
Fig. 15. Experimental solitary waves propagating in a granular chain in contactwith (a) stainless steel beam and (b) aluminum beam. The results relative to fourfree-lengths are displayed. The continuous lines refer to the measurements at thesensor bead located 10 particles away from the interface. The continuous lines referto the measurements at the sensor bead located 5 particles away from the interface.
L. Cai et al. / International Journal of Solids and Structures 50 (2013) 4173–4183 4181
the system used in the setup to hold the beam cannot be idealizedas fixed supports but rather as torsional springs.
Fig. 16 shows a few HNSW-based features as a function of thefree-length of the stainless steel beam. As is said earlier, dissipativephenomena not included in the model are such that the experi-mental values are lower than the corresponding numerical predic-tion. Overall, the increase in free-length has a larger influence onthe characteristics of the secondary wave and this is due to the nat-ural frequency of vibration of the beam. As the free length in-creases, both the beam’s velocity and natural frequency ofvibration decrease causing a delay on the time of arrival of the sec-ondary wave and a decrease in amplitude.
6.3. Effect of thermal stress
The steel beam was subjected to thermal load to validate thehypothesis that certain HNSW features can be used to predictincipient thermal buckling. The setup is presented in Fig. 17. Thebeam’s free length was equal to L = 1.460 m and a thermal tape(McMaster-CARR product number 3631K63) was used to raisethe temperature of the structure. A thermocouple and a strain gagewere used to monitor the beam’s temperature and axial strain,respectively. The same granules illustrated in Section 6.1 wereused to generate and detect solitary pulses. To assess repeatability,15 measurements were taken at discrete temperature intervals.
A waveform measured when the beam’s temperature was30.8 �C (DT = 8.4 �C) is shown in Fig. 18(a). The presence of the inci-dent, primary reflected and secondary reflected waves is visible.The small pulses visible around 5 ms are due to the bouncing ofthe last particle of the chain. Fig. 18(b) and (c) are close-up viewsof Fig. 18(a). In Fig. 18(c) multiple pulses are visible. After the beamvibrates back and triggers the SSW, the last bead in the chain isstopped again and again by adjacent beads, chased and impactedby the beam several times.
For an ideal stainless steel Euler–Bernoulli beam, 1.46 m long,and under fixed–fixed boundary conditions the thermal bucklingis expected to occur when the temperature raise DT = 8.09 �Caccording to the Euler buckling load. This value is obtained consid-ering the linear coefficient of thermal expansion a equal to17.3 � 10�6 (1/�C) and Young’s modulus E = 200 GPa.
In the experiment, however, we observed large lateral deforma-tion (buckling) suddenly happening when the temperature raiseDT measured by the thermocouple was 29 �C. This discrepancy ismainly attributed to imperfect boundary conditions and uneventemperature distribution close to the boundaries. The thermalforce F induced in the beam was computed from the strain e mea-sured by means of the thermally compensated strain gages usingthe following relationship:
F ¼ EA � ðaDT � eÞ ð32Þ
where A is the area of the beam’s cross-section. Fig. 19 shows thetime of flight associated with the secondary wave as a function of

0.20
0.25
0.30
0.35
0.40
0.1 0.3 0.5 0.7 0.9 1.1
Rat
io P
SW1
/ IW
1 ExperimentalNumerical
0.72
0.74
0.76
0.78
0.80
0.82
0.84
0.1 0.3 0.5 0.7 0.9 1.1
TO
F P
SW
1 (m
sec)
ExperimentalNumerical
0.0
0.2
0.4
0.6
0.8
0.1 0.3 0.5 0.7 0.9 1.1
Rat
io S
SW
1 / I
W1
Length (m)
ExperimentalNumerical
0
5
10
15
0.1 0.3 0.5 0.7 0.9 1.1
TO
F SS
W1
(mse
c)
Length (m)
ExperimentalNumerical
(a)
(d)
(b)
(c)
Fig. 16. Solitary wave features measured by sensor S1 as a function of free length of the beam (a) force ratio of PSW over IW at sensor 1; (b) time of flight between PSW andIW at sensor 1; (c) force ratio of SSW over IW at sensor 1; (d) time of flight between SSW and IW at sensor 1.
(b)
(a)
Fig. 17. (a) Photos of the overall experimental setup. Granular system in contact with a beam subjected to thermal stress. The photo shows the beam’s boundary conditions, athermocouple, a heat tape, and a strain-gage box. (b) Close-up view of the chain–beam interface.
0
20
40
60
80
0 5 10 15 20 25 30 35 40 45
Forc
e (N
)
Time (msec)
S1S2
Arrival of SSW
IW1, 2
PSW1, 2
0
20
40
60
80
0.5 1 1.5 2
Forc
e (N
)
Time (msec)
S1S2
IW
PSW
-202468
10
32 34 36 38 40
Forc
e (N
)
Time (msec)
S1S2
SSWs
(a)
(c)(b)
Fig. 18. (a) Typical waveform of HNSW in thermal buckling test; (b) zoom-in plot ofIWs; (c) zoom-in plot of SSWs.
15
25
35
45
55
-3.5 -3.0 -2.5 -2.0 -1.5 -1.0 -0.5 0.0
TO
F SS
W1
(mse
c)
Force (kN)
ExperimentalNumerical
Fig. 19. Time of flight of the secondary solitary wave measured by sensor bead 1 asa function of the axial load. Experimentally, at temperature raise above 27 �C theTOF of the secondary wave exceeded the time window (60 ms) of the digitizer. Assuch the experimental (and therefore the numerical) data relative to higher loadsare not shown. (Negative values indicate compression.)
4182 L. Cai et al. / International Journal of Solids and Structures 50 (2013) 4173–4183
the axial force. The agreement between experimental and numeri-cal results is very good. As explained in Section 5.1, the TOF ofSSW is related with the natural frequency. From Eq. (26) we knowthat the SSW arrives later when the axial compression increasesand at buckling force, the natural frequency is zero which means
the TOF of SSW should be infinite and this is also what Fig. 19 indi-cates. Thus, we can predict the occurrence of the buckling when thetime of flight of SSW approaches infinite.
Finally, the wave features as a function of temperature raise arepresented in Fig. 20. With the exception of the feature relative tothe time of arrival of the SSW, the other three features do not showany specific pattern. This is likely due to the fact that the axial forcegenerated on the beam is not sufficiently large. At DT = 27 �C, thecompressive force is slightly above 3.0 kN which is a small fractionof the interval ± 35 kN examined in Figs. 8–10.

0.1
0.2
0.3
0.4
0.5
0.6
0.7
0 5 10 15 20 25
Rat
io P
SW1
/ IW
1
ExperimentalNumerical
0.74
0.76
0.78
0.80
0.82
0.84
0 5 10 15 20 25
TO
F P
SW1
(mse
c)
ExperimentalNumerical
0.0
0.2
0.4
0 5 10 15 20 25
Rat
io S
SW1
/ IW
1
Temperature (ºC)
ExperimentalNumerical
15
25
35
45
55
0 5 10 15 20 25
TO
F SS
W1
(mse
c)
Temperature (ºC)
ExperimentalNumerical
(b)(a)
(c)(d)
Fig. 20. Granular medium in contact with a beam subjected to thermal load. Solitary wave features measured by sensor S1 as a function of load. (a) Amplitude ratio of PSW.(b) Time of flight of PSW. (c) Amplitude ratio of SSW. (d) Time of flight of SSW.
L. Cai et al. / International Journal of Solids and Structures 50 (2013) 4173–4183 4183
7. Conclusions
In the study presented in this article we investigated the inter-action of highly nonlinear solitary waves with beams of differentgeometric and mechanical properties or subjected to thermalstress. The solitary waves propagated along a one-dimensionalchain of spherical particles in contact perpendicular to the planeof the beam having minimum moment of inertia. We found thatthe waves reflected at the beam-chain interface are significantlyaffected by the geometry, material properties, and applied stress.In particular we found that both the time of flight and the ampli-tude of the waves are affected by the parameters investigated inthis study. We quantified these dependencies numerically by cou-pling a discrete particle model to the continuous beam theory toevaluate the response of beam subjected to a forcing functionequal to the solitary wave pulse profile. Some of the numericalmodels were validated experimentally.
Some of the findings of this study can be used to develop a novelnondestructive evaluation tool to predict the mechanical proper-ties of beam structures and more important to predict incipientthermal buckling. With respect to ultrasonic methods based onacoustoelasticity, the proposed method may provide uniqueadvantages in terms of larger sensitivity, portability, and cost. Fu-ture works shall focus on improving the numerical model to ac-count for dissipative phenomena and on testing larger structures.
Acknowledgments
The authors acknowledge the support of the U.S. Federal Rail-road Administration under Contract DTFR53-12-C-00014.
References
Boechler, N., Theocharis, G., Daraio, C., 2011. Bifurcation-based acoustic switchingand rectification. Nat. Mater. 10, 665–668.
Cai, L., Yang, J., Rizzo, P., Ni, X., Daraio, C., 2013. Propagation of Highly NonlinearSolitary Waves in a Curved Granular Chain. Granular Matters 15 (3), 357–366.
Carretero-González, R., Khatri, D., Porter, M.A., Kevrekidis, P.G., Daraio, C., 2009.Dissipative solitary waves in granular crystals. Phys. Rev. Lett. 102, 024102-1–024102-4.
Chatterjee, A., 1999. Asymptotic solution for solitary waves in a chain of elasticspheres. Phys. Rev. E 59, 5912–5919.
Chopra, A.K., 2007. Dynamics of Structures, fourth ed. Prentice-Hall internationalseries in civil engineering and engineering mechanics.
Coste, C., Falcon, E., Fauve, S., 1997. Solitary waves in a chain of beads under Hertzcontact. Phys. Rev. E 56, 6104–6117.
Coste, C., Gilles, B., 1999. On the validity of Hertz contact law for granular materialacoustics. Eur. Phys. J. B 7, 155–168.
Daraio, C., Nesterenko, V.F., Herbold, E.B., Jin, S., 2005. Strongly nonlinear waves in achain of Teflon beads. Phys. Rev. E 72, 016603-1–016603-9.
Daraio, C., Nesterenko, V.F., Herbold, E.B., Jin, S., 2006. Tunability of solitary waveproperties in one-dimensional strongly nonlinear phononic crystals. Phys. Rev.E 73, 026610-1–026610-10.
Fraternali, F., Porter, M.A., Daraio, C., 2009. Optimal design of composite granularprotectors. Mech. Adv. Mater. Struct. 17, 1–19.
Hong, J., Xu, A., 2002. Nondestructive identification of impurities in granularmedium. Appl. Phys. Lett. 81, 4868–4870.
Job, S., Melo, F., Sokolow, A., Sen, S., 2005. How Hertzian solitary waves interact withboundaries in a 1D granular medium. Phys. Rev. Lett. 94, 178002-1–178002-4.
Job, S., Melo, F., Sokolow, A., Sen, S., 2007. Solitary wave trains in granular chains –experiments, theory and simulations. Granular Matter 10, 13–20.
Landau, L.D., Lifshitz, E.M., 1986. Theory of Elasticity, third ed. Pergamon.Lanza di Scalea, F., Rizzo, P., Seible, F., 2003. Stress measurement and defect detection
in steel strands by guided stress waves. J. Mater. Civ. Eng. 15, 219–227.Lazaridi, A.N., Nesterenko, V.F., 1985. Observation of a new type of solitary waves in
one-dimensional granular medium. J. Appl. Mech. Tech. Phys. 26, 405–408.Nesterenko, V.F., 1983. Propagation of nonlinear compression pulses in granular
media. J. Appl. Mech. Tech. Phys. 24, 733–743.Nesterenko, V.F., Lazaridi, A.N., Sibiryakov, E.B., 1995. The decay of soliton at the
contact of two ‘‘acoustic vacuums’’. J. Appl. Mech. Tech. Phys. 36, 166–168.Nesterenko, V.F., 2001. Dynamics of Heterogeneous Materials. Springer-Verlag, New
York.Nesterenko, V.F., Daraio, C., Herbold, E.B., Jin, S., 2005. Anomalous wave reflection at
the interface of two strongly nonlinear granular media. Phys. Rev. Lett. 95,158702-1–158702-4.
Ni, X., 2011. Nondestructive evaluation and structural health monitoring based onhighly nonlinear solitary waves. Ph.D. Dissertation, University of Pittsburgh.
Ni, X., Rizzo, P., Daraio, C., 2011a. Laser-based excitation of nonlinear solitary wavesin a chain of particles. Phys. Rev. E 84, 026601-1–026601-5.
Ni, X., Rizzo, P., Daraio, C., 2011b. Actuators for the generation of highly nonlinearsolitary waves. Rev. Sci. Instrum. 82, 034902-1–034902-6.
Ni, X., Rizzo, P., Yang, J., Katri, D., Daraio, C., 2012. Monitoring the hydration ofcement using highly nonlinear solitary waves. NDT E Int. 52, 76–85.
Ni, X., Rizzo, P., 2012a. Highly nonlinear solitary waves for the inspection ofadhesive joints. Exp. Mech. 52, 1493–1501.
Ni, X., Rizzo, P., 2012b. Use of highly nonlinear solitary waves in NDT. Mater. Eval.70, 561–569.
Rizzo, P., Lanza di Scalea, F., 2003. Effect of frequency on the acoustoelastic responseof steel bars. Exp. Tech. 27 (6), 40–43.
Rizzo, P., Lanza di Scalea, F., 2004. Load measurement and health monitoring in cablestays via guided wave magnetostrictive ultrasonics. Mater. Eval. 62, 1057–1065.
Sen, S., Manciu, M., Wright, J.D., 1998. Solitonlike pulses in perturbed and drivenHertzian chains and their possible applications in detecting buried impurities.Phys. Rev. E 57, 2386–2397.
Tedesco, J., Mcdougal, W., Ross, C., 1999. Structural Dynamics – Theory andApplications. Addison Wesley.
Yang, J., Silvestro, C., Khatri, D., De Nardo, L., Daraio, C., 2011. Interaction of highlynonlinear solitary waves with linear elastic media. Phys. Rev. E 83, 046606-1–046606-12.
Yang, J., Silvestro, C., Sangiorgio, S.N., Borkowski, S.L., Ebramzadeh, E., De Nardo, L.,Daraio, C., 2012a. Nondestructive evaluation of orthopaedic implant stability inTHA using highly nonlinear solitary waves. Smart Mater. Struct. 21, 012002-1–012002-10.
Yang, J., Khatri, D., Anzel, P., Daraio, C., 2012b. Interaction of highly nonlinearsolitary waves with thin plates. Int. J. Solids Struct. 49, 1463–1471.