on the analysis of experimental observations in...
TRANSCRIPT
601
On the Analysis of Experimental Observations in Problems ofElastic Stability.
By R . V . S o u t h w e l l , F .R .S .
(Received December 16, 1931.)
Introduction and Summary.1. In the concluding section of a paper published in 1913* I endeavoured to
assess the practical value of a theory of elastic instability . Two factors operate to im pair agreem ent w ith experim ental results : (1) the finite strength of actual materials, and (2) unavoidable imperfections of workmanship, which prohibit th e realisation of its concept of a “ critical load.” I showed how in one problem (the centrally loaded stru t) theory can be extended to take account of plastic distortion ; and by reference to a mechanical example I indicated w hat kind of result is to be expected when inaccuracies in the specimen or in the experim ental apparatus introduce displacements which increase continuously w ith the load.
Thus (to take th e simplest example as an illustration) th e well-known theory of Euler indicates th a t an initially stra igh t and centrally loaded s tru t will remain stra igh t while the end th ru s t is increased from zero up to a certain value P c, b u t th a t when th is “ critical load ” is a tta ined the s tru t m ay bend into the form of a single bow, since this form can be maintained by end thrust acting alone. There is an “ exchange of stabilities ” ,f whereby for end th rusts exceeding the critical value the equilibrium of the stra igh t form becomes unstable and th a t of the bent form stable. If on the o ther hand the s tru t is initially bowed, so th a t the central deflection has a small b u t finite value when the end th ru s t P is zero, th is central deflection will increase w ith P, and experim ent m ay be expected to yield some curve of the type shown by full lines in fig. 1, where l denotes the length and E l the (uniform) “ flexural rigidity ” of the s tru t. The smaller the initial deflection, the more closely will the experim ental curve approach the lim iting form OAB, which is the curve given by Euler’s analysis.
B u t Euler’s theory does no t take account of the finite strength of actual materials, whereby Hooke’s law ceases to be satisfied when the stress exceeds
* «Phil. Trans.,’ A , vol. 213, pp. 187-244 (1913). t H. Poincar6, * A cta M athem atical vol. 7, p. 259 (1885).
on July 3, 2018http://rspa.royalsocietypublishing.org/Downloaded from

602 R. V. Southwell.
a certain limit. I showed in my paper* that the experimental curves must be expected, on this account, to fall away from the full-line curves of fig. 1, somewhat as indicated by dotted lines. Thus, while the theoretical (full line) curves rise continuously, the experimental (dotted) curves will exhibit maximum values of the end thrust P, and it is these maxima which will be recorded in experimental work as collapsing or “ crippling loads ” .
2. On this view, agreement between the critical load, as given by Euler’s analysis, and the crippling load, as determined by experiment, is to be regarded
as a somewhat fortuitous occurrence, to be expected only in the case of long struts. If the material obeyed Hooke’s law for stresses of all conceivable magnitudes, there would be no collapse at all (the full-line curves rise continuously) : if on the other hand the limit of proportional elasticity is attained under an end thrust considerably less than Euler’s critical load, the experimental curves will have forms more like those of fig. 2, and their maxima will have no close correspondence with Euler’s value.f Long struts made and loaded with reasonable accuracy will give results in apparent accord with Euler’s analysis : first, because (since the critical load is small) the deflection must be considerable by the time that the limit of proportional elasticity is reached ; and secondly because, on this account, the maximum for P will occur somewhere on the flat part of the curve, and therefore close to the horizontal line AC of fig. 1.
Experiments made by A. Robertson, and described in a recent paper, J
* Cf. also ‘ Aero. Res. Ctee., Reports and Memoranda,’ No. 918 (1924).t In fig. 2, OAB is the limiting form assumed by the curve for a straight and centrally
loaded strut, OA being the critical load as modified by the occurrence of elastic failure in the material.
t “ The Strength of Struts,” Selected Paper No. 28 (1925) of the Institution of Civil Engineers.
F ig. 1. Fig. 2.
on July 3, 2018http://rspa.royalsocietypublishing.org/Downloaded from
603
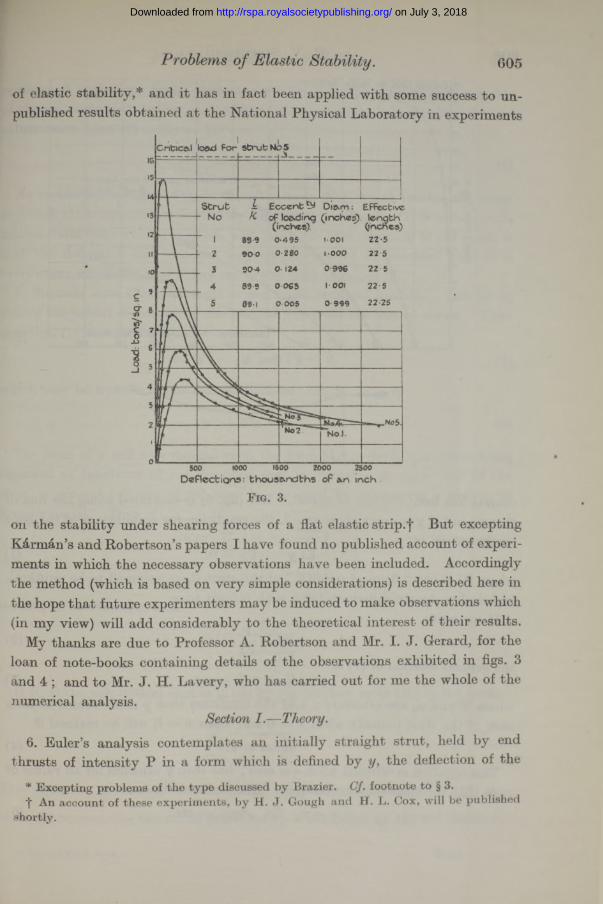
lend considerable support to the views here stated. Fig. 3 (which reproduces his fig. 17) shows load-deflection curves obtained from five solid struts of mild steel, 1 inch in diameter, which were loaded with known eccentricities. Abscissae in this diagram are deflections measured from the unstressed configuration as zero, so th a t (for example) the curve for stru t No. 1 would start from zero load and a deflection of 495 thousandths of an inch, if plotted in accordance with the convention of fig. 2 ; on this understanding it will be seen th a t the main features of the theoretical curves are represented. Fig. 4 (reproducing his fig. 18) shows the elastic portions of the load-deflection curves plotted to a larger scale, and separated for greater distinctness.
3. Curves of this nature may be determined by experiment in almost all cases of elastic stability* ; in the papers cited I have termed them “ curves of distortion.” They have the common feature th a t initial “ deflections” , due to inaccuracies either of manufacture or of loading, are intensified by the action of the applied forces ; bu t when the initial deflection is small they approach closely, during the early stages of the test, to a limiting form OAB (figs. 1 and 2) which consists of two branches—(1) the axis of zero deflection, and (2) a curve AB cutting this axis horizontally a t a height (OA) which represents the “ least critical load ”
So far as I am aware, the stru t is the only problem of elastic stability in which theory can be extended to predict a critical load in the circumstances indicated by fig. 2—i.e., when this load imposes a stress on the material in excess of its limit of elastic proportionality. In all other problems perfect elasticity must be presumed, and hence the only prediction which can be made by theory is the quantity corresponding with Euler’s critical load. The question is then presented,—when the experimental observations fall on curves of the type of fig. 2, and the critical load of theory is never attained, can any comparison be made between theory and experiment ?
The present paper is an attem pt to deal with this question. Again fixing attention on the stru t as the simplest example which can be taken, I shall show 'that in all cases, and whether the circumstances are those typified by fig. 1 or by fig, 2, the theoretical curves of distortion approximate, within the region of small deflections, to rectangular hyperbolas having as asymptotes the axis of zero deflection and the horizontal line P = P x. Now by a suitable change of co-ordinates any such hyperbola may be transformed into a straight line, of
* An exception, is found, in the type of instability discussed by L. Brazier in his paper “ On the Flexure of Thin Cylindrical Shells, etc.,” ‘ Proc. Roy. Soc.,’ A, vol. 116, pp. 104-114 C1927).
Problems of Elastic Stability.
on July 3, 2018http://rspa.royalsocietypublishing.org/Downloaded from
604 R. Y. Southwell.
which the slope is a measure of Px ; so the experimental observations, if plotted on a similar basis, should afford an estimate of the critical loading predicted by theory, even in cases where this load was not in fact attained, on account of elastic failure of the material.
4. The limitations of the method are discussed in § 10. The observed deflections must be neither large nor very small, and hence only trial can reveal in any particular instance whether sufficient observations are available, within its range of application, to afford a reliable estimate. Mr. J. H. Lavery, a research student working in the Engineering Laboratory at Oxford, has applied it at my request to results obtained by T. von K&rm&n in a series of very accurate experiments on straight struts (see § 11). When the circumstances are those of fig. 1 (i.e., for the more slender of Karman’s struts) it has given very satisfactory results ; but in the tests of shorter struts too few observations were recorded, within the range of deflections which the material could sustain elastically, for any conclusion to be drawn.
In order that the method might be tested further, Professor Robertson has kindly supplied me with details of the numerical observations upon which his curves of distortion (figs. 3 and 4) were based. Since the method presumes that the load is applied quite centrally at the ends of the strut, struts Nos. 1-4 hardly provide a fair te s t ; but it would seem unlikely that the very small eccentricity (0*005 inch) with which his strut No. 5 was loaded can have involved any serious discrepancy, and the results for this strut provide a case in which (as will be seen from fig. 3) the critical load of theory was not attained.
The analysis of this case is discussed in § 12. As a test of the method it is not entirely conclusive, but it has yielded interesting results. Plotted on the new basis the observations yield not one straight line, but two : the first line indicates a critical load some 10 per cent, in excess of the theoretical value; but the second (on which the plotted points fall after the central deflection has attained a magnitude of about 0*02 inch) indicates a value for the critical load which is almost exactly correct. These results suggest that a slight constraint (probably due to friction) acted on the ends of the strut during th.6 early stages of the test, but was overcome subsequently, when the bending had become appreciable ; whether this explanation is correct or not,* it will be conceded that the new basis of plotting has revealed a feature of the test, calling for explanation, which was not apparent before.
5. The method is applicable without modification to all ordinary problems* Professor Robertson, from his memory of the experiment, is prepared to accept this
explanation.
on July 3, 2018http://rspa.royalsocietypublishing.org/Downloaded from
605
of elastic stability,* and it has in fact been applied with some success to unpublished results obtained a t the National Physical Laboratory in experiments
Problems of Elastic Stability.
Critical 'load For strut No 5
Strutf t of loading (inches) length
(inches). (inches)8 9 9 0 -4 9 5 1001
9 0 ‘0 0-280 1*000
9 0 4 0 - 124
69-9 0 -0 8 5 I 001
0 9 9 9
0 996
22 250 005
500 1000 1500 2000 2500Deflections: thousandths oF an inch .
F ig. 3.
on the stability under shearing forces of a flat elastic strip .f But excepting K&rm&n’s and Robertson’s papers I have found no published account of experiments in which the necessary observations have been included. Accordingly the method (which is based on very simple considerations) is described here in the hope th a t future experimenters may be induced to make observations which (in my view) will add considerably to the theoretical interest of their results.
My thanks are due to Professor A. Robertson and Mr. I. J. Gerard, for the loan of note-books containing details of the observations exhibited in figs. 3 and 4 ; and to Mr. J . H. Lavery, who has carried out for me the whole of the numerical analysis.
Section I .—Theory.6. Euler’s analysis contemplates an initially straight strut, held by end
thrusts of intensity P in a form which is defined by y, the deflection of the
* Excepting problems of the type discussed by Brazier. Cf. footnote to § 3.•{• An account of these experiments, by H. J. Gough and H. L. Cox, will be published
shortly.
on July 3, 2018http://rspa.royalsocietypublishing.org/Downloaded from

606 E. V. Southwell.
■Theoretical curve drawn from formula <5~e (sec— -I Y
Deflections - Thouoandthi of an 2n c r 250 300 330 400 4S0
Fig. 4.
p 3S»....> JC
JyF ig. 5.
central line from the line of thrust. If (fig. 5) is measured along the line of thrust, and if yis everywhere small, the condition for equilibrium of the bent configuration is
EI*," + P<, = 0, (1)
where E l is the “ flexural rigidity ” of the strut (here assumed to be uniform), and dashes denote differentiations with respect to x.
If we write
the general solution of (1) isy = Y sin a (x — x0), (3)
where Y and x0 are arbitrary ; and the condition tha t y must vanish at both ends of the strut (namely when x — 0 and when x = 1) will be realized if
sin oil = 0. (4)This equation is satisfied when a is zero ; but then y vanishes for all values of
x, so that the strut remains straight. The further solutionsa = 7c, 2n, 37t, ... etc. (5)
on July 3, 2018http://rspa.royalsocietypublishing.org/Downloaded from

Problems of Elastic Stability. 607
correspond with bent forms characterized by 1, 2, 3, ... bays, each capable of being sustained by an end thrust of appropriate m agnitude; for on substitution from (2) in (5) we have
No restriction is imposed upon the magnitude of Y, which (within the range to which (1) is applicable) is entirely arbitrary. Actually (1) is an approximation valid only when y is small, and hence the true meaning of our result is that the deflection can increase without increase of P, provided that it is everywhere small and th a t P has one of the critical values (6).
7. Suppose now th a t the stru t is not quite straight initially ; and let yQ denote the initial deflection of the central line from the line of thrust. Then equation (1) is replaced by
The form of y will now depend upon the form of y0,—both quantities being regarded as functions of x. Provided th a t y$ vanishes a t either end of the strut, a general solution of (8) may be obtained by expressing y and y0 in Fourier series. Thus if
n27r2
If P w is the wth critical load as given by (6), we may write (10) in the form
*£» __ 1
This equation gives the ratio in which the component wn sin — > ^he
series (9) representing the initial deflection y0, is magnified by the end thrust P.
— = 1 ,4 , 9, ...e tc .P lz(6)
E I ( / / - 2 / 0") + Py = 0,
which may be written in the equivalent form
y" + a = y0".
(7)
(8)
we find on substitution tha t
w,n <x2Z2 * (10)
(11)
2 sVOL. CXXXV.--- A.
on July 3, 2018http://rspa.royalsocietypublishing.org/Downloaded from

608 It. V. Southwell.
As P approaches the first critical value Pl5 we see that wx will be very largely magnified, approximately in the ratio 4 :3 , w3 approximately in the ratio 9 : 8, and so on. This result explains why as the load is increased every strut (whatever be its initial form, provided only that this was reasonably flat) appears to bend into a sine wave of one bay : other harmonics are present, but they are very little magnified by the load, whereas the first harmonic soon becomes large.
8. The deflection of the strut at its centre may be written, according to (9), in the form
8 = w1 - w 3 -|-tt)5 - ... (12)
(the even harmonics making no contribution); and it follows from what has been said that to a close approximation, if P is a fairly considerable fraction of Pl5 we may write
(13)
Thus, provided that equation (7) is applicable (which will be true if the curvature is slight and if the limit of proportional elasticity is not exceeded), the theoretical form for the “ curve of distortion ”—i.e. for the curve which relates 8 with P—approximates to a rectangular hyperbola having the axis of Pj and the horizontal line (P = Px) as asymptotes.
If these predictions are confirmed by experiment, related observations of P and 8 will give points on a rectangular hyperbola, provided that 8 on the one hand is of such magnitude that wx dominates the series on the right of (12), and on the other hand is not so large that the central bending moment P8 is sufficient to impair the elasticity of the strut.*
9. Now if OAB (fig. 6) is a rectangular hyperbola passing through the origin of co-ordinates, and having as asymptotes the lines whose equations referred to Ox, O yare
x + a = 0 1 y — p = 0,J
(14)
the equation to this hyperbola will bexy — $x-}- 0. (15)
Dividing by y, and writing
*> = - , (16)y
* Or so large that equation (7) ceases to be applicable; but in practical cases elastic failure will occur first.
on July 3, 2018http://rspa.royalsocietypublishing.org/Downloaded from

609
we obtain tbe equationx — + a = 0, (17)
which shows th a t values of v, if plotted against x, will fall on a straight line. This line cuts the cc-axis a t a point (—a, 0) on the vertical asymptote of the original hyperbola (fig. 6), and its inverse slope ( is a measure of theheight (P) of the horizontal asymptote.
Applying this result to the experimental observations contemplated a t the end of § 8, we see th a t if the plotted values of load and measured deflection fall closely on a rectangular hyperbola passing through the origin of co-ordinates, then when v, the ratio (measured deflection) -r- (end load), is plotted against the measured deflection x, the points will fall closely on a straight line, representing a relation of the form (17); and the inverse slope of this line ( = dxjdv) will afford an estimate of the least critical load Pj.
Again, the plotted line will cut the horizontal axis (v = 0) a t a point on the vertical asymptote of the hyperbola which relates x with P ; and it follows th a t a is a measure of the initial deflection which this hyperbola presumes. This, of course, is a quantity of less practical interest than Px ; but it has some importance, because our analysis may be expected to apply best to cases in which the initial deflection was small.
Section I I .—Application to Experimental Results.10. The limitations of the foregoing theory must be clearly recognized.
As stated in § 8, the relation between measured load and deflection will not be hyperbolic if the deflections are so large tha t the elasticity of the material is impaired ; moreover, when the deflections are large the expression for the curvature which has been used to derive equation (7) will not be a legitimate approximation.* At the other end of the range, we have the circumstance tha t when both load and deflection are small their ratio ( will not be determinable with any great accuracy, so th a t a spreading of the observational points must be expected ; moreover, in this range w1 does not necessarily dominate the expression (12) for 8.
* These considerations will, however, neutralize one another to some extent, since the correct analysis gives an elastic curve which rises with increasing deflection. Gf. § 2. 2
Problems of Elastic .
Asymptote
2 S 2
on July 3, 2018http://rspa.royalsocietypublishing.org/Downloaded from
610 R. Y. Southwell.
Again, the possibility of determining Px from experimental observations rests on the linearity of equation (17), and thus requires th a t (15) shall contain no constant term,—i.e., th a t the relevant part of the curve of distortion shall be a rectangular hyperbola passing through the of co-ordinates. Nowalthough it has been shown (§ 8) th a t a hyperbolic relation will obtain so soon as wx dominates the series on the right of (12), we should not be justified in presuming th a t this last condition will be satisfied.*
One last restriction must be noticed. We have assumed in our theory that yQ) the initial deflection of the central line from the line of thrust, vanishes at either end of the strut. If this condition is not satisfied, equation (8) will have a supplementary solution which is not conveniently expressed in series form.
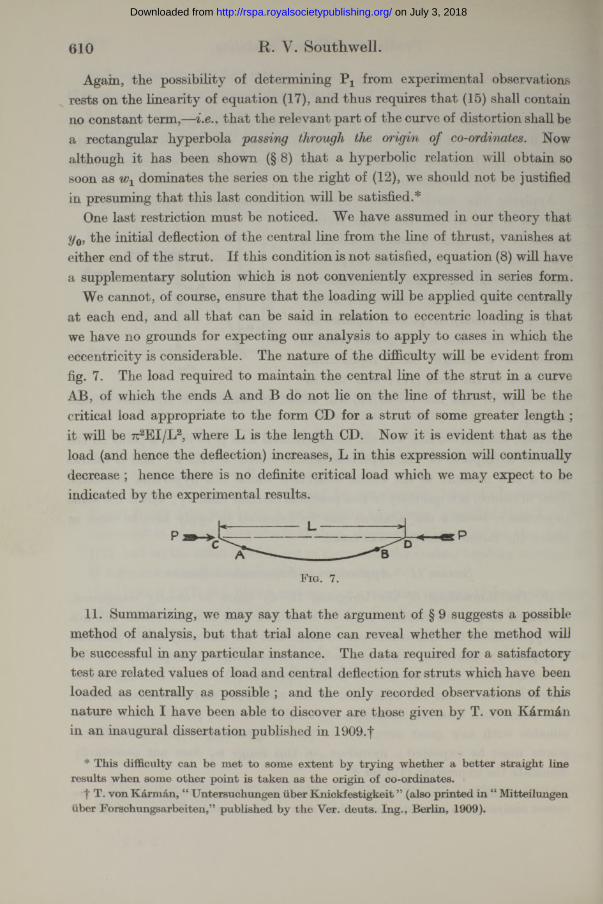
We cannot, of course, ensure tha t the loading will be applied quite centrally a t each end, and all th a t can be said in relation to eccentric loading is tha t we have no grounds for expecting our analysis to apply to cases in which the eccentricity is considerable. The nature of the difficulty will be evident from fig. 7. The load required to maintain the central line of the strut in a curve AB, of which the ends A and B do not lie on the line of thrust, will be the critical load appropriate to the form CD for a strut of some greater length ; it will be 7c2EI/L2, where L is the length CD. Now it is evident tha t as the load (and hence the deflection) increases, L in this expression will continually decrease ; hence there is no definite critical load which we may expect to be indicated by the experimental results.
F ig. 7.
11. Summarizing, we may say tha t the argument of § 9 suggests a possible method of analysis, but tha t trial alone can reveal whether the method will be successful in any particular instance. The data required for a satisfactory test are related values of load and central deflection for struts which have been loaded as centrally as possible ; and the only recorded observations of this nature which I have been able to discover are those given by T. von Karm&n in an inaugural dissertation published in 1909-t
* This difficulty can be met to some extent by trying whether a better straight line results when some other point is taken as the origin of co-ordinates.
t T. von Karman, “ Untersuchungen iiber Knickfestigkeit ” (also printed in “ Mitteilungen uber Forschungsarbeiten,” published by the Ver. deuts. Ing., Berlin, 1909).
on July 3, 2018http://rspa.royalsocietypublishing.org/Downloaded from

611
Kdrm&n took special precautions to ensure exact centering of his applied loads,f and for each stru t tabulated his observations of load and deflection during the progress of the test. In his paper the experimental struts are classified in three groups, described respectively as slender, medium and thick : slender struts are those having an l/k ratio J greater than 90; for medium stm ts l/lc ranges between 45 and 90 ; and thick stm ts are those for which IJk is less than 45.
In the slender group Kdrmdn tested eight stm ts, numbered 1, 2 ,3a, 36,4a, 46, 5 and 6. These have been analysed in Table I, and fig. 8 exhibits the relation of x to v. In some instances the initial observations have been rejected in estimating the “ best fitting straight lines”, on grounds which are stated at
Problems of Elastic Stability.
Table I.—T. von Karm an’s Struts.
Nos. 1, 2, 3a, 36, 4a, 46, 5 and 6.
(Mild s tee l: E = 2,170,000 kg./cm.2.)1
P = End Load in x = Measured Deflection v = x/J? X 106.kilograms. in millimetres.
Strut No. 1—2260 0 01 4-433020 0-025 8-283170 0-04 12-623320 0-06 18-073470 0-09 25-943620 0-25 69-06
Strut No. 2—4620 0 02 4-434830 0 05 10-355130 0-11 21-445280 0-24 45-465430 0-86 158-38
Strut No. 3 a—6030 0-01 1-667540 0-03 3-988290 O i l 13-278520 0-52 61-03
Strut No. 3 b—*7840 0 02 2-55
8140 0 05 6-148290 0-07 8-448445 O i l 13-038600 0-21 24-42
t Loc. tit., pp. 9-11. The point of application of the load could be adjusted during the progress of the test, without removing the load.
J lis the length of the strut, and k the minimum radius of gyration of its cross-section.
on July 3, 2018http://rspa.royalsocietypublishing.org/Downloaded from
612 R. V. Southwell,
Table I.—(continued).
P = End Load in kilograms.
x = Measured Deflection in millimetres. v == xfP X 10®.
S tru t No. 4a—*9050 0-02 2-21*9660 0-025 2-5910260 0-03 2-9210560 0-07 6-6310710 0-10 9-3410860 0-13 11-9711010 0-25 22-7111160 0-73 65-41
Strut No. 46—*3020 0-03 9-93*4530 0-05 11-04*6030 0-07 11-51*7540 0-09 11-94*8300 0-12 14-469050 0-15 16-589805 0-23 23-469960 0-26 26-10
10110 0-29 28-6810260 0-33 32-1610410 0-41 39-3910560 0-52 49-2410710 0-71 66-2910860 1-46 134-44
Strut N o . 5—*9050 0-01 1105
*10560 0-03 2-8410860 0-05 4-6711160 0-07 6-2711470 0-10 8-7211770 0-15 12-7412070 0-22 18-2312370 0-30 24-2512520 0-45 35-94
Strut No. 6—*10560 0-01 0-95*12070 0-04 3-31
12370 0-06 4-8512670 0-10 7-8912970 0-15 11-5713270 0-25 18-8413430 0-34 25-3213580 0-74 54-49
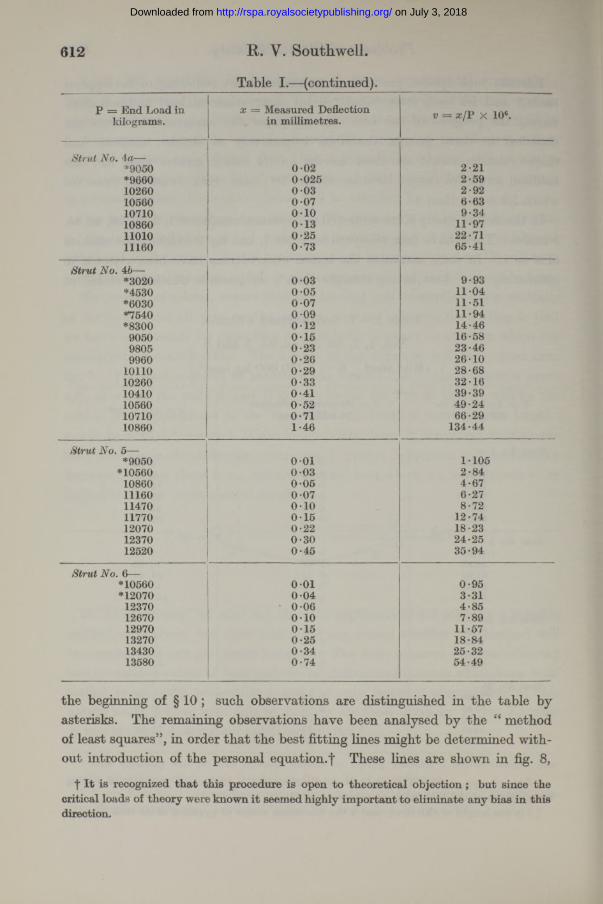
the beginning of § 10; such observations are distinguished in the table by asterisks. The remaining observations have been analysed by the “ method of least squares”, in order that the best fitting lines might be determined without introduction of the personal equation.f These lines are shown in fig. 8,
t It is recognized that this procedure is open to theoretical objection; but since the critical loads of theory were known it seemed highly important to eliminate any bias in this direction.
on July 3, 2018http://rspa.royalsocietypublishing.org/Downloaded from

Problems of Elastic Stability. 613
19*2 X 90*1IS-J X 90-1146*016*1 X 90*1 609*016 *09 X 90 *09
<9 *0 X 90-0916 *09 X 90*09<6 *1 X 90*09
ac g D eflec tion in rrvllimgfcngs,
and the resulting estimates of critical load are compared in Table II with theoretical values obtained from Euler’s formula by giving to E the actual value measured by K&rm&n,—namely, 2,170,000 kg. per square centimetre.
Table II .—T. von K&rm&n’s Struts.
(1)
StrutNo.
(2)
a deduced from best-fitting
line in fig. 8.
(3)
Px estimated from slope of
best-fitting line in fig. 8.
(4)
PX as given by theoretical
formula.
(5)Estimated value
(col. 3).Theoretical value
(col. 4).
mm. kg. kg.1 0 005 3712 3790 0 9802 0 005 5453 5475 0-9953a 0 005 8590 8645 0-9943 b 0 005 8758 8610 1-0174 a 0 003 11220 10980 1-0224 6 0 030 11090 10920 1-0155 0 010 12815 12780 1-0036 0 010 13750 13980 0-984
Table I I also gives the values of a (c/. § 9) as determined from the best fitting lines in fig. 8 ; these are in all cases small, as was to be expected from the care with which the experiments were conducted. This circumstance, and the accuracy with which the observations fall on the appropriate straight lines, indicate tha t the analysis should be satisfactory ; and Table II shows tha t the agreement with theory in regard to the critical load is in fact very close.
on July 3, 2018http://rspa.royalsocietypublishing.org/Downloaded from

614 It. V. Southwell.
12. As applied to the struts in K&rm&n’s “ medium ” and “ thick ” groups, the method failed for the reason that practically every observation related to deflections which can be shown to have involved elastic failure of the material. I t thus appears that the method has given good results in every case where these could be expected, but that only trial can show whether in any instance sufficient observations can be taken of deflections which on the one hand are large enough to give reasonable certainty of v, and on the other hand are not so large tha t the material has ceased to be elastic.
One of the struts tested by Professor Robertson (Strut No. 5 of fig. 3) was loaded with such small eccentricity as to provide a fair test of the method,
Table III.—Robertson’s Strut No. 5.
Mild Steel: Effective length = 22*25 inches. Diameter = 0*999 inches. IJJc = 89*1. Eccentricity of loading = 0*005 inches.
P = End Load in tons.
x = Measured Deflection in thousandths of an
inch.1
v = x[P.
*1-62 i 0-617*1-79 1-5 0-838*2 14 1-7 0-794*2*48 2-2 0-887*2-82 2-4 0-851*2-99‘ 2-6 0-869*3 *16 2-8 0-886*3-34 3-0 0-898*3-50 3-27 0-934*3*68 3-64 0-989*3-86 4-0 1 -037*4-02 4-24 1-060*4-19 4-46 1-063*4-36 4-68 1-078*4-53 4-81 1-063*4-70 4-94 1-051*4-90 5-07 1-028*5*13 5-66 1-106*5-56 6-32 1-1405*99 6-97 1-1636-42 7-80 1-2186-84 8-95 1-3107-27 9-84 1-3587-70 11-18 1-4508-12 12-75 1-5728-55 14-08 1-6478-98 15-88 1-7689-40 18-34 1-9519-83 21-91 2-222
10-25 26-27 2-56310-68 32-47 3-04011-11 41-17 3-706
*11-54 61-01 5-270
on July 3, 2018http://rspa.royalsocietypublishing.org/Downloaded from

615
and in this instance the method can be applied to observations in which the critical load of the theory was not attained, on account of failure of the material. Table I I I presents the analysis of this case, and related values of the measured deflection and of the ratio v are plotted in fig. 9. I t will be seen th a t the plotted points fall on two distinct straight lines i the first, covering values of
Problems of Elastic Stability.
i
\ -
l i
P£ 2-o
c l~ j*
O Idj j&
s *H
H\°-»>
o
*
>r\rtulancaau red
40
||| Elastic limit c bending form tak ing tHe n dePIccb'on.
X = M easorv o
i deflection in t to
h o u sa n d th s o f i 20
m in ch . BO
F ig . 9.
the measured deflection ranging from 7 to 18 thousandths of an inch, indicates an initial deflection of about 0*01 inch and a critical load of 14*5 tons, which is some 10 per cent, in excess of the value (12*96 tons) obtained from Euler’s theoretical expression when E is given the value (13,300 tons per square inch) which was measured by R obertson; the second, representing values of the measured deflection in excess of 18 thousandths of an inch, indicates an initial deflection of about 0*0068 inch (of which 0*0064 inch is the amplitude of the first harmonic in the Fourier series for the specified eccentricity of 0*005 inch), and a critical load of about 12*9 tons, which is less than ^ per cent, in error as compared with the theoretical figure.*
I t thus appears th a t the modified basis of plotting has revealed a feature of the test which could not have been detected from fig. 4. The definiteness of the change from one straight line to the other suggests th a t some slight frictional constraint must have operated to increase the resistance to flexure in the early stages of the test, and been overcome later as the deflections increased.
* The method of least squares has been applied to each range of the measured deflections.
on July 3, 2018http://rspa.royalsocietypublishing.org/Downloaded from
616 Problems of Elastic Stability.
13. The main interest of the method lies in its generality. In all ordinary examples of elastic instability, an equation of the same form as (7) governs the deflection as controlled by its initial value, provided th a t both are small. Corresponding with Euler’s solution for the initially straight strut we have a series of “ critical loadings,” each associated with a particular (“ normal ”) type of displacement; and by expressing both the initial and the final displacement in a series of normal components, we can show th a t the relation (11) will hold between the original and final amplitudes of the normal component. I t follows th a t the quantity which is naturally measured as “ deflection ” will be related with the applied load by an approximate equation of the hyperbolic form (13); and hence, th a t the method of analysis described in § 9 will be applicable. The method has been used with some success to clear up an apparent discrepancy between theory and experiment in tests, made at the National Physical Laboratory, of the stability of flat sheet metal subjected to shearing forces in its plane.*
Experimenters have not, in the past, been accustomed to publish complete tables of related values for load and deflection, as was done by Professor von Karm&n for his stru t tests. I t is suggested th a t data of this kind, when analysed by the method of this paper, are likely to yield results which will fully repay the additional labour spent in acquiring them.
* Cf. footnote to § 5.
on July 3, 2018http://rspa.royalsocietypublishing.org/Downloaded from