on the analysis of cast structure and its changes during ...128039/fulltext01.pdf · on the...
TRANSCRIPT
On the analysis of cast structure and its changes during hot working of forging ingots
Jan Sarnet
Casting of Metals
Royal Institute of Technology (KTH)
SE-100 44 STOCKHOLM, Sweden
Abstract
Forging ingots are hot worked to consolidate structural imperfections and refine
the microstructure. Possible imperfections are segregations, porosities, cracks,
and inclusions. In this thesis, techniques and methods for the characterisation of
behaviour and properties of ingots and forgings. The root causes for quality
issues in open-die forgings are shown to be numerous. Ingot structure in cast
tool steel was analyzed, and the main imperfections were centre
macrosegregation, and mid radius A-segregations.
For overheated steel forgings and low reductions after reheating, a high
ultrasonic attenuation and low Charpy-V toughness was found. It could be
related to the coarse grain structure found. Only a high forging reduction after
reheating will break down the coarse structure. Shorter reheating times and
lower forging temperatures gave higher toughness and lower ultrasonic
attenuation. Some reduction in toughness was also found from the inclusion
field from the bottom of the ingot. Accurate attenuation measurements require a
lathe turned surface, complicating in-between-measurements in heat treatment
sequences. But on carefully surface prepared forgings, attenuation measurement
can be used to determine the success of grain refinement in the heat treatment. A
new method for ultrasonic macrography of cast ingot samples is presented. In
addition, a new method for hot compression testing of cylindrical metal samples
is presented.

This page is left intentionally blank.

This Doctor Thesis is based on the following supplements:
Supplement 1
Macrosegreation in Ingot Cast Tool Steel
A. Lagerstedt, J. Sarnet, S. Adolfi, and H. Fredriksson
ISRN KTH-MG-INR-04:09SE
TRITA-MG 2004:09
Supplement 2
Causes of High Ultrasonic Attenuation and Reduced Mechanical Toughness of a
Forged Rotor Shaft
J. Sarnet and B. Widell
ISRN KTH-MG-INR-05:04SE
TRITA-MG 2005:04
Supplement 3
Influence of Various Heating and Forging Routes on the Microstructure of
3%Ni-Steels
J. Sarnet and B. Widell
15th International Forgemasters Meeting, Kobe, Japan, 2003
Supplement 4
The possibility of evaluation of defects and grain structure by ultrasonic
techniques in large forgings and test pieces of ingots
J. Sarnet
16th International Forgemasters Meeting, Sheffield, United Kingdom, 2006
Supplement 5
Ultrasonic Evaluation of Imperfections and Defects in Cast Steel Ingot Samples
Using Immersion Tank Testing
Jan Sarnet, Ketil Törresvoll, Hasse Fredriksson
ISRN KTH-MG-INR-09:01SE
TRITA-MG 2009:01
Supplement 6
Hot Deformation Testing of Cast Metal Samples
Jan Sarnet, Hani Nassar, and Hasse Fredriksson
ISRN KTH-MG-INR-09:02SE
TRITA-MG 2009:02

This page is left intentionally blank.
Introduction ........................................................................................... 1
Methods................................................................................................. 5
Ingot casting and analysis .................................................................. 5
Forging process .................................................................................. 5
Sample preparation ............................................................................ 6
Sulphur printing ................................................................................. 6
Ultrasonic attenuation measurement.................................................. 7
Hot compression testing..................................................................... 8
Results ................................................................................................. 10
Temperature measurements ............................................................. 10
Ingot structure by sulphur printing .................................................. 12
Grain size and toughness properties ................................................ 13
Grain size and ultrasonic attenuation............................................... 14
Ultrasonic attenuation ...................................................................... 15
Ingot structure .................................................................................. 16
Flow stress curves ............................................................................ 18
Hot worked grain size ...................................................................... 20
Discussion ........................................................................................... 21
Conclusions ......................................................................................... 23
References ........................................................................................... 25
Acknowledgements ............................................................................. 27

This page is left intentionally blank.

Introduction / 1
Introduction
The reliability of open die forged products is of the greatest importance. The
forgings must not only be as strong and also ductile; moreover variation be low.
This is tested by mechanical and non destructive testing, though most times at
the end of the manufacturing. If the product is of insufficient quality, both
economical and logistical goals will be endangered. In addition, the root causes
can be numerous.
The idea of solving quality issues at the source in manufacturing processes is
well-established since already Pearson contributions [1]. Many of the defects
can be traced upstream through the process, and be found originating from the
cast or forged structure. Though there are few papers of cooperation between the
mentioned disciplines [2], there could most certainly be improvements done
taking several disciplines into account for each quality issue.
Defects are material imperfections that endanger the integrity of a component as
crack initiators. The permissible sizes and numbers of imperfections for a
component are given as a criterion in the specifications or in agreements
between producers and customers. The size criteria for single imperfections are
typically 0.3 mm up to 3.0 mm for heavy structural steel components such as
rotors, ball bearings, and tool steels. This criterion is highly dependent on
fracture toughness and on the use of the component, and also vary with respect
to the zones within the component. The surface zones have the highest demands
placed on them, meaning that only small imperfections can be tolerated. The
dendritic structure of the cast ingot deforms into a banded one as the hot
working ratio increases [3]. It was early acknowledged that transversal variation
in cast ingot macrostructure and variable local deformations during hot working
influence the properties of products. Banded structures have anisotropic
properties and imply high working ratios. In large forging products plastic
deformation is low, and usually calculated as forging reduction, a simple ratio
between the original transversal area, Ai, of the ingot or intermediate product,
and the final transversal area, Ai+1, of the product as given by Equation 1. This
ratio only of the order of three, and therefore cast structure is still of importance
for the final product and the porosity consolidation is of importance.
1+
=i
i
A
AreductionForging (1)
Forging two or several products from one forging ingot is an old method of
increasing the forging reduction for a given product, an example can be seen in
Figure 1 where the forging reduction was close to three (2.95). Samples from

2 / Introduction
such forging practice were visual inspected and revealed strong A-segregations
after processing as can be seen in Figure 2 [4].
Figure 1. Sample position relative to the ingot and forging schedule for a trial forging [4].
Figure 2. Sawing in length direction, visual observation of segregation pattern [4].
The mechanical and ultrasonic properties are strongly dependent on the grain
size [5], [6] and german researchers investigated the influence of forging
temperature and strain on the grain size already in the 1920s [7]. The strain, ε,
which is the locadeformation is sometimes approximated as given by
Equation 2 [8], when calculated from laboratory data.
A
A0=ε (2)
High strain and low forging temperature produces small grain sizes as can be
seen in Figure 3 [7]. There are several types and sizes of defects and

Introduction / 3
imperfections that may exist within cast ingots, such as segregations, porosities,
and inclusions. The size and statistical occurrence of such defects will also
depend on the local solidification conditions within the ingot [9], [10], [11].
Figure 3. Influence of temperature and strain on the grain size [7].
Therefore, quantifying the size and the number of defects and their distribution
in respect to the ingot macrostructure are important for public safety.
Historically, the ingot macrostructure was visualised either by sulphur printing
on photographic paper or by deep etching; today, however, both methods have
lost ground. In addition, both sulphur printing and deep etching are qualitative
methods, which renders quantitative analysis difficult.
Ultrasonic characterisation of ingot structures would enable quantification of
defects. Ultrasonic techniques using normal probes for defect characterisation in
ingots were evaluated in the 1950s [12]. However, due to poor signal-to-noise
ratios, these techniques failed. The poor ratio resulted from the large distance the
signal would have to travel [13], and the coarse microstructure it have to
penetrate [6]. In addition, the surfaces of an ingot are arched and non-parallel,
which further reduces the amount of the signal returning to the probe [6]. The
amplitude, p, of the ultrasonic signal for a diverging beam is inversely
proportional to the distance, d, from the probe, and negative-exponentially
proportional to the attenuation, α, as shown in Equation 3 given by
Krautkrämer [13].
de
dpp
⋅−⋅⋅∝
α10 (3)
The influence of attenuation on signal amplitude increases for longer sound
paths, as can be seen in Figure 1. Attenuation values increase to 10- 100 dB/m
as this ratio approaches unity or above [13]. However, the attenuation is also
strongly dependent on the frequency of the probe [6].

4 / Introduction
Cutting sections of ingots to reduce the sound path would lead to a more
favourable signal-to-noise ratio. This was tested by Japanese researchers in the
1970s who measured the absolute attenuation as an indication of ingot
porosities. The objective of their investigation was to compare big end down-
with big end up-ingots, and it showed a reduction in centre porosities for the big
end up-ingot. The relative attenuation of the ingot ranged from 30- 150 dB/m for
the 110 mm thick samples [14]. Canella argued that the raw data should be
immediately stored and statistically analysed, though this was probably not
realisable then [15]. Detailed investigations of and comparisons between flat
bottom hole, porosities, and inclusions [16] are scarce. A method for ultrasonic
macrography was outlined in a previous thesis [4], but has been greatly
improved and extended in this thesis. The developments were incorporated in a
computerised analysis program.
Much research of open die forgings has been done regarding alloying content
and heat treatment. For example, the development of the large turbogenerators
for the nuclear industry in 1970s focused on the Nickel, Chromium and
Molybdenum content, and the cooling rate during quenching. In addition, some
focus was given to the number of austenitic transformations [17]. Furthermore
there has been much focus of the cleanliness of the steel, meaning both lower
inclusion content and a lower content of harmful residual elements [18]. Interest
has also been turned to reducing the A-segregations by ingot design and alloying
content [19]. Various remelting processes have been developed and refined for
the ingots [20]. Work on the forging process has very much focused on the
tool/workpiece geometry [21].
This thesis is composed of six papers and treats a broad spectrum of issues
related to structure formation [22], structure analysis [22], [23], [24], mechanical
and ultrasonic properties related to industrial forging and heat treatment
processes [25], [26], and hot deformation of cast structure [27].

Methods / 5
Methods
Ingot casting and analysis
The ingots and forgings for this thesis [22], [23], [24], [25], [26] were cast by
uphill casting at three Swedish steel plants; and the steels were refined by
ASEA-SKF ladle processes. These ladle processes are described elsewhere [28],
[29], [30]. The ingots solidified in cast iron moulds that had a relative weight 1:1
compared with the ingot. The alloy content of the forging and samples is shown
in Table 1.
Table 1. Alloy content of the test samples from the two ingots.
Use Steel Grade Structure %C %Si %S %Mo Steelmaking
overview
Thesis
supplement
Tools n.a. Cast 0.51 0.36 0.055 0.12 [30] [21], [24]
Rotors 26NiCrMoV145 Forged 0.26 0.03-
0.18
n.a. 0.37-
0.43
[30] [24], [25]
Rotors 26NiCrMoV145 Forged 0.29 0.20 n.a. 0.45 [30] [26]
Tools 40CrMnNiMo8-6-4 Cast 0.36 0.27 0.008 0.19 [28] [23]
Bearings 100Cr6 (modified) Cast 0.93 0.46 0.006 0.56 [29] [23], [27]
Forging process
The measurement presented in this thesis have been performed on various
industrial forgings. In Table 2 some process parameters are displayed, and
compared with a literature reference.
Table 2. Thermomechanical details of different forging sequences.
Reheating
Forging
Reheat. temp (ºC)
Reheat. time (h)
Forging reduction
Forging reduction last heat
Rel. tool width
Diam. (mm)
Other [18] 1250 18 7.6:1 4.6:1 n. a. 1000 Old practice 1250 2 - 5 9.2:1 4.6:1 0.2-0.4 840 Rejected shafts 1260 6 9.2:1 1.8:1 0.2-0.4 840 New practice 1 1225 < 2 3.5:1 2.0:1 0.4-0.5 715 New practice 2 1225 < 2 3.0:1 2.0:1 0.4-0.5 1005 Plant trials
1200-1250
4 - 21
2.0:1-5.0:1
0.5-1.0
159-300
6 / Methods
Sample preparation
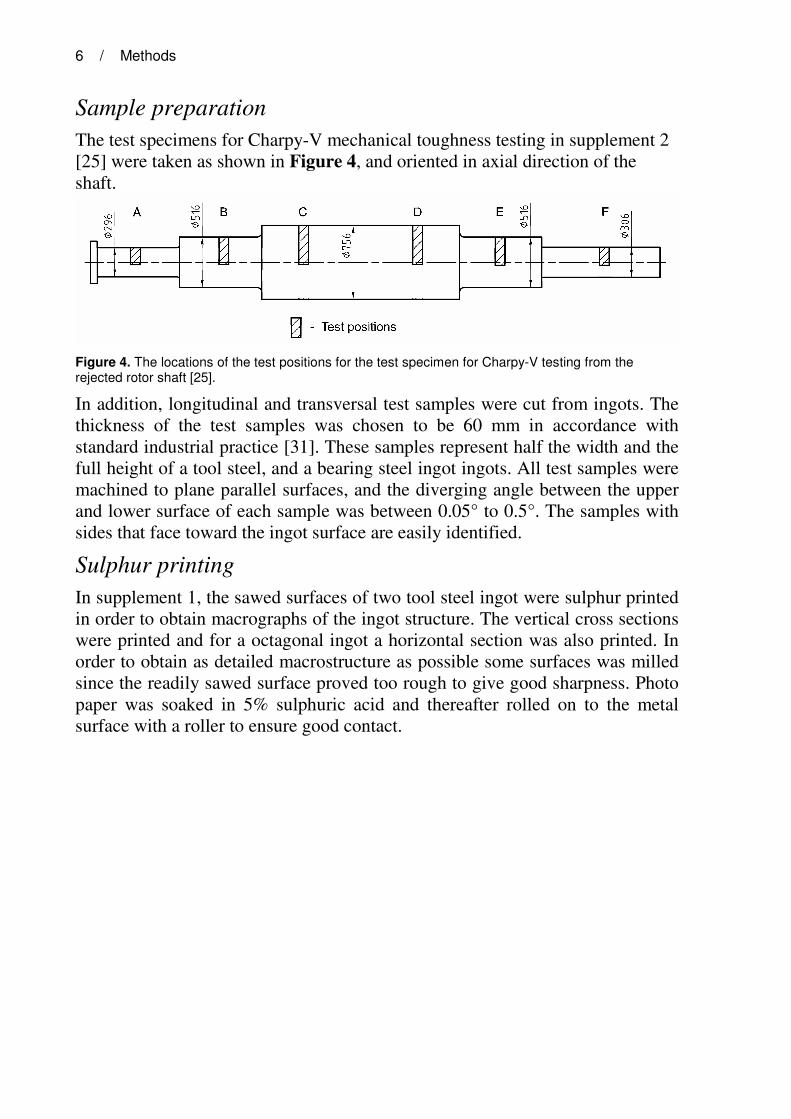
The test specimens for Charpy-V mechanical toughness testing in supplement 2
[25] were taken as shown in Figure 4, and oriented in axial direction of the
shaft.
Figure 4. The locations of the test positions for the test specimen for Charpy-V testing from the rejected rotor shaft [25].
In addition, longitudinal and transversal test samples were cut from ingots. The
thickness of the test samples was chosen to be 60 mm in accordance with
standard industrial practice [31]. These samples represent half the width and the
full height of a tool steel, and a bearing steel ingot ingots. All test samples were
machined to plane parallel surfaces, and the diverging angle between the upper
and lower surface of each sample was between 0.05° to 0.5°. The samples with
sides that face toward the ingot surface are easily identified.
Sulphur printing
In supplement 1, the sawed surfaces of two tool steel ingot were sulphur printed
in order to obtain macrographs of the ingot structure. The vertical cross sections
were printed and for a octagonal ingot a horizontal section was also printed. In
order to obtain as detailed macrostructure as possible some surfaces was milled
since the readily sawed surface proved too rough to give good sharpness. Photo
paper was soaked in 5% sulphuric acid and thereafter rolled on to the metal
surface with a roller to ensure good contact.

Methods / 7
Ultrasonic attenuation measurement
The relative ultrasonic attenuation was measured in supplements 2 - 4. The
measuring equipment was a Krautkrämer USLT2000 and normal straight probes
as in Figure 5 B1SE to B5SE with 1, 2, 4 und 5 MHz sampling frequency. Since
imperfections present are drawn out in the axial direction during forging
processing, most testing is performed in the perpendicular direction, in which
the imperfection will have the largest extension. In order to calculate the
accuracy of the measurements, the attenuation was measured several times, but
in random order at the same position. The variation was less than ±1 dB.
Figure 5. Amplitude measurement of the first and second bottom echo in the far field for the attenuation calculation.
The relative attenuation was calculated from Equation 4, where V1-V2
corresponds to the difference of the logarithmic amplitude of the echo’s and s is
the covered signal path. VS , on the other hand, is the amplitude loss of through
the divergence. This loss is 6 dB in the far field.
( )sVVVs
∆−−= 212
1α dB/m (4)

8 / Methods
Hot compression testing
Compression experiments were conducted on pure copper and bearing steel. The
press is a hydraulic 810 MTS® testing system. Teststar® software was used to
control the hydraulic motion of the press. The tools are made of Nimonic 75
(80Ni/20Cr). The samples were heated by concentrated light from three 700W
lamps placed inside highly-polished parabolic reflectors as can be seen in
Figure 6. The electrical power supplied to the lamps is controlled by a
Eurotherm® control system. The samples’ temperatures were measured using
K-type thermocouples in low temperature tests (<1000°C), and S-type
thermocouples in high temperature tests (>1000°C). The portions of the
thermocouples placed inside the samples were shielded inside alumina tubes.
The temperature was also measured at 4 locations in the lower and upper tools
using K-type thermocouples.
Figure 6. Amplitude measurement of the first and second bottom echo in the far field for the attenuation calculation.

Methods / 9
The flow stress for a uni-axial state was calculated using Equation 5 as a
function of the original area, original height, and the change in height.
∆−=
⋅
⋅==
0000
1h
h
A
F
hA
hF
A
Fσ
(5)
where σ is the stress, F is the force applied by the tools, A and A0 are the
instantaneous and original areas of the cylindrical sample, h and h0 are the
instantaneous and original heights of the sample and ∆h=h-h0 is the change in
height.
A common model that has been used to express the relation between peak flow
stress, strain rate, and temperature is Jonas and Sellars’ modification of
Garofalo’s equation stated in Equation 6 [32].
)/exp()sinh( RTQA n−= ασε& (6)
where A, α and n are material constants.

10 / Results
Results
Temperature measurements
The temperature measurement in the hot top of the ingot was not successful,
even though similar equipment was used as in an earlier investigation [33].
Those ingots had a smaller weight of 1.7 tonnes, and the larger ingot in the
present research might exert larger forces on the thermocouples.
0 50 100 150 200 250 300 350 400 450 5000
200
400
600
800
1000
1200
1400
1600
Time [minutes]
Te
mp
era
ture
[°C
]
Mould outside surface, measured
Hot top outside surface, measured
Melt
Mould outside surface, calculated
Hot top outside surface, calculated
Figure 7. Thermocouple measurement of the cooling and solidifying of the 12 t octagonal ingot

Results / 11
In supplement 3, forging trials of 300 mm steel bars were performed, to
investigate the influence of forging and heat treatment on the properties of rotor
forgings. For comparisons, surface temperature was measured in an industrial
forging process and is presented in Figure 8, where the first forging heat takes
15 minutes, and is followed by a short reheating and tool changes. In the second
and last heat, surface temperature falls off within 10 minutes.
00:00 00:30 01:00 01:30 02:00
500
600
700
800
900
1000
1100
1200 1225°C
Ø715mm
Ø 480mmØ 715mm
Squ
are
10
50m
m
Tool c
hange
Fo
rgin
g o
f g
rip e
nd
Side
Centre
Corner
Tem
pe
ratu
re (
°C)
Time (h)
Figure 8. Thermocouple measurement of the cooling and solidifying of the 12 t octagonal ingot
In supplement 3 [26] miniature trial forgings were according to the cooling
conditions in large rotor forgings. The cooling conditions were taken from the
literature [34], [17] and these can be seen in Figure 9 as dashed lines.
0,1 1 100
200
400
600
800
1000
2
3
1
Experiments
Theoretical
Te
mp
era
ture
(°C
)
Time (h)
Figure 9. Heat treatment diagram. Curve 1 and 2 are normalizing treatments [34]. Curve 3 is a quenching [17]. Solid curves are measured temperatures of the tests and dashed curves are theoretical ones.

12 / Results
Ingot structure by sulphur printing
In Figure 10 the columnar crystal zone of the tools steel ingot is seen,
extending inwards 150 mm from the surface. The cut sample is taken from the
upper part of the ingot, only the hot top was discarded. Supplement 1 describes
states that the chemical composition is even in that zone.
Figure 10. Sulphur print of the 12 t tool steel ingot, surface to centre.
CCeenntt rr ee ppoorr oossii tt yy
II nnggoott ssuurr ff aaccee
AA-- sseeggrr eeggaatt ii oonnss

Results / 13
Grain size and toughness properties
The results of the grain size measurements of the discarded rotor in
supplement 2 [25] are displayed in Figure 11 as a function of the transverse
position from centre and out to the surface. The spread of grain size represents
maximum and minimum of the measured values. 10 grains were measured at
each position. When comparing that curve to the toughness, a strong correlation
between the grain size and the toughness is seen. When the grain size decreases,
the toughness rises [5].
Figure 11. Grain size distribution of a 756 mm rotor forging in 3.5%Ni-steel in quenched and tempered condition.

14 / Results
Grain size and ultrasonic attenuation
Figure 12 shows the attenuation for the ultrasonic signal in a fine grain rotor at
the largest diameter. The attenuation increases for the identical testing position
for increasing frequency.
Figure 12. Frequency dependence of the attenuation of a fine-grained rotor with known grain size from a centre bore.

Results / 15
Ultrasonic attenuation
Figure 13 shows the influence of reheating temperature and forging reduction
on the attenuation at 2 MHz in as-forged state. As can be seen in the figure,
higher forging reduction continuously reduces the attenuation. In addition, a
reduced reheating temperature can decrease the ultrasonic attenuation.
Figure 13. Ultrasonic attenuation of three test piece step forged to different forging reductions, no heat treatment were performed at this stage.
In Figure 14 it is seen that the normalizing heat treatment lowers the attenuation
for the rotor, especially at high frequencies.
Figure 14. The frequency dependence of the attenuation.

16 / Results
Ingot structure
The technique of converting amplitude values to a continuous greyscale should
lead to a smoother and more detailed image of the indications within sample.
The increased visual information can be seen in Figure 15 for a tool steel ingot
sample.
Figure 15. Ultrasonic C-Scan of a tool steel sample.
The qualitative impression of Figure 15 is close to the well-known ingot
macrostructure [9]-[11] reported in the literature. A fine equiaxed
macrostructure is seen close to the cooling surface, in the zone identified as A.
The indications just to the left of this area were not anticipated, and the sample
was carefully measured and compared to a real size printing of the C-scan
image. It was confirmed that the indications actually originate from the surface
roughness of the original ingot. Further away from the cooling surface of the
ingot in the zone identified as B, the columnar dendrite crystals are revealed,
characteristically pointing upward due to the downward convection of the liquid
passing the growing dendrite tip. The expected coarsening of the columnar
dendrite crystals is clearly visible in this tool steel sample. At a distance of
approximately 130 mm from the ingot surface, the structure changes abruptly to
a coarse equiaxed dendritic structure as was described in an earlier paper[10]. In
area D, typical A-segregations are clearly indicated.
When generating the image, a step process was used to analyse the resolution for
1:1 printing size. Comparison of image and steel sample is easy at 1:1 as can be
seen in Figure 16. The stepping interval used in this investigation was 0.25

Results / 17
mm/step, yielding an image resolution of 4 pixels/mm or 100 pixels/inch.
Although pixels/inch is not directly related to dpi (dots/inch), the metric gives
some idea of the approximate printing resolution. The absolute printing
resolution will be given by the width of the beam’s focal point. Testing with 5
MHz would produce approximately 20 dpi and would print with excellent
sharpness, at a scale of 1:15.
Figure 16. Comparison of steel sample and 1:1 printing .

18 / Results
Flow stress curves
The actual instantaneous centre sample temperature was used as criteria for
selecting comparable results, since the temperature sometimes decreased during
compression, particularly in low strain rate experiments. The results are
compared with a part wise linear fitting proposed by Hosford[35], based on
unpublished result from Boulger, which can be seen as a dashed line in
Figure 17. The strain rate exponent, m is expected to increase as the relative
temperature T/Tm increases.
Figure 17. Strain rate exponent as a function of the relative temperature, T/Tm.
The present results actually show a stronger increase of m with relative
temperature than in that reference. In addition, the results in the present work
indicate that at higher temperatures, at about 85% of the melting temperature,
the strain rate exponent could decrease. In his original data, Boulger used no
temperatures higher than 80% of the melting point, but still predicts a
continuous increase in m above these temperatures, based on results from other
materials.

Results / 19
Activation energy, Q, is calculated from the slope of the linear fitting of the
temperature reciprocal plotted against the transformed peak flow stress at three
different strain rates (0.006, 0.06 and 0.6s-1
) as can be seen in the values for the
bearing steel in Figure 18.
Figure 18. Peak flow stress for different hot working parameters for the bearing steel.

20 / Results
Hot worked grain size
The correlation between the model and the measured grain size can be seen in
Figure 19. As awaited, the model fits the central values the best.
Figure 19. Correlation between observed and predicted grain size.
The predicted dependence of grain size on strain and temperature is shown in
the contour diagram in Figure 20.
Figure 20. Contour diagram of grain size model as a function of strain and temperature.
Discussion / 21
Discussion
A-segregations in ingots give defects detectable by ultrasonic testing, but these
can be closed by appropriate forging reduction. A-segregations can be reduced
by choosing a reduced Si-content and thereby reducing defects in ingots. This
can lower the demands of forging reduction. The ultrasonic attenuation
measurement decreases during each heat treatment step, but the amount seem
dependent on the forging and reheating sequence. Previous research has also
shown the forging tool width to the workpiece height, greatly influences the
properties [36], where relationships between geometrical forging parameters and
local strain was given. The attenuation depends on absorption and scattering
processes. The grain size in overheated steel forgings has a strong gradient and
coarse grains abruptly appear close to the surface.
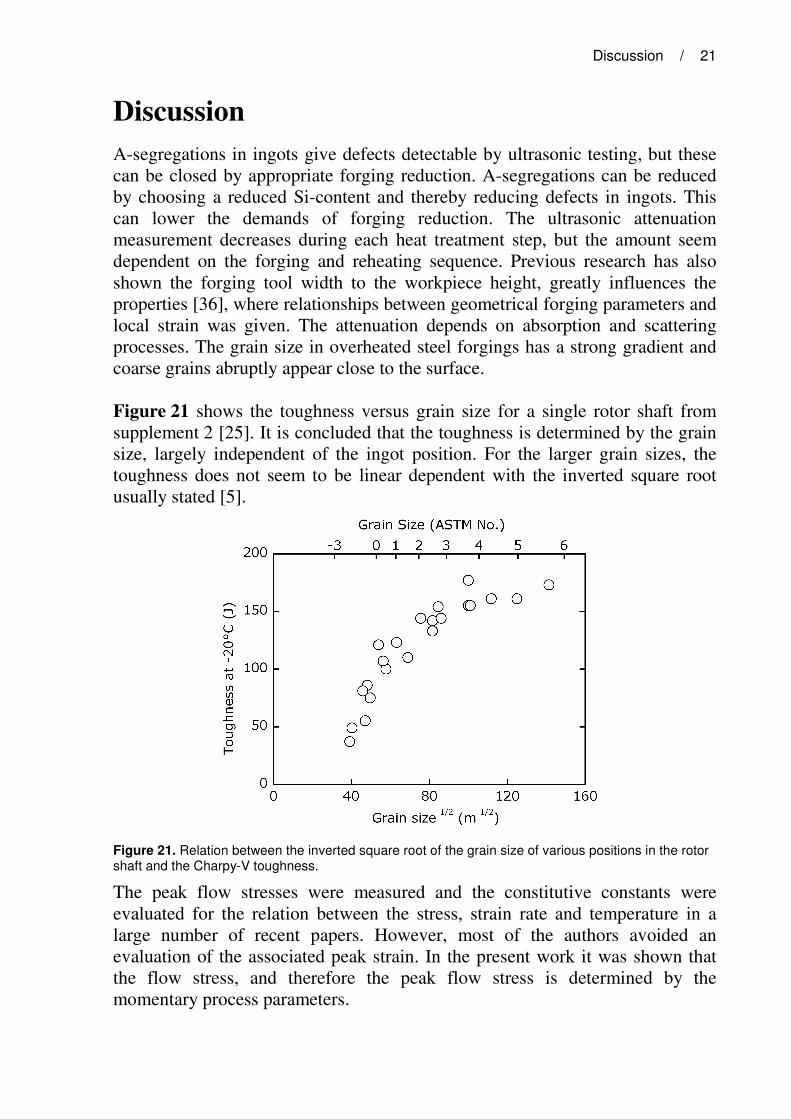
Figure 21 shows the toughness versus grain size for a single rotor shaft from
supplement 2 [25]. It is concluded that the toughness is determined by the grain
size, largely independent of the ingot position. For the larger grain sizes, the
toughness does not seem to be linear dependent with the inverted square root
usually stated [5].
Figure 21. Relation between the inverted square root of the grain size of various positions in the rotor shaft and the Charpy-V toughness.
The peak flow stresses were measured and the constitutive constants were
evaluated for the relation between the stress, strain rate and temperature in a
large number of recent papers. However, most of the authors avoided an
evaluation of the associated peak strain. In the present work it was shown that
the flow stress, and therefore the peak flow stress is determined by the
momentary process parameters.
22 / Discussion
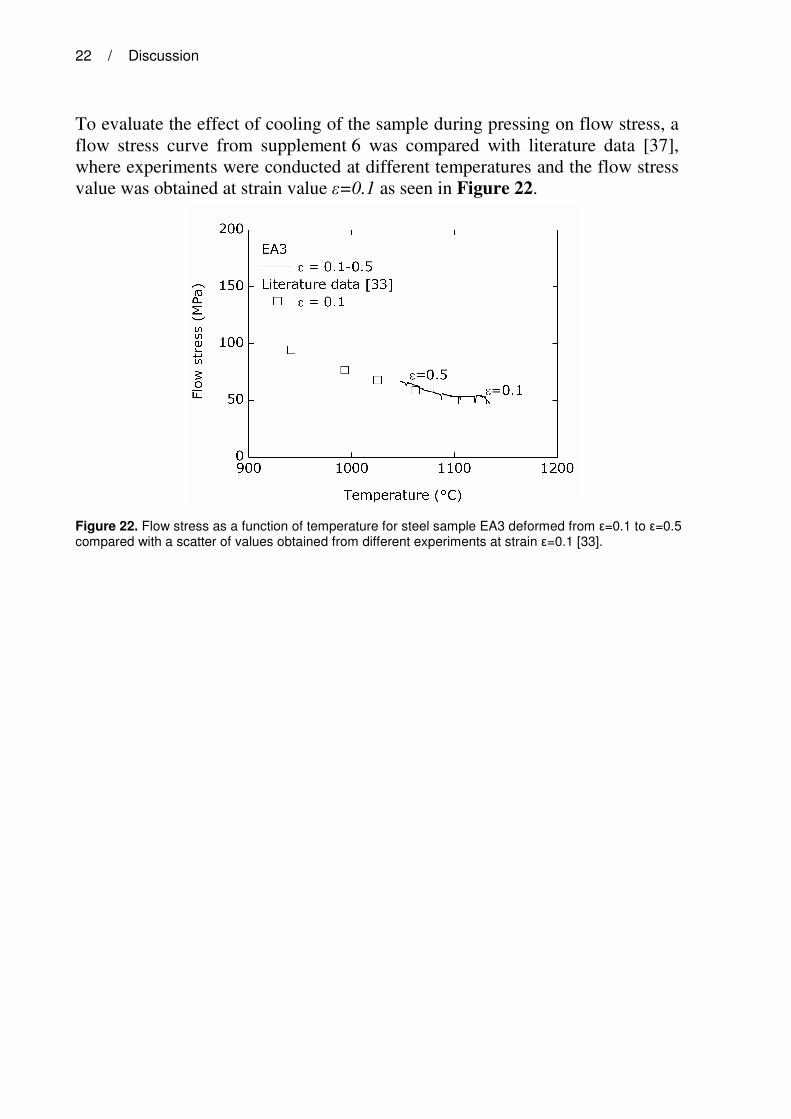
To evaluate the effect of cooling of the sample during pressing on flow stress, a
flow stress curve from supplement 6 was compared with literature data [37],
where experiments were conducted at different temperatures and the flow stress
value was obtained at strain value ε=0.1 as seen in Figure 22.
Figure 22. Flow stress as a function of temperature for steel sample EA3 deformed from ε=0.1 to ε=0.5 compared with a scatter of values obtained from different experiments at strain ε=0.1 [33].

Conclusions / 23
Conclusions
The present thesis has shown that immersion tank testing is suitable for
characterising cast steel macrostructures such as A-segregations and
macroporosity. These can be visualised by greyscale images from C-scan data
files. These images can give visual impressions of the cast structure that are
comparable to sulphur prints or deep-etching, but with slightly lower resolution
due to the finite dimension of the focused ultrasonic beam. In addition,
quantitative analysis of the distribution of 200 to 800 micrometer imperfections
in the ingot is possible, provided a low frequency probe is used and a sufficient
volume is tested. The imperfections are unevenly distributed in radial and axial
direction of the ingot, and the levels are low in the outer and bottom parts of the
ingots.
It has been shown in supplements 2-4 that for industrial processes forging
reduction and forging temperature have a decisive influence on the mechanical
properties and the ultrasonic attenuation[25]-[27]. This influence is measurable
after forging [26], but also indirect influencing the success of the heat treatment,
[24], [25], [26]. The mechanical properties of a scrapped rotor forging
deteriorated in axial direction towards the centre, and the ultrasonic attenuation
only decrease to reasonable levels after a high degree of reduction.
A new experimental method has been developed to study plastic deformation of
metals at high temperatures. The temperature inside the samples is measured
during the deformation process. The method is capable to distinguish between
the cooling of the sample by the tools and temperature changes due to
deformation and microstructural changes in the sample. A technique allowing
for the elastic deformation before the plastic deformation has been used and it
effects the measured peak strains. The deformation process can be interrupted
rapidly and the sample are quenched into water. The samples are evaluated by
well-known theoretical models.

24 / Conclusions
This page is left intentionally blank.

References / 25
References
[1] E.S. Pearson: Supplement to the Journal of the Royal Statistical Society,
Discussion on a paper by L.H.C Tippett, 2 (1935), No. 1. 27.
[2] H.P. Heil and D. Lohr: Stahl und Eisen, 103 (1983), No. 15-16, 733.
[3] G. Charpy: Iron Age, (1919), April, 1079.
[4] J. Sarnet: Licentiate Thesis, Stockholm, 2005.
[5] W.C. Leslie: Physical Metallurgy of Steels, 1606, in Physical Metallurgy Ed.
R.W. Cahn and P Haasen, Elsevier, Amsterdam, 1996.
[6] D. Aurich and E. Martin: Archiv für das Eisenhüttenwesen, 41 (1970), No. 3,
285.
[7] H. Hanemann and F. Lucke: Stahl und Eisen, 45 (1925). No. 28, 1117.
[8] G.J Richardson: Worked Examples in Metalworking, The Institute of Metals,
London, 1985.
[9] A. Hultgren and G. Phragmen: Transactions of the American Institute of
Mining and Metallurgical Engineers, 135 (1939), No. 2, 133.
[10] H. Fredriksson and I. Larén: Scandinavian Journal of Metallurgy, 1 (1972),
No. 2, 59.
[11] A. Suzuki, T. Suzuki, Y. Nagaoka and Y. Iwata: Transactions Japan
Institute of Metals, 32 (1968), 1301.
[12] A. Michalski, Stahl und Eisen, 74 (1954), No. 1, 26.
[13] J. Krautkrämer and H. Kraukrämer, Ultrasonic Testing of Materials, 4th
edition, Springer-Verlag, Berlin, 1990, pp. 108-116.
[14] T. Kawawa, Y. Hosoda, N. Sakata, M. Ito, and S. Miyoshi, Tetsu-to-
Hagane, 62 (1976), No. 13, 1668.
[15] G. Canella and L. Pedicelli: NDT International, 13 (1980), December, 305.
[16] M. Darmon, P. Calmon, and B. Bèle: Modelling of the ultrasonic response
of inclusions in steels, CP657, Review of Quantitative Nondestructive
Evaluation, 22, American Institute of Physics, 2003, p. 101.
[17] K.H. Piehl: Stahl und Eisen, 95 (1975), 837.
[18] R.I. Jaffe, P. Machner, W. Meyer, and J.E. Steiner: Ironmaking and
Steelmaking, 13 (1986) No. 6, pp. 322.
[19] H. Yamada et al. Tetsu-to-Hagane, 75 (1989), No. 1, 105.
[20] A. Mitchell et al. Trans. Iron Steel Inst. Jpn. 24 (1984), 547.
[21] E. Siemer, P. Nieschwitz, and R. Kopp: Stahl und Eisen, 106 (1986), No. 8,
383.
[22] A. Lagerstedt, J. Sarnet, S. Adolfi and H. Fredriksson: ISRN KTH-MG-
INR-04:09SE TRITA-MG 2004:09 (Supplement No. 1)
[23] J. Sarnet, K. Törresvoll, and H. Fredriksson: ISRN KTH-MG-INR-09:01SE
TRITA-MG 2009:01 (Supplement No. 5), submitted for publication in Steel
Research International
[24] J. Sarnet: Proceedings of the 16th International Forgemasters Meeting,
Sheffield, UK, 2006 (Supplement No. 4)

26 / References
[25] J. Sarnet and B. Widell: ISRN KTH-MG-INR-05:04SE TRITA-MG
2005:04 (Supplement No. 2)
[26] J. Sarnet and B. Widell: Proceedings of the 15th International Forgemasters
Meeting, Kobe, Japan, 2003 (Supplement No. 3)
[27] J. Sarnet, H. Nassar, H. Fredriksson: ISRN KTH-MG-INR-09:02SE
TRITA-MG 2009:02 (Supplement No. 6), submitted for publication in Materials
Science and Technology.
[28] J. Cheng, R. Eriksson and P. Jönsson: Ironmaking and Steelmaking, 30
(2003), No. 1, 66.
[29] T. Lund and P. Ölund: “Improving production, control and properties of
bearing steels intended for demanding applications” ASTM Special Technical
Publication, STP 1361 (1999), p. 32.
[30] T. Sjöqvist, S. Jung, P. Jonsson, M. Andreasson: Ironmaking and
Steelmaking (UK), 27 (2000), No. 5, 373.
[31] T. Lund and K. Törresvoll: Quantification of Large Inclusions in Bearing
Steels, Bearing Steels: Into the 21th Century, ASTM STP 1327, 1998.
[32] J.J. Jonas, C.M. Sellars, W.J.McG. Tegart: Metall. Rev. 14 (1969) 1.
[33] A. Olsson, R. West, H. Fredriksson: Scandinavian Journal of Metallurgy,
15 (1986), No. 2, 104.
[34] M. Atkins: “Atlas of continuous cooling transformation diagrams for
engineering steels”, Sheffield, 1977.
[35] W.F. Hosford, R.M. Caddell: Metal forming mechanics and metallurgy,
Cambridge University Press, New York, 2007, pp. 52-55. Adapted from F.W.
Boulger, DMIC Report 226, Battelle Me. Inst (1966), pp. 13-37.
[36] H.P. Heil, A. Schütz: Archiv für das Eisenhüttenwesen, 46 (1975), No. 3,
201.
[37] R. Kopp, H. Wiegels: Einführung in die Umformtechnik, Verlag der
Augustinus Buchhandlung, 1998, p. 54.

Acknowledgements / 27
Acknowledgements
During my research education, I have received guidance, inspiration and help
from many people. My supervisor Professor Hasse Fredriksson supported me
already when I was an undergraduate, and has had to use his full creativity to
finance this work, but still having a broader view of what to achieve. In addition,
the managers and personnel at Scana Steel Björneborg were very supportive of
this research, especially Mikael Andreasson. Additional support was arranged
by Ewa Persson at Uddeholm Tooling, and Thore Lund at SKF. The finishing of
this work was supported by the Swedish Steel Producers’ Association
(Jernkontoret) and Lars-Henrik Österholm therefore deserves special
mentioning. In addition to the supervision from professor Hasse Fredriksson, I
received supervision from Björn Widell. Additional grants was received from
Sven and Astrid Toresson’s Foundation (Stiftelsen för Sven och Astrid
Toressons Fond), Gustaf Janssons Jernkontorsfond, and Axel A:son Johnson’s
Foundation (Stiftelsen Axel A:son Johnsons Forskningsfond), Bruksägare
Anders Henrik Göranssons Fond, and Stiftelsen Jernkontorsfonden för
Bergsvetenskaplig Forskning.
I had the chance of interchanging information and reflections about issues in
this field with Kent Öberg, Göran Wahlstedt, Roger Jävergård, Ove Carlsson,
Dan Thorsén, Joachim Furuberg, Rickard Gustafsson, Verena Schneider, Jan
Terhaar, Jonas Åberg, Mattias Skrinning, Ketil Törresvoll, Anders Eliasson,
Peter Björklund, Alf Bohlin, Johannes Federer, Anders Lagerstedt, Robert
Gustafsson, Håkan Lundbäck, Patrik Olsson, Srecko Milenkovski, Hani Nassar,
Magnus Brännbacka, Dr. Claudio Pecorari, Lars Holmström, Erik Wedin, and
Dr. Geir Grasmo. I also acknowledge brief, but important critical appreciation
on my work in connection with meetings and conferences from Dr. Harmut
Vogel, Dr. Heinz-Jürgen Peters, Astrid Granberg, Dr. Yomei Yoshioka, Egon
Erlenkamp, Hiroyuki Nagasako, Peter Lidegran, Udo Lehmann, Dr. Paul
Nieschwitz, Dr. Christoph Heischeid, Professor Toshishiko Emi, and Professor
Reiner Kopp.
I truly appreciate the support and practical help from my parents Tönu and
Eva, my brothers Johan and Joakim, my grandmothers Linda Sarnet and Kerstin
Björklund, but also from many others at various stages of the work, especially
Christer and Katarina Furuberg, Gunilla Olsen, Anita Mattson, Rickard
Gustafsson, Lena Magnusson, Hans Thörnsten, Fritz Oesterhelt, Ralf Luce,
Joachim Furuberg, Arno Frank, Magnus Brännbacka and Kristin Granath-
Brännbacka, Robert Gustafsson, Mattias and Anna Skrinning, and Professor
Pavel Huml.
Early on, I was interested in science and engineering, and I was encouraged
and truly inspired by my uncle Hans Björklund, my grandfather Hadar
Björklund, and my father Tönu.