on the airgracegao/publications/magazine/julaug10-erker.pdf · july/augus t 2010 insidegnss 29 in...
TRANSCRIPT

28 InsideGNSS j u l y / a u g u s t 2 0 1 0 www.insidegnss.com
W ith the launch of the Delta IV rocket on May 27 from Cape Canaveral Air Force Sta-tion the first satellite (space
vehicle number 62 or SVN62) of the latest GPS generation Block IIF (F, for “follow-on”) was carried into earth orbit — a major step with roots in the past.
Eight years ago in August 2002 the United States decided in coordination
with the International Telecommunica-tion Union (ITU-R) to transmit a new civil signal on a third frequency known as L5.
This new signal is part of the IIF modernized signal filing, which also includes the military signal (M-code) on L1 and L2 frequencies and the new civil signal L2C. Because the IIF satellite generation couldn’t finally be completed
On the air New signals from the First gPs IIF satellite
Recent launch of the first GPS Block IIF satellite brought new GNSS signals on the air. Researchers at the German Aerospace Center and Stanford University provide an early analysis of the signals’ performance.
steFaN erker, steFFeN thOelert, MIchael MeurerGerman aerospace center (DLr)
lIaNg heNg, r. erIc Phelts, grace XINgXIN gaO, gabrIel WONg, tOdd Walter, Per eNge stanforD University

www.insidegnss.com j u l y / a u g u s t 2 0 1 0 InsideGNSS 29
in time, a Block IIR-M satellite, SVN49, was selected to fulfil this task and carry a L5 demonstration payload into the earth orbit.
SVN62 is the satellite to bring an operational L5 signal payload into orbit. The satellite incorporates a new on-orbit reprogrammable processor that is able to receive software uploads for improved system operation. A total of 12 IIF satel-
lites are planned for launch within the next few years to modernize and replen-ish the existing constellation.
With L5 GPS features a completely new signal transmitted on a center fre-quency of 1176.45 MHz. Besides the legacy L1 signals, the new L5 signal is the second GPS signal located in the Aeronautical Radio Navigation Services (ARNS) band — a section of the radio frequency spectrum that is also populat-ed by the Galileo E5a signal and ground navaids such as DME and TACAN.
Together with the legacy L1, the availability of L5 signals allows for the first time the elimination of the influ-ence of ionospheric refraction errors by using GPS signals of the ARNS bands only. Therefore, the L5 signal is intend-ed especially for safety-critical applica-tions like aircraft navigation, but will, of course, be available for all civil users. (See the accompanying article, “Evaluat-ing the GPS Block IIF-1 Satellite Signals for Aviation Users.”) This makes L5 a valuable third civil GPS signal comple-menting the C/A and L2C signals.
NewSatellite,NewSignalThe structure of the operational GPS L5 signal has two components. Both com-ponents — in-phase (I) and quadrature-phase (Q) — will have the same signal power level, according to the L5 interface specification document (IS-GPS-705). The minimum received power is defined with –157.9 dBW, which is 0.6 dB more than the legacy L1 C/A code signal.
Both components carry different but nearly orthogonal and synchronized pseudorandom noise (PRN) codes. The register structure used to generate the code is the same for both channels, but different initial states are used in one of the registers. The Q-channel of the L5 signal carries no data, transmitting only a pilot signal modulated with the specific satellite PRN 25 code, which is useful for long coherent integration times. On the I-channel the signal is modulated by the navigation message and carries 100 data-symbols per second (sps).
Usage of two different PRN codes for the I and Q components allows pos-sible tracking biases to be minimized,
as both channels are only dependent on the same carrier phase, which is typi-cally provided by the atomic frequency standards of the space vehicle. The L5 signal uses a chipping rate of 10.23 MHz which is 10 times that of the C/A and L2C codes and a code period of 10,230 chips. The signal is coded by a Neuman-Hoffman synchronization code. With the chipping rate the signal has a 20.46 MHz null-to-null bandwidth, which is exactly the same as the legacy P(Y)-code signal.
The new signal offers several new and beneficial features, which underlines the intention of L5 to play an important role for future safety critical applications. The aim of this article is to perform a first analysis of the new signals offered by SVN62 and to assess whether the signals fulfil the high expectations for them. For that purpose dedicated mea-surement and analysis campaigns have been performed.
FacilitiesandMeasurementEquipmentTo verify the signal quality and perfor-mance of this new GPS generation the signals of IIF SVN62 are captured and analyzed continuously from the begin-ning by independently using GNSS monitoring and evaluation facilities at the German Aerospace Center (DLR) and Stanford University in the United States.
The Stanford team uses the Stanford GNSS Monitor System (SGMS) to cap-ture the SVN 62 transmission. SGMS has a 1.8 m steerable parabolic dish antenna with an L-band feed as shown in the accompanying photograph. The antenna has approximately a seven-degree beamwidth and provides about 25 decibels of gain over conventional patch antennas.
The motor of the antenna can be driven by satellite tracking software, so that the dish can automatically point to and track the new IIF satellite. The sig-nal from the feed of the antenna goes through a low noise amplifier, a band pass filter, and is collected by a vector signal analyzer (VSA) as shown in Fig-ure 1. The VSA can down-convert the RF
(above inset) DLR´s 30-meter high gain antenna at Weilheim, Germany (left inset) Stanford GNSS monitor station antenna

30 InsideGNSS j u l y / a u g u s t 2 0 1 0 www.insidegnss.com
oNthEair
signal to baseband and save the data in computer-readable format. The SGMS has provided many observation mea-surements for GNSS satellites, which have been published in previous issues of Inside GNSS.
The DLR uses its GNSS Signal Veri-fication and Analysis Facility (SVAF) that was established in 2005 and con-stantly updated to allow state-of-the-art measurements and performance analy-sis. The core element of this facility is a 30-meter deep space antenna located at the DLR ground station at Weilheim, Germany.
The antenna and the measurement equipment have been adapted to the requirements in the navigation field. A newly developed broadband circular polarized feed and a new receiving chain,
including an online calibration system (shown in Figure 2), were installed at the antenna during the preparation for the second-phase Galileo In-Orbit Valida-tion Element (GIOVE B) in-orbit test (IOT) campaign in spring 2008.
The antenna — based on a shaped Cassegrain system — is characterized by a gain value of around 50 decibels in the L-band and a beamwidth of 0.5 degree. The calibrated facility allows very pre-cise and detailed analysis of GNSS sig-nals because the navigation signals are raised high above the noise floor so that individual code chips become clearly visible.
SVN62:FirstiiFSignalanalysisShortly after the launch of this new Block IIF satellite the first signal trans-
missions of SVN62 were received show-ing initial broadcast test at lower output levels — a common procedure during the commissioning phase of a new sat-ellite payload that helps to avoid pos-sible damages due to the heating of the equipment.
During SVN62’s transition period to its final orbit posi-tion further broad-c a s t t e s t s were
recorded. For about one hour on June 6 (from about 13:10 PDT to 14:20 PDT), the satellite transmitted a one-zero pat-tern at the L1 and L2 frequencies instead of a nominal GPS PRN code, as shown in Figure 3 and Figure 4. The signal was recorded at June 6, 2010, around 13:15 PDT using the Stanford SGMS with its 1.8-meter dish. During all other times on June 6, the satellite transmitted a nominal PRN 25 on both L1 and L2, including GPS legacy signals but not the M-code.
The first L5 transmission was record-ed during SVN62`s track on June 17 over Europe and Asia. After the satel-lite changed its signal configuration the transmission of the new L5 and also of M-code signal on L1 started. The team at DLR was able to record a pass of around three hours with the 30-meter high gain antenna.
This first signal transmission allows an initial analysis of the long-awaited third civil GPS signal. With an overlaid theoretical spectrum shape (black curve in Figure 5), we obtain a first quick look at the spectral asymmetries and defor-mations of the signal. We see that the signal is band limited by the front end filters used in the L5 payload, ensuring the required spectral separation from the GPS L2 frequency band.
We also note a slight asymmetry of the spectral shape between the side lobes of the signal. They differ around three decibels in their peak power level. Those asymmetries are quite common analog deformations of signals and typically result from frequency selectivity of the satellites payload components or trans-mitter antenna.
Since June 28, SVN62 seems to be switched to its final signal transmission scheme — L1: C/A, P(Y), and M codes; L2: L2C, P(Y), and M codes; L5, data & pilot. Thus we were able to track several complete satellite passes including the new operational L5 signal.
In order to characterize the signal quality, we compare the signals of this first IIF Block satellite (which, of course, is still set unhealthy and not intended for operational use at the moment) with one of the operational Block IIR-
L-band feed Cavityfilter LNA
50’ cable
Az/El
Nova for WindowsSatellite Tracking
Software
Agilent VectorSignal Analyzer
On demand operation1.8m steerable dishantenna - High gain - DirectionalFlexible data collection system
45dB
FIGURE 1 Architecture of Stanford GNSS Monitor Station
Az/ElVector Signal Analyzer
approx. 108 samples/s
PC for Data Storageand Analysis
30 [dB]40 [dB]
Online Calibration Systemdeveloped by DLR
Antenna L-band gain: 50 dBAntenna beamwidth: 0.5°Position accuracy: 0.001° each directionmax. rotational speed: 1.5°/Sec Azimuth 1.0º/Sec Elevation
LNA Set of BP Filters LNA
FIGURE 2 Simplified overview of DLR GNSS SVAF

www.insidegnss.com j u l y / a u g u s t 2 0 1 0 InsideGNSS 31
M (BIIRM) generation. For that reason we chose a IIR-M satellite that also per-formed a comparable high-elevation pass over the facility shortly after the SVN62 track.
A complete high-elevation pass of BIIRM-5 (GPS SVN57/PRN29) was recorded on June 30. In Figure 6 the spec-tral shapes of the L1 signal — recorded at the same elevation angle — of both satellites are overlaid and compared to each other.
Figure 6 shows that both spec-
trums are very clean and have a very symmetric shape. IIF-1 (red) emits a signal with slightly increased power compared to the BIIRM satellite (blue). This can also be detected with a standard GNSS receiver by a slightly increased carrier-to-noise density (C/N0) value.
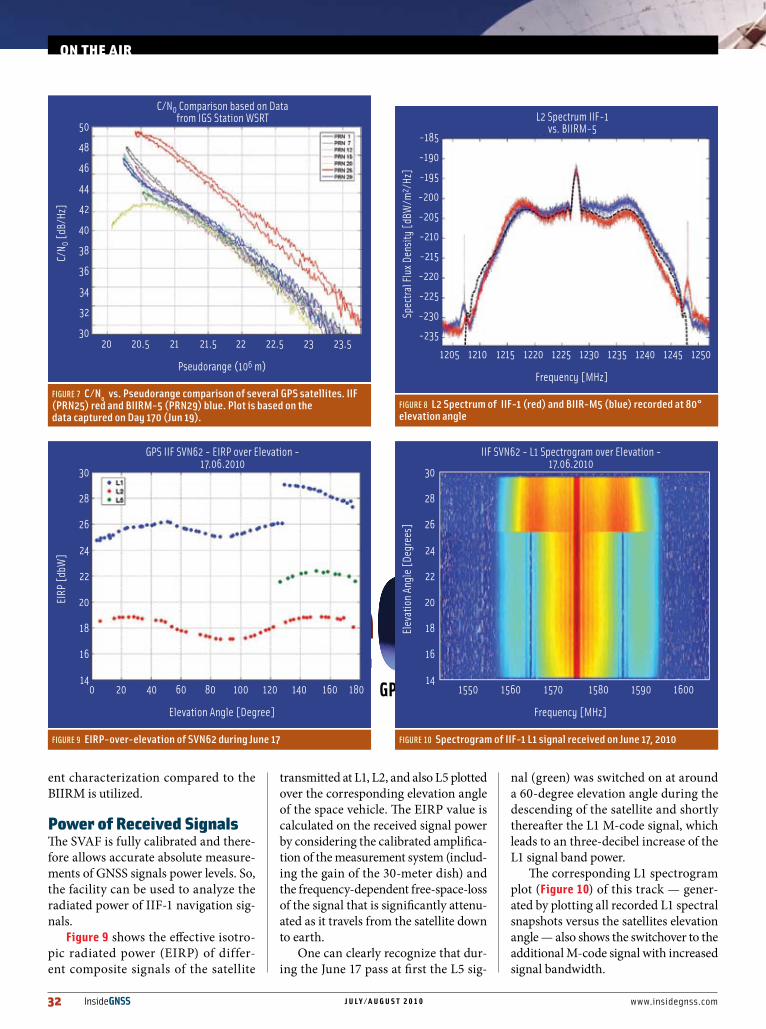
In Figure 7, C/N0 versus the satellites’ pseudoranges for the L1 signal is plot-ted based on data from the International GNSS Service (IGS) network site “wsrt” (Westerbork, the Netherlands). We can clearly see the increased L1 power of
PRN25 assuming the receiver has the same C/N0 for the same power output and range of two different satellites.
If we have a look at the L2 spectrum as shown in Figure 8, we see a notable asymmetry of IIF compared to the over-laid theoretical L2 signal shape (black). Comparing this to the BIIRM spectrum and the theoretical shape, we recognize a nearly reversed left to right asymmetry between IIF and BIIRM. It seems that for the L2 signal path of the IIF satellites a front-end filter of significantly differ-
-120
-125
-130
-135
-140
-145
-150
GPS IIF SVN62 — L1 Power Spectrum Density — 06.06.2010
dB/H
z
1560 1565 1570 1575 1580 1585 1590
Frequency [MHz]
FIGURE 3 L1 power spectrum density plot during initial broadcast tests with satellite transmitting ‘010101…’ sequence. Data captured with 1.8-meter dish from SGMS.
0.8
0.6
0.4
0.2
0
-0.2
-0.4
-0.6
-0.8
GPS IIF SVN62 — L1 Waveform — 06.06.2010
Volta
ge (m
W)
0 1 2 3 4 5 6 7 8 9 10
Time (μS)
FIGURE 4 Satellite transmits ‘010101…’ sequence. The signal was captured with 1.8-meter dish from SGMS
-185
-190
-195
-200
-205
-210
-215
-220
-225
-230
-235
GPS IIF-SVN62 - L5 Spectral Flux Density
Spec
tral F
lux D
ensit
y [d
BW/m
2 /Hz
]
1150 1155 1160 1165 1170 1175 1180 1185 1190 1195 1200
Frequency [MHz]
FIGURE 5 The very first received L5 Signal of SVN62 with overlaid theoreti-cal spectrum
-185
-190
-195
-200
-205
-210
-215
-220
-225
-230
-235
L1 Spectrum IIF-1vs. BIIRM-5
Spec
tral F
lux D
ensit
y [d
BW/m
2 /Hz
]
1555 1560 1565 1570 1575 1580 1585 1590 1595
Frequency [MHz]
FIGURE 6 L1 Spectrum of IIF-1 (red) and BIIR-M5 (blue) recorded at 80° elevation angle
32 InsideGNSS j u l y / a u g u s t 2 0 1 0 www.insidegnss.com
oNthEair
ent characterization compared to the BIIRM is utilized.
PowerofreceivedSignalsThe SVAF is fully calibrated and there-fore allows accurate absolute measure-ments of GNSS signals power levels. So, the facility can be used to analyze the radiated power of IIF-1 navigation sig-nals.
Figure 9 shows the effective isotro-pic radiated power (EIRP) of differ-ent composite signals of the satellite
transmitted at L1, L2, and also L5 plotted over the corresponding elevation angle of the space vehicle. The EIRP value is calculated on the received signal power by considering the calibrated amplifica-tion of the measurement system (includ-ing the gain of the 30-meter dish) and the frequency-dependent free-space-loss of the signal that is significantly attenu-ated as it travels from the satellite down to earth.
One can clearly recognize that dur-ing the June 17 pass at first the L5 sig-
nal (green) was switched on at around a 60-degree elevation angle during the descending of the satellite and shortly thereafter the L1 M-code signal, which leads to an three-decibel increase of the L1 signal band power.
The corresponding L1 spectrogram plot (Figure 10) of this track — gener-ated by plotting all recorded L1 spectral snapshots versus the satellites elevation angle — also shows the switchover to the additional M-code signal with increased signal bandwidth.
50
48
46
44
42
40
38
36
34
32
30
C/N0 Comparison based on Datafrom IGS Station WSRT
C/N 0 [
dB/H
z]
20 20.5 21 21.5 22 22.5 23 23.5
Pseudorange (106 m)
FIGURE 7 C/N0 vs. Pseudorange comparison of several GPS satellites. IIF (PRN25) red and BIIRM-5 (PRN29) blue. Plot is based on thedata captured on Day 170 (Jun 19).
FIGURE 8 L2 Spectrum of IIF-1 (red) and BIIR-M5 (blue) recorded at 80° elevation angle
-185
-190
-195
-200
-205
-210
-215
-220
-225
-230
-235
L2 Spectrum IIF-1vs. BIIRM-5
Spec
tral F
lux D
ensit
y [d
BW/m
2 /Hz
]
1205 1210 1215 1220 1225 1230 1235 1240 1245 1250
Frequency [MHz]
FIGURE 9 EIRP-over-elevation of SVN62 during June 17
30
28
26
24
22
20
18
16
14
GPS IIF SVN62 - EIRP over Elevation -17.06.2010
EIRP
[dbW
]
0 20 40 60 80 100 120 140 160 180
Elevation Angle [Degree]
FIGURE 10 Spectrogram of IIF-1 L1 signal received on June 17, 2010
30
28
26
24
22
20
18
16
14
IIF SVN62 - L1 Spectrogram over Elevation -17.06.2010
Elev
atio
n An
gle [
Degr
ees]
1580157015601550 1590 1600
Frequency [MHz]

www.insidegnss.com j u l y / a u g u s t 2 0 1 0 InsideGNSS 33
Figure 11 shows the EIRP values for the three different IIF signals recorded during a high elevation pass on June 29. We recognize that about three decibels more power is introduced to the addi-tional L2 M-code signal compared to the measurements from June 17. This additional signal component can also be clearly identified within the L2 spectrum that is shown in Figure 8.
SignalModulationQualityFor an initial assessment of L5 modu-lation quality the scatter plot of the I and Q components is plotted in Figure 12. Compared to the L5 demo signal of GPS IIR-M SVN49 that only transmit-ted a dataless Q-component signal, the operational IIF L5 signal consists of both I and Q components.
The four possible states are clearly visible in the constellation diagram. Nearly all transitions show a very sym-metric orientation between two I-Q states. But we also see one distorted tran-sition, from I-Q state [1 -1] to [-1 1], that shows an unusual behavior. This asym-metric transition points to a non-linear distortion effect maybe created at the amplification or I-Q modulation stage of the satellite transmitter chain. Further detailed analysis on the observed effect is ongoing.
In Figure 13 the corresponding eye-diagram for the IIF L5 I and Q signal is plotted. The eye-diagram is also a very useful tool for qualitative analysis of signal quality for digital communica-tion systems. It provides an at-a-glance evaluation of the modulation qual-ity and gives a quick insight into signal imperfections and distortions like the I-Q scatter plot.
The digital sampled signals of the I and Q channels are repetitively plotted for this representation. We clearly see typical amounts of distortions, signal overshots, and minimal jitter at the zero crossing point, which can be caused by the band limitations of the front end fil-
ters and amplifiers used in the SVN62 navigation payload.
A more detailed analysis on IIF-1 signal distortions and deformations can be found in the article “Aviation Grade: New GPS Signals — Chips Off the Block IIF,” beginning on page 36 in this issue of Inside GNSS.
iiFCodeanalysisWith the 30-meter high gain antenna at Weilheim, we can look in detail at the transmitted L5 code chips. The signals of the satellites are raised high above the noise floor and allow precise code analy-sis after Doppler wipe-off.
In Figure 14 we compare the first 10 microseconds of the received L5 SVN62 I and Q signal with the two ideal theo-retical codes for PRN25 L5 I and Q chan-nels. The codes were obtained with a L5 code generator implemented in a math-ematical software package. The analysis was also performed for several full code periods and shows that the code struc-ture of both signal components is in
full compliance with the “theoretical” codes described in the official L5 signal interface specification document, IS-GPS-705.
receiverSignaltrackingDuring SVN62’s init ia l in-orbit test phase, which is expected to last around 90 days, the satellite remains
FIGURE 11 EIRP-over-elevation of SVN62 during June 29
30
28
26
24
22
20
18
16
14
GPS IIF SNV62 - EIRP over Elevation -29.06.2010
EIRP
[dBW
]
0 20 40 60 80 100 120 140 160 180
Elevation Angle
FIGURE 12 L5 I/Q Scatter Plot
1.5
1
0.5
0
-0.5
-1
-1.5
IIF-1 L5 IQ Scatter Plot
Q (n
orm
alize
d)
-1.5 0 -0.5-1 0.5 1 1.5
I (normalized)
20
18
16
14
12
10
8
6
4
2
0
thecodestructureofbothL5signalcomponentsisinfullcompliancewiththe“theoretical”codesdescribedintheofficialL5signalinterfacespecificationdocument,iS-GPS-705.

34 InsideGNSS j u l y / a u g u s t 2 0 1 0 www.insidegnss.com
oNthEair
set “unhealthy” so that common GPS receivers generally will not track the space vehicle. Nevertheless, certain receivers can be configured to ignore the health flag and track the satellite with its designated pseudorandom noise code.
F ig u r e 15 s how s t he t r a c k-i ng resu lt s usi ng ou r sof t wa re
receiver. We have used this software receiver to acquire and track many GNSS satellites, such as the GIOVE sat-ellites and the Compass M-1, reported in previous Inside GNSS articles. The track-ing loops, including the phase lock loop and the delay lock loop, both converge. The success of acquisition and tracking
verifies that the SVN62 broadcast PRN code is the same one as defined in the GPS ICD.
Another reason why we would like to show Figure 15 is that it captures an interesting transition moment. The sat-ellite had an intermittent testing period when the satellite was only transmitting
FIGURE 15 Tracking results of GPS IIF SVN62 PRN 25, L1, during intermittent testing period
10.5
0-0.5
-1
Navigation Data Message - PRN 25 Discrete Time Scatter Plot
Time (ms)
Time (ms)
0 200 400 600 800 1000 1200 1400 1600 1800 2000 0I prompt
-5 5
0 500 1000 1500 2000
90
45
0
-45
-90Phas
e offs
et (d
egre
es) PLL Discriminator
Time (ms)0 500 1000 1500 2000
4
2
0
-2
-4
Code
offs
et (m
)
420
-2-4-6-8
Q pr
ompt
DLL Discriminator
Time (ms)0 500 1000 1500 2000
1086420
Correlator Output Power
Time (ms)0 500 1000 1500 2000
3540
3500
3460
3420
Dopp
ler f
requ
ency
(Hz) Doppler Frequency
Time (ms)0 500 1000 1500 2000
622
620
618
616C/A
code
star
t (ch
ips)
C/N 0 (
dB-H
z)
Position of the C/A Code Start
Time (ms)0 500 1000 1500 2000
70
60
50
40
30
Filtered C/N0
FIGURE 14 Comparison of measured L5 I and Q code chips (blue) with theoretical code sequence (red)
10.5
0-0.5
-1
In-Phase Signal
Quadrature Signal
Ampl
itude
(nor
mal
ized)
0 0.002 0.004 0.006 0.008 0.01
0 0.002 0.004 0.006 0.008 0.01
10.5
0-0.5
-1
Ampl
itude
(nor
mal
ized)
Time (ms)
FIGURE 13 Eye-diagram for L5 PRN25 I and Q signal component
10.5
0-0.5
-1
In-Phase Signal
Quadrature Signal
Ampl
itude
(nor
mal
ized)
0 0.1 0.2 0.3 0.4 0.5 0.6 0.7 0.8 0.9 1x 10⁻⁶
10.5
0-0.5
-1
Ampl
itude
(nor
mal
ized)
0 0.1 0.2 0.3 0.4 0.5 0.6 0.7 0.8 0.9 1x 10⁻⁶
Time (s)

www.insidegnss.com j u l y / a u g u s t 2 0 1 0 InsideGNSS 35
“010101…” rather than the Neumann-Hoffman code or navigation bits. The upper left subplot shows the transition to the intermittent testing period.
ConclusionThis first analysis of SVN62 shows that the IIF L5 signal, with respect to the analysis presented in this article, is nearly in line with the specifications described at the IS-GPS-705 document. We were able to track all three signals of SVN62 — which is still set unhealthy — using different commercial receiv-ers as well as an implemented software receiver.
The carrier-to-noise ratio of SVN62’s L1 signal slightly outperforms all other existing GPS satellites. A notable amount of distortion is visible at the L5 I/Q scat-ter plot that will be analyzed further. Detailed measurements and analyses of SVN62 have to be conducted after the satellite has run through extensive in-orbit tests and is set healthy.
authorsStefan Erkerreceivedhisdiplomadegreeincom-municationtechnologyattheTechnicalUniver-sityofKaiserslautern,Germany. In 2007 hejoinedtheInstituteof
CommunicationsandNavigationoftheGermanAerospaceCenter(DLR)atOberpfaffenhofen.HemainlyworksonthetopicsofGNSSverificationandcorrespondingsignalanalysis.
Steffen Thoelertreceivedhisdiplomadegree inelectricalengineeringwithfieldsofexpertiseinhigh-frequencyengi-neeringandcommunica-tionsattheUniversityof
Magdeburg,Germany.Thenextfouryearsheworkedonthedevelopmentofpassiveradarsys-temsattheMicrowavesandRadarInstituteattheGermanAerospaceCentre(DLR)andin2006changedtotheDLR’sDepartmentofNavigation,InstituteofCommunicationsandNavigation.NowheisworkingwithinthetopicsofGNSSverificationandsystemcalibration.
Michael Meurer, Ph.D.,istheheadoftheDepart-mentofNavigationoftheGermanAerospaceCenter(DLR),InstituteforCommunicationsandNavigation, and the
coordinatingdirectoroftheDLRCenterofExcel-lenceforSatelliteNavigation.HereceivedthediplomaandPh.D.degreesinelectricalengineer-
ingfromtheUniversityofKaiserslautern,Ger-many.Since2005hehasbeenanassociatepro-fessor(PD)atthesameuniversity.HiscurrentresearchinterestsincludeGNSSsignals,GNSSreceivers,interferencemitigation,andnavigationforsafety-criticalapplications.
Note: The biographies for the Stanford Univer-sity co-authors can be found at the end of the following article on page 45.