on testing based on restricted mean survival time for time...
TRANSCRIPT

On testing based on restricted
mean survival time for time-to-
event outcomes
1
Hajime Uno, PhDDana-Farber Cancer Institute
Harvard Medical School
Joint work with
Miki Horiguchi
(Kitasato University, Tokyo)
Annual Conference of the ISCB at Vigo, Spain (Jul 10, 2017)

Consider• Randomized clinical trial to compare
two groups
• time-to-event outcome is the primary
endpoint
Setting
2

• Testing equality of the two event time
distributions (Test)
• Estimating magnitude of the treatment
effect (0.95CI for a primary summary
measure)
What we need to do…
3
ex. “The survival benefit of this
drug is highly significant!!”
Important information for decision-making

Test-estimation coherency
4
CI of the treatment
effect excludes the null
value (e.g, HR=1)
Example of test-estimation coherency
Test: Logrank test
Estimation of the treatment effect:
Cox’s estimator (Hazard ratio)
Test result is SIG
Testing Estimation
Test result is NS Includes the null value

• Issues of the conventional practices
• Alternatives and challenge
• Restricted mean survival time (RMST)
based versatile test
• Application
• Numerical studies
• Conclusions
Outline
5

A conventional practice
Description TestEstimation
of treatment effect
Kaplan-Meier Logrank test HR by Cox PH
6

However, the proportional hazards (PH)
assumption does not always hold in practice,
which raises some problems7
“logrank-HR” test-estimation practice
Logrank test is• the most powerful nonparametric test in PH
• equivalent to the score test for testing HR
equals 1 via the Cox’s model
(test-estimation coherency)
A conventional practice
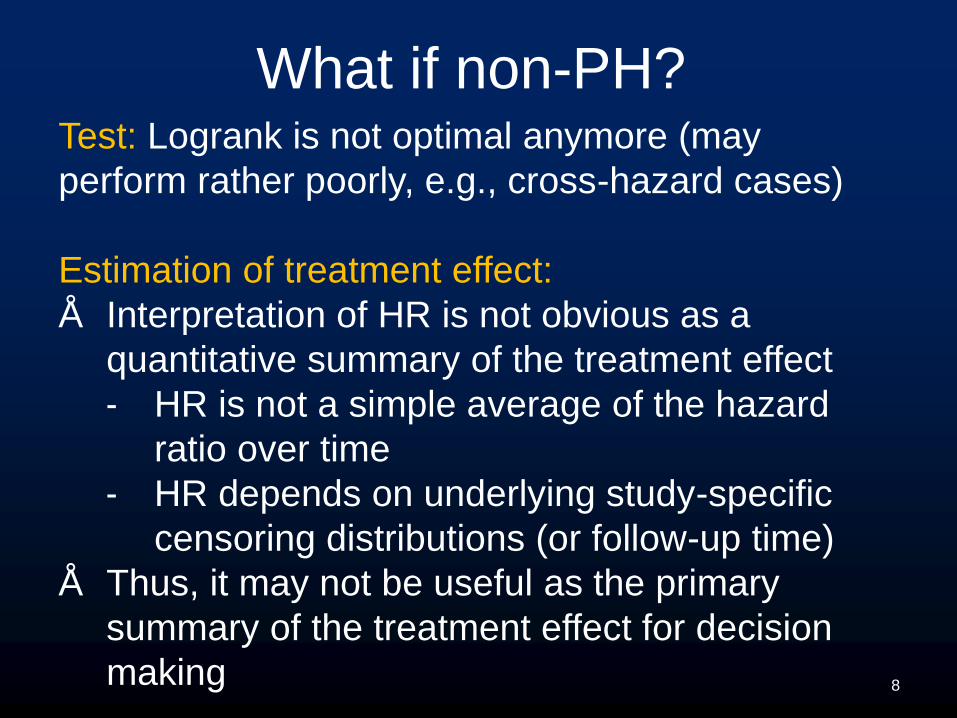
What if non-PH?Test: Logrank is not optimal anymore (may
perform rather poorly, e.g., cross-hazard cases)
Estimation of treatment effect:
• Interpretation of HR is not obvious as a
quantitative summary of the treatment effect
- HR is not a simple average of the hazard
ratio over time
- HR depends on underlying study-specific
censoring distributions (or follow-up time)
• Thus, it may not be useful as the primary
summary of the treatment effect for decision
making 8

Test• Another member of the weighted logrank
tests (e.g., Wilcoxon test) is often chosen
Estimation of treatment effect• Difference in median survival time (without
CI) is often reported as the quantitative
information of treatment effect
A conventional practice when non-PH
This conventional practice can also
be problematic sometimes!

Metastatic breast cancer example
• N=371 (182 on exemestane, 189 on tamoxifen)
• The primary endpoint was PFS
Paridaens et al. (2008, JCO)
10

Figure 2, Paridaens et al. (2008, JCO)“The 4.1-month difference in median PFS between
treatment arms was statistically significant using the
Wilcoxon test (P = .028)” Paridaens et al. (2008, JCO)
This is not a correct statement statistically
Metastatic breast cancer example
Median: 9.9m vs. 5.8m
Non-PH

How does the conventional
design and analysis fail?
12

13
Design
stage
median PFS10.0 mon
7.14 mon
Pattern of difference PH
HR 0.78
Number of events 278
sample size 342
The primary test logrank
Paridaens et al. (2008, JCO)
Metastatic breast cancer example

14
Design
stage
It turned
out
median PFS10.0 mon
7.14 mon
9.9 mon
5.8 mon
Pattern of difference PH Non-PH
HR 0.78 0.84 ?
Number of events 278 319
sample size 342 371
The primary test logrank p=0.121
Paridaens et al. (2008, JCO)
Metastatic breast cancer example

15
• Power depends on the underlying true
difference between the two survival
functions
• No or little information is usually available
at design stage
Why did this happen?
Failed to guess the pattern of the difference
This is a common challenge in many clinical trials

16
Solution and problem
• Versatile tests can capture various patterns of
difference between two survival curves
Examples:
- Max/liner comb of weighted logrank tests
(e.g., Tarone (1981))
- Adaptively weighted logrank test (Yang and
Prentice, 2010)
- Adaptively weighted KM-based test (Uno et
al. 2015)
- Min of logrank p-val and RMST permutation
test p-val (Royston and Parmer 2016)

17
Solution and problem
• However, a problem with most of the
versatile tests is that test-estimation
coherency will be a challenge
Proposal
RMST-based versatile test
18

Restricted Mean Survival Time (RMST)
19
= E min , =
= 24 monExemestane Tamoxifen
11.5 mon 10.0 mon

= −
robust, clinically interpretable, and model-free
summary measure
Standard RMST-based test
Difference in RMST
20
• using a pre-specified fixed
• based on the test statistic, ( ) = ( )/ ( )
( ): standard error estimate of ( )

21
Proposed RMST-based versatile test
• Uses data-dependent
can detect various patterns of the difference
• Has companion quantification procedures
to provide a corresponding, robust,
clinically interpretable summary of the
treatment effect
test-estimation coherency

i. Instead of choosing a fixed , we consider a
set of 𝜏𝜏, 𝜏 = {𝜏, 𝜏, …, 𝜏}
ii. For each 𝜏 , we can calculate the test statistic, 𝜏 𝜏 =
𝜏(𝜏)/
𝜏(𝜏)
iii. The test statistic is then obtained as
𝜏 = max𝜏(𝜏) (one-sided)
𝜏 = max |𝜏 𝜏 | (two-sided)
iv. The null distribution of 𝜏 can be derived
via a perturbation-resampling procedure
Details of the proposed test
22

Application
23

Metastatic breast cancer example
RMST-based versatile test
𝜏 {2, 4, 6, …, 24} mon
Selected 𝜏 10 mon
P-value P=0.010
Difference (10 mon) 1.05 (0.95CI, 0.14 to 1.96) mon
Ref.
0.95 simultaneous confidence band

Numerical studies
1. Metastatic breast cancer example
2. Another cancer example (RAINBOW
study)
25

No difference Difference
observed in
EXEMESTANE
Metastatic breast cancer example
Event time distribution

• Test: two-sided
• Total study time: 24 months
• Time points for : = { , , , … , } (months)
• Sample size: N = 300 (per arm)
• The number of the perturbation-resampling: 5000
• The number of iterations: 2000
• Comparisons:
– Log-rank test
– Peto-Prentice-Wilcoxon test
– Standard RMST-based test ( = months) 27
Other parameters
Metastatic breast cancer example

PowerTest No
censoring
Light
censoring
Moderate
censoring
EXEM.
censoring
Logrank 0.568 0.572 0.587 0.560
Peto-Prentice Wilcoxon 0.809 0.815 0.812 0.820
Standard RMST 0.649 0.644 0.624 0.652
Versatile RMST 0.932 0.930 0.926 0.934
Results
Test No
censoring
Light
censoring
Moderate
censoring
EXEM.
censoring
Logrank 0.048 0.052 0.055 0.054
Peto-Prentice Wilcoxon 0.054 0.050 0.052 0.048
Standard RMST 0.053 0.053 0.051 0.055
Versatile RMST 0.056 0.048 0.047 0.051
Size (nominal 0.05)

• A phase III randomized trial to compare
ramucirumab + paclitaxel and placebo + paclitaxel
for advanced gastric cancer.
• N=665 (330 on ramucirumab, 335 on placebo)
Wilke et al. (2014, Lancet)
29
Another cancer example (RAINBOW study)

Figure 2, Wilke et al. (2014, Lancet)
30
Overall Survival
The KM curves suggest that the PH assumption does
not hold (the cumulative residual test, p=0.002)

• Test: two-sided
• Total study time: 21 months
• Time points for : = { , , , , , , } (months)
• Sample size: N = 300 (per arm)
• The number of the perturbation-resampling: 5000
• The number of iterations: 2000
• Comparisons:
– Log-rank test
– Peto-Prentice-Wilcoxon test
– Standard RMST-based test ( = months) 31
Other parameters
RAINBOW study

Power
Test No
censoring
Light
censoring
Moderate
censoring
RAINBOW
censoring
Logrank 0.435 0.467 0.497 0.586
Peto-Prentice Wilcoxon 0.870 0.875 0.872 0.893
Standard RMST 0.746 0.746 0.722 0.736
Versatile RMST 0.940 0.945 0.940 0.945
RAINBOW study
Results

• The empirical significance levels of all tests
are close to their nominal value of 0.05
• Although the proposed test is inferior to the
logrank test under PH alternatives by theory,
the proposed test is dramatically powerful for
the pattern of the difference seen in those
cancer clinical trials
33
Summary of numerical studies

Conclusions
34

Conclusions
• Several practical issues arise from the
conventional design and analysis using the
“logrank-HR” test-estimation practice
• The RMST-based versatile test is
– a model-free, pre-specified test, and
– dramatically powerful for patterns of difference
seen in some recent cancer clinical trials
• It also provides corresponding robust and
interpretable quantitative information of the
treatment effect (test-estimation coherency)35

END
36

37
References Uno H, Claggett B, Tian L, et al. Moving Beyond the Hazard Ratio in Quantifying the
Between-Group Difference in Survival Analysis. J Clin Oncol 2014; 32: 2380-2385.
Uno H, Wittes J, Fu H, et al. Alternatives to Hazard Ratio for Comparing the
Efficacy or Safety of Therapies in Noninferiority Studies. Ann Intern Med Jul 2015;
163(2): 127-34.
Miller. Survival Analysis. Wiley 1981.
Tian et al. Predicting the restricted mean event time with the subject's baseline
covariates in survival analysis. Biostatistics 2014; 15: 222-233.
Uno et al. A versatile test for equality of two survival functions based on weighted
differences of Kaplan–Meier curves. Statist. Med. 2015; 34: 3680-3695.
Royston P, Parmar MKB. The use of restricted mean survival time to estimate the
treatment effect in randomized clinical trials when the proportional hazards
assumption is in doubt. Stat Med 2011; 30: 2409-2421.
Royston P, Parmar MKB. Restricted mean survival time: an alternative to the
hazard ratio for the design and analysis of randomized trials with a time-to-event
outcome. BMC Med Res Methodol 2013; 13: 152.
Royston P, Parmar MKB. Augmenting the logrank test in the design of clinical trials
in which non-proportional hazards of the treatment effect may be anticipated. BMC
Med Res Methodol 2016; 16: 16.

38
References Guyot P, Ades AE, Ouwens MJ, et al. Enhanced secondary analysis of survival
data: Reconstructing the data from published Kaplan-Meier survival curves. BMC
Med Res Methodol 2012; 12: 9.
Rajkumar et al. Lenalidomide plus high-dose dexamethasone versus lenalidomide
plus low-dose dexamethasone as initial therapy for newly diagnosed multiple
myeloma: an open-label randomised controlled trial. Lancet Oncol 2010; 11: 29–37.
Paridaens et al. Phase III Study Comparing Exemestane With Tamoxifen As First-
Line Hormonal Treatment of Metastatic Breast Cancer in Postmenopausal Women:
The European Organisation for Research and Treatment of Cancer Breast Cancer
Cooperative Group. JCO 2008; 26: 4883-4890.
Wilke et al. Ramucirumab plus paclitaxel versus placebo plus paclitaxel in patients
with previously treated advanced gastric or gastro-oesophageal junction
adenocarcinoma (RAINBOW): a double-blind, randomised phase 3 trial. Lancet
Oncol 2014; 15: 1224–35.
Zhao et al. On the Restricted Mean Survival Time Curve in Survival Analysis.
Biometrics 2016; 72: 215–221.