on some prospects of the loft mission institute of physics, silesian university in opava...
TRANSCRIPT
On some prospects of the LOFT mission
Institute of Physics, Silesian University in OpavaAstronomical Institute, Prague
Gabriel Török, Pavel Bakala, Vladimír Karas, Michal Dovčiak, Martin Wildner, Dalibor Wzientek
CZ.1.07/2.3.00/20.0071 Synergy , GAČR 209/12/P740, 202/09/0772, SGS-01-2010, www.physics.cz

• density comparable to the Sun• mass in units of solar masses• temperature ~ roughly as the T Sun• more or less optical wavelengths
MOTIVATION
Companion:
Compact object:- black hole or neutron star (>10^10gcm^3)
>90% of radiation in X-ray
LMXB Accretion disc
Observations: The X-ray radiation is absorbed by the Earth atmosphere and must be studied using detectors on orbiting satellites representing rather expensive research tool. On the other hand, it provides a unique chance to probe effects in the strong-gravity-field region (GM/r~c^2) and test extremal implications of General relativity (or other theories).
T ~ 10^6K
Figs: space-art, nasa.gov
1. Introduction
LMXBs
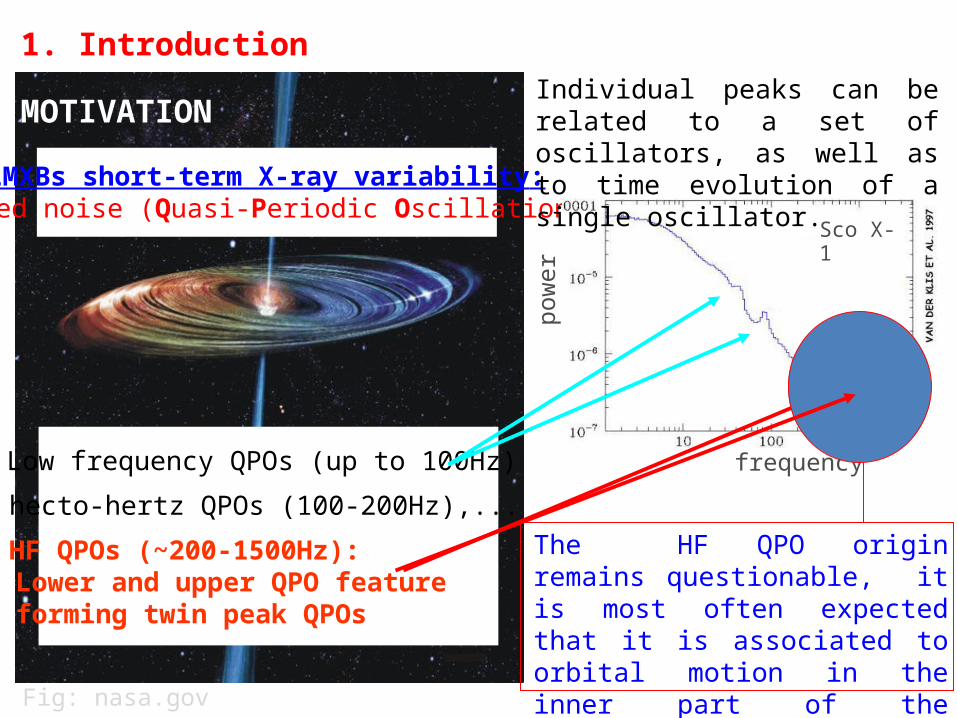
Fig: nasa.gov
LMXBs short-term X-ray variability:peaked noise (Quasi-Periodic Oscillations)
• Low frequency QPOs (up to 100Hz)• hecto-hertz QPOs (100-200Hz),...• HF QPOs (~200-1500Hz): Lower and upper QPO feature forming twin peak QPOs
frequency
pow
er
Sco X-1
The HF QPO origin remains questionable, it is most often expected that it is associated to orbital motion in the inner part of the accretion disc.
Individual peaks can be related to a set of oscillators, as well as to time evolution of a single oscillator.
1. Introduction
MOTIVATION
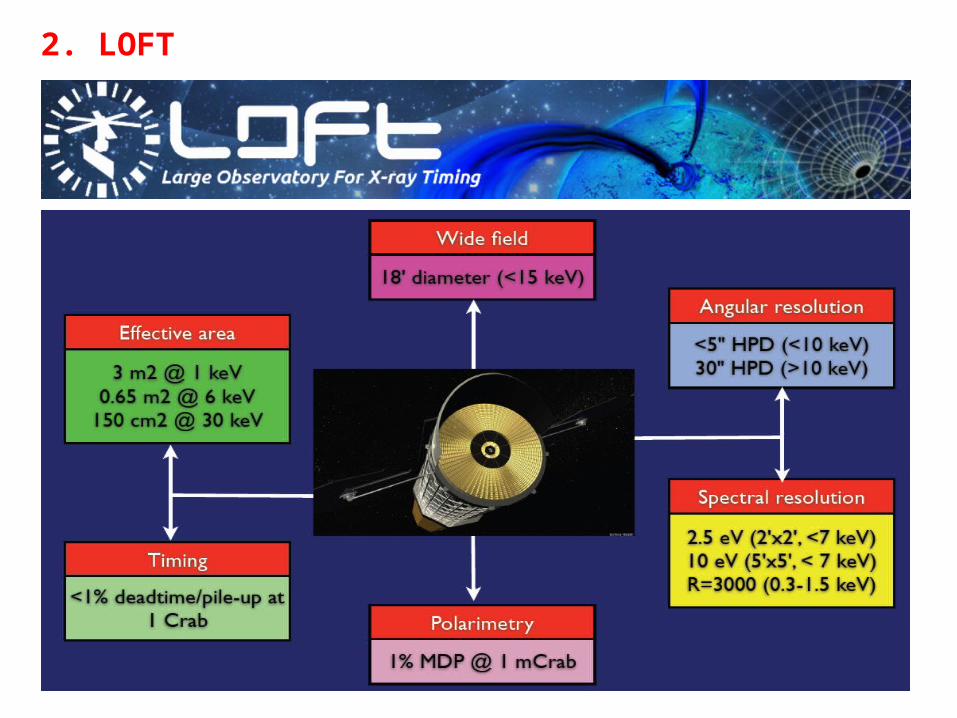
2. LOFT
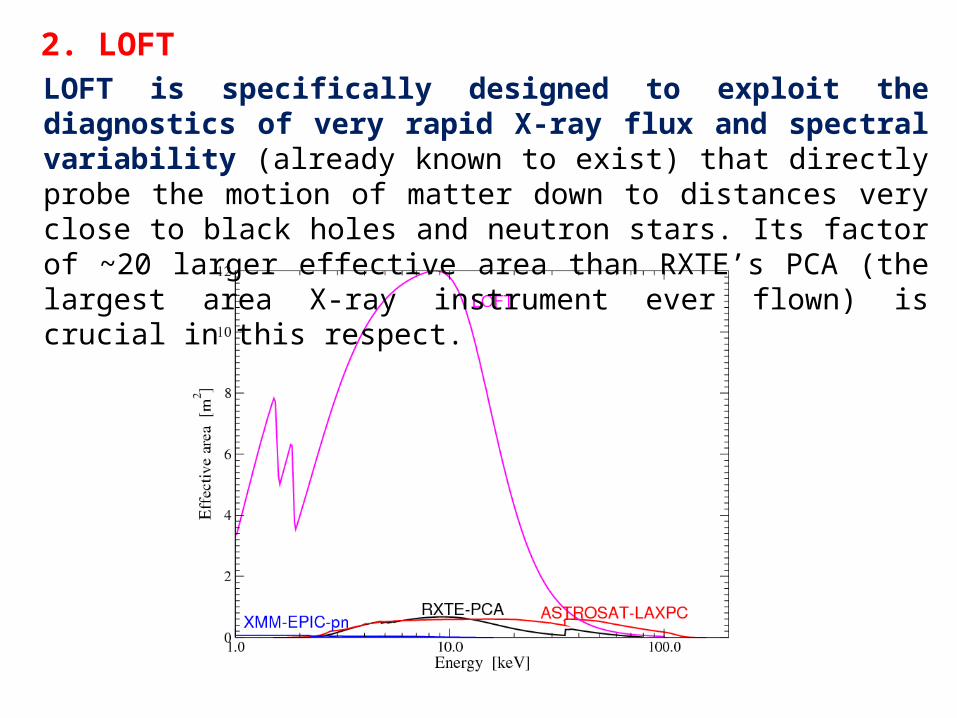
2. LOFTLOFT is specifically designed to exploit the diagnostics of very rapid X-ray flux and spectral variability (already known to exist) that directly probe the motion of matter down to distances very close to black holes and neutron stars. Its factor of ~20 larger effective area than RXTE’s PCA (the largest area X-ray instrument ever flown) is crucial in this respect.
(from LOFT webpage)
2. LOFTLOFT/LAD’s much improved energy resolution (better than 260 eV) compared to that of RXTE/PCA will also allow the simultaneous exploitation of spectral diagnostics, in particular the relativistically broadened 6-7 keV Fe-K lines. The timescales that LOFT will investigate range from submillisecond quasi-periodic oscillations (QPOs) to years long transient outbursts. LOFT is required to answer two fundamental questions of ESA's Cosmic Vision Theme Matter under extreme conditions:
• Does matter orbiting close to the event horizon follow the predictions of general relativity?
• What is the equation of state of matter in neutron stars?
(from LOFT webpage)

3. LOFT & QPO Models (SFG1 Group Goals)
(Several of) Competing models variously identify observed QPOs with the relativistic radial and vertical epicyclic frequencies or relativistic nodal and periastron precession. Very high-signal-to-noise LOFT/LAD measurements of the QPOs will unambiguously discriminate between such interpretations and in the process tease out yet untested general relativistic effects such as frame dragging, strong-field periastron precession, and the presence of an innermost stable orbit. Crucially, LOFT will provide access for the first time to types of information in these signals that are qualitatively new due to the capability to measure dynamical timescale phenomena within their coherence time, where so far only statistical averages of signals were accessible. This will allow studies that directly witness QPO formation and propagation and tie in with what state-of-the-art numerical work is just beginning to address.
(from LOFT webpage)
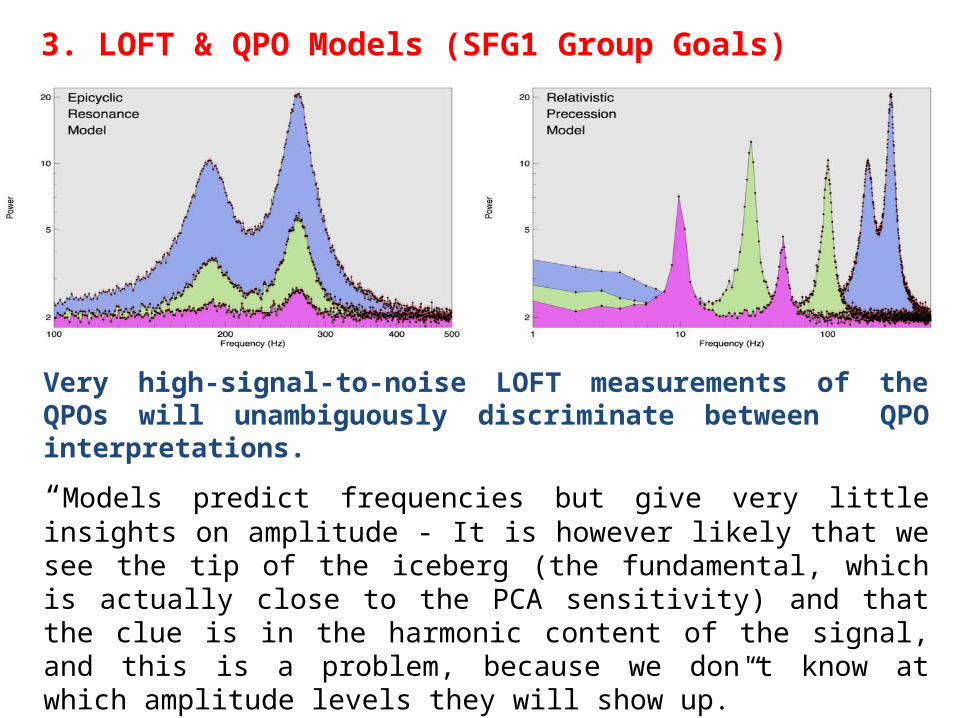
Very high-signal-to-noise LOFT measurements of the QPOs will unambiguously discriminate between QPO interpretations.
“Models predict frequencies but give very little insights on amplitude - It is however likely that we see the tip of the iceberg (the fundamental, which is actually close to the PCA sensitivity) and that the clue is in the harmonic content of the signal, and this is a problem, because we don't know at which amplitude levels they will show up.”
(from SFG1 materials)
3. LOFT & QPO Models (SFG1 Group Goals)
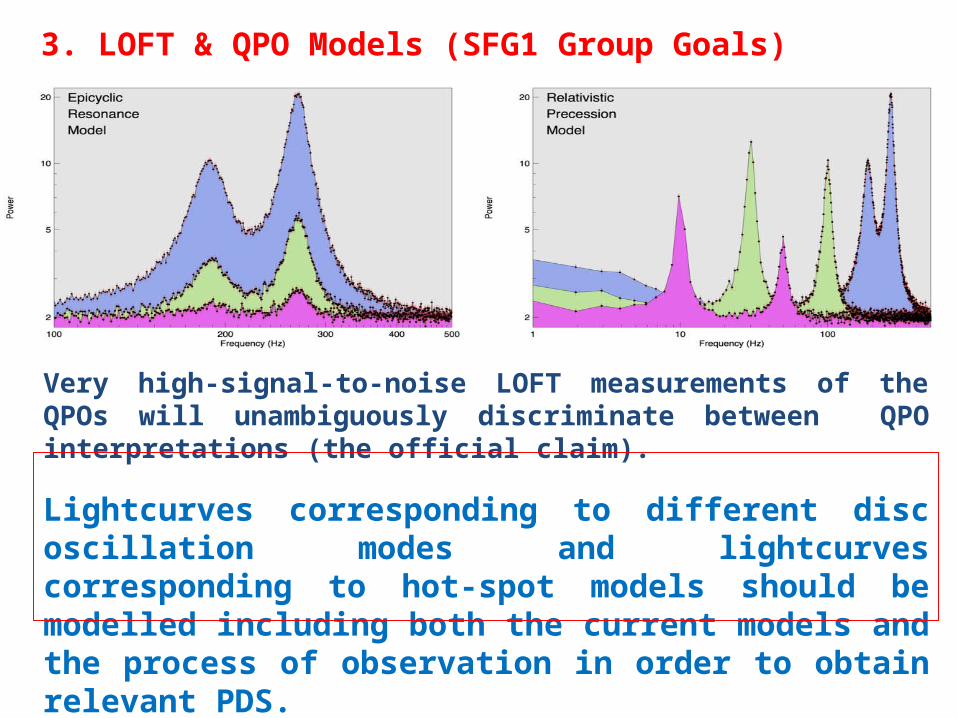
Very high-signal-to-noise LOFT measurements of the QPOs will unambiguously discriminate between QPO interpretations (the official claim).
Lightcurves corresponding to different disc oscillation modes and lightcurves corresponding to hot-spot models should be modelled including both the current models and the process of observation in order to obtain relevant PDS.
3. LOFT & QPO Models (SFG1 Group Goals)
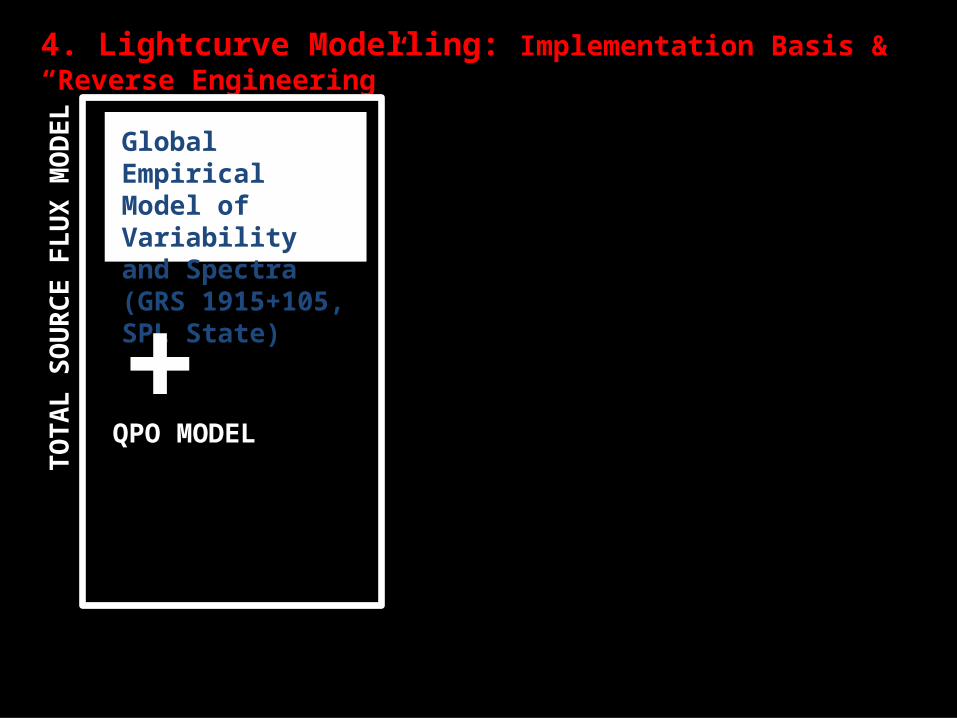
4. Lightcurve Modelling: Implementation Basis & “Reverse Engineering”
Global EmpiricalModel of Variabilityand Spectra (GRS 1915+105, SPL State)
+QPO MODELTO
TAL
SOU
RCE
FLU
X M
OD
EL

4. Lightcurve Modelling: Implementation Basis & “Reverse Engineering”
Global EmpiricalModel of Variabilityand Spectra (GRS 1915+105, SPL State)
+
TOTA
L SO
URC
E FL
UX
MO
DEL
QPO MODEL

4. Lightcurve Modelling: Implementation Basis & “Reverse Engineering”
Global EmpiricalModel of Variabilityand Spectra (GRS 1915+105, SPL State)
Response Matrices(Detector)
“DATA” Time and Spectral Distributionof Detected Counts
TIMINGANALYSIS
RESULTS
TOTA
L SO
URC
E FL
UX
MO
DEL
+QPO MODEL
5. Some Results
Frequency Frequency
Frequency
Pow
erPo
wer
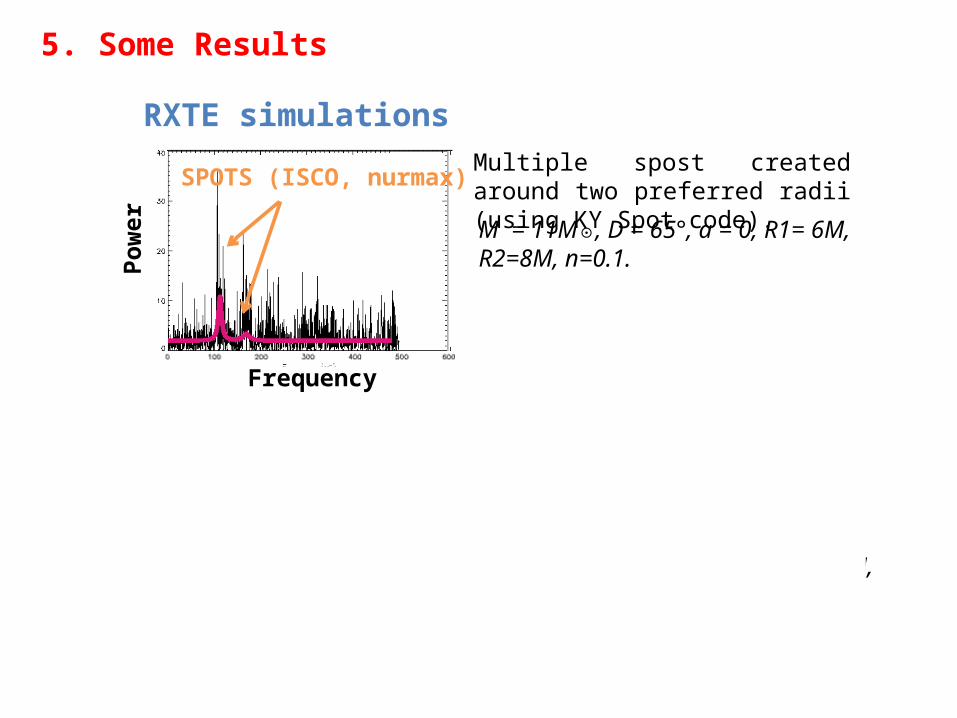
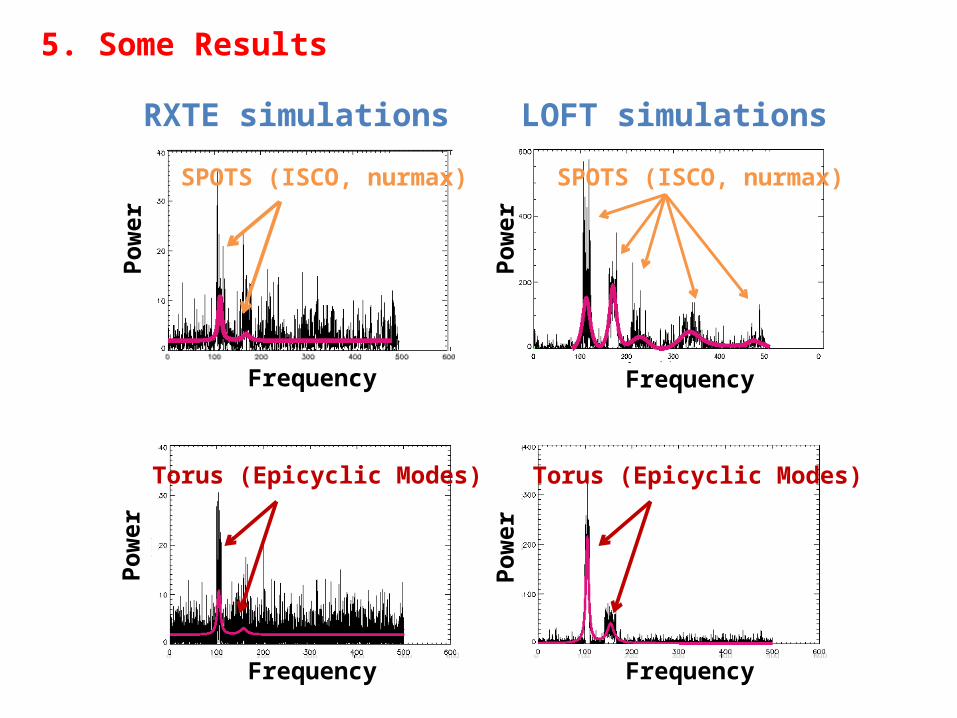
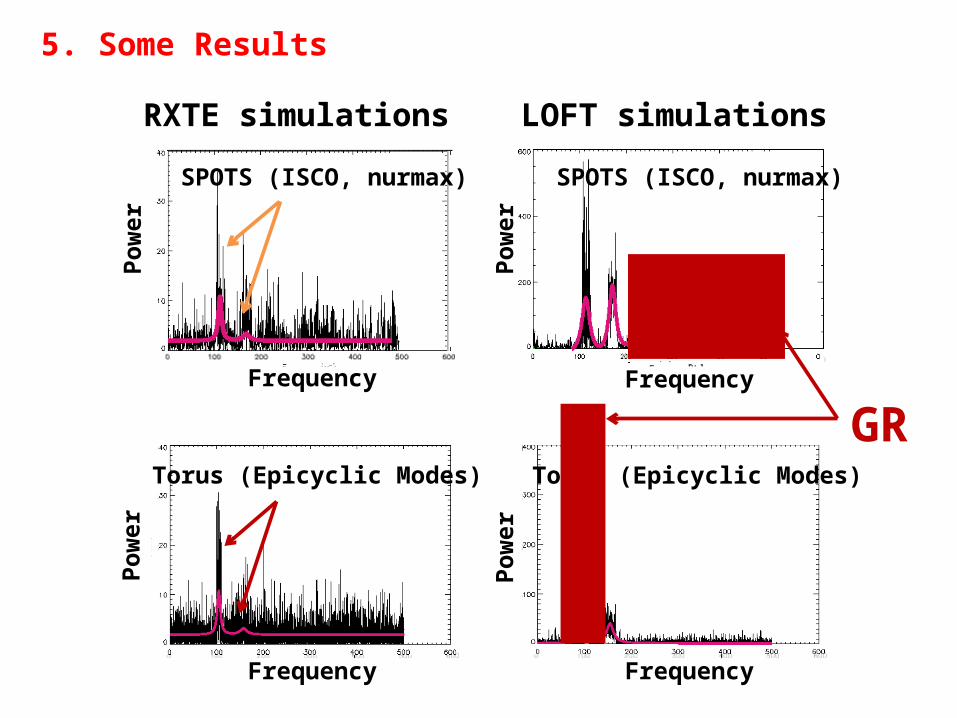
RXTE simulations LOFT simulations
Torus (Epicyclic Modes)
SPOTS (ISCO, nurmax)Multiple spost created around two preferred radii (using KY Spot code).
The m=0 epicyclic oscillations of the optically thin torus drifting through the resonant radius.
M = 11M⊙, D = 65°, a = 0, R1= 6M,R2=8M, n=0.1.
M = 5.6M⊙, D = 65°, a = 0, R0= 10.8M,n=0.1.
Pow
er
Torus (Epicyclic Modes)
Frequency
Pow
er
SPOTS (ISCO, nurmax)

5. Some Results
Frequency
Frequency
Pow
er
RXTE simulations LOFT simulations
Torus (Epicyclic Modes)
SPOTS (ISCO, nurmax)Multiple spost created around two preferred radii (using KY Spot code).
The m=0 epicyclic oscillations of the optically thin torus drifting through the resonant radius.
M = 11M⊙, D = 65°, a = 0, R1= 6M,R2=8M, n=0.1.
M = 5.6M⊙, D = 65°, a = 0, R0= 10.8M,n=0.1.
Frequency
Frequency
Pow
er
Torus (Epicyclic Modes)
Pow
er
SPOTS (ISCO, nurmax)
5. Some Results
RXTE simulations LOFT simulations
Frequency
Frequency
Pow
erPo
wer
Torus (Epicyclic Modes)
SPOTS (ISCO, nurmax)
Frequency
Frequency
Pow
er
Torus (Epicyclic Modes)
Pow
er
SPOTS (ISCO, nurmax)
5. Some Results
RXTE simulations LOFT simulations
GRPo
wer
Pow
er
Frequency
Frequency
Torus (Epicyclic Modes)
SPOTS (ISCO, nurmax)
Frequency
Frequency
Pow
er
Torus (Epicyclic Modes)
Pow
er
SPOTS (ISCO, nurmax)

END
Thank you for your attention…